
Abstract
This multiple case study examines the extent and ways in which leaders and administrators in Florida College System (FCS) institutions engage in distributed leadership through data sharing with frontline staff. Based on focus groups and individual interviews with administrators, faculty, and staff (659 participants) from 21 state colleges, we found a continuum of three data cultures ranging from democratic data cultures to blended data cultures to “need to know” data cultures. We triangulate these results with survey data from FCS institutional leaders and find considerable variation in the extent of data sharing and perceptions of effectiveness of institutional data use. Institutions with democratic data cultures tended to have distributed leadership that encouraged information sharing and collaboration among staff to use data to inform change. Need-to-know institutions faced challenges, including weak data quality, concerns about adequate time and resources among staff for reviewing data, and perceptions that staff lack data literacy skills.
Keywords
Among the most pressing problems in community colleges nationally has been the need to improve student outcomes in a higher education sector that serves 10 million students annually yet graduates less than 40% of these students within 6 years (Bailey et al., 2015). In response, many reform efforts have been enacted to target at opportunity structures (e.g., performance-based funding and articulation agreements), institutional practices (e.g., career pathways and learning communities), and students (e.g., early assessment programs and performance-based scholarships; Goldrick-Rab, 2010). One commonality among all these postsecondary reforms is reliance on data to track student progress and assess program or policy effectiveness. These efforts have been furthered by extensive investments from state and federal governments in developing comprehensive data systems linking K–12 and higher education, which have been lauded for their potential to drive research that will promote innovation (Blume et al., 2014), enhance accountability (Ewell, 2011), and lead to improvements in student outcomes such as the reduction of income-based attainment gaps (Papay et al., 2015). Yet several studies in recent years have begun to question the empirical link between data practices and improved student outcomes and experiences (Banta & Blaich, 2011; Cox et al., 2017; Hamilton et al., 2009; Marsh et al., 2006; Tandberg & Hillman, 2013).
One reason for the possible disconnect between data-driven decision making and student outcomes has been that data practices have been poorly implemented in higher education institutions (Cox et al., 2017). Several issues related to poor implementation have been proposed. First, scholars have questioned the quality of institutional data in higher education, particularly self-reported data and information from students (Adams & Umbach, 2012; Chen, 2011; Sax et al., 2003). Also, leaders may not involve employees at all organization levels in data practices because frontline academic employees often lack the time, resources, and understanding of data to effectively utilize data in everyday practice (Blaich & Wise, 2011; Bresciani et al., 2009). That is, while frontline staff may be the best positioned to “move metrics” by improving educational practices that directly affect students, they may also be the furthest removed from the data held by academic administrators and institutional effectiveness offices that could help them improve practice.
Problems related to inadequate data use may be attributed to a lack of staff interaction or collective decision making. Therefore, we ground our study in “distributed leadership” (Spillane et al., 2004), which considers the interactions of leaders and their followers in specific institutional contexts. For this study, “staff” are frontline academic employees who interact directly with students including faculty, advisors, and academic support personnel, while “administrators” are those in leadership positions such as deans, directors, and presidents. We use qualitative data from focus groups and interviews with 659 administrators and staff at 18 Florida College System (FCS) institutions, which is supplemented with data from a statewide survey of FCS lead administrators. These data were collected during implementation of a statewide developmental education (DE) reform under Senate Bill 1720, which made the majority of students exempt from placement testing and DE courses. Prior to the reform, incoming community college students who scored below college-ready on a placement test were required to complete up to two semesters of DE courses in math and/or English before enrolling in college-level courses. The reform required institutions to make significant changes to instructional strategies in DE courses, advising, and student support services (see online Supplemental Appendix A). Additionally, the legislation required institutions to develop plans to collect data and evaluate their effectiveness. Due to the legislation’s implications for leadership as well as the data reporting requirements, leadership and data practices emerged as prominent themes in our qualitative data.
The purpose of this study is to examine how data sharing among leaders and frontline staff has (or has not) occurred in the FCS. The research questions include the following:
How did administrators in FCS institutions engage in distributed leadership through data sharing with frontline staff?
What patterns of data sharing have emerged in FCS institutions?
What are the perceptions of FCS administrators and staff of their institutional data use culture?
Overall, we found considerable variation across institutions in the extent to which frontline staff were engaged in data sharing. Even within a single institution, there were often differences between administrators and staff in perceptions of the accessibility of data. We identified a continuum of three data-sharing patterns ranging from democratic data cultures to blended data cultures to “need to know” data cultures. The results suggest that some institutions were able to get the data to the right people who were able to use it to inform change, while other institutions struggled to act on the data. We conclude by considering implications for institutional leaders and directions for future research.
Literature Review
The purpose of community colleges’ internal data collection and analysis processes are to measure institutional effectiveness at meeting goals stated in the mission (Ewell, 2011; Nevarez & Wood, 2010). Achievement of these goals depends, in part, on the quality of data that measure institutional and student performance (Nevarez & Wood, 2010). Therefore, one important role of community colleges’ leaders is to foster a culture of evidence that uses the best available data to support institutional decision making by administrators and effective educational practices by frontline staff. Goomas and Isbell (2015) describe the process of building a culture of evidence as “using data to understand where students are experiencing problems, designing strategies for remedying those problems, implementing them, and then evaluating the effectiveness of those implemented strategies” (p. 489).
However, community colleges’ open access missions and limited resources make this especially challenging when serving several broad goals, including general education, basic skills, workforce development, preparation for university transfer, and community outreach (Cohen & Brawer, 2003; Nevarez & Wood, 2010). Consequently, the broad mission of community colleges has produced a proliferation of possible indicators, including basic academic skills, persistence, learning, time to degree, graduation rates, job placement rates, employer assessments of graduates, licensure pass rates, civic engagement, transfer rates, student satisfaction rates, and community outreach measures (Alfred et al., 2007; Mullin, 2012; Riley et al., 2016).
Alfred et al. (2007) argue that three external factors are driving the need for better data practices in community colleges: (1) meeting the needs of an increasingly diverse student body, (2) greater competition from the largely unregulated for-profit sector, and (3) the accountability movement, which has driven the overall need for better data to document performance. Regardless of whether the empirical evidence suggests that data-driven decision making impacts students outcomes in meaningful ways, the momentum of the accountability movement and increasing accreditation standards ensure that pressures on colleges to document performance through metrics will be a fixture of the U.S. higher education system for the foreseeable future (Cox et al., 2017).
Research suggests that administrators and frontline staff have differing perceptions of data use. Skolits and Graybeal (2007), for example, found that administrators and staff in community colleges differ in how knowledgeable each is about data, how much each participates in data practices, and their perceptions of usefulness of data in improving education practices. In a two-institution study, Goomas and Isbell (2015) found the biggest barrier to meaningful improvements in academic programs and student outcomes was the lack of institution-wide standardized data due to multiple departments recording data inconsistently into multiple disconnected data systems. Community college leaders can play an important role in helping institutions overcome these challenges to effective data use. Yet there is a need to help these leaders cultivate data analysis competencies, particularly given the “crisis” in the community college leadership pipeline as many experienced administrators have entered retirement (Friedel, 2010).
Theoretical Perspectives
This study employs two complementary perspectives, which have been infrequently featured in the higher education literature: the concept of information sharing within organizations and the model of distributed leadership. Our synthesis of these frameworks makes a unique contribution, as data sharing is not often featured in research that uses distributed leadership as a conceptual lens. Yet together these frameworks help provide a more complete understanding of institutional data cultures and practices.
Sharing information (in this case, data) can be defined as “the process by which knowledge held by an individual is converted into a form that can be understood, absorbed, and used by other individuals” (Ipe, 2003, p. 341). There has been a growing emphasis in higher education on the importance of efforts to improve student outcomes by using data to inform changes in institutional practice. For example, Achieving the Dream stresses the importance of building a “culture of evidence” to improve student success (Brock et al., 2007). College leaders have invested substantial funds in information systems that make it possible to share data broadly. Yet there have been few studies to date on the extent to which data are shared with and used by frontline college faculty and staff.
The extent of data sharing depends on the nature of the data, opportunities to share data, institutional norms and policies, and employee characteristics such as prosocial or self-interested attitudes (Constant et al., 1994; Ipe, 2003). Data sharing is generally considered prosocial behavior that is good for organizations because it increases “organizational efficiency, learning, innovation, flexibility, and understanding of organizational goals” (Constant et al., 1994, p. 401) and fosters the creation of new knowledge and improved organizational performance (Bartol & Srivastava, 2002). Despite these potential benefits, staff sometimes fail to share data because they lack the time, resources, or data literacy to share data in ways that improve organizational effectiveness (Blaich & Wise, 2011; Bresciani et al., 2009).
Moreover, in higher education where an individual’s worth is frequently tied to the extent of their knowledge, employees may adhere to the proverb that “knowledge is power” and withhold information because they believe it will increase their value to the organization (Alvesson, 1995; Empson, 2001; Ipe, 2003). Therefore, the manner in which information is withheld or shared can serve as a proximal indicator of how power is consolidated or dispersed throughout the organization. Accordingly, we examine institutions’ information sharing policies, practices, and perceptions by considering the extent to which each institution espouses tenants of distributed leadership.
Incorporating elements of “delegated,” “democratic,” “dispersed,” distributed,” “shared,” “collective,” and “emergent” leadership models (Bolden, 2011; Woods et al., 2004), distributed leadership challenges assumptions embedded in early “great man or woman” theories of leadership (e.g., Burns, 2003; Culbertson, 1988; Stogdill, 1974; Yukl, 1981). Whereas traditional theories consider leadership a quality held by individuals with particular positions, skills, or charisma, proponents of distributed leadership consider leadership embedded in sociocultural processes “distributed over leaders, followers, and their situation” (Spillane et al., 2004, p. 11). Distributed leadership is used to describe an environment in which emergent policies and practices allow semi-autonomous actors to develop a collective identity and pursue shared goals by dispersing leadership throughout the organization (Bolden et al., 2009; Jones et al. 2014).
As an analytic framework, distributed leadership encourages scholars to consider the interplay between an institution’s organizational, cultural, and social structures, as well as the individual/collective agency people have to shape those structures (Woods et al., 2004). Establishing distributed leadership requires formal leaders’ encouragement of involvement, institutional provision of supportive processes, professional development to assist shared leadership, resource provision to encourage collaboration, and the design of processes to support engagement (Jones et al., 2014).
Using the distributed leadership model as an interpretative lens for our analyses of information sharing prompts us to consider not only the extent to which participating institutions espouse information sharing policies and practices consistent with the principles of distributed leadership but also the manner in which those principles are (or are not) enacted by individuals and groups within the institution. Moreover, by comparing and contrasting information provided by stakeholders from multiple positions, our examination allows us to empirically examine Gosling et al.’s (2009) concern that institutions may adopt the language of distributed leadership, regardless of the accuracy of that claim, in ways that obscure the extent to which real power remains centralized among those in traditional leadership positions (e.g., senior administrators).
As Henderson and Powers (2018) note, At the core level, a data culture focuses on the use of information to make sound decisions that help an institution attain a competitive gain. It is not a focus on numbers, but rather on effective use of resources to make advantageous decisions. (p. 1)
The potential of data cultures to inform decision-making processes and influence outcomes provides a justification for the importance of developing different process-based cultural typologies, such as the ones in this study. These typologies may provide a base for subsequent studies exploring variance-based linkages between data usage practices and institutional outcomes (such as higher levels of innovation in practice) as well as student outcomes (like course passing rates).
Method
Addressing our research questions required triangulating data collected from different actors’ perspectives via multiple methods. Our study began in 2014 with semistructured focus groups conducted during 1 to 2-day site visits to 21 FCS institutions (with some repeat visits) over a 5-year period. Because “institutions” in this study refer to state colleges, some with multiple campuses, researchers visited a total of 33 campuses across the 21 institutions. For this study, we conducted 7 interviews with presidents of FCS institutions and 128 focus groups with 239 academic administrators, 284 faculty, 215 advisors, and 23 support staff (768 total participants). Then in Spring 2018, we conducted an initial overview of data practices using a statewide survey of FCS administrators. The survey was administered online with a single senior administrator from 19 of the 28 FCS institutions completing the survey (a response rate of 68%). Fifteen of these institutions also participated in the site visits, so even though the two samples are not exactly the same, there is considerable overlap. We examine the ways in which our survey and qualitative data converge or diverge to produce a fuller picture of data practices (Creswell & Plano Clark, 2011). We summarize our methods below and provide additional details (see online Supplemental Appendix A).
Data Analysis
Survey Data Analysis
The survey questions examined in this study include the frequency of reviews of data on student outcomes, the extent to which different types of staff are involved in reviewing data on student outcomes, and respondents’ perceptions of their institution’s data use processes (see online Supplemental Appendix B). We conducted comprehensive descriptive analyses of the survey data. The results were categorized into three main areas: frequency of review of data on student outcomes, level of involvement in reviewing data among various constituent groups, and perceptions of institutional data use practices. All these questions had closed-ended responses on a 5-point scale, such as strongly disagree (1) to strongly agree (5). We tabulated responses across the scale and created figures to present the results.
Focus Group Data Analysis
A multiple case study is particularly appropriate for this study because, following Yin’s (2018) case study research design, we examine social phenomena (data cultures and leadership) in their cultural context (FCS institutions), yet the phenomena and the context are closely linked. Case studies have frequently been combined in education research because both approaches have long historical traditions of conducting extended fieldwork with open-ended and semistructured interviews, combining participant (emic) and analyst (etic) perspectives, and incorporating quantitative data as a data source (Hammersley, 2006).
Because the focus of the larger project was state-level legislation in Florida that dramatically redesigned DE, the focus group and individual interview protocols included a broad range of questions related to the larger research project, which were revised annually over the 5-year period. Representative questions for administrators included, “How has college leadership played a role in making changes related to SB 1720?,” “What metrics will you look at to determine whether the DE redesign was successfully implemented on your campus?,” and “Can you share any preliminary or early outcomes?” Representative questions for faculty, advisors, and support staff included, “What are your perceptions of the leadership at this institution?,” “How do you interact with leaders, if at all?,” and “What outcome data is currently available to you?”
Our data analysis procedures for the case study consisted of five steps: (1) initial open coding of all data; (2) identification of coded qualitative data relevant to data-sharing practices and distributed leadership; (3) cross-case analysis to identify data practices, resulting in a continuum of three patterns that emerged; (4) cross-case analysis to further identify specific data practices characteristic of each of the three patterns; and (5) within-case analysis to group each of the institutions into one of three patterns (Stake, 1995; Yin, 2018). The initial coding was completed during the years in which the corresponding data were collected, and the subsequent stages followed sequentially after all data collection was completed. Later in the text, a table lists indicators differentiating data culture types. We categorized institutions by counting the number of times interview or focus group participants made statements like those in the aforementioned table. No institutions had focus group participants who followed purely democratic, blended, or need to know patterns. Instead, institutions were categorized in the following ways: (1) participants at the seven democratic institutions made democratic statements at least twice as frequently as “need to know” statements, (2) participants at the four blended institutions either made mostly blended statements or made roughly equal numbers of democratic and “need to know” statements, and (3) participants at the 10 need to know institutions made “need to know” statements at least twice as frequently as democratic statements. As an interpretive process whose aim was to establish similarities within the three groups and differences between the groups, democratic and need to know institutions were grouped using different ratios than blended institutions.
Researchers also wrote analytic memos throughout the research process (Corbin & Strauss, 2015). The trustworthiness of our qualitative interpretations was established through member checking, peer debriefing with three researchers who acted as “devil’s advocates” in questioning the study’s interpretations, and an intercoder-reliability process (Patton, 2015).
In the following section, we present the overall institutional data practices as reflected in the senior administrator survey and then present the three types of data-sharing culture that emerged from the analysis of the data.
Findings
Institutional Data Practices: Initial Observations From Senior Administrator Survey
The FCS administrator survey revealed substantial variation across institutions in data use and processes. High-level administrators were asked how frequently staff reviewed different types of data on student outcomes, including data on students taking DE courses, students not taking DE courses, and comparisons of outcomes among all students before and after the reform. For all three types of data, the mean ratings ranged between 2 and 3 on a 5-point scale, which corresponds to a value between “twice a year” and “three times a year” (Table 1). Yet there was considerable variation by institution, with some respondents indicating that data were reviewed less than once a year (minimum = 1) and others responding that data were reviewed more than four times a year (maximum = 5).
Frequency of Staff Review of Data on Student Outcomes
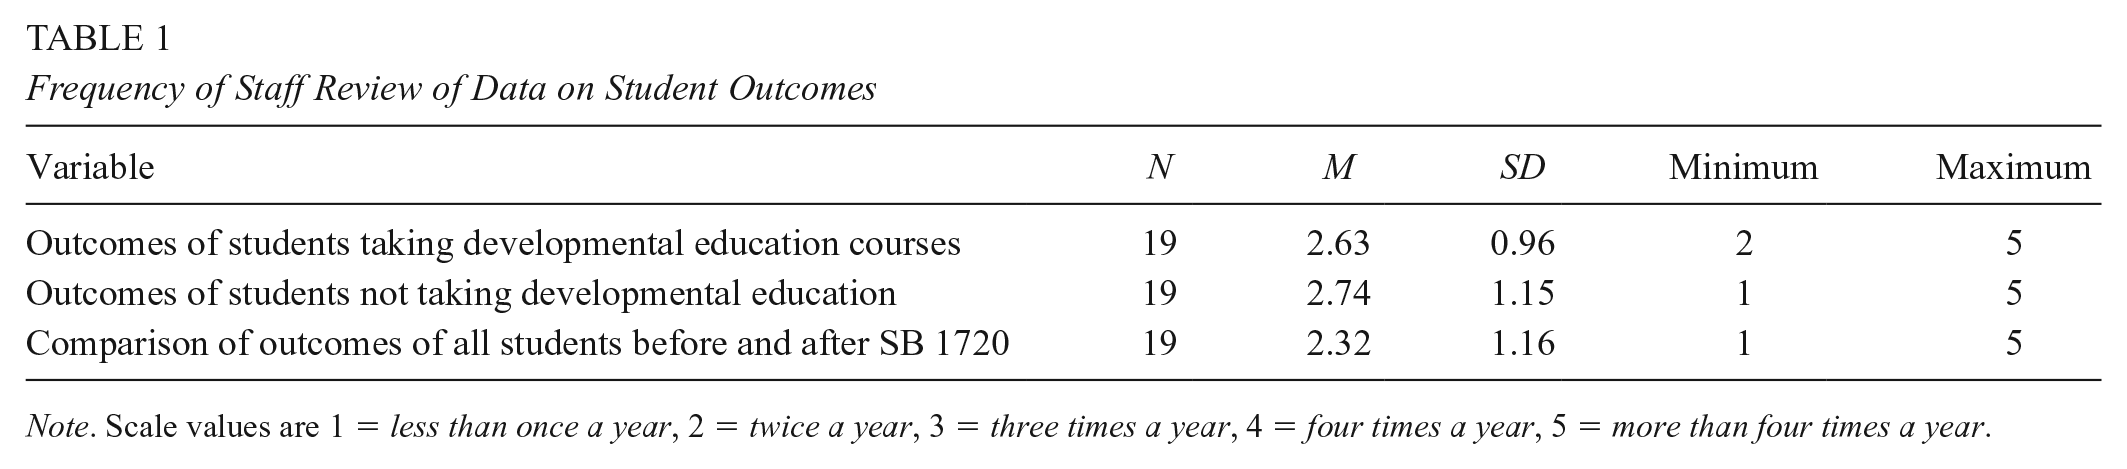
Note. Scale values are 1 = less than once a year, 2 = twice a year, 3 = three times a year, 4 = four times a year, 5 = more than four times a year.
Next, respondents reported the extent to which different types of staff are involved with reviewing and responding to data on student outcomes, ranging from not at all (1) to a great extent (5). Overall, the results indicate that staff in upper-level administrative positions tend to be more involved with reviewing data than those in lower-level staff positions. However, an interesting pattern emerges when the results are disaggregated by institution. Figure 1 includes a separate set of bars for each college showing the average involvement rating (on a 5-point scale) for (1) vice presidents (VPs) of academic and student affairs and (2) support staff in tutoring and advising. The difference between these two groups is shown in parentheses. The colleges at the top of the figure have large differences (between 2.0 and 2.5 on a 5-point scale) between the level of involvement for administrators and support staff. These institutions align with the “need to know” data culture in which access to data tends to be limited to those in senior administrative positions. The colleges in the middle have more moderate differences between the two groups (between 1.0 and 1.5 on a 5-point scale), indicating a more blended data culture. While senior administrators may have slightly greater involvement in data use, the support staff tend to be at least moderately involved. For the last three colleges, the level of involvement for support staff is the same as VPs, or even slightly greater. These institutions reflect a democratic data culture where staff throughout different levels of the organization are equally involved in data use.

Level of involvement in reviewing data among vice presidents of academic/student affairs and support staff in tutoring/advising (difference in parentheses); by college.
Figure 2 shows the results for the level of involvement in data use among DE chairs relative to DE instructors. Although these differences are not as great as those among VPs and support staff, a similar pattern emerges. While some institutions report that DE chairs are more involved in data use than DE instructors (with differences ranging from 1.0 to 2.0 on a 5-point scale), other institutions reported similar levels of involvement for both groups. Only one institution reported that DE instructors were more involved in reviewing data than DE chairs.

Level of involvement in reviewing data among DE chairs and DE instructors (difference in parentheses) by college.
Next, respondents were asked about the extent to which they agreed with various statements on institutional data use (see Table 2). All respondents agreed or strongly agreed that data on student outcomes that would be valuable to decision making is being collected (mean of 4.68 on a 5-point scale). Most also agreed that data on student outcomes drives institutional decisions (mean of 4.11). Yet the variation in the responses to the remaining questions demonstrates differences in data cultures among institutions. When asked if staff have adequate data literacy to interpret data on student outcomes, responses ranged from disagree (2) to strongly agree (5), with an average rating of 3.58. Thus, one reason why lower-level staff may have less involvement in data use at some institutions may be because senior administrators perceive that these staff are incapable of properly interpreting the data. Respondents also reported a range of responses from disagree (2) to strongly agree (5) when asked if there is data transparency where any interested staff have easy access to data on student outcomes.
Extent of Agreement With Statements on Institutional Data Use

Note. Scale values are 1 = strongly disagree, 2 = disagree, 3 = neutral, 4 = agree, 5 = strongly agree.
Collectively, these descriptive quantitative analyses suggest three things. First, FCS institutions appear to regularly collect and use data related to institutional performance and student outcomes—at least at the most senior levels of institutional administration. Second, FCS institutions vary widely with regard to the manner in which those data are shared or used by employees who interact directly with students. Third, the findings suggest that these data-related practices fall along a continuum, though Figures 1 and 2 hint that there may be natural groupings of institutions with distinct patterns of data sharing. Nonetheless, these initial findings must be considered more suggestive than absolute, as they are based on the reports of a single senior administrator at each institution. It is through the subsequent analyses of our more extensive qualitative data that we pursue more nuanced insights regarding the collection and use of data at these institutions while searching for descriptive patterns of institutional cultures that reflect the manner in which data are shared at each school. In doing so, we are able to critically assess, revise, and expand on the tentative conclusions derived from our initial quantitative analyses.
Three Types of Data Sharing Cultures
Our qualitative data confirmed the tentative conclusion from our quantitative analyses that, although senior leadership regularly espoused the use of data to inform institutional assessment and decision making, the distribution and use of these data by other college staff varied substantially in critical ways that created distinct patterns of data-sharing cultures at FCS institutions. Specifically, along an underlying continuum of data cultures there emerged three recognizable patterns around which institutions’ data cultures tended to cluster. These groupings are intended to reflect the predominant data culture in each institution, although there is some intersection of practices and these groupings are not mutually exclusive.
First, seven institutions had predominately democratic data cultures, in which institutional administrators emphasized data literacy among staff as well as transparency and diffusion of data both vertically and horizontally among units within the organization. Ten institutions were categorized as primarily need to know data cultures with access to data and data literacy largely confined to senior administrators. Between these two extremes were four institutions with blended data cultures, in which the degree of data literacy and diffusion among staff varied significantly across different institutional units.
In the most simplistic terms, these data cultures are made recognizable by their distinct patterns related to the three most prevalent themes that emerged from our qualitative coding procedures on the extent to which (1) data critical to improving practice are collected, (2) data are available to staff at all levels in the college, and (3) data are shared for staff to collaborate across units within the institution. Table 3 summarizes the most important indicators of each data culture, while Table 4 provides descriptive examples of characteristics typical of each type of culture.
Differentiating Indicators of Data Cultures Types

Descriptive Characteristics of Three Data Cultures in the Florida College System

Participants spoke the most about whether necessary data were being collected and whether those data were shared among staff across divisions and at all levels of the college. Administrators and staff at institutions reflecting elements of democratic data cultures spoke the most about data sharing and their thinking about how to leverage data trends to “move metrics.” Indeed, administrators and staff at democratic institutions were roughly equally likely to share examples of institutional data sharing. Administrators and staff at institutions with blended cultures explained that wide variation existed at their institutions between units and branch campuses in terms of how much data were shared, how quickly staff received data, and whether the data were reported in aggregate form so that critical comparisons could be made about staff members’ relative performance. Perceptions of data sharing at blended institutions were somewhat similar between administrators and staff but were dissimilar between units or campuses of the same institution. Some administrators at predominantly “need to know” institutions acknowledged a lack of data sharing, but staff at these institutions were more likely to report that the data they needed either were not collected, were collected unsystematically, or were not shared. Indeed, administrators represented approximately one fourth of participants who reported this concern in focus groups while nearly three fourths of focus group participants who shared this perspective were frontline staff.
Democratic State College: “We Actually Talk in Data”
We begin our in-depth case examples with the institution we are calling Democratic State College (DSC), which was among the one third of institutions in our sample categorized as having a primarily democratic data culture. A DCS administrator remarked about how data is a part of the institutional culture that permeates every facet of the college, “We have lots of data. The quantitative side. We have lots of quantitative data . . .” This administrator explained how central these data were to everyone’s job at the institution: The data informs what you do. So, I might look at the data and see a number going up or going down, but I have to understand why it’s going up or going down before I can make the decision what to do. . . . In our culture we’ve realized if we hold somebody’s feet to a fire on metrics, we won’t get anything done. It’s not till they own the process and own the metric and understand what the metric represents.
The administrator went on to explain that there is also a strong institutional commitment to data transparency: And because we’re so transparent and everything’s out in the open, it has no power. The data itself doesn’t have the power. It only has the power when only one person has it and they walk in a room and they share the number that nobody else has.
One area where extensive data use was apparent was in the student advising process through which the school provided exempt students with recommendations for course placement given that they could no longer rely on placement test scores. The approach taken by DSC involved using comprehensive student data to generate a predictive model that advisors could use for placement recommendations. An administrator shared that the first step involved information technology staff because “we essentially changed our software systems to bring every individual transcript high school course and use that to drive the prediction model.” Another administrator explained the overall process: We had to create methods to collect the information, design a prediction model, build that into our system, retrain all our advisors because now they had to worry about two different students to focus on. . . . Now there was a different conversation for exempt students and a different conversation for non-exempt students. So, we completely redid advising.
Another administrator shared that though the predictive analytics model was originally designed to enhance advising, the information was also beginning to affect the curriculum as well, “We’ve changed our courses, we’ve changed how our faculty think about students. All of those things have happened because of this [legislation].”
In addition to revamping the advising system, DSC encouraged data use among campus personnel by holding a weekly data webinar, which was attended by 700 or more staff members. These webinars were facilitated on a rotating basis by frontline staff tasked with improving institutional practices and included content such as the new prediction model used in advising, as well as other data that staff could access through a Business Intelligence portal. As one administrator described, So, the [webinar] presentations are done by, in the case of the student support services, by frontline advisors who present in each of the areas. It’s not a provost or an associate provost or an administrator, it’s literally somebody who’s directly working with students who’s presenting for the whole college.
He explained that it was, in some regards, a bottom-up approach because frontline staff would oftentimes present data trends to the upper administration: Whoever we have on the call, which is typically about 150 people from around the college. So, at the very top, the president, the executive team, which goes all the way down to separate advisors that will be on the calls.
After the webinar, administrators and frontline staff immediately begin to discuss institutional changes that can be made to address any concerning data trends: They’ll start processing and talking about what we can change this week to improve those numbers. . . . And they’re looking at that information to understand what are the things we can do week to week to impact change.
The administrator explained that this process was put in place to avoid autopsy day a term they used to describe waiting until the end of the semester to say, “Oh, let’s see what happened this semester?” after it was too late to prevent downward trending metrics.
In stark contrast to DSC, data were far less available to frontline staff at “Need to Know” State College (NSC).
“Need to Know” State College: “Data, What Data?”
The institution we are calling “Need to Know” State College (NSC) was among the 48% of institutions in our sample categorized as having a predominately need to know data culture. Whereas a new data sharing and predictive modeling system had substantively improved the advising process and transformed the data culture at DSC, efforts to implement data-driven advising practices at NSC were less successful. Partly in response to increasing tensions with faculty members who had been tasked with providing 30 hours of advising work on top of their regular teaching duties, senior administrators at NSC decided to revamp the advising system including reducing their reliance on faculty advisors. As one administrator put it, NSC had engaged in “a huge amount of work on our whole advising system to the point where we don’t need faculty as advisors to the extent that we did before.” Instead, faculty were shifted back to instructional roles, because an administrator explained, “we didn’t need to utilize faculty advisors, so they could [now] do the retention efforts in their classroom[s].”
Administrators relied on data in making changes to academic advising, but this was not widely shared with frontline staff. An administrator explained that top administrators have access to data, “Yeah, I think the two deans, they use data.” Another administrator stated, “Also, I know how to get into the mainframe and pull down some of this stuff myself, but I use a lot of data in what I do. I have to, to keep up with all the changes.”
However, another administrator complained of the institution’s inadequate data system, noting, “I also keep data in my office . . . because our system is very antiquated. . . . Everything is a manual process.” Another administrator explained the data system at the institution: It’s so incredibly difficult to get often customized predictive analytics that you ideally want to help you in those decision-making points. . . . So, it takes a lot of time, energy, and resources. But the overall culture of data here is really strong.
While the administrator’s concern about the outdated data system extended to frontline staff, the perspective that the data culture was “strong” was not shared by staff. An advisor stated, “I don’t keep up with the data we have.” Other academic advisors refuted that they had any access to data at all. When advisors were asked how they utilized evidence from data to improve advising practices, one advisor asked, “What data?” Several advisors in the focus group nodded, repeating, “Yeah, what data?” When asked about student success rates in entry-level college classes following the legislation, an advisor stated, “We don’t have the data yet of what happened.” Advisors in separate focus group shared a similar story when asked how they used data to improve practice:
We haven’t seen any data.
Not so much.
We don’t have much access to data.
Our leadership, yes.
I mean, I see data, but it’s specifically for my program, not for the general NSC population.
While one supervisor in this advisor focus group described having access to data, the data available to her were specific to her unit, preventing her either from connecting the data to larger trends at the institution or collaborating with other functional areas to improve practice.
Lack of data access did not appear to be confined to advisors at this institution. Indeed, when two faculty members were asked about success rates in Intermediate Algebra (MAT 1033), they remarked,
I don’t know if we have that data yet. Has it been . . .
It’s been a year.
It’s been a year?
Mm-hmm. I think the data is coming in.
At this institution, both an antiquated data system and administrative decisions not to share data led to a less transparent data culture. This may be attributed to factors such as conflicting perceptions of data use among various constituent groups, frustrations by frontline staff, and the leadership’s inability to make timely changes that may improve outcomes.
Blended State College: “All Campuses Are Different”
The institution we are calling Blended State College (BSC) was among the 19% of institutions in our sample categorized as having a blended data culture. In contrast to DSC and NSC, BSC), a large institution with multiple branches, showed mixed patterns of data sharing. Staff at some branches were fully involved in data trend analysis while staff at other branches were markedly less involved in this work.
An administrator at BSC shared that the majority of the “high risk” courses with the highest failure rates were mathematics courses. With regard to the passing rates in Intermediate Algebra (MAT 1033), another administrator explained that the course is both problematic and essential because it’s accepted as a prerequisite for all majors. But it also has a high failure rate, “So, algebra opens the door for everything [every major]. But . . . algebra is like, you know, the big monster under the bed. They’re [students] scared of it.”
In an effort to improve student success in this critical course, another administrator shared that Math every year has a new initiative that they implement. They do one tweak every year using data to really help them see where they need to do that tweak and what kind of tweak they can make in the curriculum.
Data on the problem in Intermediate Algebra, however, did not always reach frontline staff. An administrator shared how data were frequently shared at the dean’s level but didn’t always diffuse to the academic departments on every branch campus, “Data is available through institutional research. We don’t have a direct impact on disciplines and what they do, we use data for reports, and we use data for dean’s meetings and discussions.” Likewise, deans at different campuses were engaging in different data practices. Another administrator explained, Because my director, he actually made us [collect data], for the incoming fall, for the math class, you know, were they college ready? Were they not? What grade did they get? . . . But I mean all campuses are different, but I mean it really all depends.
An administrator explained, “We knew that students were dropping out altogether from the college simply because they couldn’t pass MAT 1033.” Two faculty members described the problem:
But, like the redesign of the MAT 1033, so basically, we, you know, the college [was in] panic mode. And the passing rates in 2015 for MAT 1033 were . . .
Horrible.
Teetering below 50% . . . I think it was something ridiculous like 7,000 students failed MAT 1033 in the fall of 2015. I mean, that’s a whole college thing.
Amid these troubling trends, it became clear that Intermediate Algebra needed more than a tweak. The institution made significant changes to the course delivery, including new course options, early diagnostics of math skills, embedded learning assistants, and a special enrichment section for students who had previously failed the class.
An administrator explained, But it’s very grassroots in the faculty. Administrators, you know, we right away heard what was happening and how do we bring it together. But I think what’s unique about this institution is that they’re doing—and this is an example—is when we formed those core teams . . . It was faculty and admin, so I had the pleasure of serving on the—one of the initial implementation teams college-wide. And then from there we had workers for each of our initiatives and worked on two or three of those. But it was administrators, faculty, students. I mean, you know, it was really mixed and we didn’t work as faculty against administrators . . . [S]o I think that made a difference. So for me, it came from both ends coming together and really working together.
The administrator continued by explaining that “the communication plan that the senior advisors now use started at a couple of campuses with a few senior advisors saying I really think this worked best when I had certain touch points in the semester with my group, like this is a critical time so I reached out and/or this is a critical time . . . and now that’s the case for all of them.”
While data from one branch campus suggested that educational outcomes were better for students who had received services from the senior advisors, an administrator explained that the same data was not being utilized at all branch campuses so they were looking to improve in this area: So, what we’re [administrators at that campus] doing now is that we’re looking also at the data at other campuses to see if students, you know, how much contact they have with them [senior advisors] and whether what we have established already that happens at [campus name] also replicates at the other campuses.
However, regardless of different data practices at different campuses, pass rates in Intermediate Algebra rebounded across the institution following the redesign efforts. An administrator commented, “We’re actually now up to about the same pre-1720 in terms of [MAT 1033] because of all the interventions we’ve included, which includes a big restructure . . . so that we are now, I think, at a good place.”
Discussion
Given the recent growth in state and institutional reforms around postsecondary student success, it is important to understand how data-driven decision practices may facilitate or hinder these efforts. Our findings indicate substantial institutional variation in the extent of distributed leadership supporting data use practices around Florida’s DE reform. Overall, survey results indicated that those in upper-level administrative positions tend to be more involved in data review processes than support staff who work directly with students, but institution-level results revealed that some colleges had more evenly distributed data access than others. Similarly, the focus group data revealed that institutions ranged on a continuum from democratic data cultures to blended data cultures to “need to know” data cultures. Perhaps unsurprisingly, administrators and frontline staff were more likely to agree that their institutions had characteristics of democratic or blended data cultures as opposed to “need to know” institutions where frontline staff were most likely to hold this view. These data cultures were manifest in a variety of contexts, which include changing advising practices and modifying instructional practices and support services for gateway courses.
Our observations from the democratic data culture case is consistent with the information sharing conceptual framework, which is facilitated through institutional norms and individual behavior (Constant et al., 1994; Ipe, 2003). Administrators and staff throughout this college worked collaboratively to substantially redesign the student advising process by using data to develop a predictive model of student success, implement the model in advising practices, and evaluate the results. This demonstrates a culture of evidence in which all members are engaged in data use to inform organizational learning. We also found support for the conceptual framework of distributed leadership in which leaders achieve goals collaboratively through interactions with others and create a supportive institutional environment (Heenan & Bennis 1999; Spillane et al., 2004). Evidence of distributed leadership was observed within institutions, as well as across campuses in cases where cross-campus learning occurred. The institutional leaders in the democratic institution case did this by maintaining a Business Intelligence portal for easy access to data among all staff and offering regular data use webinars facilitated by frontline staff. Having a collaborative data culture resulted in staff expressing pride in their work and feeling like they were able to use data effectively to improve institutional performance.
We also found that need-to-know data cultures tend to be more prevalent than the open access practices at institutions, reflecting elements of a democratic data culture. At these institutions, there were several barriers to data sharing, which align with previous research of organizational practices in postsecondary institutions. First, there may be poor implementation of data-driven decision making due to weak data quality and perceptions of data as not useful (Cox et al., 2017). The case example from the need-to-know institution revealed there was a lack of infrastructure due to antiquated data systems that were unable to collect and process data in a timely manner. Furthermore, institutional leaders may have had little incentive to improve their existing data systems if they are unsure of how to use the data to improve student outcomes.
Second, leaders may not involve frontline staff due to concerns about lack of time and resources (Blaich & Wise, 2011; Bresciani et al., 2009). In the case study at the need-to-know institution, faculty were initially involved in the new advising processes following the reform, but this was perceived as ineffective and overly burdensome on faculty. Institutional leaders used data to inform revisions to the advising process but did not involve staff. This seemed to be reflective of a larger institutional culture that was unsupportive of data sharing with those on the frontline of implementation, as was also seen in interviews with instructors who reported that they did not have access to data on student success rates in their own courses.
A third reason for the lack of data sharing may be due to perceptions that staff lack the skills needed for data-driven decision making (Skolits & Graybeal, 2007). The survey indicated that some lead administrators disagree that staff have adequate data literacy to interpret data on student outcomes. Furthermore, one of the themes in the cross-case analysis was that staff are typically perceived as not data literate in institutions that reflect elements of a need to know system. Among the repercussions of working in need-to-know institution, staff experienced conflict in working across divisions and perceived limitations in their abilities to improve student outcomes.
Our focus group data suggest that an important linkage exists between the decisions of senior leaders and the data culture of the institution. Though not conclusive, the institutions with democratic data cultures had experienced less turnover in senior leadership positions. Staff suggested that low turnover was an asset in terms of making sustained progress toward institutional improvement. Indeed, several staff members at “need to know” institutions reported that they had adopted a “wait and see” approach to making major changes in their day-to-day routines until changing senior leaders could communicate new strategic priorities. In addition, staff at institutions with democratic data cultures were more likely to report that senior leaders were open to new ideas from staff about institutional improvements. Indeed, some campus personnel at need-to-know institutions perceived staff input as more symbolic than real (i.e., a necessary formality prior to making predetermined decisions about institutional change).
Given all these findings, it is essential to understand how administrators share data with frontline staff and how those data are used to identify and solve organizational problems that may impede efforts at institutional improvement. While the organizational behavior literature suggests that higher levels of information and data sharing can increase organizational performance (Bartol & Srivastava, 2002; Constant et al., 1994), the link between data practices and student outcomes in higher education is less clear (Banta & Blaich, 2011; Cox et al., 2017; Tandberg & Hillman, 2013)—both in the literature and in our data from FCS institutions.
Directions for Future Research
The present study represents a crucial first step in understanding how institutional leaders share data within higher education institutions to improve educational practice. One possible interpretation of the three data sharing patterns in our data (need-to-know, blended, and democratic) is that while leaders may be making crucial decisions about data sharing, these decisions may not occur at the same levels of leadership across all institutions. Therefore, more research is needed to understand both how leaders make decisions about what information to share with staff and what types of information leaders tend to share at different levels within institutions. Future research may also further explore the role of staff advocacy in promoting broad access to data. For example, in what ways can staff build data literacy competencies and improve perceptions of these competencies on behalf of administrators?
Building on the present study, our future work will seek to quantitatively link institutional differences in data cultures and practices with student outcomes in Florida’s state colleges. If institutions with higher levels of data sharing operate in a manner consistent with the principles of distributed leadership, we may expect to see higher performance among these institutions due to increased operational efficiency, improved work environments, greater flexibility, and collaborative problem solving.
Implications
Our study also has important implications for what higher education leaders need to do to overcome challenges so that data sharing can help improve institutional practices. The first step is making data more accessible to all staff and improving communication of key findings. At the democratic institution case, this was done by having a widely available Business Intelligence portal and holding regular webinars facilitated by frontline staff. Leaders can serve as role models by showing frontline staff how data can be used in decision making so that the value of the data can be seen. Next, instead of being concerned about lack of data literacy among staff, administrators should place value on the unique expertise that staff can bring to understanding underlying trends. Frontline experience allows staff to develop tacit knowledge of educational practices that work with their specific student populations in particular higher education contexts within specific institutional constraints. They may be able to draw from this knowledge to contribute to answering the “why” questions about data so that administrators and staff can work together to move metrics. Third, leaders can ensure that the appropriate resources and supports are in place to support data use. This can include developing organizational procedures, such as monthly data-sharing meetings, as well as infrastructure such as integration of data systems. Additionally, this study suggests that the trend in institutional research offices toward hiring more qualitative researchers should be expanded precisely because process-based qualitative and mixed methods research can be quite effective in uncovering organizational problems and solutions that can be addressed through further institution-level research. Last, institutional leaders should facilitate communication across departments and across campuses to develop cross-cutting strategies informed by data-driven decision making. While implementing new advising practices resulted in tension between faculty and advisors at the need-to-know institution, staff at the democratic institution expressed appreciation for an intensely collaborative process that they perceived resulted in improved student outcomes. By using a more distributed leadership style in information sharing, institutional leaders can develop a supportive organizational data culture to improve institutional practices.
Supplemental Material
Appendix_A_accept_unblinded_after_acceptance – Supplemental material for From Democratic to “Need to Know”: Linking Distributed Leadership to Data Cultures in the Florida College System
Supplemental material, Appendix_A_accept_unblinded_after_acceptance for From Democratic to “Need to Know”: Linking Distributed Leadership to Data Cultures in the Florida College System by Rebecca L. Brower, Christine G. Mokher, Tamara Bertrand Jones, Bradley E. Cox and Shouping Hu in AERA Open
Footnotes
Acknowledgements
The research reported here was supported by the Institute of Education Sciences, U.S. Department of Education, through Grant R305A160166 to Florida State University, and in part by a grant from the Bill & Melinda Gates Foundation. The opinions expressed are those of the authors and do not represent views of the Institute or the U.S. Department of Education, or the Gates Foundation.
Authors
REBECCA L. BROWER is a former research faculty member at the Center for Postsecondary Success. Her research focuses on diversity policies in higher education and how those policies facilitate student encounters with difference.
CHRISTINE G. MOKHER is an associate professor of higher education at Florida State University, where she is also a senior research associate with the Center for Postsecondary Success. Her research examines state and local policies focused on college- and career-readiness and success.
TAMARA BERTRAND JONES currently serves as an associate professor of higher education at Florida State University and an associate director of the Center for Postsecondary Success. Her research examines the sociocultural influences on socialization during graduate education and the professional experiences of underrepresented populations, particularly Black women, in academia.
BRADLEY E. COX is an associate professor of higher education in Florida State University’s Department of Educational Leadership and Policy Studies, where he is also a senior research associate with the Center for Postsecondary Success. His research focuses on college student success and using evidence-based advocacy to improve experiences and outcomes for college students with autism.
SHOUPING HU is the Louis W. and Elizabeth N. Bender Endowed Professor of Higher Education and the founding director of the Center for Postsecondary Success at Florida State University. His research interests examine issues related to postsecondary readiness, outcomes, and success.
References
Supplementary Material
Please find the following supplemental material available below.
For Open Access articles published under a Creative Commons License, all supplemental material carries the same license as the article it is associated with.
For non-Open Access articles published, all supplemental material carries a non-exclusive license, and permission requests for re-use of supplemental material or any part of supplemental material shall be sent directly to the copyright owner as specified in the copyright notice associated with the article.