
Abstract
In this study, we extend research on the allocation of educational resources to an underdeveloped domain—the distribution of counselors, psychologists, and social workers (i.e., support personnel) to schools. Using administrative data for all North Carolina public schools in the 2007–2008 through 2015–2016 school years, we measure the allocation of support personnel to schools, track secular changes in support personnel ratios during a period in which state budgetary provisions contracted and expanded, and assess the distribution of support personnel to high-poverty and high-minority schools. We calculate more accurate support personnel ratios and show that trends in support personnel ratios differ across school levels. We find that districts concentrate support personnel in high-need schools, however, this compensatory pattern is narrowing over time. Our findings call for further research on the allocation of support personnel and charge states/districts to calculate more accurate and granular support personnel ratios to inform decision making.
Keywords
Introduction
For decades, education researchers have examined the allocation of resources to schools and have assessed whether those resources are distributed in ways that may compensate for or compound inequalities between high-need students and their more advantaged peers (Augenblick, Myers, & Anderson, 1997; Boozer & Rouse, 2001; Card & Payne, 2002; Clotfelter, Ladd, & Vigdor, 2005; Goldhaber, Lavery, & Theobald, 2015; Lankford, Loeb, & Wyckoff, 2002; Murray, Evans, & Schwab, 1998). For example, in response to school finance litigation in the 1970s–1990s, a large body of scholarship has examined adequacy and equity in school funding (Card & Payne, 2002; Evans, Murray, & Schwab, 1997). Likewise, given the importance of teachers to student outcomes, a more recent body of scholarship has examined the distribution of better-credentialed and highly effective teachers to low-income and minority students (Goldhaber et al., 2015; Kalogrides, Loeb, & Beteille, 2013). Overall, this body of research has returned two key findings. First, educational resources are often distributed in ways that may compound inequalities between students. That is, on average, low-income, minority, and lower performing students attend schools with fewer financial resources and with fewer high-quality teachers (Goldhaber et al., 2015; Murray et al., 1998). Second, if allocated toward effective inputs, additional funding can benefit short- and long-term student outcomes (Henry, Fortner, & Thompson, 2010; Jackson, 2018; Jackson, Johnson, & Persico, 2016).
Within the body of research on resource allocation, student support personnel (i.e., school counselors, psychologists, and social workers) are an emerging focus area. Support personnel attend to student needs that are often beyond the purview of classroom curriculum and instruction and recent studies show that support personnel benefit students’ social-emotional and academic development, especially in schools with higher concentrations of low-income and minority students (Carey & Dimmitt, 2012; Castleman & Goodman, 2018; Cholewa, Burkhardt, & Hull, 2015; Lapan, Whitcomb, & Aleman, 2012; Reback, 2010; Woods & Domina, 2014). States and school districts have an obligation to adequately staff schools with support personnel and to ensure that all students, including low-income and minority students, have appropriate access to this valuable resource.
In this article, we investigate the distribution of school counselors, psychologists, and social workers across North Carolina public schools. Our analyses address the following research questions:
To answer these questions, we use statewide administrative data files on schools and school personnel from the North Carolina Department of Public Instruction (NCDPI). In particular, we leverage certified salary and licensure files to calculate support personnel ratios, to track these ratios over a 9-year period, and to assess whether support personnel are distributed to schools in ways that may compensate for or compound inequalities between low-income and minority students and their more advantaged peers. North Carolina is an opportune research setting given the state’s size, diversity in student demographics, and mix of urban and rural school environments.
Our study makes four contributions to the existing research on the allocation of educational resources. First, we calculate more accurate support personnel ratios by using salary records that account for the amount of time—as measured by full-time equivalency (FTE)—that support personnel are paid in their role. In doing so, we find that differences between traditional body count ratios and ratios that adjust for FTE are relatively modest for school counselors. Conversely, there are large differences between traditional body count ratios and FTE ratios for school psychologists and social workers. Second, we show how support personnel ratios change as states and districts experience fiscal downturns and recoveries. In particular, we find that trends in support personnel ratios vary across school levels, with elementary schools experiencing a modest decrease in ratios (i.e., fewer students per support personnel) and middle and high schools experiencing an increase in ratios (i.e., more students per support personnel). Ratios for support personnel in middle and high schools have not returned to prerecession levels.
Third, we assess the distribution of support personnel to schools with higher concentrations of low-income and minority students. We find that North Carolina school districts allocate more support personnel to high-need schools—signaling that support personnel are distributed in ways that may compensate for inequalities between students. This is noteworthy, since most studies show that educational resources are allocated in ways that may compound inequality (Goldhaber et al., 2015; Murray et al., 1998). Finally, we examine trends in the distribution of support personnel to high-need schools. These analyses show that high-need schools have experienced sharper increases in support personnel ratios during our study period. As such, the compensatory pattern in support personnel allocation is narrowing. At a time when schools are being called on to meet the needs of the whole child, our work may have direct implications for school funding formulas, regulations on support personnel ratios, and how district and school leaders allocate personnel.
Background
Understanding the Roles of Student Support Personnel
School counselors, psychologists, and social workers support the academic mission of schools by removing barriers to learning, improving learning conditions, and enhancing individual students’ skills (American School Counselor Association [ASCA], 2019; National Association of School Psychologists [NASP], 2018; School Social Work Association of American [SSWAA], 2019). While all three positions have focused training in mental health, their roles in schools differ. Below, we describe the job responsibilities and education/licensure requirements for each position.
School Counselors
The primary objective of school counselors is to enhance students’ mind-sets and behaviors so that they can achieve their academic, career, and social-emotional goals (ASCA, 2019). In elementary grades, counselors generally focus on students’ social-emotional development, and in some cases, school counselors teach social-emotional curricula to elementary and middle school students. As students progress through school, counselors typically focus more on college and career advising. While school counselors have a mandate to serve all students, counselors particularly help underresourced students to close gaps in achievement or school engagement (Carey & Dimmitt, 2012; Wilkerson, Perusse, & Hughes, 2013). The position requires a minimum of a master’s degree, with each state mandating additional certification or licensure (ASCA, 2019).
School Psychologists
School psychologists conduct testing to determine students’ eligibility for special education and mental health services and work with students, teachers, and administrators to foster an environment that optimizes student learning. These professionals provide services and interventions for students with disabilities, students experiencing mental health issues, and for issues related to school safety and crisis prevention (NASP, 2018). While national standards for school psychologists suggest working with all students, their time is often focused on a small group of the most vulnerable students. The position requires certification from a graduate training program at an accredited postsecondary institution (NASP, 2018).
School Social Workers
School social workers assist with student mental health and behavioral concerns; support academic and behavioral initiatives; and consult with teachers, parents, and administrators. Frequently, school social workers focus on the most vulnerable students by brokering community resources and advocating for student needs. School social worker training covers cultural diversity, systems theory, social justice, risk assessment and intervention, consultation and collaboration, clinical intervention, inadequate health care, and neighborhood violence (SSWAA, 2018). The position allows for certification at both the bachelor’s and master’s levels.
The Relationship Between Student Support Personnel and Student Outcomes
Existing research suggests that school counselors influence a wide range of student developmental outcomes. In particular, school counseling services have been linked to improvements in students’ academic achievement, school attendance, classroom behavior, and self-esteem (Carey & Dimmitt, 2012; Carrell & Hoekstra, 2014; Lapan, Gysbers, & Petroski, 2011); reductions in school dropout rates and disciplinary referrals (Lapan, Gysbers, Bragg, & Pierce, 2012; Lapan, Whitcomb, et al., 2012; Reback, 2010); and improved postsecondary outcomes (Castleman & Goodman, 2018; Hurwitz & Howell, 2014; Woods & Domina, 2014). While the bulk of this research uses correlational research designs that do not allow for causal inferences, several studies use regression discontinuity designs to provide relatively strong quasi-experimental evidence of the effects of counseling resources (Carrell & Carrell, 2006; Castleman & Goodman, 2018). For example, with data from Florida elementary schools in 1995–1999, a period in which school counseling interns were formulaically assigned to schools based on student enrollment, Carrell and Carrell (2006) find that counseling resources significantly decrease the presence of disciplinary problems.
Relative to school counselor analyses, the existing evidence on school psychologists and social workers is less extensive. However, evidence suggests that school psychologists and social workers benefit students. For example, Newsome, Anderson-Butcher, Fink, Hall, and Huffer (2008) show that students who receive school social work services present significantly lower levels on several risk factors related to truancy from school than matched peers who do not interact with school social workers. Likewise, exposure to school psychologists is associated with improvements on multiple student outcomes, especially in reading (Bramlett, Cates, Savina, & Lauinger, 2010).
Beyond a focus on all students, the existing literature suggests that at-risk students disproportionately benefit from support personnel. Studies in Missouri and Connecticut show that when high schools with large populations of economically disadvantaged and minority students comply with the ASCA recommended counselor ratio, students have higher graduation and attendance rates and lower levels of disciplinary incidents (Lapan, Gysbers, et al., 2012; Lapan, Whitcomb, et al., 2012). Using the High School Longitudinal School Study of 2009, Cholewa et al. (2015) found a positive association between counseling relationships and college persistence for Black and first-generation college students. These differential positive effects for first-generation college students were replicated by Pham and Keenan (2011). Similarly, recent work by Castleman and Goodman (2018) shows that intensive college counseling for low-income students shifts enrollment toward 4-year colleges that are less expensive and improves persistence through at least the second year of college.
Support Personnel Ratios
The national organizations for school counselors, psychologists, and social workers publish recommended ratios for their respective school personnel. ASCA recommends a ratio of one school counselor for every 250 students, NASP recommends one school psychologist for every 500 to 700 students, and SSWAA recommends one school social worker for every 250 students. These recommended ratios do not change across school levels and only SSWAA suggests a different ratio when providing supports to high-need students (i.e., SSWAA recommends a ratio of one school social worker to every 50 students with intensive needs).
When states, researchers, and national organizations publish support personnel ratios, they typically report the number of students per support personnel (i.e., a body count ratio). For example, each year ASCA reports the ratio of students to school counselors in each state and nationally. 1 While these ratios provide a recommended benchmark for states and school districts, they are expressed in aggregate terms that do not (1) assess variation in support personnel ratios across school levels or for schools serving different populations of students or (2) account for the amount of time (FTE status) that support personnel work at a given school. As such, these aggregate ratios yield limited information on the distribution of support personnel to different school levels or to schools with varying student populations. Furthermore, if support personnel work part-time or school districts allocate support personnel to more than one school, these body count ratios may overestimate the intensity of support personnel resources available to students.
Method
Research Sample
To calculate ratios for student support personnel, track their allocation over time, and assess their distribution across schools, our research sample includes public (noncharter) elementary, middle, and high schools in North Carolina during the 2007–2008 through 2015–2016 academic years. We focus on traditional public schools and exclude records for special education, alternative education, vocational education, and hospital schools. These schools make up less than 4% of the public, noncharter schools in North Carolina. We exclude these observations since such schools typically enroll few students and they have much higher concentrations of personnel (i.e., teachers, support personnel) to meet students’ needs. In each of our analysis years, there are approximately 1,350 to 1,390 elementary schools, 415 to 430 middle schools, and 460 to 490 high schools in our sample. These schools are part of North Carolina’s 115 public school districts. 2 On an annual basis, these schools enroll approximately 1.4 million students and employ approximately 4,100 school counselors, 650 school psychologists, and 915 social workers.
Table 1 displays basic descriptive data for the elementary, middle, and high schools in our analyses. Average daily membership (ADM) 3 is greater in high schools, relative to elementary and middle schools, and approximately 60% of these schools are located in rural/town environments. Test proficiency rates and the percentage of racial/ethnic minority students are generally comparable across school levels. Conversely, short-term suspension rates and the percentage of economically disadvantaged students varies across school levels—suspension rates are much higher in middle and high schools, while the percentage of economically disadvantaged students decreases across school levels. Finally, we note that per-pupil expenditures for student services are highest in high schools.
School Characteristics in the 2007–2008 Through 2015–2016 Years

Note. For the elementary, middle, and high schools in our sample, this table displays average (mean) school characteristics for the 2007–2008 through 2015–2016 school years.
North Carolina has a specified funding stream for instructional support personnel—defined as personnel whose duties include social, health, guidance, attendance, and media services. It is the intent of the state General Assembly that school districts prioritize these allotted positions for school counselors and then for school social workers, but districts must also ensure that they hire other necessary instructional support personnel (e.g., media services). In our first study year (2007–2008), North Carolina allotted school districts one instructional support position per every 200.10 students in the district. Since that time North Carolina has twice increased this ratio: to 1 instructional support position per every 210.53 students in 2011–2012 and to 1 instructional support position per every 218.55 students in 2013–2014. All partial positions above 0.25 are rounded up to the nearest whole instructional support position (NCDPI, n.d.-a). These formulas show that North Carolina has withdrawn state-level funding from support personnel throughout our study period. Furthermore, these formulas suggest that differences in support personnel ratios across North Carolina schools may be attributable to (1) school districts converting a larger share of their allotted instructional support positions into school counselors, psychologists, or social workers and/or (2) districts directing funds from local or federal sources to support personnel positions.
North Carolina’s withdrawal of instructional support positions was part of a larger trend in school spending throughout much of our study period. Appendix Figure A1 displays average per-pupil expenditures for the elementary, middle, and high schools in our sample during the 2007–2008 through 2015–2016 school years. Across school levels, per-pupil expenditures began decreasing in 2009–2010 and stayed on a downward trend through 2011–2012. By the end of our study period, per-pupil expenditures were returning to 2009 levels. Two noteworthy groups that experienced funding cuts during this time period were teachers and teacher assistants. In 2008–2009, there were 99,098 full-time teachers for 1.45 million students enrolled in North Carolina public schools; by 2015–2016, there were 94,421 full-time teachers for 1.49 million enrolled students. Likewise, there were 30,002 full-time teacher assistants in 2008–2009 and only 21,048 full-time teacher assistants in 2015–2016 (NCDPI, n.d.-b).
Calculating Support Personnel Ratios
To calculate the support personnel resources available at schools, we leverage licensure and certified salary files from the NCDPI. We use licensure files to identify school employees who held a school counselor, psychologist, or social work state license in a given academic year. We use certified salary files to identify school employees who were paid in an instructional support role in a given academic year. By merging these data together, we identify school personnel who held a relevant support personnel license and who were paid in an instructional support role.
We began by calculating traditional body count ratios for support personnel. To do so, we identified the number of school counselors, psychologists, and social workers at a given school (regardless of their FTE at the school) and divided those counts by the school’s ADM. These body count ratios are straightforward to calculate and communicate to external audiences, however, to the extent that support personnel work part-time or across multiple schools, these traditional body count ratios will overestimate the support personnel resources available to students. To address this issue, we leverage certified salary files to track the number of pay periods support personnel work at a given school and their FTE status (e.g., 100% FTE, 50% FTE) during each of those pay periods. 4 With these pay period and FTE data, we calculate the number of ‘FTE units’ that support personnel worked at a school in a given year. For example, a school counselor employed at a school for 10 pay periods at 50% FTE worked 500 FTE units; a school social worker employed at a school for 10 pay periods at 100% FTE worked 1,000 FTE units. For each school in our sample, we sum these FTE units for school counselors, psychologists, and social workers and across all these support personnel (combined). We divide these FTE units by a school’s ADM to calculate the number of FTE support personnel per 1,000 students. For instance, if school counselors worked 3,000 FTE units at a high school with an ADM of 1,200, then our ratio is 2.5 FTE counselors per 1,000 students.
While our FTE ratios account for the time worked by support personnel at a given school, they are not expressed in units that are commonly used by the field—that is, counts of students per support personnel. Therefore, we also calculate adjusted body count ratios. These ratios account for the time support personnel work at a given school and are expressed in units familiar to the field. The adjusted body count ratio expresses the number of students per one full-time support personnel. To calculate adjusted body count ratios, we set up the following equation and solve for X:
The adjusted body count ratio is our preferred measure for analyses—to examine trends in support personnel ratios and to assess the distribution of support personnel to high-need schools. As a robustness check, we also perform analyses with the traditional body count ratio. We include the traditional body count ratio results in the appendix and describe how results differ between the two measurement approaches.
Analyses
To address our first research question, we present descriptive data on the ratios of school counselors, psychologists, social workers, and all support personnel (combined) in elementary, middle, and high schools. In particular, we report mean traditional body count, FTE, and adjusted body count ratios for support personnel. These data allow us to quantify the differences between traditional and adjusted body count ratios. As part of these analyses, we also examine two reasons why traditional body count and adjusted body count ratios may differ—support personnel working part-time and support personnel working at multiple schools. To more fully understand these allocations, we also present histograms showing the variation in support personnel ratios across schools.
For our second research question, we track adjusted body count ratios to assess how much support personnel resources vary over time. Specifically, for the 2007–2008 through 2015–2016 school years, we graph adjusted body count ratios for support personnel (combined) in elementary, middle, and high schools. In Appendix Table A1, we display adjusted body count ratios for school counselors, psychologists, and social workers.
For our final research question, we assess the associations between school characteristics and the concentration of support personnel resources at a school. We begin by using t-tests to assess whether there are statistically significant differences in the adjusted body count ratios of support personnel in high-poverty and high-minority elementary, middle, and high schools versus non–high-poverty and non–high-minority schools. We define high-poverty and high-minority schools as those in the top quartile for the percentage of economically disadvantaged and racial/ethnic minority students. These t-test results show statewide patterns in the distribution of support personnel to high-need schools.
To complement these statewide analyses, we also assess within-district variation in the distribution of support personnel to schools. Differences in the distribution of support personnel between high-need and non–high-need schools are likely the result of district-level leadership deciding to allocate funds in certain ways. This might include using state-level funds to allot more (less) support personnel positions to high-need schools or directing local/federal funds to support personnel positions in certain types of schools. By estimating regression models with a school district fixed effect, we can better assess how district-level decision making influences the distribution of support personnel to schools.
Therefore, we estimate linear regression models for elementary, middle, and high schools with a school district fixed effect. In these analyses our outcome measure is the adjusted body count ratio for all support personnel. We standardize this measure, by school level and year, to ease interpretation of results. Our focal measures are the percentage of economically disadvantaged and racial/ethnic minority students at the school. We estimate models with each of these focal variables entered separately and models with both variables entered together. This lets us assess bivariate associations 5 with support personnel ratios and associations that adjust for the other focal covariate. We scale these focal variables such that coefficients express the association between a 10-percentage-point increase in the percentage of economically disadvantaged or racial/ethnic minority students and the support personnel ratio. All models control for year fixed effects and cluster standard errors at the school district level. We cluster standard errors at the school district level because that is where many resource allocation decisions are made. Results from these analyses will reveal whether districts are allocating support personnel in ways that may compensate for or compound inequalities between students.
Results
What Are the Ratios of Student Support Personnel to Students?
Table 2 displays traditional body count, FTE, and adjusted body count ratios for support personnel in elementary, middle, and high schools. Before assessing the differences between traditional body count ratios and ratios that adjust for the amount of time worked, we examine the extent to which school counselors, psychologists, and social workers are differently distributed across school levels. Regardless of the calculation method used—traditional, FTE, or adjusted body count ratios—Table 2 shows that school counselors are more heavily concentrated in high schools. Adjusted body count ratios show that there is 1 full-time school counselor per every 219 high school students, 324 middle school students, and 395 elementary school students.
Student Support Personnel Ratios (2007–2008 Through 2015–2016)

Note. FTE = full-time equivalency. The top panel of this table displays traditional body count ratios for student support personnel in elementary, middle, and high schools. The middle panel of this table displays FTE ratios for student support personnel. FTE ratios are expressed as the number of FTE personnel per 1,000 students. Finally, the bottom panel of this table displays adjusted body count ratios for support personnel. Adjusted body count ratios express the number of students per one full-time support personnel. We calculated these adjusted ratios using the following formula (
Data indicate that school psychologists are more heavily concentrated in elementary schools. On average, elementary schools have one full-time psychologist per 1,669 students, compared with one full-time school psychologist per 2,747 middle school students and 5,952 high school students. Last, adjusted body count ratios show that school social workers are evenly distributed across school levels. There is one full-time school social worker per 1,374 elementary school students, 1,323 middle school students, and 1,368 high school students. These data speak to the specific roles that support personnel fill in college and career advising (counselors in high schools) and determining students’ eligibility for special education and mental health services (psychologists in elementary schools). These data may also suggest missed opportunities—for school counselors to more intensively influence student development in elementary schools (Barna & Brott, 2011) and for school psychologists to benefit school safety and mental health in middle and high schools (Hughes, Fenning, Crepeau-Hobson, & Reddy, 2017).
When comparing traditional and adjusted body count ratios, we note that the ratios are relatively similar for school counselors and quite different for school psychologists and social workers. For elementary school counselors, the traditional body count ratio (1:350) is 11% lower than the adjusted body count ratio (1:395); in middle and high schools, the traditional body count ratios for school counselors are 7% and 6% lower than the adjusted body count ratios, respectively. This indicates that traditional body count ratios only modestly overestimate the intensity of school counseling resources available to students. As such, differences between traditional and adjusted body count ratios for school counselors may have little practical significance for student outcomes.
Conversely, traditional body count ratios for school psychologists are more than 50% lower than the corresponding adjusted body count ratios. For example, the traditional body count ratio for middle school psychologists is 1:1264, while the adjusted body count ratio is 1:2747. Likewise, the traditional body count ratios for school social workers are approximately 33% to 45% lower than the corresponding adjusted body count ratios—for example, a traditional body count ratio of one social worker per 915 high school students versus an adjusted body count ratio of one full-time social worker per 1,368 high school students. These differences show that traditional body count ratios substantially overestimate the intensity of school psychology and social work resources available to students. It is difficult to speculate on the practical significance of these ratio differences since few studies have rigorously assessed the associations between school psychologist and social worker ratios and student outcomes.
There are two, interrelated explanations for the differences between traditional and adjusted body count ratios—support personnel working part-time at schools and working across multiple schools. To further explore amount of time worked, we report the average FTE units that individual support personnel work at schools. On average, school counselors worked approximately 905 FTE units at schools, ranging from 880 FTE units in elementary schools to 932 FTE units in high schools. These values are near full-time—defined as 1,000+ FTE units. School psychologists averaged 482 FTE units in schools, ranging from 405 FTE units in high schools to 508 FTE units in elementary schools. Likewise, school social workers averaged 631 FTE units at schools, ranging from 560 FTE units in elementary schools to 765 FTE units in high schools.
Since part-time FTE units may signal that support personnel are working across multiple schools, we examine the number of schools in which school counselors, psychologists, and social workers work in a given year. On average, (1) school counselors work in 1.10 schools, with 92% of counselors working at only one school within a given year; (2) school psychologists work in 1.99 schools, with 48% at one school, 24% at two schools, and 28% at three or more schools within a given year; and (3) school social workers work in 1.59 schools, with 68% working at one school, 18% working at two schools, and 14% working at three or more schools within a given year. 6 These data illustrate why the traditional and adjusted body count ratios are similar for school counselors and quite different for school psychologists and social workers.
Finally, to better understand the distribution of these support personnel resources, Figure 1A–C present histograms of adjusted body count ratios for all support personnel (combined) in elementary, middle, and high schools. These histograms reveal two trends in the data. First, adjusted body count ratios for support personnel have a relatively normal distribution with a long right tail. For example, while the mean adjusted body count ratio is one full-time support personnel per 259 elementary school students, a small percentage of elementary schools employ considerably more support personnel per student. Second, there is wide variation in support personnel ratios across schools. The standard deviation of the adjusted body count ratio for all support personnel (combined) is 1:490 elementary school students, 1:516 middle school students, and 1:252 high school students.

Histogram of adjusted body count ratios for all support personnel (combined): (A) elementary schools, (B) middle schools, and (C) high schools. Data come from the 2007–2008 through 2015–2016 school years.
How Do Support Personnel Ratios Vary Over Time?
Figure 2 displays adjusted body count ratios for all support personnel (combined) in elementary, middle, and high schools in the 2007–2008 through 2015–2016 school years. 7 Data from elementary schools show a modest rise in the intensity of support personnel resources during our study period. In 2008, elementary schools had an average adjusted body count ratio of one full-time support personnel per 264 students; by 2016, the average adjusted body count ratio was one full-time support personnel per 253 students. The top panel of Appendix Table A1 shows that adjusted body count ratios for elementary school counselors have gone from 1:407 in 2008 to 1:382 in 2016; adjusted body count ratios for elementary school social workers have gone from 1:1419 to 1:1300. These reductions in support personnel ratios are remarkable, since North Carolina’s state-level funding formula for instructional support personnel became less generous during our study period—shifting from one instructional support position per 200.10 students to one instructional support position per 218.55 students.

Adjusted body count ratios for support personnel (2007–2008 through 2015–2016).
Figure 2 shows that during our study period there has been a modest withdrawal of support personnel resources from middle schools. In 2008, middle schools had an average adjusted body count ratio of 1 full-time support personnel per 225 students; by 2015, this ratio had risen to 1 full-time support personnel per every 250 middle school students. The ratio fell to 1 full-time support personnel per 238 middle school students in 2016. Data in the middle panel of Appendix Table A1 indicate that adjusted body count ratios for middle school counselors, psychologists, and social workers all increased between 2008 and 2016—by 4% for school counselors, 16% for psychologists, and 7% for social workers.
Figure 2 shows the sharpest withdrawal of support personnel resources in high schools. Between 2008 and 2009, adjusted body count ratios increased from one full-time support personnel per 159 students to one full-time support personnel per 173 students. Since 2009, adjusted body count ratios have continued to rise and were at one full-time support personnel per 198 high school students in 2016. Data in the bottom panel of Appendix Table A1 indicate that adjusted body count ratios for high school counselors, psychologists, and social workers all increased between 2008 and 2016—by 18% for school counselors, 27% for psychologists, and 26% for social workers.
Finally, Appendix Figure A2 displays trends in traditional body count ratios. Data from elementary and middle schools reveal modest differences in the trends for traditional versus adjusted body count ratios. In elementary schools, traditional body count ratios increased by 4%, while adjusted body count ratios fell by 6% during our study period. In middle schools, traditional body count ratios increased by 12% relative to a 5% increase in adjusted body count ratios. Appendix Figure A2 also shows that traditional body count ratios were lower in elementary schools, relative to middle schools, starting in 2010. Adjusted body count ratios are lower in middle schools throughout our study period. Data from high schools reveal that traditional and adjusted body count ratios each increased by approximately 20% during our study period.
To What Extent Does the Distribution of Support Personnel Vary With Student Characteristics at the School?
To address this question, we begin with descriptive data on the adjusted body count ratios for support personnel in high-poverty and high-minority schools (defined as schools in the top quartile of economically disadvantaged and racial/ethnic minority students) versus non–high-poverty and non–high-minority schools. Figure 3 shows that adjusted body count ratios are significantly lower in high-poverty elementary, middle, and high schools than in non–high-poverty schools. For example, high-poverty middle schools average one full-time support personnel per 193 students; non–high-poverty middle schools average one full-time support personnel per 258 students. Figure 4 illustrates a similar pattern for high-minority schools. Across elementary, middle, and high schools, high-minority schools have significantly lower adjusted body count ratios than schools with fewer racial/ethnic minority students. For instance, high-minority high schools average one full-time support personnel per 155 students; non–high-minority high schools average one full-time support personnel per 195 students. Appendix Figures A3 and A4 show a very similar pattern for traditional body count ratios, which are also significantly lower in high-poverty and high-minority schools. In particular, traditional and adjusted body count ratios are each 20% to 25% lower in high-poverty and high-minority schools relative to non–high-poverty and non–high-minority schools.

Adjusted body count ratios for support personnel in high-poverty schools.
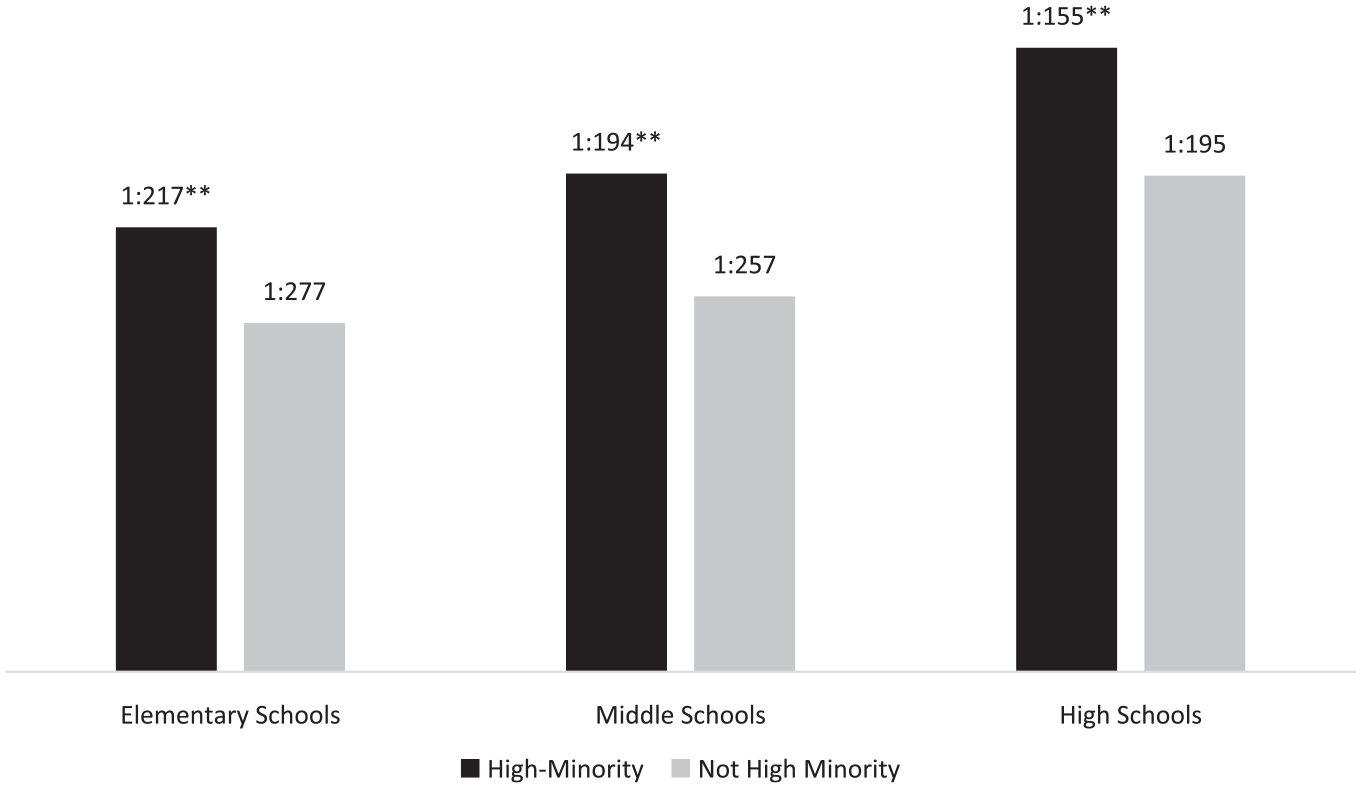
Adjusted body count ratios for support personnel in high-minority schools.
To assess the distribution of support personnel resources within school districts, we estimated linear regression models with a school district fixed effect. Comparing within school districts, results in the top panel of Table 3 show that support personnel resources are significantly higher in high-poverty and high-minority schools. For example, a 10-percentage-point increase in the percentage of economically disadvantaged students in elementary schools is associated with a 12% of a standard deviation change in adjusted body count ratios. This is equivalent to lowering the adjusted body count ratio from one full-time support personnel per 259 elementary school students (i.e., the average adjusted body count ratio in elementary schools) to one full-time support personnel per 244 elementary school students. Likewise, in middle and high schools, a 10-percentage-point increase in the percentage of racial/ethnic minority students is associated with a 19% and 6.5% of a standard deviation change in adjusted body count ratios, respectively. These coefficients are equivalent to lowering the adjusted body count ratio from 1:238 to 1:218 middle school students and from 1:183 to 1:176 high school students.
The Distribution of Support Personnel to Schools

Note. This table displays results from ordinary least squares regression models that estimate the associations between school characteristics and adjusted body count ratios for support personnel (standardized). All models include a school district fixed effect, control for year fixed effects, and cluster standard errors at the school district level. Cluster-adjusted standard errors are in parentheses. Coefficients express the change in adjusted body count ratios for support personnel with a 10-percentage-point increase in the percentage of economically disadvantaged or racial/ethnic minority students.
p < .05. **p < .01.
Results in the bottom panel of Table 3 are generally robust when entering both demographic measures into the same model—only the estimate for percent racial/ethnic minority in elementary schools is no longer statistically significant. Likewise, regression results are positive, statistically significant, and of a similar magnitude when we estimate school district fixed effect models with traditional body count ratios (see Appendix Table A2). Overall, these data confirm that schools with more low-income and minority students have lower support personnel ratios. This suggests a compensatory model of resource allocation in which school districts direct more support personnel resources to schools with greater needs.
Finally, to extend our analyses on high-need schools, Figure 5 displays trends in adjusted body count ratios for high-poverty and non–high-poverty elementary, middle, and high schools. 8 Trends in elementary schools differ by high-poverty status: high-poverty elementary schools experienced a modest increase in adjusted body count ratios during the study period (from 1:210 in 2008 to 1:221 in 2016), while non–high-poverty elementary schools experienced a decline in adjusted body count ratios (from 1:287 to 1:265). Non–high-poverty elementary schools are the only type of school that experienced a decrease in adjusted body count ratios during our study period.

Adjusted body count ratios by high-poverty status (2007–2008 through 2015–2016).
Adjusted body count ratios for support personnel in high-poverty and non–high-poverty middle schools increased between 2008 and 2016—from 1:179 to 1:196 in high-poverty middle schools and from 1:245 to 1:255 in non–high-poverty middle schools. However, the percentage increase was twice as large in high-poverty middle schools versus non–high-poverty middle schools (8.6% vs. 4.1%, respectively). Likewise, trend data show that the percentage increase in adjusted body count ratios was more than two times greater in high-poverty high schools versus non–high-poverty high schools. In particular, high-poverty high schools experienced a 31.6% increase in adjusted body count ratios (from 1:126 to 1:184), while non–high-poverty high schools experienced a 13.8% increase (from 1:175 to 1:203).
Results are comparable when we consider trends in traditional body count ratios in high-poverty and non–high-poverty schools. In particular, Appendix Figure A5 shows that traditional body count ratios increased by 11% in high-poverty elementary schools, 13% in high-poverty middle schools, and 35% in high-poverty high schools during our study period. Conversely, the traditional body count ratios increased by 4%, 12%, and 13% in non–high-poverty elementary, middle, and high schools, respectively. Overall, statewide and within-district comparisons indicate that North Carolina school districts concentrate more support personnel resources in schools with more high-poverty and racial/ethnic minority students. Trend data indicate that high-need schools experience larger cuts in support personnel resources.
Discussion
Support personnel can play an integral role in helping schools promote students’ academic and social-emotional development (Carey & Dimmitt, 2012; Carrell & Carrell, 2006; Carrell & Hoekstra, 2014; Cholewa et al., 2015; Lapan, Gysbers, et al., 2012; Lapan, Whitcomb, et al., 2012; Reback, 2010). As such, their work in schools and their distribution to high-need schools requires continued attention. This is particularly true as schools are educating more low-income and minority students and are being asked to meet an increasingly broad set of student needs. With this motivation, we explored the intensity of support personnel resources in schools, tracked how these resources have changed over time, and assessed whether these resources are distributed to schools in ways that may compensate for or compound inequalities between low-income and minority students and their more advantaged peers. Our work extends prior research on the allocation of educational resources to a relatively underdeveloped domain: the distribution of support personnel to schools.
With our analyses, we make four contributions to the existing research on the allocation of educational resources. First, we calculate more accurate support personnel ratios by accounting for the amount of time that support personnel are paid in their role at a given school. Traditional body count ratios are easy for advocacy and professional organizations to disseminate and for policy makers to understand, however, they overestimate the intensity of support personnel resources available to students. In particular, we find that there are large differences in traditional and adjusted body count ratios for school psychologists and social workers—that is, traditional body count ratios are inflated by more than 50% for school psychologists and by approximately 33% to 45% for social workers. This is because school psychologists and social workers often work at multiple school sites. Conversely, there are modest differences in traditional and adjusted body count ratios for school counselors, who typically work full-time at a single school. Calculating more accurate support personnel ratios may matter to (1) education officials, who make decisions (e.g., setting ratio targets, establishing funding formulas, allocating positions to schools) based, in part, on support personnel ratios and (2) students, who benefit from having more support personnel resources at their schools (Carrell & Hoekstra, 2014; Lapan, Gysbers, et al., 2012; Lapan, Whitcomb, et al., 2012; Reback, 2010).
Second, with a 9-year study window, we show how support personnel ratios vary as states/districts experience fiscal downturns and recoveries. These trend analyses connect to broader research on the allocation of educational resources during fiscal crises (Goldhaber & Theobald, 2014; Knight & Strunk, 2016) and are particularly relevant in North Carolina, where spending on K–12 education has been slow to return to pre-Recession levels (Leachman, Masterson, & Figueroa, 2017). We find that trends in support personnel ratios vary across school levels. Elementary schools experienced a modest decrease in adjusted body count ratios, while middle and high schools experienced a ratio increase. Adjusted body count ratios for support personnel in middle and high schools have not returned to prerecession levels. Findings are largely similar when considering trends in traditional body count ratios. The divergence in ratio trends across school levels may be attributable to districts maintaining state-funded instructional support positions in elementary schools while making cuts in state-funded positions in middle and high schools. Districts may have also chosen to differentially allocate local and federal funds across school levels.
Third, we assess the distribution of support personnel to schools with higher concentrations of low-income and minority students. These analyses add to a large body of work assessing whether traditionally disadvantaged students have equal access to resources (Augenblick et al., 1997; Card & Payne, 2002; Clotfelter et al., 2005; Goldhaber et al., 2015). Statewide and within-district comparisons show that North Carolina school districts allocate more support personnel to high-need schools. These results are similar regardless of whether we assess adjusted or traditional body count ratios. This finding runs counter to prior work which generally shows that educational resources are distributed in ways that may compound inequalities between students (Goldhaber et al., 2015; Lankford et al., 2002; Murray et al., 1998). Because North Carolina has a set funding formula, the concentration of support personnel in high-need schools suggests that (1) districts disproportionately allot state-funded instructional support positions to high-need schools and/or (2) districts use federal or local funds for more instructional support personnel in high-need schools.
Finally, while support personnel are more heavily concentrated in high-need schools, we find that these environments have experienced sharper increases in support personnel ratios during our study period. Across all school levels—elementary, middle, and high—high-poverty schools have experienced increases in adjusted body count ratios at least twice as large as those for non–high-poverty schools. High-poverty elementary and high schools experienced increases in traditional body count ratios more than two times greater than in non–high-poverty elementary and high schools. This suggests that support personnel in high-need schools face larger caseloads and are less able to provide personalized attention to students. These cuts in support personnel fit with broader work showing that economically disadvantaged students are often disproportionately affected by budget reductions (Knight & Strunk, 2016).
To better contextualize our contributions to the resource allocation literature, it is important to highlight three limitations of our work. First, we do not have any measures on the quality of support personnel or on the quality or frequency of interactions between students and support personnel. While high-need schools may have lower ratios, the support personnel in those schools may be less effective at promoting students’ academic and social-emotional development. For example, work from North Carolina shows that high-need high schools have lower teacher-to-student ratios, but these teachers are less well-credentialed and less effective (Bastian, Henry, & Thompson, 2013). Second, educational resources are limited, such that increased funding in one area (i.e., support personnel) may necessitate spending cuts in other areas. This challenges our ability to assess whether a given distribution of support personnel is the most effective. In particular, it is hard to know whether support personnel positions are the best use of funds in high-need schools or whether cutting support personnel funds, instead of others during a financial downturn, is the best strategy. Research indicates that support personnel matter; to further inform allocation decisions, continued analyses must assess the conditions in which support personnel matter. Finally, it is important to acknowledge limitations to generalizability. We assess data from one large and diverse state; it is possible that the distribution of support personnel to schools differs in other locations.
Moving forward, our analyses highlight several implications for research and policy/practice. From a research perspective, our findings call for replication studies in other districts and states to ascertain whether support personnel are concentrated in high-poverty schools. Despite having the greatest needs, these environments rarely have equal access to educational resources. More broadly, our findings spark a range of new questions about the quality of support personnel in high-need schools, whether more support personnel in high-need schools is the best allocation strategy (for whom and for which outcomes), and how districts and schools structure the roles and responsibilities of school counselors, psychologists, and social workers to complement each other. From a policy and practice perspective, our analyses call on states and districts to be aware of the limitations with body count ratios and to calculate ratios that take FTE status into account. By examining support personnel ratios that are more accurate and more granular—that is, broken out by school level and school characteristics—policy makers can reevaluate funding formulas and the ways support personnel are allocated to schools. This consideration of data may help districts and schools improve the achievement and social-emotional development of students.
Footnotes
Appendix
The Distribution of Support Personnel to Schools

| Elementary Schools | Middle Schools | High Schools | |
|---|---|---|---|
| Focal variables entered into individual models | |||
| % Economically disadvantaged | 0.081** (0.008) | 0.168** (0.028) | 0.023 (0.025) |
| % Racial/ethnic minority | 0.058** (0.012) | 0.167** (0.028) | 0.062* (0.030) |
| Focal variables entered in the same model | |||
| % Economically disadvantaged | 0.100** (0.016) | 0.106** (0.027) | −0.020 (0.026) |
| % Racial/ethnic minority | −0.025 (0.019) | 0.077** (0.026) | 0.075* (0.034) |
| Observation count | 12,285 | 3,818 | 4,303 |
Note. This table displays results from ordinary least squares regression models that estimate the associations between school characteristics and traditional body count ratios for support personnel (standardized). All models include a school district fixed effect, control for year fixed effects, and cluster standard errors at the school district level. Cluster-adjusted standard errors are in parentheses. Coefficients express the change in traditional body count ratios for support personnel with a 10-percentage-point increase in the percentage of economically disadvantaged or racial/ethnic minority students.
p < .05. **p < .01.
Acknowledgements
We would like to thank the North Carolina Department of Public Instruction for providing the necessary administrative data for this research. We acknowledge funding for this work from the American School Counselor Association.
Notes
Authors
KEVIN C. BASTIAN is a senior research associate in the Department of Public Policy and the director of research at the Education Policy Initiative at Carolina at UNC Chapel Hill. His research interests include teacher and school leader preparation and effectiveness and how school environments influence student, teacher, and administrator outcomes.
PATRICK AKOS is a professor in the School of Education at UNC Chapel Hill. He is a former teacher and college and school counselor. His scholarship is informed by positive psychology and humanistic theories and centers on helping students navigate K–12 and career transitions.
THURSTON DOMINA is an associate professor of educational policy and sociology at UNC Chapel Hill. His research focuses on educational policy implementation and its implications for social inequality.
MEGAN GRIFFARD is a PhD student in policy, leadership, and school improvement at UNC Chapel Hill. She has previously worked as a teacher, school administrator, and in policy advocacy.