
Abstract
Research consistently has found teachers’ use of assessment data for instructional purposes challenging and inconsistent. To support teachers’ use of data, we need to develop shared knowledge about how data are and can be used to advance teaching and learning. However, the literature on the specific actions teachers take is inconsistent, creating challenges for both research and practice. As part of a larger project examining data use in instructional decision making, we developed a framework to classify teachers’ instructional responses to data. Then, we used quantitative and qualitative data from educators across 5 districts and 20 schools to evaluate the utility of the framework. This article documents the process and outcomes of our multistage, mixed-methods approach to these tasks. We conclude with the potential uses of this framework for research and practice.
The use of assessment data to inform instruction (often referred to as assessment for learning) has become a more significant component of teachers’ practice globally, with increased availability of assessment data and growing expectations for use under test-based accountability policies (Berry, 2011). Yet evidence suggests that the use of assessment data for instructional purposes (hereafter referred to as data use 1 ) remains challenging and inconsistent, demanding knowledge about both instruction and assessment and the cross section between the two (Cosner, 2012; Gelderblom, Schildkamp, Pieters, & Ehren, 2016; Goertz, Oláh, & Riggan, 2010; Nabors-Olah, Lawrence, & Riggan, 2010; Pierce, Chick, & Wander, 2014; Timperley, 2009; Young, 2006). To support teachers’ data use, educational leaders, instructional support staff, professional development programs, teacher preparation programs, and researchers need to develop shared knowledge about how data are used and can be used in practice to advance teaching and learning for all students. However, both the research and the professional literature to date are inconsistent and diffuse in how data use is conceptualized, which poses barriers to the development of knowledge and practice.
This article presents work completed as part of a larger study of elementary teachers’ use of interim assessment data, conducted to develop a better understanding of the relationship between (1) data organization, analysis, and reporting; (2) the use of data to develop knowledge about student learning; and (3) the types of instructional decisions informed by that knowledge. In order to address these relationships, we first needed to develop a deeper and broader understanding of teachers’ instructional uses of assessment data. Although the literature on teachers’ use of data was highly instructive in our work, we noted that the actions and strategies that constitute use for instructional decision making varied notably, leaving us unsure about how best to capture assessment use in our own research. This article presents our approach to solving this problem, documenting the process and outcomes of our multistage, mixed-methods effort to develop a data use classification framework. In the following sections, we anchor our motivations in the literature, present an overview of our approach, and then describe the methods and results for each phase of work sequentially. We conclude with the potential uses of this framework for research and practice.
Prior Literature
Data Use in Educational Research
Teachers’ use of data is complex, consisting of multiple activities related to analysis, interpretation, and action (Coburn & Turner, 2011; Cosner, 2011a, 2011b, 2012; Datnow, Park, & Wohlstetter, 2007; Goertz et al., 2010; Marsh, Pane, & Hamilton, 2006). Because of this complexity, the literature on data use is diffuse in terms of focus. Numerous studies have examined the context of data use, including the policy environment, the role of district and school leadership, and organizational factors such as routines, norms, and collaboration. Still others attend to the role of data use in improvement processes, such as a cycle of improvement. However, research specifically on teachers’ instructional responses or decisions based on data is just emerging (Coburn & Turner, 2011; Datnow & Hubbard, 2015; Marsh, Bertrand, & Huguet, 2015). Furthermore, as we argue below, few studies have explored how teachers use data across a comprehensive set of instructional decisions.
A review of the literature produces two types of studies of teachers’ instructional responses to data. The first conceptualizes instructional uses in broad categories. Cosner (2011b, 2012) conceptualizes data use on a forward/backward continuum. To this end, teachers’ actions involve a combination of “forward” considerations of future instructional responses, such as student grouping, instructional interventions, and selection of curricular materials, as well as “backward,” reflective examinations of past instructional practice or other aspects of curriculum and instruction that may have contributed to patterns in the data. Farley-Ripple and Buttram (2014) draw on Cosner’s work to better understand the patterns of teachers’ reported data use, framing use as analysis (backward) or action (forward) oriented. Marsh et al. (2015) extend this work, focusing in particular on what they describe as instrumental uses of data, which closely reflects Cosner’s “forward” considerations. Marsh and colleagues describe teachers’ instrumental actions as procedural or surface-level changes (e.g., grouping, reteaching) and changes in instructional delivery (including, e.g., shifts in a single strategy, shifts in broad pedagogical approaches). Schildkamp, Poortman, and Handelzalts (2016) note an enlightenment function, in which data create knowledge that leads to new insights rather than action, which relates to Cosner’s “backward” considerations. These conceptualizations of data use are helpful in establishing the scope of instructional responses or decisions, yet none attempts to fully elucidate the contents of each category.
The second type of study takes what we call a functional approach to describing the instructional uses of data, often examining or listing specific instructional responses rather than categories of responses to data. Survey research often employs this approach, though often articulating different sets of practices and for different types of data. For example, Means, Padilla, DeBarger, and Bakia (2009) capture teacher engagement in 11 instructional responses based on data from the National Educational Technology Trends Study survey. Wayman, Cho, Jimerson, and Spikes (2012) identify 14 specific decisions, ranging from setting schoolwide goals to identifying individual students for remediation. Schildkamp and Kuiper (2010) identify 12 uses, also categorizing them as genuine improvement actions (e.g., personnel decisions, instructional purposes) and unintended responses (e.g., misuse). Hoover and Abrams (2013) surveyed teachers on the use of summative assessments for classroom decisions about pacing, differentiating, reteaching, grouping, and remediating. Each study not only provides insight into educators’ use of data but also examines different, though overlapping, sets of practices.
Several observational studies also adopt a functional approach and have been instrumental in identifying data use practices such as grouping (including “triage” strategies for students on the cusp of proficiency as well as for differentiation; Breiter & Light, 2006; Brimijoin, Marquissee, & Tomlinson, 2003; Ebby, 2018; Nabors-Olah et al., 2010; Park & Datnow, 2017), reflective sense making and inquiry (Blanc et al., 2010; Braaten, Bradford, Barocas, & Kirchgasler, 2018; Garner & Horn, 2018; Riehl, Earle, Nagarajan, Schwitzman, & Vernikoff, 2018), predicting performance on other assessments (Young & Kim, 2010), adjusting curriculum content and pacing (Hamilton et al., 2009; Kerr, Marsh, Ikemoto, Darilek, & Barney, 2006; Nabors-Olah et al., 2010), selecting materials (Evans et al., 2018; Marsh et al., 2015), engaging students in data use (Kennedy & Datnow, 2011; Marsh, Farrell, & Bertrand, 2016), and identifying students for out-of-class support (Marsh et al., 2015; Supovitz & Morrison, 2011). Like survey research, each study has contributed to our knowledge of data use, while often focusing on a narrow or specific data use practice.
Across studies, we find evidence of a range of instructional uses of data, as well as multiple frames for organizing those uses. Nonetheless, there is little alignment or consistency in the work, and it remains unclear whether any current set of practices captures the range of instructional uses. For example, in Hoover and Abram’s (2013) study, nearly half the sample reported using data in ways other than those listed in the survey. These observations create a challenge for the accumulation of research knowledge as well as for supporting data use in practice.
Data Use in Professional Practice
As data use has been the subject of extensive work in policy and practice, numerous professional resources are available to support teachers’ use of data for instructional decision making. We find that here as well there is limited evidence of a shared description of “use” to guide work in schools. Several widely recognized interventions and resources, such as Data Wise (Boudett, City, & Murnane, 2013), TERC’s Using Data (datausesolutions.org), Bernhardt’s Continuous Improvement series (e.g., Bernhardt, 2013), and the Data Teams Procedure (Schildkamp et al., 2018), explicate processes and protocols to support teachers’ engagement with data. Similarly, calls for data literacy among teachers, both in the literature and in policy, highlight the specific knowledge and skills demanded of a data-literate teacher workforce (Mandinach & Gummer, 2016). Some of this work includes specific actions teachers may take based on data. For example, Mandinach & Gummer (2013) include actions such as differentiating instruction, formulating hypotheses, and modifying instruction, alongside a broader set of strategies for using the data, such as drilling down, monitoring outcomes, or using multiple sources of data, which don’t have specific instructional actions associated with them. However, these examples most often reflect approaches to build capacity or cultures for data use, rather than a set of specific actions or instructional decisions that concretize use.
The 2011 Model Standards from InTASC (Council of Chief State School Officers, 2013) are an exception, as they emphasize the role of assessment literacy in teachers’ work and feature assessment use squarely in instructional practice. In the progressions developed to accompany the standards, expectations for Standard 6 include using assessment to understand a learner’s progress, guide planning, help learners examine their own thinking and learning, identify learning needs, and develop differentiated learning experiences. Related performances for other standards indirectly suggest the use of data, including designing and adapting instruction to meet learner needs (Standards 1, 2, 7, 8, and 9), choosing appropriate strategies to facilitate learning (Standards 7 and 8) and for differentiation (Standards 6 and 7), making decisions about pacing (Standard 2), identifying and modifying materials to meet learner needs (Standards 2, 4, 7, and 8), supporting engagement in self-directed learning (Standard 3), recognizing misconceptions (Standard 4), setting and evaluating goals (Standard 7), and evaluating the outcomes of teaching and learning (Standard 9). Though these performances aren’t articulated as a framework for data use and are not often referenced as a foundation for studies of data use, they offer additional examples from the policy and practice sphere and a potential building block for a common framework.
One reason for the lack of an elucidated set of instructional responses across research, policy, or practice is, as noted above, the complexity of data use, which has resulted in a diffuse set of studies, interventions, and guidelines, of which only a small part focus on teachers’ instructional responses in their classroom. A second reason may be that much of what we know about data use to date is observational in nature or context specific. This means that the range of observed instructional responses is limited to those that occur at that point in time in that particular context. Accordingly, we would not expect a single study or program to result in a comprehensive set of responses or decisions. Nonetheless, we propose that such a framework would benefit both research and practice by presenting a set of instructional responses against which observations or practices might be compared (i.e., what is observed vs. what is not observed), promoting shared understandings for both researchers and educators.
The Present Study
For these reasons, we sought to develop and evaluate a framework for understanding teachers’ use of data for instructional purposes. We develop such a framework through a synthesis of the existing literature, with insight from elementary teachers, teacher educators, interim assessment developers, and researchers, and we use both qualitative and quantitative data to assess its ability to capture teachers’ use of data. This framework is not intended to be a definitive guide to understanding how teachers use data for instructional purposes or a statement of how they should use data. Instead, this initial framework should serve as a starting point for developing a shared understanding of teachers’ data use for instruction.
Context of the Study
The present study is situated in a research project conducted between 2014 and 2016 seeking to explore leverage points—or points within a theory of action at which interventions may occur (Marsh, 2012)—between information, actionable knowledge, and instructional decisions among elementary school teachers. The project was independently funded but represents a collaboration between the authors and NWEA born of a shared interest in developing an empirical understanding of teachers’ use of data to inform the work of both parties. NWEA publishes interim assessment tools, specifically Measures of Academic Progress (now MAP Growth, referred to as MAP), a norm-referenced assessment designed to measure student performance and growth. Accordingly, the project specifically focuses on teachers’ use of interim assessment data, reflecting the growing emphasis on and role of such assessments (Abrams, McMillan, & Wetzel, 2015; Datnow & Hubbard, 2015; Farley-Ripple & Buttram, 2014).
The MAP assessment has particular features worth noting in the context of this study, as prior research suggests that the characteristics of assessments may influence how educators interpret and incorporate data into their practice (Davidson & Frohbieter, 2011; Shepard, Davidson, & Bowman, 2011). MAP is administered online and is computer adaptive, producing an assessment generated from a pool of items across grade level, with items assigned to students based on their achievement level and scored on a common scale (Militello, Schweid, & Sireci, 2010). Results are presented in a suite of reports that offer class- and student-level RIT scores 2 for standards; performance range and classifications across instructional areas; prior student performance, growth, and predicted growth based on a normed sample; and a tool that lists skills and concepts for instruction by standard and RIT score range (Davidson & Frohbieter, 2011; Militello et al., 2010). However, MAP does not permit item-level analysis of student responses.
In addition to a focus on MAP, we attend specifically to teachers in elementary grades (typically kindergarten through fifth grade) because teachers are less likely to specialize in a subject area until the middle grades, making MAP’s interim assessments in ELA (English language arts) and mathematics relevant to most elementary teachers’ practice. Below we describe the methods used specifically to develop a classification framework for teachers’ instructional uses of data.
Design
Figure 1 depicts our multiphase mixed methods design, which supports the integration of one or more core mixed methods designs within an overarching methodological framework (Creswell & Plano Clark, 2018). Specifically, we embed a convergent mixed-methods study within an overarching exploratory sequential design. Our mixed-methods study is organized into framework development and evaluation phases. Because of the multiphase nature of this project, we report on the methods, results, and findings for each phase separately.

Complex mixed methods evaluation design.
In Phase 1, we develop a classification framework for understanding elementary teachers’ use of data for instructional purposes, drawing on a range of other sources, resulting in a comprehensive, though not exhaustive, list of potential data-supported instructional practices. In Phase 2, we collect quantitative (QUAN) and qualitative (QUAL) data to evaluate our classification framework. We use a survey (QUAN) to collect and analyze teachers’ reported data use and to evaluate the structure and internal consistency of our organizational structure. We use data from observations of professional learning communities (PLCs) and one-on-one interviews (QUAL) to evaluate the utility and reliability of classifying instances of teachers’ data use. Finally, we integrate the QUAN and QUAL results to improve our classification framework and our understanding of teachers’ data use.
Phase 1: Framework Development
Through this initial phase of work, we sought to answer the following research questions:
What instructional decisions do teachers make using data?
In what ways can we organize these decisions to better understand data use?
Procedures
The framework was developed in a three-stage process that drew on several sources. First, we developed a list of instructional practices. Then, we organized them in a way that supported our conceptual understanding of data use. Third, we sought feedback on the framework.
List of Instructional Practices
In the first stage, the following data sources were tapped concurrently to generate a broad and inclusive inventory: data use research, expertise of the research team, and NWEA.
Data use research
We combed through empirical studies of data use, including the functionally oriented sources discussed above, with particular attention to studies that described teachers’ use of data. While there is a sizeable and growing literature on district- and school-level data use, we found that studies identified many uses that are relevant to teaching and learning but may not be consistent with the decisions teachers make in their classroom (e.g., a principal’s use of data to identify professional development needs). Some examples of data use from the literature include “triage,” or attending to students on the cusp of proficiency (Christman et al., 2009; Nabors-Olah et al., 2010); altering the curriculum sequence (Kerr et al., 2006) or pacing (Hoover & Abrams, 2013); identifying students for out-of class support (Wayman et al., 2012); identifying students’ strengths and weaknesses (Cosner, 2012); and setting student goals (Hamilton et al., 2009; Marsh et al., 2016).
Research team
Our research team consisted of data use scholars, program evaluators, and former educators. We developed a Google Doc to brainstorm the ways in which teachers use data for instruction, based on observation, knowledge of the literature, personal experience, or anecdote. Examples of data use from the research team include celebrating student improvement, selecting students for enrichment or special programs, and checking alignment with the curriculum.
NWEA
Formal collaboration with NWEA enabled us to work with their staff and resources throughout the project. We invited NWEA professional developers to contribute to our list and used one of their evaluation instruments (the MAP Learning Inventory, MLI) as a source, as it asked teachers about intended uses of the assessment system. We also accessed the NWEA community discussion board and searched for members’ referencensto instructional decision making. Examples of data use from NWEA include developing learning objectives (MLI survey), predicting proficiency (MLI survey), planning for the upcoming school year (community discussion board posting), and identifying skills students are ready to learn (MLI survey).
The lists generated by these three sources yielded an initial inventory of more than 50 data use practices. In many cases, instructional decisions were mentioned by multiple sources, though not always using the same terms. In other cases, practices were excluded from our list because they did not adequately fall within the scope of our work. For example, sharing data with parents was ultimately excluded because it did not deal with the use of data for instructional purposes but rather represented a transaction of information, with no clear tie to instructional decision making. The research team identified duplicate items and items with poor fit, leaving a list of 40 instructional decisions.
Conceptual Organization of the List
We next sought to organize the list conceptually, drawing on previously discussed literature that categorized use. Several studies used the distinction between what was taught and how it was taught (Blanc et al., 2010; Farrell & Marsh, 2016; Goertz et al., 2010; Marsh et al., 2015; Nabors Olah et al., 2010), which we interpreted as pertaining to curriculum (what) and instruction (how). However, much of our list did not clearly fit within those two categories, requiring the development of new categories. We began by grouping in ways that were conceptually intuitive (e.g., decisions about placement or grouping) as well as by the scope or breadth of the decision, or “grain size.” For example, we felt that “goal setting” captured multiple activities, so we grouped more specific types of goal setting (e.g., for individualized education programs, student goal setting) within the larger category. This process yielded a two-level framework, which we describe as practices (finer-grained activities, n = 36) and actions (categories of activities, n = 11), with the 40 initial decisions retained as either practices or actions and additional categories developed at the action level.
However, the research team felt that there was still a qualitative difference among the set of actions, and so we returned to the literature for further guidance. We were informed by Cosner’s (2012) temporal conceptualization of a forward/backward distinction as well as our prior use of analytical versus action-oriented activities (Farley-Ripple & Buttram, 2014). Neither framing fully suited the emergent framework, so we turned to a typology more commonly found in the study of knowledge utilization that classifies use as instrumental or conceptual. Instrumental uses refer to the use of evidence to make a choice or decision (Caplan, 1979; Rich, 1977). Conceptual uses refer to the use of evidence in ways that shape thinking or understanding (Weiss & Bucuvalas, 1980). In the current policy environment, data are a primary form of evidence for educators, and data use research has employed these conceptualizations to understand school and district data use (Coburn & Talbert, 2006; Coburn, Toure, & Yamashita, 2009; Firestone & González, 2007; Marsh et al., 2015; Murnane, Sharkey, & Boudett, 2005; Schildkamp et al., 2016; Van Gasse, Vanhoof, & Van Petegem, 2018). We used the conceptual and instrumental categories to define a third level of the framework, which we describe as the domain level. Two actions were retained as “other,” as the research team could not come to a consensus about their domain: goal setting and celebration.
Feedback on the Framework
Once the three-level framework had been developed, we collected two types of feedback from practitioners to ensure that our framework was comprehensive. We first attended an NWEA practitioner conference and prepared a one-page handout with the framework and designated spaces for comments and feedback. Second, we conducted interviews with two teachers nominated as frequent MAP users by school administrators with whom the researchers had relationships. From this feedback, we moved goal setting into the instrumental domain and celebration into the conceptual domain, eliminating the need for “other” as a domain. Minor wording suggestions were also accommodated. No additions or deletions to the framework were suggested.
Products
Table 1 presents the three-level framework at the end of the iterative development process. The first level of classification (at the left), or domain level, is the broadest, capturing instrumental and conceptual frames for uses of data. The second level, or action level, is narrower, attending to categories or types of actions that might be informed by data, in either instrumental or conceptual ways. Instruction is also composed of a second set of action categories, including planning for instruction, determining what strategies to use for instruction and for grouping or otherwise identifying students to receive particular types of instruction or supports. Though these are conceptually within the larger set of activities associated with “instruction,” they are also of similar grain size to other dimensions of our framework and are therefore retained at the action level of our framework. The third level, or practice level, pertains to specific instructional responses or practices that data—interim assessments in particular—may inform. This third level is the smallest grain size we sought to examine in our work.
Classification Framework (Phase 1)

Note. IEP = individualized education program; MAP = Measures of Academic Progress; PLC = professional learning community.
Phase 2: Convergent Mixed Methods Framework Evaluation
In this phase, we used QUAN and QUAL data to evaluate and revise our classification framework based on the extent to which it reflects patterns in teachers’ data use. The Phase 2 section of Figure 1 depicts our convergent mixed methods design. Convergent designs improve researchers’ understanding of research problems by integrating independent, complementary strands of QUAN and QUAL findings (Creswell & Plano Clark, 2018; Morse, 1991). Specifically, we collect and analyze QUAN data via online survey and QUAL data from PLC observations and one-on-one, semistructured interviews. Then, we merge our QUAN and QUAL findings to evaluate our classification framework and improve our understanding of teachers’ data use. We seek to answer the following research questions in this phase:
To what extent is our framework consistent with teachers’ self-reported and observed data use?
How can we use quantitative and qualitative methods to improve our classification framework?
QUAN Evaluation
Procedures
The research team collected QUAN data in fall 2014 and 2015 as part of the larger project in which this study is situated. We developed 36 survey items to capture the extent to which teachers use MAP data to support each instructional practice. Items were presented within a matrix that captured engagement in the practice and extent of MAP use. To capture engagement in the practice, the survey asks participants to indicate those practices in which they do not engage as part of their instruction. Selecting this option precludes responding to subsequent response categories for that practice. To capture the extent of MAP use, the survey asks participants to indicate the degree to which each practice is informed by MAP data, along a 6-point Likert-type scale ranging from Not at all to Very great extent.
The online data use survey was administered using the Qualtrics platform in fall 2014 to all staff in 4 elementary schools in one district, and to staff in 14 elementary schools in three districts and 1 charter school in fall 2015. No substantive changes were made to items pertinent to the current study between administrations, and data were pooled across the two sampling periods. Response rates ranged from 3% to 100% by school, with an overall response rate of 41% (n = 205). We purposefully sampled schools to reflect diversity of location, populations served, and organizational characteristics such as size and governance. The school sample included schools serving prekindergarten or K–5 students, with two serving up to sixth graders and two serving up to fourth graders. The average school enrollment was 393 (range: 101–563). Schools served diverse populations, averaging 59% eligible for free or reduced-price lunch (range: 26% to 74%) and 22% students of color (range: 1.1% to 96%). For the purposes of the present analysis, we include responses from participants who were primary classroom teachers (including core subject, related arts, and special education; 86.8%) or instructional specialists working primarily with children (13.2%) and who completed the section of the survey about instructional decision making using MAP data, for 188 usable responses. Mean experience in education was 11.6 years, with 6.6 years in the current school.
Analysis
We conducted three quantitative analyses. First, we generated descriptive statistics on the extent to which teachers reported using data for the 36 practices, as well as the extent to which they distinguished between uses in their responses. We interpret these results as an indicator of the degree to which teachers engage in these data uses, and therefore as evidence that the underlying framework accurately reflects a range of data uses indicative of classroom practice. Second, we assessed the extent to which patterns in participants’ self-reported use of MAP data to engage in instructional practices are consistent with our classification framework via confirmatory factor analysis (CFA), using the Mplus Version 7.4 mean- and variance-adjusted weighted least squares estimator. We evaluated model fit through root mean square error of approximation (RMSEA), in which values below .08 indicate reasonable fit (Hu & Bentler, 1999; Kenny, 2015), as well as comparative fit index (CFI) and Tucker-Lewis index (TLI), for which values greater than .90 indicate good fit (Bentler & Bonett, 1980; Hu & Bentler, 1999; Kenny, 2015). Last, we computed Cronbach’s alpha to assess the internal consistency of each action-level classification.
QUAN Results
In Table 2, the results indicate that a sizeable number of, but not all, teachers engage in the practices that constitute our classification framework. Additionally, the mean for all practices favors the more useful end of the 6-point scale. This suggests that MAP is considered useful for a broad range of instructional practices, but it also likely reflects response bias and a recognized tendency to respond on the more positive end of a scale, particularly when a socially desirable response may be perceived. To better account for teachers’ tendency to rate use more extensively across the board, we computed respondent-centered variables by subtracting each teacher’s average response for extent of use from each response. This allows us to understand the value of MAP to each practice, relative to the respondents’ own overall self-reported use. Figure 2 presents boxplots of the results, with the average indicated by the dark horizontal lines within each box. The interquartile range box represents the middle 50% of the data. The whiskers extend from either side of the box, representing the ranges for the bottom 25% and the top 25% of the data values, excluding outliers. If respondents did not distinguish between practices in their responses, we would expect means to be close to 0, with a narrow interquartile range and short whiskers. In contrast, Figure 2 reveals variation in the extent to which teachers report using MAP data, including practices for which MAP is relatively more and less useful (e.g., identifyinterv and inquiry, respectively). A one-sample t test confirms that the means for each practice were statistically significantly different from 0 (p < .05) for all but five practices (activityRIT, diffplan, recgifted, talkimplications, and teamgoals). We interpret these results as an indicator of the degree to which teachers differentiate the extent of MAP use in their instructional decisions within the context of this framework.
Descriptive Statistics on Teacher Responses About MAP Extent of Use for Instructional Decision Making
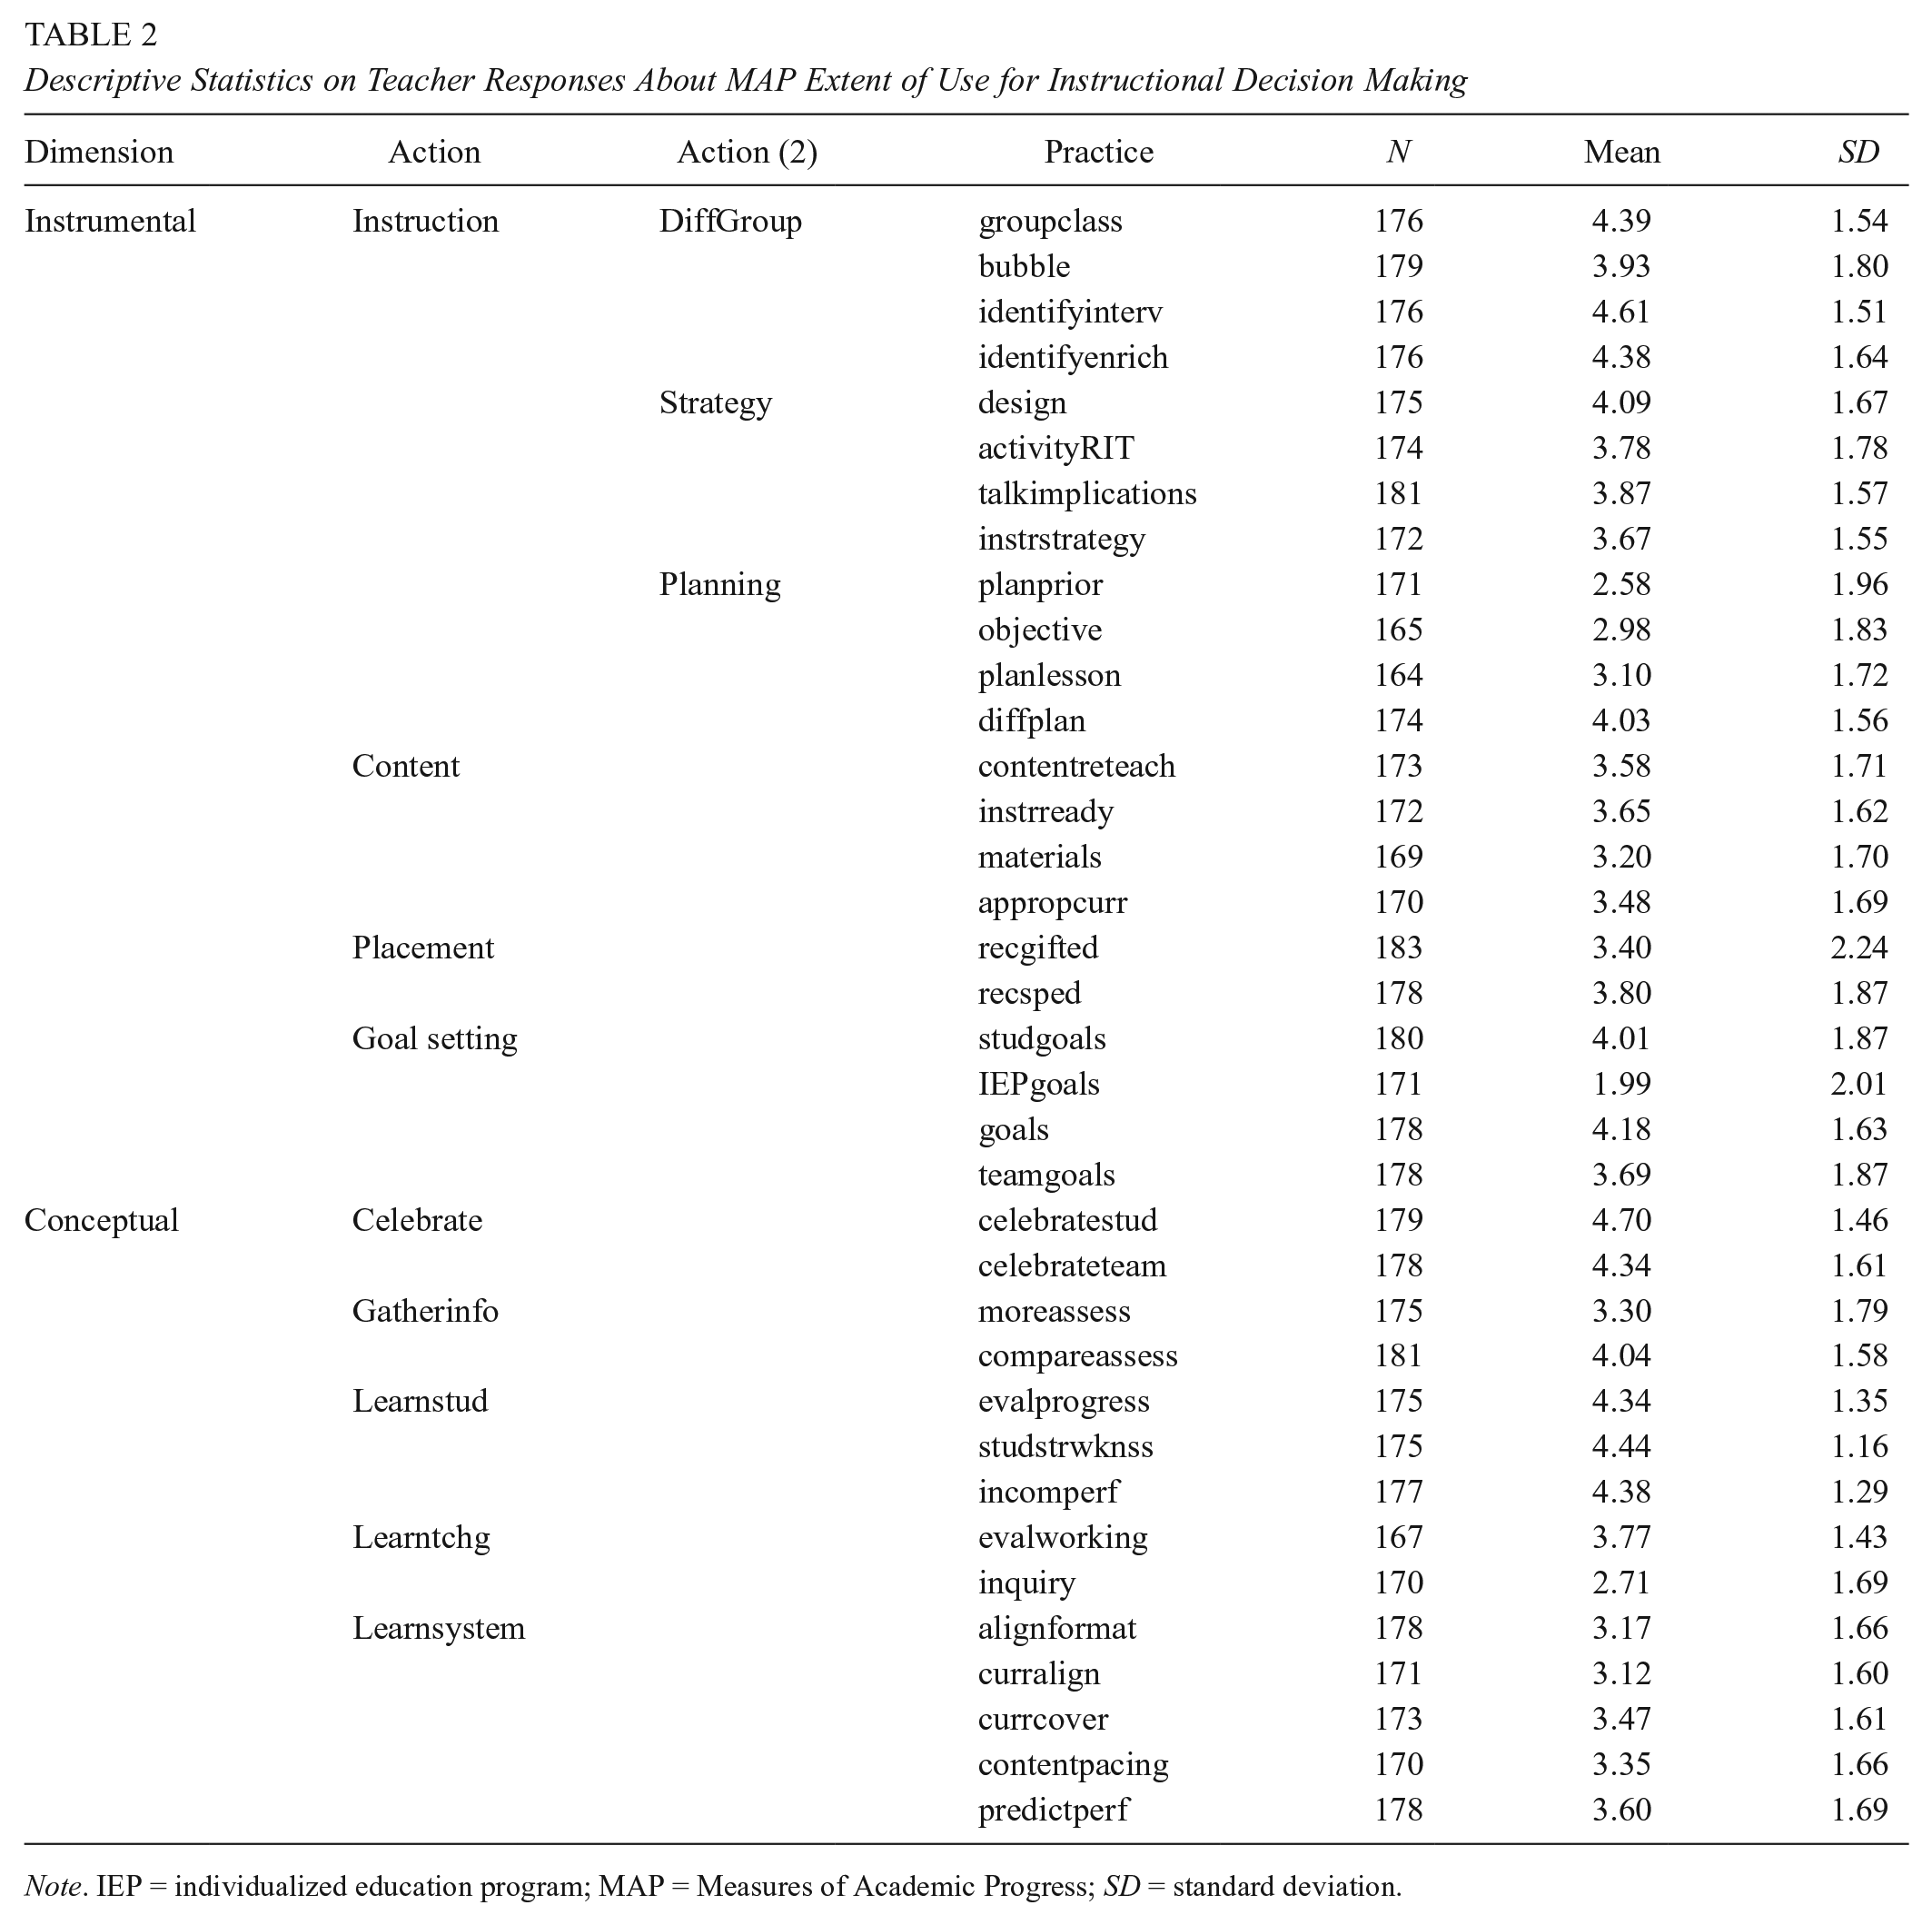
Note. IEP = individualized education program; MAP = Measures of Academic Progress; SD = standard deviation.

Mean teacher-centered reports of the extent of Measures of Academic Progress (MAP) data use in instructional decisions.
Next, we fit a series of higher-order CFAs in two stages: practices constituting actions and actions constituting domains. In the first stage, we identified the factors structure between participants’ use of MAP data to inform 36 instructional practices constituting 11 actions, 3 of which further constitute a higher-order action. The initial model, based on our a priori classification framework (see Table 1), demonstrated reasonable relative fit (CFI = .93, TLI = .92) but exceeded the desirable absolute fit criterion (RMSEA = .10). We explored modification indices and factor loadings to evaluate the sources of model misspecification and found that participants’ use of MAP informed differentiated lesson plans loaded negatively on our theorized construct (planning) and had the highest modification index for loading on an alternate construct (grouping and differentiation). On review, we recognized that the item was more consistent with other items classified as grouping and differentiation than with those classified as planning. Accordingly, we reclassified participants’ use of MAP data to inform differentiated lesson plans within grouping and differentiation.
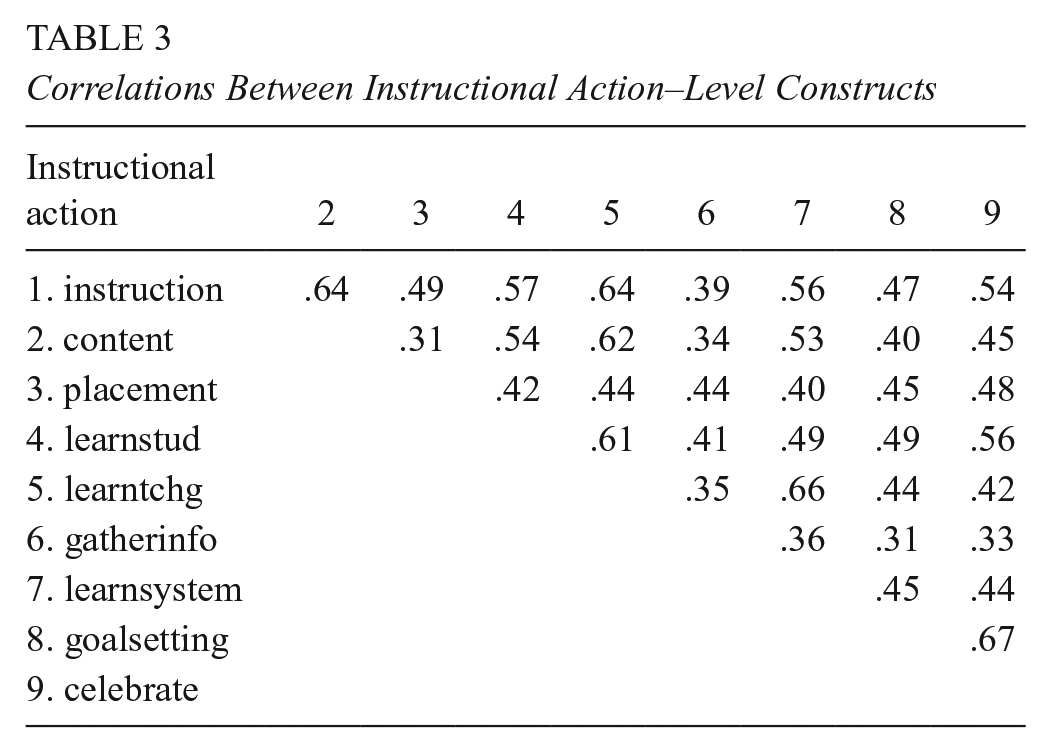
Our revised model demonstrated acceptable absolute and relative fit (RMSEA = .08, CFI = .95, TLI = .94) and served as the basis of subsequent higher-order CFA modeling. Table 3 presents the correlations between the nine action-level constructs. On the low end, content and placement as well as gathering information and goal setting have moderate positive correlations (r = .31). On the high end, learning about teaching and the system as well as goal setting and celebration have strong positive correlations (r = .67 and r = .66, respectively). Instructional action–level correlations suggest that each action measures a unique data use construct, and the relationships between those constructs are largely consistent with our theorized structure of how instructional actions constitute overarching domains.
Correlations Between Instructional Action–Level Constructs
In the second stage, we identified the factor structure between the nine instructional actions and our two theorized domains: instrumental and conceptual. The initial model, based on our a priori classification framework (see Table 1), demonstrated reasonable relative fit (CFI = .94, TLI = .93) but exceeded the desirable absolute fit criterion (RMSEA = .09). We explored modification indices and identified two sources of model misspecification, consistent with our Phase 1 consideration of both instrumental and conceptual aspects of goal setting and celebration. Specifically, the sources of model misspecification suggested that (1) participants’ use of MAP data for goal setting was more consistent with conceptual data uses than with instrumental and (2) there is a relationship between participants’ use of MAP data for goal setting and celebration beyond that modeled in our framework. Accordingly, we reclassified goal setting as conceptual and modeled the correlation between its measurement residual and that of celebration.
The resulting model demonstrated acceptable absolute and relative fit (RMSEA = .08, CFI = .95, TLI = .94). The final model with standardized factor loadings is depicted in Figure 3. Of note, a strong positive correlation between our two highest-order constructs (instrumental and conceptual; r = .94) has potential implications for multidimensionality at the domain level. Toward this end, we fit a nested model with a single highest-order construct (ostensibly, data use). Whereas the unidimensional model demonstrated acceptable absolute and relative fit (RMSEA = .08, CFI = .94, TLI = .94), our multidimensional classification framework–based model significantly improved model fit (χ2 = 16.35, df = 1, p < .001). Although this provides preliminary support for our theorized factor structure, we recognize that the strong correlation between domain-level constructs may also reflect limitations in the design of our assessment or social desirability bias, warranting further quantitative validation of our highest-order constructs.

Higher-order confirmatory factor analysis.
Last, we computed Cronbach’s alpha statistics to indicate the internal consistency of the action-level categories of our framework. The results in Table 4 indicate a moderate level of internal consistency for each category. All but one are above the .7 threshold, which might be considered acceptable in the social sciences (Nunnally & Bernstein, 1994).
Internal Consistency of the Framework

Note. SD = standard deviation.
QUAL Evaluation
Procedures
The research team developed interview and observation protocols designed to capture information about each of the leverage points that guided the larger research study. The research team collected qualitative data in fall 2016 from three of the participating schools as part of the mixed-methods design of the larger study. Sites were selected based on stability of leadership (i.e., the principal had not changed since the survey was administered), number of respondents and number remaining in the school, and logistical considerations. Each site was visited twice.
The observation protocol was designed for naturalistic observation rather than participant observation. Field notes included prompts to describe physical space and materials as well as running notes of activity and dialogue. No prompts addressed elements of the classification framework. We conducted two site visits per school. On the first visit, we observed PLC meetings (in these schools, they were done by grade level) in which fall MAP assessments and other data were reviewed collaboratively. In both schools, the principal participated in these meetings, which lasted between 40 and 60 minutes per grade level. The research team assumed the role of observers and took extensive field notes on the meetings.
On the second visit, we conducted interviews with teachers who had participated in the survey and/or the PLC meetings. Interview protocol items focusing on instructional decision making began generally and became increasingly specific about which MAP data are useful and how they are used. Because there are 36 practices in our framework, we organized our prompts at the action level and narrowed in on two to three actions to ensure some depth to responses and to increase the probability of being able to identify codes at the practice level. The research team identified in advance which action items would be the focus of the questions for each teacher, such that the data collected covered all 11 instructional actions across interviews. Interviews lasted approximately 40 minutes and were audio recorded and transcribed verbatim for analysis.
In total, we observed 18 PLC meetings and interviewed 18 teachers. We coded the interview and observation data using the classification framework as an a priori guide. The research team independently coded a sample of the qualitative data for the second or action level of the framework in NVivo 11. Reliability analyses were conducted, and for codes for which we did not achieve 80% agreement, we discussed examples, clarified the definition of the code, and recoded until 80% agreement was achieved. We then applied practice-level codes to excerpts within the action codes. We use the results of this analysis to assess the extent to which data uses were observed or reported in the qualitative data and the extent to which our categories of practice were useful for describing the data.
Products/Results
The research team was able to reliably apply codes for all 11 actions and 35 of the 36 practices within the framework. Examples of responses and observations for the action level are presented in Table 5.
Classification Framework for Instructional Responses to Data

Note. Italicized excerpts are from observation data, and regular text is from interviews. IEP = individualized education program; MAP = Measures of Academic Progress; PLC = professional learning community.
However, we faced four challenges in applying our framework qualitatively. First, teachers did not always explicitly connect their instructional decisions to data. They talked about making decisions on what to focus instruction on or how to group students, without tying these choices to specific data. For example, one teacher explained how she decides what skills to focus on in her class and how she groups students for extra support. She made evaluations of where these students are but does not articulate a specific data source or an explicit use of data in her evaluation: So it just kinda just depends. Some of them like Kieran and Aria, I mean, they’re low in everything, which is terrible. But I’m like you know what? We’re gonna do numbers and operations in class first, so work on that. I know we’re gonna do informational text, and vocabulary is a big part of that. So I’ll have them work on those two.
A second challenge focused on drawing distinctions between deciding what to teach (content) versus how to teach (strategy). This emerged as a challenge at both action and practice levels. For teachers, these choices are so closely tied that they seem to refer to them as a single practice, as illustrated in the quotation below:
We have a literacy library here. That’s something that’s new that we got at the end of last year, so it’s all leveled. And it’s got the skill, so if I know that we’re working on main idea or the kids need summarizing or inferences, I can go. And I know that it’s on their level, and it’s all laid out. It’s got the organizers that they need. Like, it’s step-by-step just—it’s got the phonics built in. It’s got the extended activities, how are we thinking questions. Like, it’s got everything that you need to take them through a few days of, like, a guided reading lesson.
The adoption of computer-based instructional programs, such as Compass Learning, contributes to the links between content and strategy in our observations. These programs are used as both an instructional strategy and a way of identifying the content to be taught. The research team revisited what to teach (content) and how to teach it (instructional strategies) multiple times as it was difficult to distinguish between them in the observational data.
Relatedly, an analysis of action-level codes revealed that 36 of the 38 references to planning were also coded for content, instructional strategies, or grouping. In other words, references to planning lessons were intricately tied to decisions about what to teach, how to teach it, and to whom to teach it. This was most relevant to the practice codes of planning for differentiation and planning instruction for lessons or units. However, we were unable to observe instances of planning lesson objectives and observed planning prior to the school year only once in our data, which we attribute in part to limitations of our data collection strategy. Because of the partial observation of practices within this action component of our framework, additional studies are needed to understand instructional planning as a component of teachers’ data use.
Third, we found that it was difficult to distinguish among learning about students, learning about the system, and gathering information. Teachers often described the additional information they use to learn about their students, including talking to other teachers, parent conferences and interactions, classwork, and other assessment evidence. Similarly, other types of information were gathered to inform what we observed to be efforts to learn about the system (e.g., standards, curriculum, state testing). We eventually opted to retain learning about students (when teachers were seeking information about individual students) and learning about the system (when they were seeking information about their classroom, grade, school, or district) as action-level codes. We relocated gathering information to the practice level for both of these actions and adopted a more inclusive definition, allowing our codes to capture the collection of information other than assessment data.
Last, we note that the interview protocols were designed to solicit information about action-level behaviors among educators, which means that we were able to apply codes to some practices because we had asked directly about their corresponding action. This likely inflated our ability to detect some practices. Observations were more authentic opportunities during which to identify practices, and therefore may be a more robust evaluation of the utility of the practice level of the framework for coding qualitative data. We observed instances of 26 of the 36 practices in our observation data. However, the observations were of PLCs, not instructional practice or planning specifically, so we did not anticipate that all practices would be evidenced in those data.
Integration of QUAL and QUAN
Qualitative and quantitative data analyses were conducted in parallel, and each yielded results that suggest adjustments to the framework, addressing the second research question in this phase of our study. We integrate these results by exploring the extent to which those findings are evidenced across the qualitative and quantitative analyses.
Relationship Between Goal Setting and Celebration
CFA indicated a better model fit with goal setting categorized under conceptual use of data, as well as when we permitted correlation among the errors associated with celebration and goal setting. This change is conceptually coherent as celebration reflects an achievement of goals. Using a matrix analysis of the qualitative data, we found that 3 of the 14 celebration codes were also applied to goals (21%), which supports this link. We further explored where goal setting would best be located within our framework. Again, using a matrix analysis, we find that goal setting codes were applied 24 times to excerpts also coded for various conceptual uses but only 12 times to excerpts coded for instrumental uses. Our interpretation of these results is that goal setting straddles the instrumental and conceptual line but may be a better fit for conceptual uses of data, confirming the results of our quantitative analysis.
Simultaneity of Content and Instructional Strategy Decisions
Coding for content and instructional strategies presented challenges in this study. As described above, the data appeared to be nearly simultaneous in teachers’ instructional decision making as articulated in interviews and observations. Using the quantitative data from the CFA, we indeed find that factor scores on these two actions are highly correlated (.89, p < .001). However, these factors differ in their relationship to factor scores for other actions. We find that these two types of instructional actions are related but conceptually distinct, which would not require a change to our framework.
Separation of Planning From Other Actions
Qualitative data demonstrated a strong relationship between instructional planning and content, instructional strategies, and grouping and differentiation at both action and practice levels, which raised questions about the planning component of the framework. However, CFA results suggest that teachers are able to differentiate their responses to these practices. Furthermore, the correlation among these factors is between .7 and .8, indicating a strong relationship but not a single construct. We therefore retain planning as an action within the framework but find this to be an area in need of further inquiry.
Location of Planning for Differentiation
Relatedly, CFA results revealed that although planning for differentiation was originally conceptualized under planning, model fit improves when it loads onto grouping and differentiation. This finding suggests that planning for differentiation is more closely related to grouping decisions, according to teachers’ responses, than planning. We turned to our qualitative data to examine these relationships. Planning for differentiation was evidenced 13 times in the data, with 12 references also coded under grouping and differentiation. Although this is not evidence that there are no planning components in differentiation, we found no evidence to contradict the results of the CFA. As such, we modified the location of planning for differentiation in our framework.
Relocating Decisions to Gather More Information
During the process of coding data, the research team found that the action of gathering more information often pertained to either learning about students or learning about the system, making it more appropriate for the practice level of our framework. We tested this within our CFA framework but found that such a change decreases model fit. Nonetheless, gathering information had among the lowest internal consistencies of our scales and among the lowest factor loadings on conceptual uses of data, which could signal an opportunity for framework modification pending further research.
Implications and Applications
We consider this work to be a first step in developing a shared framework for teachers’ instructional responses to data. In Phase I of our work, we drew on prior approaches to organizing uses of data (e.g., Cosner, 2011a, 2011b, 2012; Farley-Ripple & Buttram, 2014; Marsh et al., 2015) and on prior surveys of broader uses of data (e.g., Hoover & Abrams, 2013; Means, Padilla, & Gallagher, 2010; Schildkamp & Kuiper, 2010; Wayman et al., 2012). Our results both confirm the value of these approaches and extend them. Quantitatively, we find that the framework is useful in capturing teacher practices and actions in which data play a role. Findings reveal that elementary teachers engage in a range of activities and are able to relate variability in the role of data, MAP in particular, in those activities. Furthermore, integration of qualitative and quantitative data supports the applicability of the framework as designed, with a few modifications.
Our initial motivation for this task was selfish; to accomplish our research goals, we needed a more comprehensive way of thinking about “use” than we found in the literature at the time. However, we argue that such a framework is broadly beneficial to both research and practice, in ways we elaborate on below.
Applications in Research
Growing attention to teachers’ instructional responses to data has produced valuable insight, from both qualitative and survey work. However, we found little overlap among studies in the specific uses that were identified or explored. This disconnect creates barriers for the field, limiting comparisons that ultimately deepen our understanding of practice, and the absence of that understanding renders researchers unable to truly evaluate the promise of data use for school improvement at scale. We know from the study of disciplines and knowledge that common language and conceptual understandings are a foundation for academic disciplines, for discourse within and across disciplines, and for the accumulation of knowledge (Bridges, 2006; Century, Rudnick, & Freeman, 2010). They further enable a common research agenda and coordinated strategies that advance knowledge and respond to developments in the field (Hallinger, 2011; Ogawa, Goldring, & Conley, 2000).
We offer this framework as a starting point for developing a shared understanding within the field and encourage its use in the conceptualization and design of future research. Conceptually, the framework offers a means of organizing what we know about teachers’ instructional decision making based on data. In particular, the domain and action levels are helpful in organizing constructs for reviews of the literature on data use and for making connections with other fields in which similar constructs are offered (e.g., knowledge utilization and evidence use, as described earlier). With respect to design, we have empirically demonstrated its utility in quantitative methods as well as in qualitative inquiry. It is therefore well suited for incorporation into survey research on data use, an example of which is provided in this study, and as both an a priori coding framework and a tool for crafting interview or observation protocols.
Applications in and With Practice
Advancing the field of study is but one purpose of developing a common framework. As noted earlier, common interventions and policies similarly adopt varied approaches but rarely explicate what data use might look like in teachers’ classroom practice. Our first inkling that our approach may be useful beyond our own work came in the feedback phase of development, when one educator, a coach, said that she wanted to keep a copy to use with her teachers. We have since found that the framework is a helpful organizing tool for discussions among educators and between researchers and practitioners. For example, our collaborators at NWEA have created a protocol to facilitate school and district conversations about their expectations for data use and reflections on actual data use. We modified this approach in a recent presentation at the Association for Supervision and Curriculum Development’s Empower 19 conference (Farley-Ripple, Jennings, Jennings, Tarasawa, & Hegedus, 2019), providing a simple tool based on the framework and asking participants to reflect on what they think should be happening in their classrooms versus what they think is actually happening. This application of the framework is an opportunity to promote reflection on practice and to clarify and align expectations for data use in the classroom, which in turn can be used to shape professional learning opportunities or adjust school or district assessment policy.
Furthermore, we note that use of a common framework can help bridge gaps between research and practice and advance evidence-based change in schools. Practitioners turning to the research on data use to guide improvement efforts would find a wide range of practices and approaches to consider. If the applied study of data use is intended to support and improve the use of data in the service of student learning, we, again, need to develop shared understandings to facilitate communication and collaboration. We view this framework as a step toward this goal. As Heifetz, Linsky, and Grashow (2009) note, Shared language is important in leading adaptive change. When people begin to use the same words with the same meaning, they communicate more effectively, minimize misunderstandings, and gain the sense of being on the same page, even while grappling with significant differences on the issues. (p. 9)
Researchers globally have worked to develop interventions and supports for teachers’ use of data, and schools continue to support in developing data-literate teachers. A practical framework can help members of both communities develop a common understanding through which goals, initiatives, and outcomes can be negotiated.
The work described here is merely intended as a first step, a first attempt at creating, evaluating, and applying a framework that might serve the aforementioned purposes. Findings from this work focus on the extent to which teachers report the use of MAP data for this set of decisions, and the results are promising. However, significant additional work is warranted. This study explored the use of a particular assessment with particular features that prior research has demonstrated to shape use in the classroom (Davidson & Frohbieter, 2011; Farley-Ripple, Jennings, & Jennings, 2018; Militello et al., 2010; Shepard et al., 2011). Examining the extent to which these dimensions, actions, and practices hold up, should be revised, or should be expanded for other types of assessment is an important next step. Furthermore, there is a need to consider this framework within the larger context of the data use movement, which is widely acknowledged to include many more types of information than assessment data. We also see integration with other frameworks on data use, such as data literacy (Gummer & Mandinach, 2015), InTASC standards (Council of Chief State School Officers, 2013), as well as current interventions, as productive moving forward. This work is needed to enable the field to move forward in understanding the impact of data on classroom instruction and to more clearly identify and evaluate the role of data in the myriad choices teachers make about curriculum and instruction. Such knowledge is ultimately valuable in informing data use interventions and professional development. We hope that in presenting this work we can initiate dialogue that extends and improves our classification framework as well as encourage its use to improve the use of assessment data for student learning.
Footnotes
Notes
Authors
ELIZABETH N. FARLEY-RIPPLE is an associate professor of education at the University of Delaware. Her research focuses on evidence-based decision making in education, including the role of research and data in school improvement.
AUSTIN S. JENNINGS has a PhD in education with a specialization in evaluation, measurement, and statistics from the University of Delaware. His research interests lie in using mixed methods to understand teacher decision making, including the role of data use in instruction.
JOAN BUTTRAM is a retired faculty member in education at the University of Delaware. Her expertise lies in the evaluation of programs and policies in a range of educational contexts.