
Abstract
Perhaps more than at any other time in history, the development of mathematical skill is critical for the long-term success of students. Unfortunately, on average, U.S. students lag behind their peers in other developed countries on mathematics outcomes, and within the United States, an entrenched mathematics achievement gap exists between students from more highly resourced and socially dominant groups, and minority students. To begin to remedy this situation, educational researchers have created instructional interventions designed to support the mathematical learning of young students, some of which have demonstrated efficacy at improving student mathematical skills in preschool, as compared with a business-as-usual control group. However, the degree to which these effects last or fade out in elementary school has been the subject of substantial research and debate, and differences in scholarly viewpoints have prevented researchers from making clear and consistent policy recommendations to educational decision makers and stakeholders. In this article, we use a relatively novel statistical framework, Dynamic Measurement Modeling, that takes both intra- and interindividual student differences across time into account, to demonstrate that while students who receive a short-term intervention in preschool may not differ from a control group in terms of their long-term mathematics outcomes at the end of elementary school, they do exhibit significantly steeper growth curves as they approach their eventual skill level. In addition, this significant improvement of learning rate in elementary school benefited minority (i.e., Black or Latinx) students most, highlighting the critical societal need for research-based mathematics curricula in preschool.
Keywords
In today’s increasingly technology- and information-based society, mathematical skills are critical to all students’ long-term economic and social success (Jang, 2016). Consequently, the mathematical development of young children is currently seen as a key indicator of our society’s readiness to meet the challenges of the future, a viewpoint that has been highlighted in scholarly research (Clements & Sarama, 2011), policy reports (Ginsburg, Lee, & Boyd, 2008), and even the popular press (National Public Radio, 2017). Unfortunately, current evidence suggests that U.S. students—especially students from traditionally underrepresented and underresourced groups—do not exhibit similar mathematical achievement as their same-age peers in other industrialized countries around the world (Mullis, Martin, Foy, & Arora, 2012). In light of this wide-reaching concern, educational researchers have worked to develop instructional interventions to improve the mathematical ability of preschool aged students, some of which (e.g., Building Blocks, Clements & Sarama, 2007; Clements, Sarama, Wolfe, & Spitler, 2013; Sarama, Clements, Wolfe, & Spitler, 2012) have demonstrated the capability to significantly improve mathematical outcomes, with particularly promising findings for groups of students that have been historically underrepresented in mathematically oriented professions (e.g., African Americans; Clements, Sarama, Spitler, Lange, & Wolfe, 2011; Schenke, Nguyen, Watts, Sarama, & Clements, 2017).
Given the demonstrated efficacy of these interventions, a further question arises: If an instructional intervention has improved a young child’s mathematical achievement in preschool, what does that imply for the trajectory of their mathematical development throughout elementary school? Do those students who began elementary school ahead of their peers in math retain their advantage over the subsequent years? How does the long-term effect of an instructional intervention interact with other salient student background characteristics (e.g., sex, race/ethnicity)? The answers to these questions have wide-reaching policy ramifications, but contradictory or unclear findings within the mathematical development literature currently preclude the formulation of meaningful policy recommendations related to early childhood mathematics education (Bailey, Duncan, Watts, Clements, & Sarama, 2018; Cobb & Jackson, 2008).
That is, some studies indicate that benefits from preschool instructional intervention—in comparison to a control group that did not receive the intervention—do not persist; that is, that effect sizes “fade” (Administration for Children and Families, 2010; Leak et al., 2012; Natriello, McDill, & Pallas, 1990; Preschool Curriculum Evaluation Research Consortium, 2008; Turner, Ritter, Robertson, & Featherston, 2006). Such reports reify the treatment effect of an intervention (measured via an effect size statistic) as an entity that would ideally persist perpetually throughout student academic development. Such a perspective conceptualizes students’ intervention-related gains in comparison to their control-group peers as a static object carried by the students who would ideally continue to lift the intervention-group students’ achievement above the control group forever. However, intervention effects are, by the very definition of an intervention, exceptions to the normal developmental course for these students in their schools. Alternatively, interventions may provide students with new concepts, skills, and dispositions that temporarily change the trajectory of the students’ educational course. Because the new trajectories are exceptions, multiple processes may vitiate their positive effects over time, such as institutionalization of programs that assume low levels of mathematical knowledge and focus on lower level skills and cultures of low expectations for certain groups (e.g., kindergarten and first-grade instruction often covers material children already know even without pre-K experience; Carpenter & Moser, 1984; Engel, Claessens, & Finch, 2013; Van den Heuvel-Panhuizen, 1996). Left without continual, progressive support, children’s nascent learning trajectories may revert to their original course. In contrast, major benefits from a preschool intervention may also be detectable via a close examination of student growth trajectories: A hypothesis that is currently untested in the relevant literature.
To address this research and policy issue, student learning trajectories in mathematics must be conceptualized as an ongoing phenomenon: Students were improving on their mathematical skills at a particular rate before the intervention, the intervention occurred, and then students continued to learn math for years following the intervention. In the ensuing years, students may learn new material at an improved (e.g., more rapid) rate as a result of the earlier intervention, but also possibly not (Campbell, Pungello, Miller-Johnson, Burchinal, & Ramey, 2001; Grimm, Ram, & Hamagami, 2011). In this way, the shape of student growth trajectories in mathematics over the course of elementary school may be conceptualized as meaningful evidence of the efficacy of a preschool intervention to affect the future learning of students.
In this study, the effects of a mathematics instructional intervention, administered during preschool, on the student-specific nonlinear growth trajectories of mathematical ability through elementary school will be systematically examined. Specifically, data are drawn from a large-scale randomized control trial that was developed as part of an evaluation of a model of scale up that included the Building Blocks curriculum in preschool, with a highly diverse and majority low–socioeconomic status sample of students also being assessed on their mathematical ability in kindergarten, first, third, fourth, and fifth grade (Clements et al., 2013; Sarama & Clements, 2013). A recently developed methodological paradigm, Dynamic Measurement Modeling (DMM; Dumas & McNeish, 2017; McNeish & Dumas, 2017) is applied to these data to estimate nonlinear growth trajectories for every individual student in that data set. Then, student-specific parameter estimates associated with those learning trajectories are utilized to inform inferences about mathematical development in elementary school, and the effects of early instructional intervention on the course of that development.
Nonlinear Learning Trajectories in Educational Research
From the earliest days of psychological research on learning (Ebbinghaus, 1885), through present-day investigations in cognitive science (Donner & Hardy, 2015; Resing, Bakker, Pronk, & Elliott, 2017), student improvement on a particular skill has been commonly observed to follow a recognizable and consistent pattern: initial learning gains tend to occur rapidly, but growth decelerates over time, with the student’s ability to perform that particular skill eventually leveling off. For example, in one widely cited sequence of meta-analytic studies from a decade ago (i.e., Bloom, Hill, Black, & Lipsey, 2008; Hill, Bloom, Black, & Lipsey, 2008), effect sizes associated with learning gains across multiple domains of learning in schools were shown to decrease as students age, indicating that student learning growth, on average across many included studies, was decelerating across developmental time. Today, such nonlinear learning curves are familiar to most educational practitioners and researchers, and the term “learning curve” is commonly utilized in popular parlance to describe the process by which a particular skill can be developed.
However, despite their ubiquity in popular discourse, limitations in data availability, computational power, or statistical methodology have meant that student-specific nonlinear growth trajectories (i.e., learning curves) are almost never modeled in large-scale educational research (see Cameron, Grimm, Steele, Castro-Schilo, & Grissmer, 2015, and Campbell et al., 2001, for notable exceptions). Today, the vast majority of educational researchers have utilized outcome data collected at one particular time point (e.g., Kim & Petscher, 2016), or, when student data are collected at multiple time points, linear change among measured outcomes across those time points (e.g., Dumas, McNeish, Schreiber-Gregory, Durning, & Torre, 2019; Jitendra et al., 2013; Nesbitt, Farran, & Fuhs, 2015), as evidence of learning occurring within students. Such research practice, however typical in our field, does not fully capture changes in the shape of student nonlinear growth trajectories that may occur in response to instruction, and as such represents a major current limitation in the educational research literature. In addition, even when nonlinear growth models are applied to educational data, those growth models are typically “marginal” in nature, meaning they model average growth within groups of students (e.g., Morgan, Farkas, Hillemeier, & Maczuga, 2016; Shanley, 2016). As such, these marginal growth models cannot generate growth parameters for individual students, limiting the substantive inferences that can be made about learning and instruction.
In addition to the scientific limitations of these current methods, the continued use of single time-point student scores, or linear change among those scores, may exacerbate existing equity and social justice issues in educational research and measurement. This is because, by modeling average student scores linearly across time, such methods implicitly include an assumption of student rank-order preservation, which relegates all naturally occurring nonlinear growth—and the concomitant shifts in the relative standing of students in terms of their skill level over time—to a residual error term (McNeish & Matta, 2018). By ignoring the nonlinearity and student specificity of learning growth trajectories, well-meaning researchers may inadvertently mis-specify their models to the advantage of students who enter schooling ahead of their peers, whereas nonlinear student-specific growth methods (e.g., DMM) have revealed that underresourced students may be approaching the same skill level as their more privileged peers, but with a different nonlinear shape to their growth trajectory (Dumas & McNeish, 2017; McNeish & Dumas, 2018). In addition, because students can differ in their academic development both intraindividually over time and interindividually (i.e., growth is nonlinear and student specific), inferences about an achievement gap between socially dominant and minoritized groups at a single time point, or even a sequence of time points, can be highly error prone. This is because discrete test scores (regardless of their reliability and construct validity) cannot provide information about the rate and trajectory of student growth on the ability the test is measuring (Grigorenko & Sternberg, 1998), and therefore do not allow for inferences to be made about the actual learning progress of students.
Mathematical Development as a Nonlinear Trajectory
Within the extant research literature on longitudinal mathematical development and education, a number of findings have been reported that appear incompatible with a linear and marginal (i.e., equality of slopes) conceptualization of student growth. For instance, mathematics education researchers perennially observe an achievement gap, in which underresourced students systematically underperform their more privileged peers in math (Bohrnstedt, Kitmitto, Ogut, Sherman, & Chan, 2015; Lee, 2002; Reardon & Galindo, 2009). Such a gap is specifically well-documented in longitudinal research, with the additional finding that early achievement gaps in mathematics tend to widen throughout schooling (Burchinal et al., 2011; Cameron et al., 2015; Klibanoff, Levine, Huttenlocher, Vasilyeva, & Hedges, 2006). Although such a widening gap phenomenon could theoretically be compatible with linear growth, it could never be compatible with a marginal model in which all students’ slopes are equal. This is because, if all developmental slopes are equal, students’ mathematical ability may grow, but the differences among the students’ scores (i.e., the gaps) must remain the same magnitude. In contrast to a marginal model, a nonlinear growth model in which all parameters are estimated for each student may specifically capture a widening achievement gap if the steep initial section of a “learning curve”–shaped trajectory is steeper on average for socially dominant students or remains reasonably steep for a longer period of time on average for socially dominant students.
In addition, longitudinal research on mathematical ability has shown that interyear correlations (i.e., correlations between achievement scores from one year to another) among student mathematical outcomes tend to increase over developmental time, implying that these skills are stabilizing over the course of schooling (Bailey et al., 2018; Baumert, Nagy, & Lehmann, 2012). Such an observation of increasing interyear stability is highly suggestive of nonlinear “learning curve” shaped growth, in which student growth rates on measured mathematical skills may be decelerating across time. Moreover, the effects of instructional interventions that significantly improve the mathematical ability of young children appear to weaken over the course of elementary school (Bailey et al., 2016; Smith, Cobb, Farran, Cordray, & Munter, 2013). This finding indicates that students who receive an intervention early on (e.g., in preschool) may outperform a comparison group initially, but, assuming the intervention does not continue, the advantage conferred to students by the intervention disappears after a few years. As with the observation of increasing interyear stability, the diminishing returns or “fadeout” of early math intervention reported in the literature (e.g., Kang, Duncan, Clements, Sarama, & Bailey, 2018) are not compatible with a conceptualization of linear growth. This is because, if such a linear growth trajectory truly occurred, the students who were advantaged early on in their development (e.g., by an effective instructional intervention) would necessarily remain advantaged over time, because the constant linearity of their learning trajectory would keep them ahead of their peers. Indeed, recent work that utilized a nonlinear decelerating growth model found that achievement gaps among high-resourced and lower resourced students did not increase over time in mathematics (Helbling, Tomasik, & Moser, 2019; Mok, McInerney, Zhu, & Or, 2015). These findings allow for the possibility that, by specifying a growth model as linear and therefore assuming that student learning rates are constant across developmental time, researchers may be overestimating the learning capacity of socially dominant children who enter schooling with higher levels of mathematics knowledge on average, or who grow faster on average earlier on. In contrast, a model that allows the rate of learning to vary across time for every individual student may reveal that lower-resourced students can be predicted to catch up to their higher resourced peers (e.g., Dumas & McNeish, 2017), but linear growth models are unable to account for this possibility.
For these reasons, there is ample evidence to hypothesize that mathematical development over the course of elementary school follows a nonlinear “learning curve” trajectory, although of course the trajectories of individual students may exhibit subtle differences in shape (i.e., there is a need to model student-specific growth trajectories). Therefore, in this investigation, a methodological approach that specifically models individual nonlinear growth curves for every student in a given data set will be applied.
Applying a Novel Method: Dynamic Measurement Modeling
Within educational and psychological research that focuses on understanding differences in learning trajectories and capacity among students (e.g., Calero, Belen, & Robles, 2011; Resing et al., 2017), single time-point assessment scores cannot meaningfully form the basis of psychological inferences about learning. Instead, in a method termed Dynamic Assessment (DA; Tzuriel, 2001), students are systematically measured on a particular skill multiple times, with standardized learning opportunities interspersed between those assessment occasions. DA methods have historically provided richer information about research participants than is possible with single time point (i.e., static) testing practices (Elliott, Resing, & Beckmann, 2018; Grigorenko & Sternberg, 1998), but DA is resource intensive and therefore has only historically been applied to small samples or within clinical contexts.
In response to this methodological challenge, a statistical modeling framework capable of estimating quantities associated with DA, but with much larger samples, called Dynamic Measurement Modeling was recently introduced (McNeish & Dumas, 2017). DMM also draws meaningfully on a growth modeling framework that was originally formulated in biochemistry (i.e., the Michaelis-Menten model, Michaelis & Menten, 1913; English et al., 2006), but reparametrizes that growth function as a nonlinear mixed-effects model (Cudeck & Harring, 2007) to individually model student-specific trajectories. Specifically, DMM describes the learning trajectory of every individual student in a longitudinal data set in terms of three parameters: an intercept that represents the initial skill level of the student at the first time point in the model, an upper asymptote that represents the predicted final skill level of the student, and a midpoint parameter that represents the time point at which a student’s skill level is halfway between their intercept and asymptote.
Using terminology more nested within the educational research discipline, the DMM asymptotes have been previously termed “learning capacities” because they are meant to describe students’ predicted level of future skill attainment, and the midpoint parameters have been described as “learning rates” because they provide information about the rapidity with which students approach their predicted asymptotic level over developmental time (Dumas & McNeish, 2017; McNeish & Dumas, 2018). See Figure 1 for a visual depiction of the relations among these DMM parameters. In addition, DMM is theoretically akin to existing latent measurement models such as item-response models: a theoretical similarity that means the conditional reliability of DMM capacity scores is calculable across the full distribution of students (McNeish & Dumas, 2018; Nicewander, 2018).

Depiction of a hypothetical student-specific dynamic measurement modeling (DMM) curve. The relations among the intercept, midpoint (learning rate), and asymptote (learning capacity) parameters are visualized here.
These methodological details mean that DMM can be used to reliably model student-specific nonlinear growth trajectories in large data sets. For example, prior studies (e.g., Dumas & McNeish, 2017, 2018) using DMM have focused on the Early-Child Longitudinal Study–Kindergarten (ECLS-K) 1999 data set, revealing a clear decelerating growth trajectory in mathematics and reading ability scores (Cameron et al., 2015). DMM has also been shown to improve the consequential validity of measurement in both mathematics (Dumas & McNeish, 2017) and reading (Dumas & McNeish, 2018), by demonstrating that no substantial differences in student learning capacity scores exist based on socioeconomic status, race/ethnicity, and gender in the ECLS-K data set. This empirical finding would have been hidden with traditional methods. However, DMM has never before been applied to a data set in which a particular instructional intervention was administered to a subset of students to determine if that intervention affected the shape of student learning trajectories, such an application of DMM is the focus of this investigation.
Data Source: The TRIAD Project
After validating the efficacy of the Building Blocks curriculum (Clements & Sarama, 2007; Clements et al., 2013) to improve mathematical outcomes of preschool students (Clements & Sarama, 2007, 2008), the next challenge was taking it to scale. To do so, the Technology-enhanced, Research-based, Instruction, Assessment, and professional Development (TRIAD) scale-up model, which included 10 research-based guidelines (Sarama & Clements, 2013; Sarama, Clements, Starkey, Klein, & Wakeley, 2008) was created. One critical feature of the TRIAD scale-up model was a variety of professional development opportunities for teachers aimed at promoting their knowledge of the intervention and its purposes, high-quality student-teacher interactions, and equity in classroom instruction (see Clements, Sarama, Wolfe, & Spitler, 2015, for a focused fidelity study of the implementation of this intervention). The data for the present study were taken from the evaluation of an implementation of the TRIAD model using the Building Blocks curriculum.
Design of the TRIAD Evaluations
The implementation of the TRIAD model was evaluated in two related, large-scale studies. The first and main study evaluated its implementation in preschool, with a follow-up into kindergarten and first grade. The second study extended the evaluation of the TRIAD model from the original preschool to first grades to include the fourth and fifth grades, with no additional interventions. The first study was a cluster randomized trial in which the TRIAD model was implemented in 42 schools in two city districts serving low-resource communities, randomly assigned to three conditions, with a total participation of 1,305 students in 106 classrooms. By the end of first grade, 1,127 students from 347 classrooms in 172 schools completed all assessments. All 42 schools were represented, with the three treatment groups maintaining their original percentages. In preschool, the two experimental interventions were identical, but one (TRIAD-Follow Through or TRIAD-FT) included follow through in the kindergarten and first-grade years, whereas the other experimental condition (TRIAD-NFT) did not. The TRIAD-FT kindergarten and first-grade teachers received information about what at least some of their entering students had learned in their preschool year and how to build on it. TRIAD coaches provided support through monthly classroom visits, always including use of formative assessments to support decisions about differentiating instruction (Clements et al., 2013; Sarama et al., 2012).
The second study measured the persistence of the TRIAD intervention effects into the project’s seventh year; that is, up to 4 years following the end of the treatment for the Follow Through (TRIAD-FT) group and 6 years following the end of the treatment for the TRIAD-NFT group (Clements et al., 2019). By the end of fifth grade, 781 students from 338 classrooms in 153 schools completed all assessments. Between first grade and fifth grade, the overall attrition was 36% and the three groups did not experience substantially different attrition rates (34% for TRIAD-FT, 40% for TRIAD-NFT, and 33% for control). At all grade levels, none of the baseline differences (free/reduced price lunch, gender, disability status) were greater than 0.25 standard deviations (in absolute value), which aligns with the reasonable threshold employed by What Works Clearinghouse (Clements et al., 2019).
Instruments and Scoring
Students’ mathematical ability was assessed at seven time points: pre- and postintervention assessments in preschool, and then additional measurement occasions in kindergarten, first, third, fourth, and fifth grade (i.e., seven total time points). Mathematical ability for pre-K to Grade 1 was measured using the Research-based Early Math Assessment (REMA; Clements, Sarama, & Liu, 2008). The REMA assesses young students’ conceptual and procedural knowledge of mathematics, as well as problem-solving and strategic competencies. Abilities are assessed according to theoretically and empirically based developmental progressions (National Research Council, 2009; Sarama & Clements, 2009). Topics represented on the REMA included verbal counting, object counting, subitizing, number comparison, number sequencing, connection of numerals to quantities, number composition and decomposition, adding and subtracting, and place value. In addition, shape recognition, shape composition and decomposition, congruence, construction of shapes, and spatial imagery; and additional topics include measurement, patterning, and reasoning are also present on the REMA. The developmental progression of items as well the fit of individual items to their scoring model has been reported in earlier research (Clements et al., 2008).
The REMA measures mathematical competence as a latent trait using an item response theory (IRT) scoring model, yielding a score that locates students on a common ability scale with a consistent, justifiable metric that allows for accurate comparisons across ages and meaningful comparison of change scores, even when initial scores differ (B. D. Wright & Stone, 1979). The 225 items on the REMA are presented to students in order of item difficulty, and students stop after four consecutive errors on each of the number and geometry section items. Based on the expected growth in mathematical competency from preschool to first grade, administration at the first grade time point began with Item 30 of the number section and Item 6 in the geometry section. All assessment sessions were videotaped, and each item coded by a trained coder for correctness and for solution strategy; 10% of the assessments were double-coded. Both assessors and coders were blind to the group membership of the students. Continuous coder calibration by an expert coder (one tape per coder per week) was performed to mitigate coder drift. Calibration feedback was sent to coders, alerting them to any undue variance from coding protocols. Previous analysis of the assessment data showed that the reliability of the scores was strong (Clements et al., 2008); on the sample used in the present investigation, the reliability was .92. In addition, REMA scores had a correlation of .86 with a different measure of preschool mathematics achievement (Clements et al., 2008), the Child Math Assessment: Preschool Battery (Klein, Starkey, & Wakeley, 2000), and a correlation of .74 with the Woodcock-Johnson Applied Problems subscale for a pre-K specific subset of 19 items (Weiland et al., 2012). Because the REMA is a research instrument used primarily for studies within the educational sciences and not heavily utilized within large-scale educational testing practice, the REMA does not yet feature national norming information for comparison of the TRIAD sample to a nationally normative distribution.
At the beginning and end of fourth grade and at the end of fifth grade, students’ mathematical knowledge was measured using the Tools for Early Assessment in Mathematics 3-5 (Clements, Sarama, Khasanova, & Van Dine, 2012). The TEAM 3-5 is a paper-and-pencil assessment that can be administered in a group setting. It is aligned with the same developmental progressions as the REMA and TEAM Pre-K–2 although some topics that are relevant in the youngest students (e.g., simple counting, subitizing, shape recognition) are “retired,” while others are introduced or receive greater emphasis (e.g., multiplication and division, fractions and decimals, measurement of area and volume, coordinate systems, and more sophisticated analysis of geometric shapes). In the current sample, the TEAM 3-5 was found to have good internal reliability (Cronbach’s α = 0.91). Furthermore, correlations between the assessment and state Grade 5 achievement tests in New York, r(351) = 0.82, p < .001, and Massachusetts, r(110) = 0.76, p < .001, were strong for the subset of students for which state tests were available (approximately 40% of the full sample). As with the REMA, the TEAM 3-5 was also converted to a standardized Rasch–IRT score, and this IRT approach allowed for the vertical scaling of the scores across time, to allow for an objective investigation of student learning trajectories using longitudinal methodology. In addition to these mathematics assessment scores, the TRIAD data set also includes a number of salient background characteristics about students and their families that are relevant to this investigation (e.g., student sex, race/ethnicity).
Fitting the Dynamic Measurement Model: Linear or Nonlinear?
To determine whether linear growth, or a nonlinear learning curve, shaped and decelerating trajectory best modeled the TRIAD data, we compared the fit of a longitudinal mixed-effects model that modeled development in mathematics as linear, quadratic, or as following the Michealis-Menten nonlinear trajectory. All models featured a heterogeneous error structure (i.e., no assumption of homoscedasticity, or equal error variances over time, was made; Grimm & Widaman, 2010); see the supplemental materials included with this article for full information on model estimation strategies. Figure 2 shows the mean REMA scores within the entire TRIAD sample at each time point, with the Michealis-Menten, quadratic, and linear growth trajectories plotted over them. Visually, it can be seen that the nonlinear “learning curve” shaped Michaelis-Menten model much better describes the average growth trajectory in this data set than does the linear model. This visually apparent pattern is shown to be statistically supported through the inspection of relevant fit statistics, which show that the Michaelis-Menten model fits the TRIAD data much better than the linear model (Michealis-Menten, BIC = 12,235; Quadratic, BIC = 13,954; Linear, BIC = 16,706). Therefore, the nonlinear Michealis-Menten model was retained for further analysis.

Unconditional linear (dotted gray), quadratic (solid gray), and Michaelis-Menten (solid black) trajectory plotted against the empirical means from the data at each time point.
Beyond improvement in fit, it is important to differentiate between models that are nonlinear in the variables versus models that are nonlinear in the parameters. The commonly used quadratic model is nonlinear in the variables (e.g., time is squared), but remains linear in the parameters because the effect of linear time is simply added to the effect of quadratic time. Accounting for nonlinearity in this way is known to lead to curves that may provide a decent local approximation of the phenomenon being modeled but possess parameters that are often of little interpretive utility (Cudeck & du Toit, 2002; Grimm, Ram, & Estabrook, 2016). Models that are nonlinear in the parameters (e.g., where parameters can be included in exponential, fractions, or products with other parameters) are generally more capable of estimating meaningful quantities that characterize nonlinear growth, especially of mental attributes relevant to educational research (Cudeck, 1996).
It should also be noted here that a DMM conceptual framework is compatible with a number of functions that are nonlinear in their parameters including Richards, Gompertz, von Bertalanffy, or Schnute curves. Each of these curves feature monotonically increasing growth that eventually culminates in an asymptote, but differ from the Michaelis-Menten function in terms of their general nonlinear shape as well as the number of parameters used to estimate the curve and the particular scale and formulation of those parameters (see McNeish & Dumas, 2017, or McNeish, Dumas, & Grimm, 2019, for a full and detailed discussion of the various nonlinear functions that are compatible with DMM). In this study, the marginal (i.e., without the random effects) fit of each of these functions, including the quadratic growth function, to the TRIAD data was assessed, and the Michaelis-Menten model demonstrated the most advantageous fit, including the smallest mean-squared error. Therefore, both the empiricism and conceptual discussion (including Figure 1) in this article focus on a DMM that utilizes the three-parameter Michaelis-Menten function, which has also been the best-fitting functional form in previous DMM research using other educational data sets (e.g., Dumas & McNeish, 2017; McNeish & Dumas, 2018).
DMM Results and Interpretation
After retaining the Michaelis-Menten based DMM for further analysis, intercept, midpoint, and asymptote scores for every student in the data set were computed via Empirical Bayes predictions. Taken together, these three parameters describe the shape of student-specific learning trajectories. See Figure 3 for student-specific DMM trajectory plots for 50 students from the TRIAD data set, drawn without regard to treatment group membership. Recently, researchers (McNeish & Dumas, 2018) have begun to focus on the conditional reliability of the Michealis-Menten asymptotic learning capacity estimates as a way to determine whether a given DMM-estimated learning trajectories with a small enough amount of error to be interpretable. Using this recently developed technique, the conditional reliability of each student’s asymptote was calculated, and integrating over the distribution of these conditional reliabilities yielded a marginal or overall reliability for the asymptote parameter of .74. It should be noted here that, while the reliability of growth parameters has been a focus of DMM research, it is not a typically included statistic in most existing growth modeling or mixed-effects modeling work. Therefore, it is not yet known what level of reliability can be expected or desired for DMM parameters across domains, constructs, or measurement contexts. Furthermore, the marginal reliability for DMM estimates tends to be lower than the values typically encountered with static measurement models (i.e., confirmatory factor analyses) due to the augmented uncertainty concomitant with attempting to measure developing abilities (i.e., DMM is attempting to estimate a future capacity rather than a current ability as is routinely the case with IRT). However, this reliability check of the asymptotic scores remains an important step in DMM modeling to ensure that the nonlinear trajectory represents a true underlying structure in the data set.

Trajectory plot with person-specific growth trajectories and asymptotes for a sample of 50 students.
Intraindividual Growth Patterns
The close inspection of the variance/covariance among estimated DMM parameters for all students in the TRIAD sample reveals substantively interesting intraindividual growth patterns related to mathematical development in general. Table 1 holds the variances of the DMM estimated parameters, as well as the correlations among those parameters. As can be seen, students varied most on their midpoint parameters, while they were more homogenous on their intercepts and capacity scores. This pattern suggests that, while students arrive in preschool relatively similar to one another in terms of their elementary mathematical skill, and are predicted to eventually reach relatively similar asymptotic levels of elementary mathematics skill, the developmental route that connects these distal points are highly divergent from one another. It should be noted here that the asymptotic parameters in DMM are not equivalent to the final time-point (i.e., fifth grade) scores, but instead are predictions of the student’s eventual capacity to learn elementary mathematics skills (e.g., arithmetic), given their observed learning trajectory throughout elementary school. In the case of the TRIAD data set, the DMM model predicts that the students will eventually reach relatively similar amounts of elementary mathematics skill before their development asymptotically levels off. Of course, individual differences will still exist across students on other abilities, but the ability that the REMA is designed to measure (i.e., elementary mathematics) is predicted not to be highly variable asymptotically.
Variance/Correlation Matrix for Estimated DMM Parameters in the Full TRIAD Sample
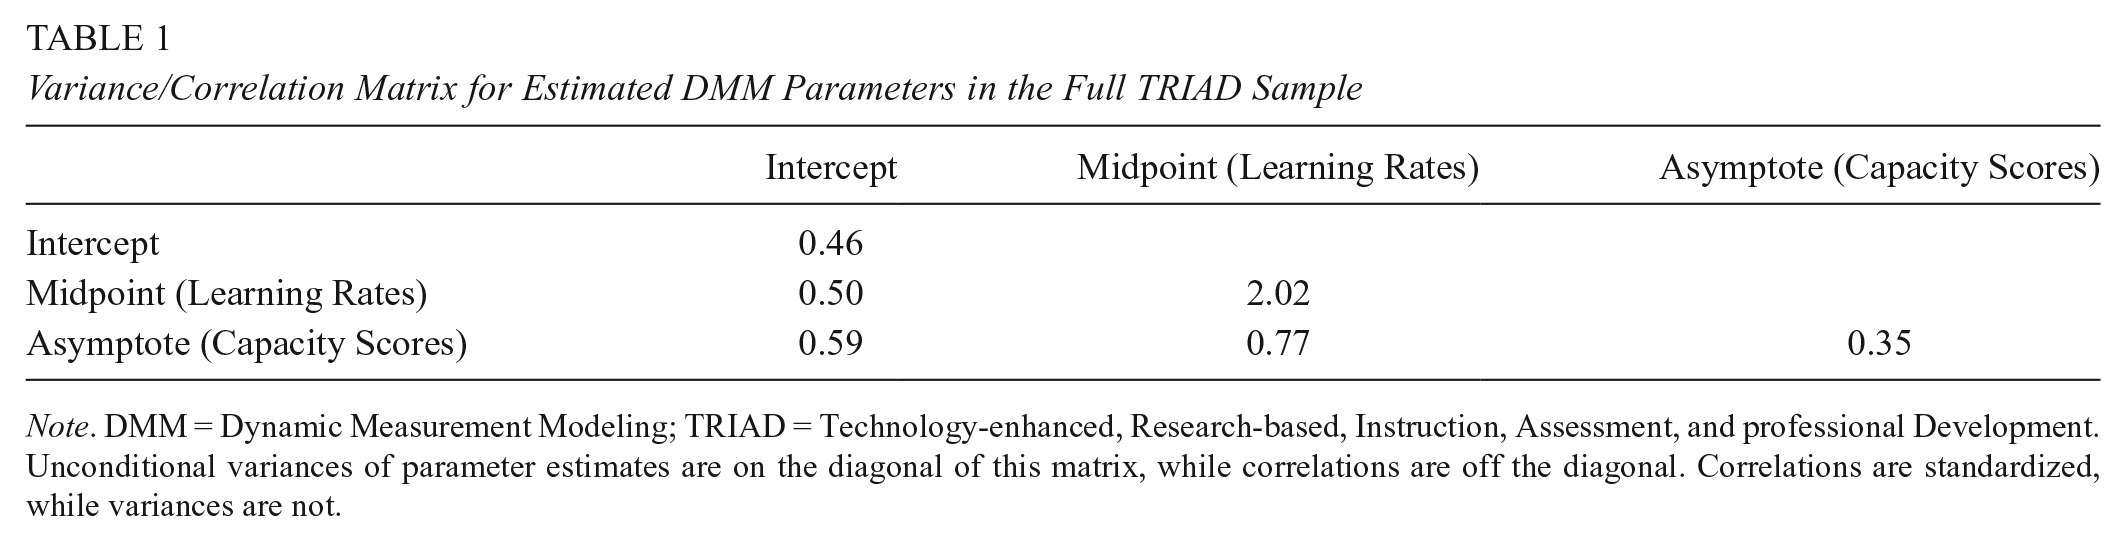
Note. DMM = Dynamic Measurement Modeling; TRIAD = Technology-enhanced, Research-based, Instruction, Assessment, and professional Development. Unconditional variances of parameter estimates are on the diagonal of this matrix, while correlations are off the diagonal. Correlations are standardized, while variances are not.
Therefore, despite the lower variability in their starting and predicted end points, students develop their math skills at highly variable rates. In addition, all three of the DMM parameters were positively correlated in this sample, implying that those students who entered preschool ahead of their peers in mathematics also had higher predicted capacities on average. In addition, students with higher capacities, on average, also took longer to reach the half-way point on their learning trajectory (i.e., their midpoints were higher). However, this pattern was far from hard and fast (i.e., the correlations are only moderate in strength), and the correlation between the midpoints and the capacities (r = .77) was stronger than the correlation between the intercept and the capacities (r = .59), or the correlation between the intercept and the midpoints (r = .50). One reason why the examination of these correlations is relevant to this investigation is because they provide quantitative insight into the intraindividual patterns in student learning trajectories found in this data set, and contextualize the purpose of the intervention in terms of DMM. In this case, this correlational pattern highlights the importance of early learning to later achievement, with those students entering preschool ahead of their peers being predicted to have higher asymptotic ability later in life. In many ways, one purpose of the TRIAD intervention being examined here is to decouple these parameters by steepening the learning trajectories of students in the intervention group (i.e., lowering the midpoints of their growth curves), without decreasing student future capacity.
Intervention Effect
Having observed these general intraindividual differences, we turned to the question of the efficacy of the TRIAD intervention in influencing the learning trajectories of the treatment group of students. It should be noted here that, originally, the TRIAD intervention featured two treatment groups (TRIAD-FT and Triad-NFT); in both of the TRIAD treatment groups, students received the same and the same amount of the Building Blocks instructional intervention. They differed only in a follow-through teacher professional development component in kindergarten and first grade. Furthermore, our DMM analysis showed that no statistically significant or substantively meaningful differences existed in student learning trajectories across the two treatment groups (see online Supplemental Material for details). Therefore, for our main analysis, we combined those treatment groups in this study and analyze these data with only two groups: A treatment group that received the Building Blocks intervention, and a control group that did not, resulting in unequal analytic sample sizes in the control group (N = 378, 29%) and combined treatment group (N = 927, 71%).
Table 2 depicts the mean scores for each of the three DMM parameters across the treatment and control group. Because random assignment for the TRIAD intervention was done at the school level, the equality of these means was tested through a multivariate linear mixed-effects model that accounted for the school-based nestedness of these data in the calculation of the significance tests. Because the TRIAD sample was composed of 42 schools, which is near the border for minimum sample size requirements at the second level of this model (Chang, 2015), small sample size corrections to the estimation of this multilevel model were performed (see details in online Supplemental Material). This multilevel modeling approach revealed that both the intercepts and the asymptotes were similar across groups, leading to nonsignificant differences in both the intercept,
Dynamic Measurement Scores Across and Within Intervention Conditions

Note. Standard errors for Dynamic Measurement Modeling scores are in parentheses. Significant differences exist between treatment and control group only for the midpoint parameters. Intercept and asymptote scores are on the same scale (i.e., the scale of mathematics ability), while the midpoint scores are on the scale of years since the start of preschool.
Although the TRIAD data set does not allow for the direct comparison of DMM capacity estimates to actual adulthood levels of elementary mathematical skill, some recent work with DMM models (i.e., McNeish et al., 2019) does support the criterion validity of these scores to much later in life. In McNeish et al.’s (2019) recent study, a life span verbal ability data set that followed participants from ages 3 to 72 years (i.e., the Berkeley Growth Study; Bayley, 1949) was utilized to demonstrate that DMM capacity estimates generated from childhood and adolescent ability scores explained nearly three times as much variance in ability at age 72 years than did extrapolating directly from IRT scores. Given this finding, there is reasonable evidence to consider DMM capacity scores viable estimates of eventual skill level, and therefore use them as outcome scores when testing the effect of the TRIAD intervention on the course of students’ mathematical learning trajectories.
However, in an analysis of the midpoints, it was found that the students in the treatment condition did indeed learn at a significantly faster rate than those in the control condition through elementary school (i.e., their midpoint parameters were significantly lower;

Comparison of histograms of student-specific random effects for the intercepts (upper left), asymptotes (upper right), and midpoints (bottom) for treatment (gray) and control (black) groups.
Such an augmented rate-of-learning in mathematics may be helpful to the academic development of young students, because it can benefit them in a number of ways including increased motivation and self-concept for mathematics learning (Becker & Neumann, 2018), possible skill transfer to other unmeasured academic areas (e.g., science) early in elementary school (Marcus, Haden, & Uttal, 2018), and a decrease in negative emotions (e.g., frustration) associated with early mathematics learning (Ahmed, van der Werf, Kuyper, & Minnaert, 2013). It should be noted here, however, that hypotheses concerning the potential transfer of elementary mathematical knowledge to other domains of learning (e.g., science) or to more advanced areas of mathematics (e.g., algebra) are not testable using the TRIAD data set, and therefore must remain reasoned literature-based conjectures at this point.
Interaction With Demographic Background
Given the significance of the treatment effect on the student’s learning rates (i.e., midpoint parameters), an interaction term between the treatment and student sex on the midpoints, as well as between the treatment and student race/ethnicity on the midpoints was tested in the multivariate linear mixed-effects model (which also accounted for school-based nestedness).
1
This interaction term was nonsignificant for student sex,
The interaction term between the treatment and student race/ethnicity on the learning rate parameters was found to be significant,
Implications for Early Mathematics Intervention
This study has been the first empirical investigation to apply the DMM nonlinear student-specific growth methodology (Dumas & McNeish, 2018) to answer research questions related to the efficacy of an instructional intervention. As such, the findings from this study differ in critical ways from past examinations of the same learning phenomena (i.e., early mathematics development) that have utilized more constrained methods (e.g., Schenke et al., 2017). Here, we posit and briefly present three principal findings that can be drawn from the present investigation that could not have been similarly observed in previously existing work.
Growth Trajectories Are Highly Variable Across Students
In this study, both the initial amount of elementary mathematical skill with which students entered preschool and their predicted eventual asymptotic level of elementary mathematical skill showed no statistical differences between the treatment and control groups. In addition, neither of these two parameters (intercept and asymptote) was particularly variable, and students varied slightly more on their intercepts than they did on their predicted asymptotes. This pattern suggests that students in the TRIAD data set both began preschool relatively similarly in terms of their elementary mathematical skill and were predicted to reach relatively similar levels of elementary mathematical skill eventually. However, the rate with which students developed this skill was much more variable (approximately 5 times as variable) as the intercepts and asymptotes. Given this variability, the DMM learning rates of individual students, rather than their eventual achievement, may be a much more fertile ground for investigating the efficacy of instructional interventions. This finding is also interesting in regards to previous work that has suggested that preschool intervention effects fade over time (e.g., Bailey et al., 2016): The results of the present study suggest that students do not vary substantially on their eventual asymptotic level of elementary mathematical skill, implying that the detection of distal intervention effects may be complicated by that low variability. Related to the finding of midpoint variability, one interesting future direction for this line of research with the TRIAD data set or other related data sets would be to include a growth mixture modeling framework (Harring, 2012; Muthén & Shedden, 1999), which would allow for nuanced differences in learning trajectory across students to be used to identify latent classes within the TRIAD students. Such a future study may identify that subsets of students who received certain aspects of the intervention or who have certain background characteristics exhibit systematic differences in the shape of their mathematical learning curves, although of course such a study remains a future direction at this point.
Preschool Intervention Can Significantly Steepen Learning Trajectories
Despite the statistical equivalence of the intercept and asymptotic parameters across the treatment and control group in this study, the Building Blocks intervention was successful in significantly shortening the time it took for students to develop half of their eventual predicted elementary mathematical skill. This finding means that the learning trajectories of students in the treatment group were significantly steeper, indicating their growth early in elementary school was more rapidly approaching their asymptotic capacity. Furthermore, it may be hypothesized from this pattern that, should the intervention have lasted longer into elementary school, treatment group students may have experienced accelerated learning for longer, leading either to an even stronger effect on their learning rates, or potentially a positive effect on their capacity scores as well, although of course this hypothesis must remain a future direction until longer term intervention-based data sets become available. In this way, although the Building Blocks intervention in preschool did not significantly alter the capacity of the students in the treatment group to develop mathematical skill (an observation that is in accordance with previous fadeout findings), it did improve the rate at which students approached their asymptotic capacity. Therefore, by shifting the focus of investigation from eventual skill level (i.e., capacity scores) and to the shape of the learning trajectory over time (i.e., by comparing the learning rates), the positive effect of the preschool intervention through elementary school is detectable.
Early Intervention Benefits Minority Students Most
In the United States, White, or European American students, on average, tend to outperform their Black or Latinx peers in mathematics achievement (Reardon & Galindo, 2009). However, in this study, we showed that students of color benefitted more from the Building Blocks intervention than did their White peers, meaning that the learning rates for Black and Latinx students were most steepened by the intervention. This finding implies that early intervention may be a key component for achieving a main goal of educational research and practice: equal opportunity for students, regardless of background, to learn and develop mathematical skills. It is important to note here that the intervention effect on the DMM capacity scores was statistically equal across race/ethnicity groups, while the intervention effect on the DMM learning rate scores significantly interacted with both African American and Hispanic status in the substantively positive direction (i.e., midpoints were lowered): implying that the intervention did not support the long-term mathematical development of any ethnic or cultural group more than the others, but it did improve the learning rate of minoritized students more than European American students. In addition, follow-through research-based curricula is necessary if children attend poor quality schools (Brooks-Gunn, 2003), which, in the United States, is especially more likely for students of color (Currie & Thomas, 2000). There is a cumulative positive effect of students experiencing consecutive years of high-quality teaching, and a cumulative negative effect of low-quality teaching (Ballou, Sanders, & Wright, 2004; Jordan, Mendro, & Weerasinghe, 1997; Sanders & Horn, 1998; Sanders & Rivers, 1996; S. P. Wright, Horn, & Sanders, 1997). Unfortunately, the latter is more probable for children from historically disadvantaged social groups (Akiba, LeTendre, & Scribner, 2007; Darling-Hammond, 2006). Therefore, the continued application of research-based curricula throughout elementary school (as opposed to only in preschool as in this investigation) may be necessary to achieve equitable educational outcomes. Of course, previous research on preschool intervention effects using other longitudinal methodologies (e.g., Burchinal et al., 2011) has also highlighted the need for research-based curricula or quality teaching throughout elementary school as a requirement for equitable educational outcomes: This study underscores that key societal need with support from a newer and potentially more detailed methodology.
Supplemental Material
DMM_TRIAD_Supplement_Blind – Supplemental material for Preschool Mathematics Intervention Can Significantly Improve Student Learning Trajectories Through Elementary School
Supplemental material, DMM_TRIAD_Supplement_Blind for Preschool Mathematics Intervention Can Significantly Improve Student Learning Trajectories Through Elementary School by Denis Dumas, Daniel McNeish, Julie Sarama and Douglas Clements in AERA Open
Footnotes
Acknowledgements
This research was supported by the Institute of Education Sciences (IES), U.S. Department of Education, through grants R305K05157 and R305A110188 and also by the National Science Foundation (NSF), through grants ESI-9730804 and REC-0228440. The opinions expressed are those of the authors and do not represent views of the IES or NSF. Although the research is concerned with the scale-up model, not particular curricula, a minor component of the intervention used in this research has been published by the authors, who thus could have a vested interest in the results. An external auditor oversaw the research design, data collection, and analysis and other researchers independently confirmed findings and procedures. The authors wish to express appreciation to the school districts, teachers, and students who participated in this research.
1.
We focus on the midpoints in text, but these analyses also included the intercepts and asymptotes as well, which did not reveal any meaningful differences related to the intervention. Full results for the intercepts and slopes are included in the supplemental material for interested readers.
Authors
DENIS DUMAS is an assistant professor of research methods and statistics in the Morgridge College of Education at the University of Denver. His research interests are in understanding student learning and cognition through the application and refinement of quantitative research methods.
DANIEL McNEISH is an assistant professor of quantitative psychology at Arizona State University. His research interest is the development and testing of statistical methods for psychological and educational data with challenging data structures.
JULIE SARAMA is Kennedy Endowed Professor in innovative learning technologies at the Morgridge College of Education, University of Denver. Her research interests are in the development and evaluation of research-based educational technology, especially in early mathematics.
DOUGLAS CLEMENTS is Kennedy Endowed Professor in early childhood learning at the Morgridge College of Education, University of Denver. His research interests are in the learning and teaching of early mathematics, with an emphasis on the development of research-based curricula.
References
Supplementary Material
Please find the following supplemental material available below.
For Open Access articles published under a Creative Commons License, all supplemental material carries the same license as the article it is associated with.
For non-Open Access articles published, all supplemental material carries a non-exclusive license, and permission requests for re-use of supplemental material or any part of supplemental material shall be sent directly to the copyright owner as specified in the copyright notice associated with the article.