
Abstract
Recent causal evidence connects levels of per pupil spending and short- and long-term student outcomes. This evidence further suggests that specific types of spending may mediate the relationship between expenditures and student outcomes. Yet race remains related to funding disparities and schooling experiences in ways that raise concerns about the role of school finance in perpetuating racial opportunity gaps. We explore this potential source of educational inequality by asking how racial segregation and racial socioeconomic disparities are related to racial disparities in school district spending over time. We use 15 years of data from the School Funding Fairness Data System on school district expenditures and demographics to explore patterns of racial/ethnic segregation and racial/ethnic disparities across six categories of per pupil expenditures. We find that changes in racial/ethnic segregation within a state from 1999 through 2013 are associated with racial/ethnic disparities in spending, even after accounting for disparities in poverty.
Keywords
The effects of school spending have long been debated (see, e.g., Coleman et al., 1966; Hanushek, 1997). Recent studies using school finance reforms as natural experiments test whether more spending leads to improved student outcomes and find that funding does matter. For example, Jackson et al. (2016) find that, for youth from low-income backgrounds, “a 10% increase in per pupil spending each year for all 12 years of public school is associated with 0.46 additional years of completed education, 9.6% higher earnings, and a 6.1 percentage point” decrease in adult poverty (p. 160). The school finance reform literature also suggests that funding matters because of the educational goods and services money can buy. Specific types of spending such as reductions in class size, increased instructional time, higher teacher salaries, and capital outlay may mediate the relationship between spending and student outcomes (Jackson et al., 2016; Lafortune, Rothstein, & Schanzenbach, 2018). Thus, both the amount of per pupil expenditures and the specific allocation of these expenditures matter for student outcomes (see, e.g., Baker, 2016).
The causal relationship between revenue and student outcomes (Candelaria & Shores, 2019; Hyman, 2017; Jackson et al., 2016; Lafortune et al., 2018) raises concerns about racial disparities in spending patterns. If spending matters for student achievement, then racial disparities in resources may play a key role in the racial opportunity gap. Recent descriptive work does find evidence of racial disparities in school district resources. Weathers and Sosina (2019) explore contemporary patterns of between-district racial segregation and racial disparities in school district revenue. The authors find that when Black students are increasingly concentrated in separate school districts from White students in the same state, total revenue shifts in a way that disfavors the typical Black student’s district, even after controlling for racial differences in poverty. This finding raises concerns about the implications of between-district racial segregation for racial disparities in spending. Specifically, between-district racial segregation might also be associated with changes to spending patterns that have implications for student performance. Understanding how spending patterns vary with racial segregation is key to understanding racial disparities in educational opportunities.
In this descriptive analysis, we ask how between-district racial segregation and racial socioeconomic segregation are related to racial disparities in school district spending over time. 1 The current study expands on existing literature by exploring how spending priorities vary with contemporary segregation patterns. This evidence provides insight on how segregation might translate into opportunity gaps. We use national data on school district expenditures and demographics over 15 years from 1999 through 2013 to describe how between-district segregation patterns relate to racial disparities in distinct categories of per pupil expenditures. Given findings that spending on instruction (e.g., Nye, Hedges, & Konstantopoulos, 2000; Staiger & Rockoff, 2010), infrastructure (e.g., Cellini, Ferreira, & Rothstein, 2010; Conlin & Thompson, 2017), administration, and support services (e.g., Jacques & Brorsen, 2002) may impact student outcomes, we focus our analyses on these categories of expenditures. We find that changes in racial segregation within a state are associated with racial disparities in spending patterns, even after accounting for racial disparities in poverty. In exploring the descriptive relationship between segregation and racial disparities in expenditures by category, this study contributes evidence of the ways in which segregation may be linked to disparities in school inputs.
Between-District Inequality
Between-district inequality is an important focus of study due to districts’ role in spending decisions. Historically, desegregation orders following Brown v. Board of Education and federal mandates tied to funding provisions initiated a period of declining segregation within districts (Cascio, Gordon, Lewis, & Reber, 2010; Reardon & Owens, 2014). White flight and legal limitations on the federal and state efforts to implement desegregation across districts resulted in higher levels of between-district segregation (Reardon & Owens, 2014). Contemporary Black–White between-district segregation (as measured by unevenness) remains higher than intradistrict segregation (Reardon & Owens, 2014). Between-district Black–White segregation started to decline in the early 2000s, while between-district Latinx–White segregation and economic segregation, in contrast, have both increased somewhat (Reardon & Owens, 2014).
Levels of between-district segregation may in part be attributable to increases in “residential segregation patterns at a large geographic scale (e.g., segregation between cities and suburbs), which particularly affect segregation between school districts” (Reardon & Owens, 2014, p. 207). Recent studies have also found evidence of a strong relationship between rising income inequality and residential income segregation, largely due to the relationship between income inequality and income segregation at a larger geographic scale (Reardon & Bischoff, 2011; Reardon, Bischoff, Owens, & Townsend, 2018). These between-district inequalities suggest that spending differences between districts can have implications for racial and socioeconomic inequalities in school district resources.
Trends in School District Expenditures
Spending on public elementary and secondary schools increased steadily between 1890 and 1990 (Hanushek & Rivkin, 2007). The increasing cost of instruction, declining student–teacher ratios, noninstructional expenses, and the education of special needs populations explains much of this increase (Hanushek & Rivkin, 2007). In addition, since the Civil Rights era in the mid-20th century, several waves of school finance litigation spurred reforms to public school funding systems across the nation. Plaintiffs accused states of violating state equal protection rights or failing in their constitutional duty to provide an adequate education (Guthrie, 1980; Odden & Picus, 2008). Remedies involved redesigning finance systems to disrupt the relationship between local property wealth and district funding levels and to mandate a minimum level of quality and services (Guthrie, 1980; Odden & Picus, 2008).
In recent decades, education expenditures have continued to grow and remain substantial. Between 1993 and 2013, average per pupil current operating expenditures increased by about 6.1 percent, or $400 dollars, though a notable drop is evident after the 2008 Great Recession (Baker & Weber, 2016). Total expenditures across school districts sum to about $639.5 billion dollars as of the 2014–2015 school year (U.S. Census Bureau, 2017). Most of this spending is earmarked for salaries, wages, and benefits for personnel. In 2014–2015, 79.6% of current national per pupil education spending was spent on salaries, wages, and benefits for personnel across functions. Of all personnel expenditures, 76.2% was spent on instructional personnel (U.S. Census Bureau, 2017). Much smaller shares are spent on noninstructional and nonpersonnel items (U.S. Census Bureau, 2017). 2
School Spending and Student Outcomes
A growing body of literature has also found evidence that levels of spending matter for student outcomes. Historically, desegregation after Brown improved Black students’ outcomes through increased exposure to higher resourced schools (Johnson, 2011; Reber, 2010). In recent decades, spending increases associated with school finance reforms led to increased student performance, educational attainment, and adult outcomes. Reform-induced spending resulted in improvements in standardized test performance, rates of high school graduation, college enrollment, college completion, and adult earnings (Candelaria & Shores, 2019; Hyman, 2017; Jackson et al., 2016; Lafortune et al., 2018). Low-income students and low-income districts in particular benefited from increases in funding. For example, low-income districts received larger increases in funding than high-income districts and also experienced increases in NAEP achievement as a result (Lafortune et al., 2018).
Evidence further suggests that spending on specific educational goods and services also matters for student achievement. Foremost is instructional spending. Class size and teacher quality have long been implicated in the debates over what type of spending matters (e.g., Cellini et al., 2010; Conlin & Thompson, 2017), and both small classes and employing high-quality teachers cost more money. Increases in instructional spending (e.g., class size) may play a role in the positive relationship between desegregation and Black student outcomes (Johnson, 2011; Reber, 2010). In addition, studies from the school finance reform literature found that court-ordered reforms led to increases in instructional expenditures, particularly through decreases in class size and student–teacher ratios (Hyman, 2017; Jackson et al., 2016; Lafortune et al., 2018). Increased instructional time as a result of smaller class sizes and higher quality teachers drawn by salary increases are thought to mediate the relationship between increased spending and improved outcomes (Jackson et al., 2016).
Though less explored, other noninstructional expenditures matter for student outcomes. Investments in facilities, student support services, and school and district leadership may improve outcomes by creating a context where students can focus on learning. Studies of the causal impact of school district facilities improvement on student test scores in Ohio found positive long-term effects (Conlin & Thompson, 2017; Goncalves, 2015). The authors theorized that physical construction disrupts short-term learning, but upgrades and enhancements to school facilities improve long-term performance. Similar long-term effects were found in Michigan (Hong & Zimmer, 2016) and California (marginally significant; Cellini et al., 2010), though not in Texas (Martorell, Stange, & McFarlin, 2016). Furthermore, funding increases from school finance reforms were directed in part to capital spending (Jackson et al., 2016; Lafortune et al., 2018), suggesting that this spending may also mediate the relationship between expenditures and student outcomes.
While administrative and pupil support spending is less studied, each may have plausible effects on student outcomes. Jacques and Brorsen (2002) found cross-sectional negative correlations between student outcomes and expenditures on support and administration. Yet staff such as counselors and school nurses may provide critical supports for students who may not have access to these types of resources outside of school. Furthermore, the ability of principals to identify quality teacher candidates is important for student achievement (Staiger & Rockoff, 2010), something for which experienced administrators may have more skills. Taken together, this literature suggests that how education dollars are spent may shape student outcomes.
How Might Segregation Be Related to Expenditures?
School District Finance and Budgeting
To theorize about possible mechanisms in the relationship between segregation and expenditures, we must consider how school districts make spending decisions. Districts are the administrative unit where many funding and spending decisions are made. Fiscally independent school districts have the authority to levy taxes. Districts are also the entity that receives state and federal funds for disbursal to schools (Roza, 2010). Spending practices in schools are largely dictated by district-level factors. Some examples include labor contracts that determine staff salaries, salary schedules, class size, and the academic calendar; earmarks for special programs or populations; policies on teachers’ ability to choose the school where they work; voter levies and referendums for educational funding or programs; parent and community advocacy; and district distribution formulas to determine spending levels (Roza, 2010).
Though spending practices vary both within and across states, some generalizations can be made. School district spending is strongly influenced by past practice. Many districts take an “incrementalist” approach to budgeting, which means that “most budgets are developed by assessing what it will cost to purchase the same mix of goods and services in the next budget year, and comparing that figure to available revenues” (Odden & Picus, 2008, p. 239). Fixed costs, such as state-mandated limits on administrative expenditures or salaries from collective bargaining contracts (Guthrie, 1980; Odden & Picus, 2008), constrain districts’ ability to cut funding from certain categories. Districts are also generally motivated to protect instructional personnel when cuts need to be made (Odden & Picus, 2008). Since budgets often have to be approved by the board of education and the public on a yearly basis (Odden & Picus, 2008), local political advocacy may also protect certain types of spending when districts are faced with cuts. In sum, districts are essentially the entity that translates funding into expenditures (Roza, 2010). If this process of translation varies between districts, between-district demographics might have implications for disparities in exposure to educational inputs. In other words, patterns of between-district sorting by race and socioeconomic status can have meaningful implications for inequality when accompanied by between-district differences in spending priorities.
Given this knowledge of districts’ role in education finance, we hypothesize that changes in racial segregation might lead to changes in expenditures through two main district-level pathways. First, racial segregation might be associated with revenue constraints that limit spending across all subcategories or that force districts to make cuts in some areas while preserving spending in others. Note that we are only interested in revenues as a mechanism by which segregation may influence expenditures. Other studies already explore segregation and revenue (Weathers & Sosina, 2019); thus, we are primarily concerned with patterns in expenditure subcategories. Second, racial segregation might itself directly lead districts to change how they translate revenue into expenditures, perhaps through influencing personnel characteristics or by leading districts to reevaluate spending priorities. Each of these possible mechanisms is discussed in the two subsections that follow.
Revenue Constraints and Expenditure Constraints
The first mechanism relates to revenue constraints that limit spending. There is evidence that racial segregation is related to racial disparities in funding. As mentioned previously, a recent analysis using a similar data set and analytical strategy to what is described here, finds that Black–White between-district segregation is negatively associated with total revenue disparities (Weathers & Sosina, 2019). This relationship is largely driven by disparities in local revenue and remains even after accounting for poverty and other racial differences between districts. Using different measures of segregation, La Ferrara and Mele (2006) also found significant relationships between racial segregation and school expenditures. Using the proportion of minority migrants into a metropolitan area in 1940 as an instrument for metropolitan area–level segregation in 1990, the authors found that higher levels of segregation led to increases in average expenditures at the metropolitan level, but ultimately widened spending inequality between socioeconomically advantaged and disadvantaged school districts within the same metropolitan area. These findings suggest that Black–White segregation may lead to funding constraints at the district level. What this literature does not tell us is the extent to which these funding or expenditure disparities are related to patterns of education spending. Since we know that certain types of spending matter for student outcomes, it is important to know the extent to which these overall constraints on revenue might alter spending by subcategory.
If racial segregation is related to expenditures through its influence on funding, we would expect to observe one of two patterns. First, we might expect that increasing levels of between-district racial segregation would be associated with less total expenditures and less expenditures across all subcategories. This is consistent with districts making spending cuts across the board when faced with revenue constraints. As an alternative, we might expect that increasing levels of between-district racial segregation would be associated with less total expenditures and less expenditures in only nonpersonnel categories and other categories that include items that are not essentially fixed costs. This is consistent with districts making cuts in areas that are not legally mandated or otherwise earmarked expenses, as opposed to making cuts across the board, when faced with revenue constraints.
District Demographics and Patterns of Spending
The second set of mechanisms ties racial segregation more directly to certain kinds of expenditures. Both racial segregation and racial disparities in poverty may be directly related to spending priorities. For example, racial segregation and racial disparities in poverty may lead to lower spending as a result of the preferences and characteristics of teachers. There is long-standing evidence that high-poverty and high-minority schools are, on average, staffed by teachers with less experience, less education, and less skill (Boyd, Lankford, Loeb, & Wyckoff, 2005b; Peske & Haycock, 2006). Teachers also prefer to teach in schools and districts close to where they were raised and that are demographically similar to where they went to high school (Boyd, Lankford, Loeb, & Wyckoff, 2005a; Boyd et al., 2005b). Given the existing levels of racial segregation across schools, districts, and neighborhoods, that demographic preference can reinforce socioeconomic and racial differences in teaching personnel across districts. Furthermore, teachers are more likely to leave high-poverty schools generally and high-poverty schools with larger proportions of minority students in particular (Scafidi, Sjoquist, & Stinebrickner, 2007). A recent causal analysis of school desegregation in North Carolina also found that increases in Black enrollment led to a less experienced teaching force (Jackson, 2009). Thus, teacher characteristics and personnel characteristics more generally, may vary as a result of student demographics.
If either racial segregation or racial disparities in exposure to poverty is related to funding through personnel characteristics, we would anticipate that increasing levels of between-district segregation would be related to disparities in spending categories that include large shares of personnel expenses. These categories include instructional, administrative, and social support service expenditures. As Black and Latinx students are more unevenly distributed across districts, it may be harder for these segregated districts to recruit and retain highly educated, skilled, and experienced teachers, administrators, and other staff. The resulting labor force may be less experienced. In this manner, changes in the composition of the school district staff may result in racial spending disparities in personnel expenditures.
Finally, it may be the case that states with increasing between-district segregation may prioritize certain categories of spending to better serve the needs of changing student populations. For example, earmarked or categorical programs targeting certain student populations (e.g., after-school programming for districts with concentrated poverty) could lead to greater relative spending in some categories as segregation between districts increases. While we are not able to observe or disentangle mechanisms in this analysis, this kind of relationship suggests certain descriptive patterns. If it is the case that districts are changing spending practices as segregation increases in order to better serve the needs of students, we would expect to see more relative spending in subcategories as segregation increases over time.
In sum, if either racial segregation or racial disparities in exposure to poverty is related more directly to expenditures through its influence on spending priorities, we would expect to observe a relationship between segregation and expenditure subcategories, but not total expenditures. This would be consistent with districts shifting spending as district demographics change. A negative relationship between segregation and personnel spending categories such as administration, instruction, or social services would be consistent with mechanisms such as shifting personnel characteristics or reductions in staff as segregation increases. A positive relationship between segregation and spending categories would suggest that spending is being redirected, perhaps to better serve the needs of students or in response to changes in political mobilization.
Data and Method
In order to explore the relationship between racial segregation and expenditure disparities, we adapt the empirical strategy from Weathers and Sosina (2019) to model expenditure disparities as a function of segregation and other between-district disparities. While Weathers and Sosina (2019) explore school district funding, we are motivated by the school finance literature on the effects of particular types of spending and instead focus on expenditure disparities by subcategory.
Data
Our primary source of data is the School Funding Fairness Data System (SFFDS), a compilation of longitudinal federal data sources that provides measures of school district finance and demographics over time (Baker, Srikanth, & Weber, 2016). We specifically make use of the Local Education Agency (LEA) Fiscal Database (Version 1.0) provided in the SFFDS. Using the SFFDS, we observe school district expenditures by subcategory, racial composition of the student body, child poverty estimates, and other demographic characteristics across all districts from spring of 1993 through spring of 2014. We link the SFFDS to school-level imputations based on the Common Core of Data’s Public Elementary/Secondary School Universe Survey Data in order to address missing data on student demographics in early years of data collection. Finally, to construct a measure of urbanicity and cost-adjust dollar values within states, we match this combined file to both the Common Core of Data’s Local Education Agency Universe Survey Data and the state-level Comparable Wage Index (CWI) file from the Busch School of Government and Public Service. In order to make use of nonmissing values in the rich set of covariates included in the SFFDS, we restrict our analyses to 1999 through 2013, years for which we have CWI measures to adjust expenditures. 3
Measures
We focus on racial disparities in five expenditure subcategories: (1) administration, (2) infrastructure, (3) instruction, (4) social support services, and (5) all other spending. We constructed these five expenditure subcategories using the definitions reported in the Local Education Agency Finance Survey (F33; Cornman, 2015). Administration includes spending on items such as general and school administration. Infrastructure includes operation, maintenance, and capital outlay. Instruction includes costs of instructional staff and materials. Social support services include items such as pupil support and adult education. All other expenditures are included in a catchall “other” category. This category includes items not otherwise classified (e.g., food services, enterprise operations) as well as payments to governments, interest on debt, and transfers. The expenditure items used to construct this catchall “other” category are often vaguely defined and represent a range of miscellaneous spending. This catchall category also represents a relatively small share of total expenditures (about 8.4% in 2013). Unlike the larger categories of spending, there is likely substantial noise in the “other” expenditures category due to variations in state accounting procedures. There is also little literature to suggest that any of the items of this category would affect student outcomes. For these reasons, we caution overinterpreting any findings for “other” per pupil expenditures. It is most appropriate to consider this category as reflecting a range of miscellaneous expenditures that districts do not report elsewhere. For a full list of category definitions, see online Supplemental Appendix Table A1.
To contextualize how shifts in one category affect overall spending, we additionally predict disparities in total expenditures. Previous literature has explored the relationship between between-district racial segregation, racial socioeconomic segregation, and revenue disparities (Weathers & Sosina, 2019). Due to the high correlation between total revenue and total expenditures (0.99 in our analytical sample), we do not anticipate the relationship between segregation and total expenditures to differ substantively from the relationship between segregation and total revenue. Therefore, the bulk of our discussion, will focus on patterns of disparities in our five subcategories of expenditures.
Our key dependent variables are measures of between-district racial expenditure disparities by subcategory. For each expenditure subcategory, we first account for geographic differences in labor market costs across districts within a state. All subcategories of per pupil expenditures are cost-adjusted by multiplying the base amount by the following,

where
Next, we compute the dollar difference in cost-adjusted per pupil expenditures between the typical Black/Latinx student’s district and the typical White student’s district. The difference is calculated as follows,
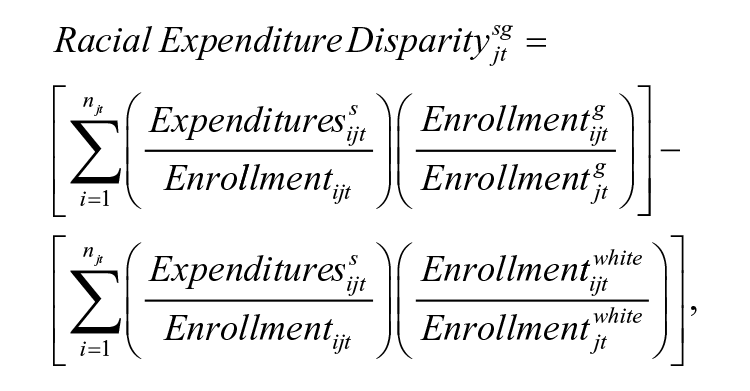
where
A difference of one dollar will mean more in a state that is relatively low spending than it will in a state that is high spending. For example, in fiscal year 2013 (the spring of the school year), typical per pupil spending in Idaho was $7,249.26 per pupil versus $23,538.12 in New York. Two hundred dollars of per pupil expenditures represents 2.7% of typical spending in Idaho but less than 1% of typical spending in New York. That is greater than a threefold difference in magnitude. Without making any adjustments, one would have to consider this threefold difference in magnitude when interpreting model results. To address this issue of interpretation, we standardize district racial dollar differences by dividing each difference by average total expenditures in a state in the 2006 fiscal year (the median year in our sample) and multiplying that standardized amount by $10,000. This results in a value that can be interpreted as the racial disparity in per pupil expenditures for every $10,000 of average spending by the state. In other words, a coefficient of $200 would reflect 2% of a state’s average 2006 spending. A key advantage of this particular adjustment is that it allows us to report both a dollar amount and to understand that dollar amount in the context of total typical spending in a state. Therefore, the coefficients in our models remain interpretable while also properly contextualizing spending in expenditure subcategories.
Our key independent variables are measures of between-district racial segregation and racial socioeconomic segregation. We measure between-district racial segregation in a manner similar to racial disparities in expenditures. We calculate the difference in proportion Black enrollment in the typical Black student’s district relative to proportion Black enrollment in the typical White student’s district within a state. We calculate a comparable measure of Latinx–White differences in Latinx enrollment. We hypothesize that between-district racial sorting may have pernicious consequences when associated with spending variation across districts. Therefore, a measure of segregation that captures between-district sorting is key to assessing our theory of why segregation would matter for spending patterns. This unevenness measure captures between-district differences in racial composition. Since we are concerned about how differences in composition relate to spending patterns, this unevenness measure is the most appropriate for our between-district analysis. The following equation details this measure of segregation.

A value of 0 indicates a lack of segregation across districts within a state—for example, the proportion Black in the typical Black student’s district is the same as the proportion Black in the typical White student’s district. A value of 1 indicates complete segregation—in other words, Black and White students are in entirely separate school districts.
We measure racial socioeconomic segregation in a similar manner to the racial segregation measures, except we compute the difference in child poverty in the typical Black/Latinx student’s districts relative to the typical White student’s district. Poverty is measured using the Small Area Income and Poverty Estimates (SAIPE). SAIPE provides yearly estimates of poverty rates for school-age children living within a school district boundary (U.S. Census Bureau, n.d.). Our racial socioeconomic disparity measure is detailed below.
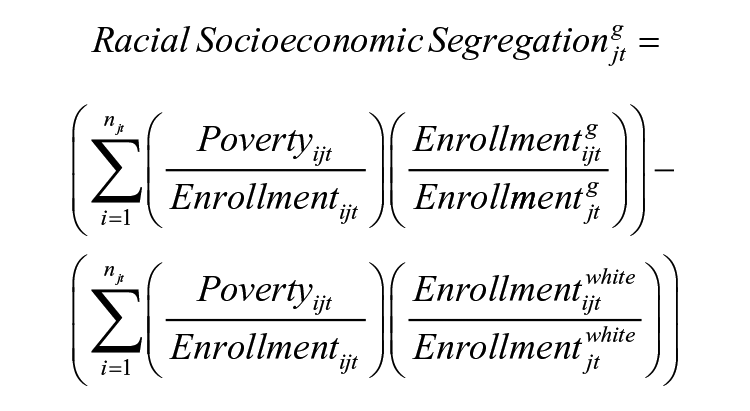
This measure spans values of −1 to 1. Positive values indicate that Black/Latinx students tend to be in districts with higher child poverty rates than White students. Negative values indicate that White students tend to be in districts with higher child poverty rates than Black/Latinx students in the same state.
Since SAIPE child poverty estimates are community-based measures instead of school-based measures, they capture differences in neighborhood poverty context. SAIPE estimates are often used in formulas determining district eligibility for compensatory federal aid (U.S. Department of Education, 2018). If racial socioeconomic segregation is related to expenditure patterns as a result of revenue constraints stemming from disparities in local property wealth, we would expect to see relationships between this measure of racial socioeconomic segregation and expenditure patterns.
We also include a series of controls for measures related to spending levels that may confound the relationship between racial segregation, racial socioeconomic segregation, and racial expenditure disparities. First is other-group segregation (i.e., Black–White differences in Latinx enrollment and Latinx–White differences in Black enrollment). Next, to address differences in operating costs based on district size, we control for racial disparities in the number of schools for every 1,000 students in a district. We also control for racial disparities in special education enrollment and English language learner enrollment, to address the fact that districts with high concentrations of these students will have higher costs for providing specialized services. To account for differences in spending due to geographic concentration, but not addressed with our CWI adjustment (e.g., the cost of busing), we also control for racial disparities in urbanicity (see online Supplemental Appendix Table A2 for details on the construction of the urbanicity measure). Finally, we control for the state proportion of child poverty, as well as state proportion Black, Latinx, Asian, and Native American to account for the potential impact of overall changes in student demographics within states.
Sample Restrictions
We restrict our analyses to traditional school districts with nonmissing data from 1999 through 2013. Out of 268,498 district-year observations between fiscal years 1999 and 2013 (inclusive), we exclude 67,241 district years. District-year observations are excluded for districts serving nontraditional populations (e.g., juvenile justice), that are located outside of the 50 states (e.g., territories), or are charter districts. 4 The District of Columbia and Hawaii are not included, because they each comprise one district, which makes it impossible to conduct an analysis of between-district within-state disparities. Finally, district-years with outlier values for total per pupil expenditures, missing expenditure data, or no 5- to 17-year-olds according to SAIPE estimates are also dropped. 5 See online Supplemental Appendix Table A3 for the number of districts excluded.
After these restrictions, we construct our analytical sample by collapsing the remaining 201,257 district-year observations to the state level to construct between-district measures of inequality. All models are run on these state-level measures of between-district disparities. We present models and descriptive statistics for the 641 state-year observations that are not missing on any of our control variables. See online Supplemental Appendix Table A4 for the state-year observations excluded from the primary models due to missing values.
Analysis
Our modeling strategy is to regress racial expenditure disparities by subcategory on racial segregation, racial socioeconomic segregation, other-group segregation, racial differences in the number of schools, special education enrollment, ELL enrollment, and our vector of state-year demographic controls (

This results in an estimate of the partial associations between state-level racial and racial socioeconomic segregation and racial expenditure disparities, net of racial differences in district characteristics, state-level demographics, and time-invariant characteristics of states and years.
Results
Descriptive Statistics
Table 1 presents descriptive statistics on state-level racial disparities. We first calculated means across years within each state and then calculated the mean across states. Recall that our disparity measures are all differences (e.g., Black minus White values). From this table, we can see that on average, both Black and Latinx total per pupil expenditures exceed White total per pupil expenditures by $229.53 and $126.15, respectively. This is anticipated due to the strong relationship between race and poverty (Reardon & Owens, 2014) and the increased federal funding targeted toward students in districts with concentrated poverty (Cascio & Reber, 2013). While total per pupil expenditures may be greater for the typical Black or Latinx students’ districts, there is variation in how these dollars are spent. On average, both Black and Latinx per pupil expenditures exceed White per pupil expenditures for administration, instruction, and social services. On the other hand, Black and Latinx per pupil expenditures are less than White per pupil expenditures on infrastructure. Black per pupil expenditures on all other items are slightly less than in the typical White student’s district, while Latinx spending is comparable. 6
Levels of Key Outcomes, Predictors, and Controls

Note. Means are first calculated within states across all years and then calculated across all states.
Table 1 also illustrates some familiar facts. Black and Latinx students’ typical districts tend to have higher levels of child poverty, on average, than the typical White student’s district (5.4 and 4.0 percentage points higher in Black and Latinx districts, respectively). Black and Latinx students also tend to be concentrated in districts with slightly more Black and Latinx peers, though average levels are greater for Black students (0.185) than for Latinx students (0.121).
To explore patterns over time, we present descriptive statistics on the trend in our outcome measures, key predictors, and controls in Table 2. To produce the descriptive statistics in Table 2, we first regressed each measure on fiscal year in separate regressions for each state to get an estimate of the trend across years within a state. We then found the mean of that trend across states, along with the standard deviation, minimum value, maximum value, and the 25th and 75th percentiles of that trend. The average trend across states in per pupil spending disparities tends to be positive, suggesting that states are spending more in the typical Black and Latinx students’ districts relative to the typical White student’s district over time. We can also see that year-to-year changes in between-district racial and racial socioeconomic segregation tend to be small. The average trend for Black–White segregation is slightly negative, while the average trend for Latinx–White segregation is slightly positive (−0.002 and 0.001, respectively). The average trend across states for racial socioeconomic segregation is positive for Black–White socioeconomic segregation and near 0 for Latinx disparities, though the trend ranges from −0.002 to 0.004. Though we do not measure poverty segregation (just racial poverty segregation), the positive average trend for Black–White socioeconomic segregation is unsurprising given other literature that finds increases in between-district economic segregation in the 2000s (Reardon & Owens, 2014).
Trends in Key Outcomes and Predictors

Note. Based on regressions of each variable on fiscal year in a separate regression for each state. We then calculated the mean, standard deviation, minimum, maximum, 25th percentile, and 75th percentile of the coefficient on the fiscal year variable.
To further contextualize the scale of the change in between-district racial and racial socioeconomic segregation in our analytical sample years, we present Figures 1 and 2. Figure 1 shows the change in between-district racial segregation between the first and last years a state is in our analytical sample. The horizontal axis in Figure 1 represents the level of racial segregation in the first fiscal year a state appears in our analytical sample (this is 1999 for most states, but not all; see online Supplemental Appendix Table A4). The vertical axis represents the change in racial segregation between the first and last year in the sample (2013 for most states). The points are weighted by Black or Latinx enrollment in the state in the last year a state is in the analytical sample.

Change in between-district racial segregation from first to last fiscal years.

Change in between-district racial socioeconomic segregation from first to last fiscal years.
From these two figures, we see that between-district Black–White segregation decreases for most states. Some states with relatively small Black enrollments did experience increases. The state with the largest decrease during this time is Michigan, which experienced about a 0.20 decrease in Black–White segregation. For Latinx–White segregation, we see that the states with the largest Latinx populations experienced a decline in between-district segregation, though the magnitude of that decline is less than the Black–White trend. Moreover, there are more states that experienced small increases in Latinx–White between-district segregation during the sample years. This pattern is consistent with prior literature that found declines in Black–White between-district segregation and small increases in Latinx–White segregation in the 2000s (Reardon & Owens, 2014).
Figure 2 can be interpreted the same way as Figure 1, except showing changes in between-district racial socioeconomic segregation. The vertical line at zero represents equal poverty in the typical Black and White students’ districts (or Latinx and White) in the first analytical year. From this figure, we see that in almost all states, poverty rates were higher in the typical Black and Latinx students’ districts than the typical White student’s district at the start of the panel. Moreover, there is more variation in the direction of the change in Black–White and Latinx–White socioeconomic segregation. Finally, the magnitude of the change is smaller than for racial segregation. Michigan, for example, experienced only a small change in racial socioeconomic segregation, despite its large decrease in racial segregation. This may be a result of changes in the public school population or the socioeconomic status of both Black and non-Black students.
Black–White Segregation, Racial Socioeconomic Segregation, and District Expenditures
The top half of Table 3 presents the coefficients of key predictors in our models regressing Black–White expenditure disparities on measures of Black–White racial segregation, Black–White socioeconomic segregation, controls, and state and year fixed effects. Positive coefficients indicate that our predictors are associated with shifts in spending that favor the typical Black student’s district relative to the typical White student’s district in a state. 7 Note that the sign of the coefficients cannot be understood as an indicator of whether racial spending gaps are growing or shrinking in an absolute value sense, since that relationship is dependent on whether spending in the typical Black student’s district is initially more than spending in the typical White student’s district. For example, if spending in the typical Black student’s district is greater than spending in the typical White student’s district, shifts in spending that disfavor Black students’ districts relative to White students’ districts will actually close spending gaps by bringing spending in Black students’ districts closer to spending in White students’ districts. In contrast, if Black students’ districts start off far behind White students’ districts in terms of spending, shifts that disfavor Black students’ districts will widen racial spending gaps, resulting in Black students’ districts falling further behind. Therefore, the sign of the coefficients does not provide insight on the size of the spending disparities but does provide insight on how shifts favor one group relative to another.
Racial Disparities in School District Expenditures Predicted by Racial Segregation and Racial Socioeconomic Segregation, 1999–2013

Note. Based on regressions of Black–White and Latinx–White expenditure disparities on racial segregation and racial socioeconomic segregation. Models include state and year fixed effects (FE) with standard errors clustered at the state level. Constant not shown. Additional controls not shown include racial disparities in other-group enrollment, district size, special education enrollment, ELL/LEP (English language learners/limited English proficiency) enrollment, and urbanicity; as well as the state proportions SAIPE (Small Area Income and Poverty Estimates), Black, Latinx, Asian, and Native American.
p < .05. **p < .01. ***p < .001.
The first finding to note is the lack of a statistically significant relationship between Black–White socioeconomic segregation and expenditure disparities. While Black–White socioeconomic segregation is marginally associated with other per pupil expenditure disparities (β = 826.97, p = .097), none of the relationships are significant at conventional levels. In other words, when Black students are increasingly concentrated in districts with higher levels of poverty than the typical White student’s district, there is little evidence of relative shifts in total expenditures or any expenditure subcategory. The second noteworthy finding is the significant relationship between Black–White racial segregation and Black–White total and other expenditure disparities. Table 3 shows that as Black–White racial segregation within a state increases, per pupil total expenditures shift in a way that disfavors the typical Black student’s district relative to the typical White student’s district in a state. A one-unit increase in Black–White racial segregation is associated with $4986.22 shift in total per pupil expenditures (for every $10,000 of total spending) disfavoring the typical Black student’s district relative to the typical White student’s district. A one-unit change represents a large change—a shift from complete segregation to complete integration. One way to contextualize this coefficient is to consider changes of a smaller magnitude that more realistically reflect the variation in segregation over time. Returning to Table 2, the standard deviation of Black–White segregation trends is about 0.04. Throughout the remainder of the article, we consider changes at this magnitude. For example, the typical Black student’s district in a state that experienced a 0.04 unit increase in Black–White segregation would experience a $199.45 relative decrease (i.e., −$4,986.22 × 0.04) in per pupil total expenditures for every $10,000 of average spending. That magnitude reflects about 2% of a state’s average 2006 spending. As racial segregation increases net of poverty and other disparities, money is shifted in a way that disfavors the typical Black student’s district relative to the typical White student’s district.
Black–White racial segregation is also associated with significant shifts in dollars for the other expenditure category. A 0.04 increase in Black–White racial segregation would represent a decrease of $81.45 in per pupil other expenditures (i.e., −$2,036.34 × 0.04) in the typical Black student’s district relative to the typical White student’s district, for every $10,000 of average spending. Finally, we find a marginally significant and negative relationship between Black–White segregation and instructional spending (β = −1754.97, p = .073). In supplemental analyses (see online Supplemental Appendix B), we explore the extent to which this marginal relationship may be driven by changes in class size. To do so we ran a version of our models where the outcome is a measure of racial disparities in the student–teacher ratio, instead of racial expenditure disparities. Racial socioeconomic segregation is only significant in the version of the model where outlier student–teacher ratios are treated as missing (β = 7.72, SE = 3.63; see online Supplemental Appendix Table B3). Thus, these supplemental analyses do not provide strong evidence that this observed relationship is driven by class size.
In sum, we see that increasing Black–White racial segregation between 1999 and 2013 was associated with shifts in total and other per pupil expenditures that disfavor the typical Black student’s district relative to the typical White student’s district. There is some evidence that instructional spending also changed in a manner disfavoring the typical Black student’s district. We also find no significant relationship between racial socioeconomic segregation and spending patterns at conventional levels, though racial socioeconomic segregation is marginally and positively related to other per pupil expenditure disparities.
Latinx–White Segregation, Racial Socioeconomic Segregation, and District Expenditures
The lower half of Table 3 presents results from our models predicting Latinx–White standardized dollar differences. As with the Black–White expenditure disparity models, we find that there is no statistically significant relationship between Latinx–White socioeconomic segregation and Latinx–White expenditure disparities.
We also find that Latinx–White racial segregation is a significant predictor of expenditure disparities, net of Latinx–White socioeconomic segregation and other controls. Yet the pattern of Latinx–White expenditure disparities differs from that of Black–White disparities. Increases in Latinx–White segregation are significantly related to shifts in per pupil infrastructure expenditures that disfavor the typical Latinx student’s district relative to the typical White student’s district. A shift of 0.04 in Latinx–White segregation would represent a $51.73 relative shift (i.e., −$1,293.35 × 0.04) in infrastructure spending disfavoring the typical Latinx student’s district relative to the typical White student’s district. This represents a magnitude of less than 1% of spending by the state in 2006. Increases in Latinx–White segregation are also significantly related to a relative increase in per pupil other expenditures. A shift of 0.04 in Latinx–White segregation would represent a shift of $36.77 (i.e., $919.22 × 0.04) in other per pupil spending favoring the typical Latinx student’s district relative to the typical White student’s district. 8
Additional Analyses
We conduct several additional analyses to explore patterns of heterogeneity and to verify the robustness of our findings. First, we explore heterogeneity across states by the general direction of the racial segregation trend during our analytical sample years. The fact that most states experienced declines in racial segregation during this period means that the estimates are noisy, even when the point estimates are relatively large. However, we do find evidence that in states where Latinx–White segregation generally increased, Latinx–White racial segregation is significantly associated with shifts in administrative and other per pupil expenditures that disfavor the typical Latinx student’s district. Yet in those same states, instructional spending shifted in ways that favored the typical Latinx student’s district. There is also evidence of heterogeneity across time. In the period after the Great Recession, racial segregation for Black and Latinx students is associated with shifts of spending that favor the typical Black and Latinx students’ districts. Finally, in a series of robustness checks, we find our main models are robust to the CWI adjustment, adjusting dollar differences by typical spending, and the correlation between segregation measures (see online Supplemental Appendix B). 9
Discussion and Conclusion
This analysis explored how recent trends in between-district segregation were related to district spending patterns. This descriptive evidence is a starting point to understanding how segregation might produce educational disparities through its relation to spending decisions. We found evidence that between-district racial segregation is associated with racial disparities in school district spending, while between-district racial socioeconomic segregation is not. We find that as Black–White racial segregation increases over time, total per pupil expenditures and other per pupil expenditures shift in ways that disfavor the typical Black student’s district relative to the typical White student’s district. We also find that Latinx–White segregation is associated with a relative shift of per pupil infrastructure expenditures that disfavors the typical Latinx student’s district and a shift of per pupil other expenditures that favors the typical Latinx student’s district. While shifts are modest in terms of all the money that school districts spend, they are meaningful in terms of what those dollar differences might buy. These shifts may be the difference between hiring and firing a teacher, investing in needed building improvements, or maintaining adequate food service staff at lunchtime.
Since racial and racial socioeconomic segregation have, on average, been decreasing in many states, we could also interpret these results as representing relative spending increases as segregation declined (as opposed to the relative spending decreases as segregation increased). In other words, as districts within a state are less racially segregated, there is relatively more total and other expenditures for Black students’ districts and relatively more infrastructure expenditures for Latinx students’ districts. Yet, no matter the framing, any observed association between racial segregation, net of poverty disparities and district characteristics, remains problematic. There is little reason to think that race should drive spending, after accounting for a range of demographic characteristics. Latinx students experiencing higher infrastructure spending as segregation decreases is just as problematic as Latinx students experiencing lower infrastructure spending as segregation increases, since both are evidence that infrastructure spending dollars are following some racial groups and not others. Policies targeting the relationship between segregation and spending need to consider how certain types of spending come to be associated with some groups and not others. Understanding this relationship is necessary to ensure that any future increases in segregation do not translate into resource disparities.
While we cannot fully disentangle the mechanisms that link patterns of between-district segregation and disparities in spending, our findings are consistent with some possible explanations. First, the findings for Black–White disparities are consistent with an explanation of resource constraints necessitating limits on spending in subcategories. The negative and (at least marginally) significant relationships between racial segregation and total, other, and instructional per pupil expenditure disparities could occur if the typical Black student’s district is forced to cut spending as revenues decline. Though our data do not allow us to make more definitive statements about the substantive meaning of significant findings in the catchall “other” category, recall that this category includes items such as transfers to other governments, food services, enterprise operations, and items related to multiple subcategories (see online Supplemental Appendix Table A1). What exactly gets included in these items likely varies across districts, states, and time. Still, this constructed category of “other” expenditures can be generally thought of as containing miscellaneous mostly nonpersonnel items. The significant relationships observed for “other” expenditures might reflect reductions in these kinds of nonpersonnel costs. For example, cutting food services staff, reducing overhead costs, or decreasing transfer obligations as a result of enrollment declines might lead to less “other” expenditures. The marginally significant results for instructional spending, in turn, could result from many factors, including changing characteristics of instructional personnel, hiring practices, or collective bargaining agreements. Our modeling does not provide strong evidence that class size is changing. Future work should use measures of teacher and personnel characteristics to explore whether these characteristics vary with segregation.
The findings for Latinx–White expenditure disparities are more consistent with demographic characteristics driving differences in spending. We do not find a significant relationship between Latinx–White segregation and total expenditures as the resource constraints hypothesis would predict. This is consistent with prior work that also did not find a significant relationship with Latinx–White segregation and total revenue disparities (Weathers & Sosina, 2019). We do, however, find evidence of changing spending patterns. The significant relative shift in dollars away from infrastructure and toward other spending for the typical Latinx student’s district relative to the typical White student’s district is consistent with demographic characteristics, not revenue constraints, driving spending patterns. Contrary to our hypothesis, however, it is not spending in personnel categories (e.g., administrative, instructional, or social support services) that seems to shift with Latinx–White segregation, but spending in categories with more nonpersonnel costs (e.g., infrastructure and other spending). A wide range of mechanisms that we cannot explicitly test could lead to this result. It might be the case that nonpersonnel categories are easier to change, due to state mandates and the restrictions attached to earmarked funding. It might also be the case that political actions such as voter referendums and local advocacy change with segregation in ways that influence spending patterns. Understanding how these relationships contribute to racial disparities in district spending patterns would be a valuable next step in future research, particularly given the recent evidence that infrastructure spending matters for student outcomes (Conlin & Thompson, 2017; Goncalves, 2015; Hong & Zimmer, 2016). Future research should also explore heterogeneity in the relationships reported here, perhaps by state characteristics and policies, to further understand how such disparities may come to exist.
Though the observed relationships are small in magnitude, they suggest that school district spending varies in racialized ways. Above and beyond the implications for student performance, the differential investment in the provision of public goods by race is concerning in and of itself. Future research should extend this analysis to focus on the mechanisms and consequences of the relationship between contemporary patterns of segregation and disparities in school expenditures.
Supplemental Material
supplemental-materials_cond-acc-revisions_final – Supplemental material for Pathways to Inequality: Between-District Segregation and Racial Disparities in School District Expenditures
Supplemental material, supplemental-materials_cond-acc-revisions_final for Pathways to Inequality: Between-District Segregation and Racial Disparities in School District Expenditures by Victoria E. Sosina and Ericka S. Weathers in AERA Open
Footnotes
Acknowledgements
We thank sean reardon for his thoughtful feedback and suggestions. We also thank Demetra Kalogrides for providing the school level CCD imputations used in this paper and Ismael Muñoz for research assistance.
Authors’ Notes
First authorship is shared between the first two authors, who made equal contributions to this publication.
Funding
The research reported here was supported by the Institute of Education Sciences, U.S. Department of Education, through Grant R305B140009 to the Board of Trustees of the Leland Stanford Junior University and the Karr Family Graduate Fellowship. The opinions expressed are those of the authors and do not represent views of the Institute, the U.S. Department of Education, the Karr Family, or the Board of Trustees of the Leland Stanford Junior University.
Notes
Authors
VICTORIA E. SOSINA is a doctoral candidate affiliated with the Center for Education Policy Analysis at Stanford University. Her research explores how racial, ethnic, and socioeconomic context matter for educational inequality.
ERICKA S. WEATHERS is an assistant professor of education (educational theory and policy) in the Department of Education Policy Studies at The Pennsylvania State University. Her research uses quasi-experimental methodologies to understand the causes and consequences of racial and socioeconomic inequality in education.
References
Supplementary Material
Please find the following supplemental material available below.
For Open Access articles published under a Creative Commons License, all supplemental material carries the same license as the article it is associated with.
For non-Open Access articles published, all supplemental material carries a non-exclusive license, and permission requests for re-use of supplemental material or any part of supplemental material shall be sent directly to the copyright owner as specified in the copyright notice associated with the article.