
Abstract
There is growing interest in the relation between the racial achievement gap and the racial discipline gap. However, few studies have examined this relation at the national level. This study combines data from the Stanford Education Data Archive and the Civil Rights Data Collection and employs a district fixed effects analysis to examine whether and the extent to which racial discipline gaps are related to racial achievement gaps in Grades 3 through 8 in districts across the United States. In bivariate models, we find evidence that districts with larger racial discipline gaps have larger racial achievement gaps (and vice versa). Though other district-level differences account for the positive association between the Hispanic-White discipline gap and the Hispanic-White achievement gap, we find robust evidence that the positive association between the Black-White discipline gap and the Black-White achievement gap persists after controlling for a multitude of confounding factors. We also find evidence that the mechanisms connecting achievement to disciplinary outcomes are more salient for Black than White students.
Introduction
Racial disparities in academic achievement and exclusionary school discipline have been persistent features of U.S. public schooling for decades (e.g., Curran, 2016; Gregory & Weinstein, 2008; Kinsler, 2011; Magnuson & Duncan, 2006). In recent years, scholars concerned with matters of racial equity in schooling have begun to frame the two as interrelated, even as “two sides of the same coin” (Gregory, Skiba, & Noguera, 2010). This framing often begins with evidence that Black students, and, to a lesser but still relevant degree, Hispanic students, are differentially exposed to virtually all forms of school discipline relative to White students (Krezmien, Leone, & Achilles 2006; Skiba, Michael, Nardo, & Peterson, 2002). Scholars have then linked these differential rates of discipline to achievement disparities by pointing to evidence of the negative impacts of exclusionary discipline on achievement-related outcomes, including missing out on instructional time (Arcia, 2006), developing negative academic self-concepts (Taylor, Davis-Kean, & Malanchuk, 2007), placement in lower tracked courses (Watts & Erevelles, 2004), and dropping out of school (Christle, Jolivette, & Nelson, 2007). According to this reasoning, any racial disparities in disciplinary outcomes that systematically affect students of color at higher rates than White students would naturally be associated with systematic racial discrepancies in achievement, controlling for other factors.
Despite growing awareness of the potential relation between them, there is limited empirical evidence, especially at the national level, about the link between the racial discipline gap and the racial achievement gap (for notable exceptions, see Gopalan, 2018; and Shores, Kim, & Stills, 2019). And despite its intuitive appeal, there is at least some evidence to question the proposed magnitude and perhaps even the proposed direction of the association between discipline and achievement gaps. For instance, although discipline disparities between White and minority students have steadily grown over the past several decades (Losen, Hodson, Keith, Morrison, & Belway, 2015) the Black-White achievement gap has been cut nearly in half during the same time period (Reardon, 2011). Contrary to a “two sides of the same coin” hypothesis, these trends would imply a negative correlation between discipline and achievement gaps. Moreover, several recent studies have demonstrated potentially positive impacts of suspension on the academic achievement of suspended students as well as their peers (Anderson, Ritter, & Zamarro, 2017; Kinsler, 2013). This counterargument to what many regard as conventional knowledge in matters of racial equity in schooling—that discipline gaps are part and parcel with achievement gaps—suggests the need for a rigorous evaluation of the relationship between racial disproportionality in suspension rates and the racial achievement gap at a scale sufficient to make generalized claims about any relation between them.
This article combines data from the Stanford Education Data Archive (SEDA), which contains achievement gap information for approximately 2,000 school districts nationwide with disciplinary data from the Civil Rights Data Collection (CRDC). The combined data set provides for a unique glimpse at the intersection of achievement and discipline disparities across the United States. In particular, we seek to answer several descriptive questions that have largely gone unaddressed in previous educational research: Are racial discipline gaps related to racial achievement gaps in school districts across the Unites States? If so, what is the magnitude of these correlational relationships? And, finally, do these relationships persist after accounting for differences across school districts?
Background
Scholars have long documented, with remarkable consistency, persistent gaps in achievement and in rates of exclusionary discipline between White and minority children that begin at school entry (Burchinal et al., 2011; Curran & Kellogg, 2016; Fryer & Levitt, 2006; Krezmien et al., 2006) and carry forth and even grow as children progress through formal schooling (Fryer & Levitt, 2004; Losen, 2014). As noted in the introduction, however, only recently have scholars begun to frame the two as related to one another, and there is not yet consensus on the expected direction or magnitude of the relationship (Anyon, Zhang, & Hazel, 2016; Hirschi, 1969; Hoffmann, Erickson, & Spence, 2013). Some research suggests that larger discipline gaps would be associated with larger achievement gaps (e.g., Anyon et al., 2016; Goodman, 2014; Hinze-Pifer & Sartain, 2018; McNeely, Nonnemaker, & Blum, 2002), whereas other research suggests that larger discipline gaps could be associated with smaller achievement gaps (e.g., Anderson et al., 2017; Carrell, Hoekstra, & Kuka, 2016; Imberman, Kugler, & Sacerdote, 2012; Kinsler, 2013; Losen et al., 2015; Morris & Perry, 2016; Reid, 2012; Zhang, Musu-Gillette, & Oudekerk, 2016). (See online Supplemental Appendix A for a full summary of this literature.) Moreover, existing research has primarily assumed a causal directionality from the discipline gap to the achievement gap despite evidence that poor achievement can led to disciplinary problems in school (e.g., Anyon et al., 2016; Maguin & Loeber, 1996; Savolainen et al., 2012). Consequently, very little is also known about whether the achievement gap predicts the discipline gap.
To date, the most rigorous empirical study to explicitly examine the relation between the achievement gap and the discipline gap did so in a single school district in Kentucky, finding that the Black-White discipline gap accounted for approximately one fifth of the Black-White achievement gap in that district (Morris & Perry, 2016). However, it remains unclear whether the patterns observed in Kentucky are the norm or an outlier nationwide, or whether the inverse relation might exist as well—that is, whether the achievement gap uniquely predicts the discipline gap. In the current article, we broaden our focus and provide direct empirical evaluation at the national level of whether and the extent to which a relation between the achievement gap and the discipline gap actually exists.
Method
Data
To examine the relation between racial discipline gaps and racial achievement gaps, we drew district-level data from two sources. First, we gathered disciplinary data for the 2011–2012 and 2013–2014 school years from the CRDC. Second, we gathered achievement data for the 2011–2012 and 2013–2014 school years from the SEDA version 2.1. 1 We limited our focus to the 2011–2012 and 2013–2014 school years because these were the only two school years for which a CRDC census of all U.S. public schools overlapped available SEDA data.
Racial Achievement Gaps
We measure racial achievement gaps as district-level disparities in achievement for ethnoracial minority students compared with their White counterparts in Grades 3 through 8. The reason achievement disparities were measured for Grades 3 through 8 is that these are the grade levels tested nationally under No Child Left Behind (these are the only grades for which national achievement data are available). The underlying achievement data were originally gathered by SEDA researchers from the EDFacts data system at the U.S. Department of Education. EDFacts collected test score data from each state’s annual standardized testing program. Under the No Child Left Behind Act, each state was required to assess every student enrolled in public school in the subjects of English Language Arts and Math and report to federal agencies respective counts of students scoring at various proficiency levels (e.g., basic, proficient, advanced) disaggregated by race. These subgroup counts were then used to estimate district-level means and standard deviations of the underlying test score distributions for each racial group using the heteroskedastic ordered probit model, as introduced by Reardon, Shear, Castellano, and Ho (2017). These estimates were then linked to a common scale and standardized relative to the national distribution of scores based on methods described in Reardon, Kalogrides, and Ho (2017). These standardized measures were then used to create estimates of racial achievement gaps, which were calculated by taking the difference of the standardized estimated means between racial groups. Consequently, these achievement gaps are interpretable as standard deviation differences in achievement between racial groups.
SEDA reports racial achievement gap information for all districts serving at least 20 students in each racial category for which the achievement gap is reported (e.g., districts for whom Black-White achievement gaps are reported enroll at least 20 Black and White students, respectively). Because the vast majority of school districts nationwide enroll very few minority students, the analytic sample of school districts reporting racial achievement gaps contain less than one quarter of all U.S. school districts. However, school districts in the analytic sample contained 93% of Black students and 93% of Hispanic students enrolled in public schools in Grades 3 through 8 nationwide. This pattern of minority students being nearly fully represented in the small sample of school districts in the analytic sample is an expression of the high levels of racial segregation that still characterize U.S. school districts (Reardon & Owens, 2014). (It should be noted that the share of Asian students and American Indian/Pacific Islander students is too small to produce reliable national estimates for racial achievement disparities between them and White students.) To increase precision, we pooled estimated achievement gaps across Grades 3 through 8 for both math and English Language Arts during the 2011–2012 and 2013–2014 school years, respectively. The result was a single estimate of school-year-specific Black-White and Hispanic-White achievement gaps, respectively.
Racial Discipline Gaps
We measure racial discipline gaps as the school-year-specific difference in out-of-school suspension rates between ethnoracial minorities (Black and Hispanic students, respectively) and White students. Although out-of-school suspensions are an imperfect proxy for the broader disciplinary environment of a school (e.g., Skiba et al., 2011), out-of-school suspensions are by far the most commonly used metric to assess racial disproportionality in discipline. Consequently, using out-of-school suspension rates allows us to situate our findings with regard to the larger body of school discipline research.
Suspension rates were gathered from the 2011–2012 and 2013–2014, which provided suspension counts by race for every public school in the country. Prior to aggregating school-level counts to the district level, we excluded any school that reported a missing suspension count for any racial group. 2 We also excluded schools classified as alternative, vocational, special education, or other. Notably, substantive conclusions were robust to the inclusion or exclusion of charter schools when computing district-level discipline gaps (see Table D.1 in the online Supplemental Appendix), so we chose to keep them in our primary analysis. Because achievement gaps were computed for Grades 3 through 8, we restricted suspension counts to those from schools with at least one grade level between third through eighth (most elementary and middle schools are therefore included).
District suspension rates by race were computed as the number of students by race who experienced out-of-school suspension one or more times in a given school year divided by the total number of students by race in the district. Because suspension counts were measured in terms of students and not incidents, values greater than 1 were theoretically impossible. We therefore designated any suspension rate that exceeded 1 as a missing value. 3
To be clear, we measured racial discipline gaps in terms of risk differences: the suspension rates for minority students (Black and Hispanic students, respectively) minus the suspension rates for White students in each school district. Therefore, a risk difference greater than zero means that minority students are suspended at higher rates than White students. As a robustness check, we also report results wherein discipline gaps are measured in terms of relative risk ratios, that is, the suspension rates for minority students divided by the suspension rates for White students in each district. A risk ratio greater than 1, then, means that minority students are at a greater risk for suspension relative to White students. As discussed in more detail in the Results section, substantive conclusions are robust to this alternative measure of disciplinary disparity.
Control Variables
In addition to examining whether an unadjusted relation exists between the racial discipline gap and the racial achievement gap, we also explored whether any relation between them persists after accounting for other district- and community-level differences. The first set of measures captures the sociodemographic composition of school districts, which were gathered from the 2011–2012 and 2013–2014 Common Core of Data. There is some evidence that schools with greater shares of ethnoracial minority and low-income students have poorer overall achievement and are more likely to engage in exclusionary discipline practices (Curran, 2017; Palardy, 2013; Payne & Welch, 2010; Wiggan, 2007). Therefore, we include measures for the share of students qualifying for free and reduced-price lunch, the share of district students who are White, and the percentage of students who are English language learners. Additionally, because demographic compositions may vary within districts across its constituent schools, we also control for district-level racial and income segregation, both measured as Theil indices (Reardon et al., 2008). Moreover, there is evidence that larger schools, especially those in urban areas, face unique challenges with respect to discipline and student achievement, especially if they are underresourced (Milner, 2015). Consequently, this study controls for a logged measure of total enrollment, a binary indicator of whether a district was located in an urban area, and a measure of per-pupil expenditures. There is also some evidence that while charter schools may be particularly effective at raising the academic achievement of minority students (Abdulkadiroglu, Angrist, Dynarski, Kane, & Pathak, 2011; Angrist, Dynarski, Kane, Pathak, & Walters, 2012), they may also employ exclusionary discipline practices at elevated rates (Losen, Keith, Hodson, & Martinez, 2016). Consequently, we include a measure for the percentage of students in a district enrolled in charter schools overall as well as racial differences in charter school exposure.
It is also possible that discipline and achievement disparities may arise as the result of a broader racial climate in a school district that disproportionately favors White students over Black or Hispanic students, such as attitudes that lead teachers and administrators to differentially suspend students by race or that lead teachers to differentially cater to the academic needs of one group of students over the other (Mattison & Aber, 2007). This study therefore controls for two proxies of a district’s broader racial climate: differential special education assignment by race and differential gifted and talented assignment by race. 4 In addition to differential treatment by race, a potential relation between racial achievement gaps and racial discipline gaps might also be confounded by racial disparities in other key educational inputs. For instance, discipline gaps and achievement gaps may arise because students of color are disproportionately of lower income or because they are in bigger classes. Consequently, we also control for racial differences in free and reduced-price lunch status, and racial differences in student-teacher ratios.
Finally, prior research has shown that out-of-school factors, especially those related to poverty, influence student achievement and disciplinary problems, with poverty-related factors being inversely related to student achievement and positively related to disciplinary problems (Gregory et al., 2010). Consequently, this study controls for a set of factors at the community level that approximate the amount of disadvantage within district neighborhoods. The following characteristics were gathered from the 2009–2014 American Community Survey and aggregated to the level of the school district: median income, percentage of adults with bachelor’s degree or higher, percentage of households that are female headed, unemployment rates, and percentage of residents living at or below the federal poverty line.
Analytic Strategy
Our analysis proceeds as follows: We begin by describing the magnitudes of achievement gaps and discipline gaps in school districts across the United States. We then examine bivariate relationships among them and conclude by describing a set of multivariate, fixed effect models that control for observed and time-invariant unobserved differences across districts. A key limitation of our data is the inability to establish definitively the temporal order of discipline versus achievement outcomes in our data set. Although statewide assessments are generally administered during the spring of a given academic year, some states administer assessments in the fall (U.S. Department of Education, 2014). Moreover, even if student performance on statewide assessments is assessed in the spring, this performance likely reflects students’ academic success over the course of the school year on such items as routine tests and formative assessments (e.g., spelling tests, math quizzes). Consequently, students’ awareness of their own academic standing could in fact be established early in the year, regardless of when statewide assessments are administered. In short, the temporal order of discipline gaps relative to achievement gaps is not entirely clear in our data, even if statewide assessments were measured, on average, after disciplinary sanctions.
We therefore estimate models alternatively for achievement gaps and discipline gaps (i.e., we estimate separate regressions in which we treat each as the outcome of interest, and, by extension, each as the independent variable of interest). In particular, we draw on two panels of data from the 2011–2012 and 2013–2014 school years and estimate models with district- and year-fixed effects according to the following specifications:

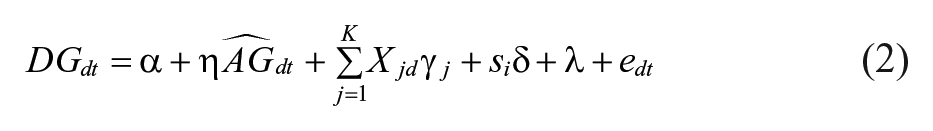
where
Results
Descriptive Statistics
Figures 1 and 2 illustrate the association of district-level achievement gaps and district-level discipline gaps for Black versus White and Hispanic versus White students, respectively. Each point in the figures refers to a school district; the size of each point is proportional to the size of the districts in terms of enrollment. The y-axis refers to the achievement gap and the x-axis refers to the discipline gap. Overall, there is a positive achievement-discipline gradient across U.S. school districts for both Black versus White and Hispanic versus White students. In particular, districts with larger discipline gaps have larger achievement gaps and vice versa. The R2 from these two models are 0.06 and 0.08, respectively, indicating that the unadjusted correlation between district-level achievement gaps and district-level discipline gaps for Black versus White and Hispanic versus White students is roughly 0.25 and 0.29, respectively.
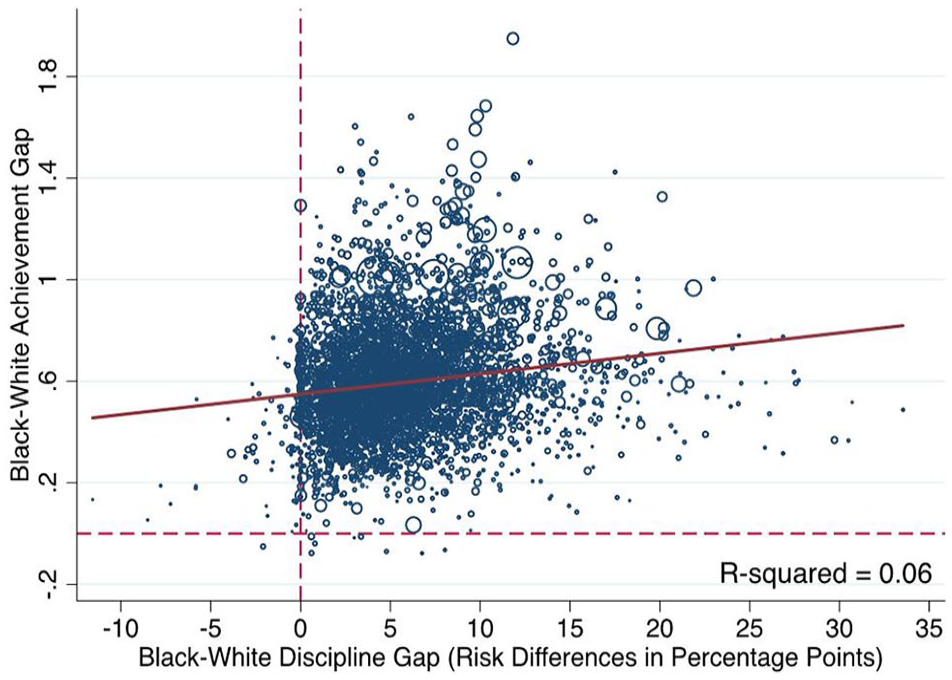
Black-White achievement gap and Black-White discipline gap.
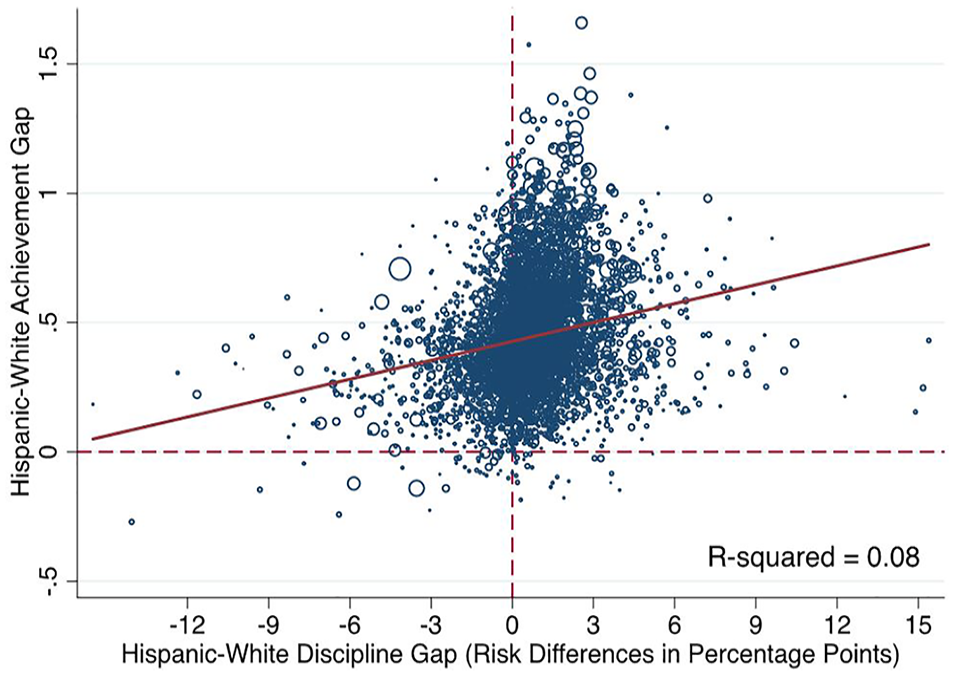
Hispanic-White achievement gap and Hispanic-White discipline gap.
Several other patterns are visible from these figures. First, while discipline gaps are associated with achievement gaps (and vice versa), there is quite a bit of variation in the magnitudes of achievement gaps, even among districts with similar discipline gaps. The conditional standard deviation of achievement gaps around the fitted line is roughly 0.20 in both figures; districts with similar discipline gaps vary in some cases by over 0.60 standard deviations in their achievement gaps. Second, note that in only a few districts (less than 2%) are Black students suspended at rates below that of White students. This corresponds to a mean Black-White discipline gap in the analytic sample of 6 percentage points. This contrasts somewhat to Hispanic and White disparities in which White and Hispanic students are suspended at similar rates (the average Hispanic-White discipline gap is 1 percentage point). Finally, even when discipline gaps are zero (i.e., suspension rates for ethnoracial minorities are equal to those for White students), Black-White and Hispanic-White achievement gaps are roughly 0.55 and 0.42 standard deviations, respectively. Note that in the average school district, the achievement gap between Black and White students is 0.58 standard deviations and the average achievement gap between Hispanic and White students is 0.48 standard deviations. (Descriptive statistics for achievement and discipline gaps as well as observed covariates are summarized in Table E.1 in the online Supplemental Appendix.)
Bivariate and Multivariate Results
In order to describe the partial associations between achievement and discipline gaps after controlling for potential differences across districts, we present a series of regression models that include the full set of covariates described above. Tables 1 and 2 regress the achievement gap on the discipline gap for Black versus White and Hispanic versus White students, respectively. Tables 3 and 4 regress the discipline gap on the achievement gap for Black versus White and Hispanic versus White students, respectively. Column 1 in each table reports bivariate estimates related to the simple correlations described in the previous section. (To be clear, these estimates are not equivalent to simple correlations because both measures are not standardized.) Columns (2) through (6) include an increasingly robust set of control variables. Column (2) controls for general district-level characteristics. Column (3) controls for racial and income segregation within districts. Column (4) controls for racial disparities in district-level characteristics. Column (5) controls for community-level differences. Finally, Column (6) includes district fixed effects to control for any unobserved characteristics that do not change between survey years.
Ordinary Least Squares Regression of Black-White Achievement Gaps on Black-White Discipline Gaps and Other Factors Across U.S. School Districts, Grades 3 through 8, 2011–2012 and 2013–2014 School Years
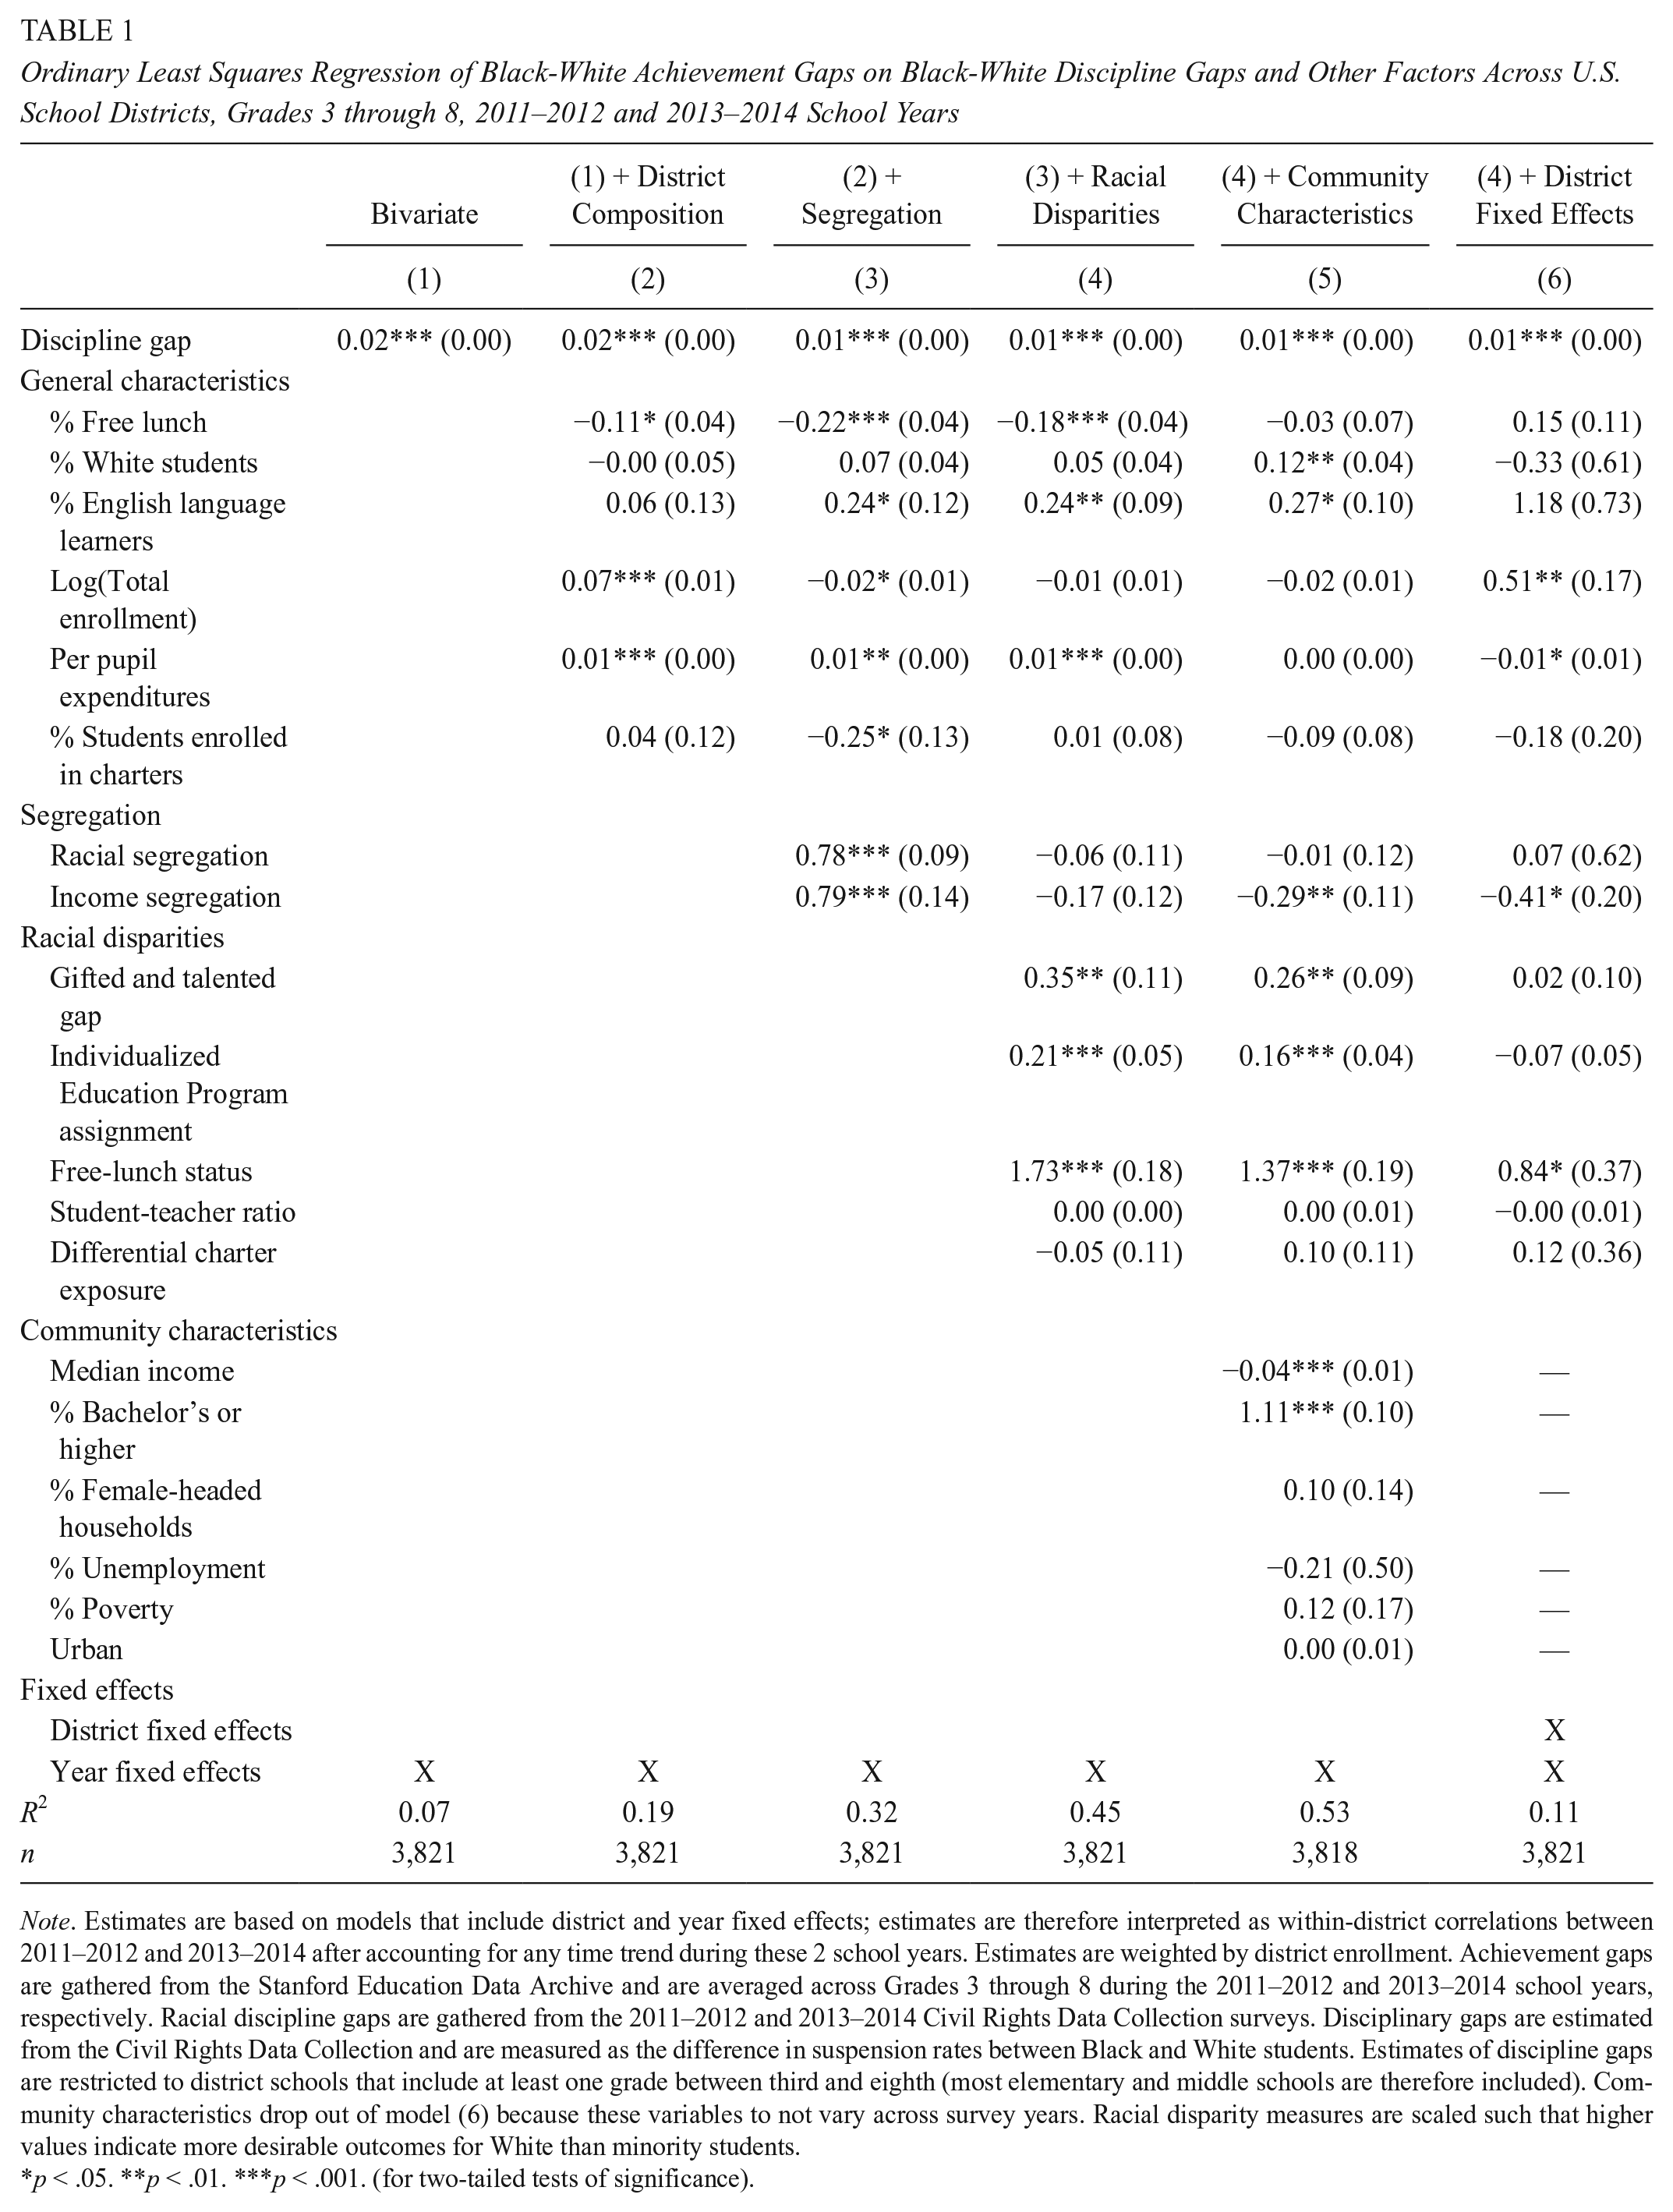
Note. Estimates are based on models that include district and year fixed effects; estimates are therefore interpreted as within-district correlations between 2011–2012 and 2013–2014 after accounting for any time trend during these 2 school years. Estimates are weighted by district enrollment. Achievement gaps are gathered from the Stanford Education Data Archive and are averaged across Grades 3 through 8 during the 2011–2012 and 2013–2014 school years, respectively. Racial discipline gaps are gathered from the 2011–2012 and 2013–2014 Civil Rights Data Collection surveys. Disciplinary gaps are estimated from the Civil Rights Data Collection and are measured as the difference in suspension rates between Black and White students. Estimates of discipline gaps are restricted to district schools that include at least one grade between third and eighth (most elementary and middle schools are therefore included). Community characteristics drop out of model (6) because these variables to not vary across survey years. Racial disparity measures are scaled such that higher values indicate more desirable outcomes for White than minority students.
p < .05. **p < .01. ***p < .001. (for two-tailed tests of significance).
Ordinary Least Squares Regression of Hispanic-White Achievement Gaps on Hispanic-White Discipline Gaps and Other Factors Across U.S. School Districts, Grades 3 through 8, 2011–2012 and 2013–2014 School Years

Note. Estimates are based on models that include district and year fixed effects; estimates are therefore interpreted as within-district correlations between 2011–2012 and 2013–2014 after accounting for any time trend during these 2 school years. Estimates are weighted by district enrollment. Achievement gaps are gathered from the Stanford Education Data Archive and are averaged across Grades 3 through 8 during the 2011–2012 and 2013–2014 school years, respectively. Racial discipline gaps are gathered from the 2011–2012 and 2013–2014 Civil Rights Data Collection surveys. Disciplinary gaps are estimated from the Civil Rights Data Collection and are measured as the difference in suspension rates between Hispanic students and White students. Estimates of discipline gaps are restricted to district schools that include at least one grade between third and eighth (most elementary and middle schools are therefore included). Community characteristics drop out of model (6) because these variables to not vary across survey years. Racial disparity measures are scaled such that higher values indicate more desirable outcomes for White than minority students.
p < .05. **p < .01. ***p < .001. (for two-tailed tests of significance).
Ordinary Least Squares Regression of Black-White Discipline Gaps on Black-White Achievement Gaps and Other Factors Across U.S. School Districts, Grades 3 through 8, 2011–2012 and 2013–2014 School Years

Note. Estimates are based on models that include district and year fixed effects; estimates are therefore interpreted as within-district correlations between 2011–2012 and 2013–2014 after accounting for any time trend during these 2 school years. Estimates are weighted by district enrollment. Achievement gaps are gathered from the Stanford Education Data Archive and are averaged across Grades 3 through 8 during the 2011–2012 and 2013–2014 school years, respectively. Racial discipline gaps are gathered from the 2011–2012 and 2013–2014 Civil Rights Data Collection surveys. Disciplinary gaps are estimated from the Civil Rights Data Collection and are measured as the difference in suspension rates between Black and White students. Estimates of discipline gaps are restricted to district schools that include at least one grade between third and eighth (most elementary and middle schools are therefore included). Community characteristics drop out of model (6) because these variables to not vary across survey years. Racial disparity measures are scaled such that higher values indicate more desirable outcomes for White than minority students.
p < .05. **p < .01. ***p < .001. (for two-tailed tests of significance).
Ordinary Least Squares Regression of Hispanic-White Discipline Gaps on Hispanic-White Achievement Gaps and Other Factors Across U.S. School Districts, Grades 3 through 8, 2011–2012 and 2013–2014 School Years

Note. Estimates are based on models that include district and year fixed effects; estimates are therefore interpreted as within-district correlations between 2011–2012 and 2013–2014 after accounting for any time trend during these 2 school years. Estimates are weighted by district enrollment. Achievement gaps are gathered from the Stanford Education Data Archive and are averaged across Grades 3 through 8 during the 2011–2012 and 2013–2014 school years, respectively. Racial discipline gaps are gathered from the 2011–2012 and 2013–2014 Civil Rights Data Collection surveys. Disciplinary gaps are estimated from the Civil Rights Data Collection and are measured as the difference in suspension rates between Hispanic and White students. Estimates of discipline gaps are restricted to district schools that include at least one grade between third and eighth (most elementary and middle schools are therefore included). Community characteristics drop out of model (6) because these variables to not vary across survey years. Racial disparity measures are scaled such that higher values indicate more desirable outcomes for White than minority students.
p < .05. **p < .01. ***p < .001. (for two-tailed tests of significance).
Regressing Achievement Gap on Discipline Gap
As indicated in column (1) in Tables 1 and 2, we find that an unadjusted 1 percentage point increase in the discipline gap was associated with a 0.02 (p < .001) standard deviation increase in the Black-White achievement gap and a 0.03 (p < .001) standard deviation increase in the Hispanic-White achievement gap. This means that the racial achievement gap in a district that suspended 10% of its Black or Hispanic students but only 5% of its White students would be predicted to have a Black-White and Hispanic-White achievement gap that was 0.10 and 0.15 standard deviations larger, respectively, than a district that suspended the same proportion of minority and White students.
It is also important to know whether the discipline gap remains positively correlated with the achievement gap after controlling for key differences between districts. For instance, does the racial discipline gap remain predictive of the racial achievement gap after conditioning for racial disparities in special education or gifted education assignment, or controlling for socioeconomic disparities between minority and White students? To answer these questions, we turn to multivariate regression. The results of these models are summarized in Columns (2) through (6), which condition for the full set of district- and community-level characteristics as well as unobserved, time-invariant characteristics. We emphasize that these multivariate analyses are not intended to estimate a causal effect of the racial discipline gap on the racial achievement gap. Rather, we wish to determine the unique predictive capacity of the racial discipline gap with regard to the racial achievement gap and vice versa, independent of observable and time-invariant unobservable characteristics.
First, with regard to Black-White disparities: As shown in Columns (2) through (6) of Table 1, the adjusted relation between a 1 percentage point increase in the Black-White discipline gap and the Black-White achievement gap remained 0.02 in Model 2 that controlled for measures of district-level composition (p < .001); this estimate reduced to 0.01 but remained statistically significant (p < .001) in Models (3), (4), and (5) that included measures for segregation, racial disparities in district-level characteristics, and community characteristics. Even after controlling for unobserved district-level characteristics, as indicated in Model (6), a 1 percentage point increase in the Black-White discipline gap was associated with a 0.01 standard deviation increase in the Black-White achievement gap (p < .001). In other words, two districts that were otherwise equivalent on observable and time-invariant unobservable characteristics but that suspended differing shares of Black relative to White students would also differ, on average, in racial achievement gaps, with the achievement gap being larger in the district that suspended greater shares of Black relative to White students.
Columns (2) through (6) of Table 2 show how the coefficient for the Hispanic-White discipline gap changes after the inclusion of potential confounding variables. In contrast to what was observed for the Black-White discipline gap, the Hispanic-White discipline gap can be explained by differences at the district and community level. In particular, the point estimate for the Hispanic-White discipline gap falls to 0.02 (p < .001) when controlling for general district-level compositional characteristics, to 0.01 (p < .01) when controlling for segregation and racial disparities in district-level characteristics, and, finally, to zero and statistically insignificant when controlling for community-level characteristics (Model 5) and time-invariant unobservable differences between school districts (Model 6). In other words, that the Hispanic-White achievement gap is larger in districts with bigger Hispanic-White discipline gaps is not attributable to the racial discipline gap, per se, but rather to other differences between school districts.
Regressing Discipline Gap on Achievement Gap
While Tables 1 and 2 provide evidence about whether racial discipline gaps predict racial achievement gaps in bivariate and multivariate models, Tables 3 and 4 provide evidence of the opposite, that is, whether achievement gaps predict discipline gaps. In particular, Tables 3 and 4 provide results from bivariate and multivariate regressions of racial discipline gaps on racial achievement gaps for Black versus White and Hispanic versus White students, respectively. As indicated in Column (1) of each table, we find that an unadjusted, 1 standard deviation increase in the achievement gap was associated with a 3.67 (p < 0.001) percentage point increase in the Black-White discipline gap and a 1.24 (p < 0.001) percentage point increase in the Hispanic-White discipline gap. This means that the racial discipline gap in a district whose White students scored, on average, 1 standard deviation higher than its minority students would be predicted to have a Black-White and Hispanic-White discipline gap that was 3.67 and 1.24 percentage points larger, respectively, than a district whose minority and White students achieved at similar levels academically.
Columns (2) through (6) in each table show how the coefficient for the racial achievement gap changes after controlling for an increasingly robust set of potential confounding variables at the district and community level. As shown in Columns (2) through (6) of Table 3, there is no evidence that substantive conclusions based on the unadjusted relation between the Black-White discipline gap and the Black-White achievement gap was due to observable or time-invariant unobservable confounding. The preferred model, Model (6) indicates that a 1 standard deviation increase in the achievement gap between Black and White students is associated with a 2.2 percentage point increase in the Black-White discipline gap after accounting for observable and time-invariant unobservable differences between school districts.
Columns (2) through (6) of Table 4 report results from multivariate regressions of the Hispanic-White achievement gap on the Hispanic-White discipline gap. Despite that the coefficient for the Hispanic-White achievement gap remains statistically significant when accounting for observable differences at the district level, Column (5) indicates that these statistically significant relations go away when accounting for differences at the community level. Moreover, the relation between the Hispanic-White achievement gap on the Hispanic-White discipline gap remains statistically indistinguishable from zero in Model (6) that accounts for unobserved differences at the districts level that are consistent across survey years. This pattern of findings means that achievement disparities between Hispanic and White students predict discipline disparities between Hispanic and White students but not because of achievement disparities, per se, but rather because of other differences between districts.
Robustness Checks
Tables 5 through 7 provide a series of robustness checks. Table 5 provides estimates from our fully adjusted regressions of the racial achievement gap on the racial discipline gap (analogous to Column (6) in Tables 1 and 2) after restricting the analysis to districts that enroll greater than 1,000; 2,000; 5,000; and 10,000 students, respectively. Table 6 provides analogous estimates for regressions of racial discipline gaps on racial achievement gaps. Finally, Table 7 provides full-adjusted estimates based on an alternative specification of the racial discipline gap. Specifically, Table 7 reports results based on racial discipline gaps being measured as the relative risk of suspension for minority compared with White students (i.e., minority student suspension rates divided by White student suspension rates). As indicated across Tables 5 through 7, conclusions discussed above are qualitatively similar if the analyses are restricted to progressively larger districts or if discipline gaps are measured in terms of risk ratios as opposed to risk differences. 5
Ordinary Least Squares Regressions of Racial Achievement Gaps on Racial Discipline Gaps, Robustness of Estimates to Alternative District Sizes
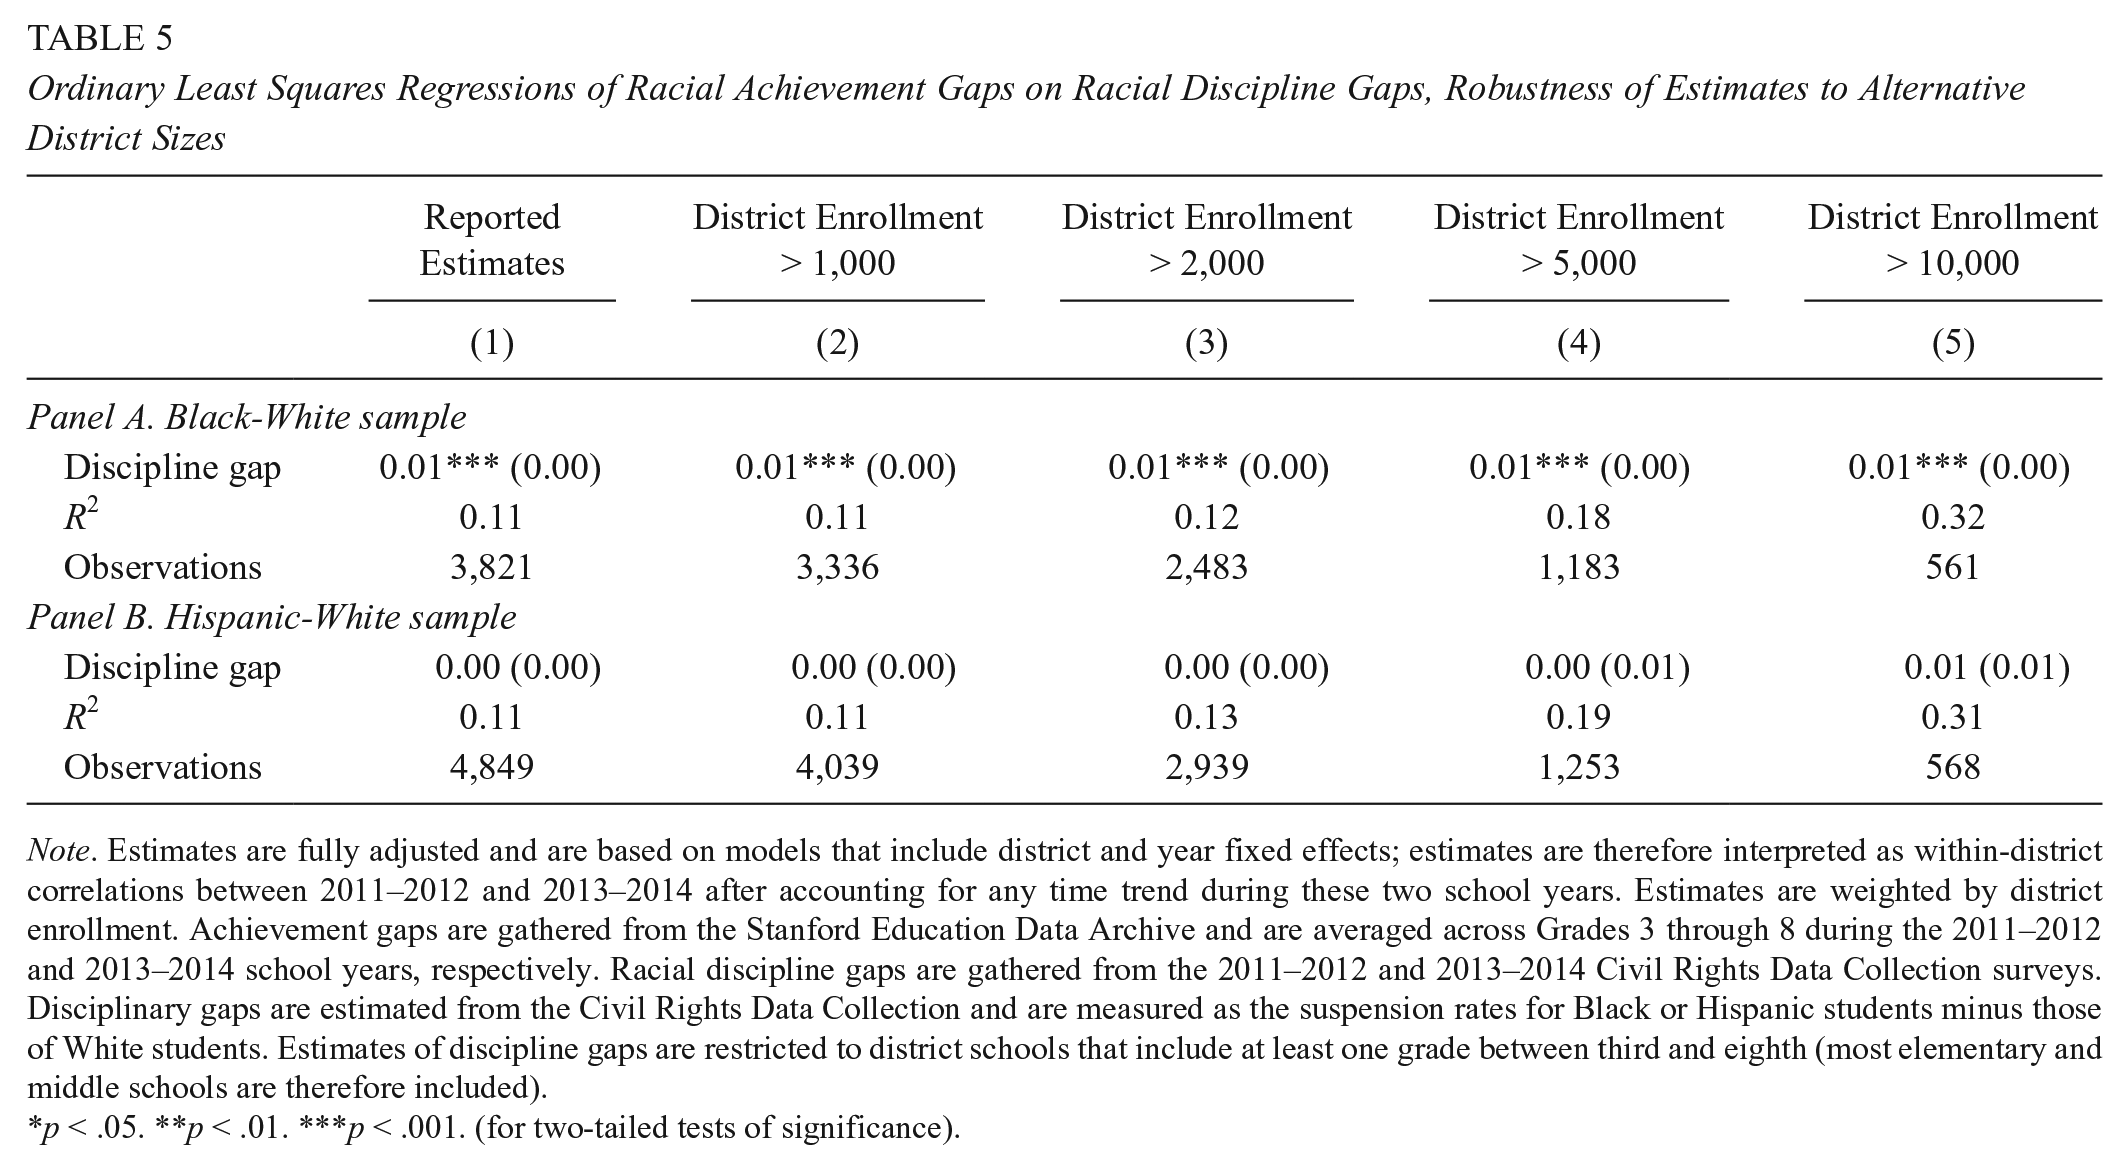
Note. Estimates are fully adjusted and are based on models that include district and year fixed effects; estimates are therefore interpreted as within-district correlations between 2011–2012 and 2013–2014 after accounting for any time trend during these two school years. Estimates are weighted by district enrollment. Achievement gaps are gathered from the Stanford Education Data Archive and are averaged across Grades 3 through 8 during the 2011–2012 and 2013–2014 school years, respectively. Racial discipline gaps are gathered from the 2011–2012 and 2013–2014 Civil Rights Data Collection surveys. Disciplinary gaps are estimated from the Civil Rights Data Collection and are measured as the suspension rates for Black or Hispanic students minus those of White students. Estimates of discipline gaps are restricted to district schools that include at least one grade between third and eighth (most elementary and middle schools are therefore included).
p < .05. **p < .01. ***p < .001. (for two-tailed tests of significance).
Ordinary Least Squares Regressions of Racial Discipline Gaps on Racial Achievement Gaps, Robustness of Estimates to Alternative District Sizes
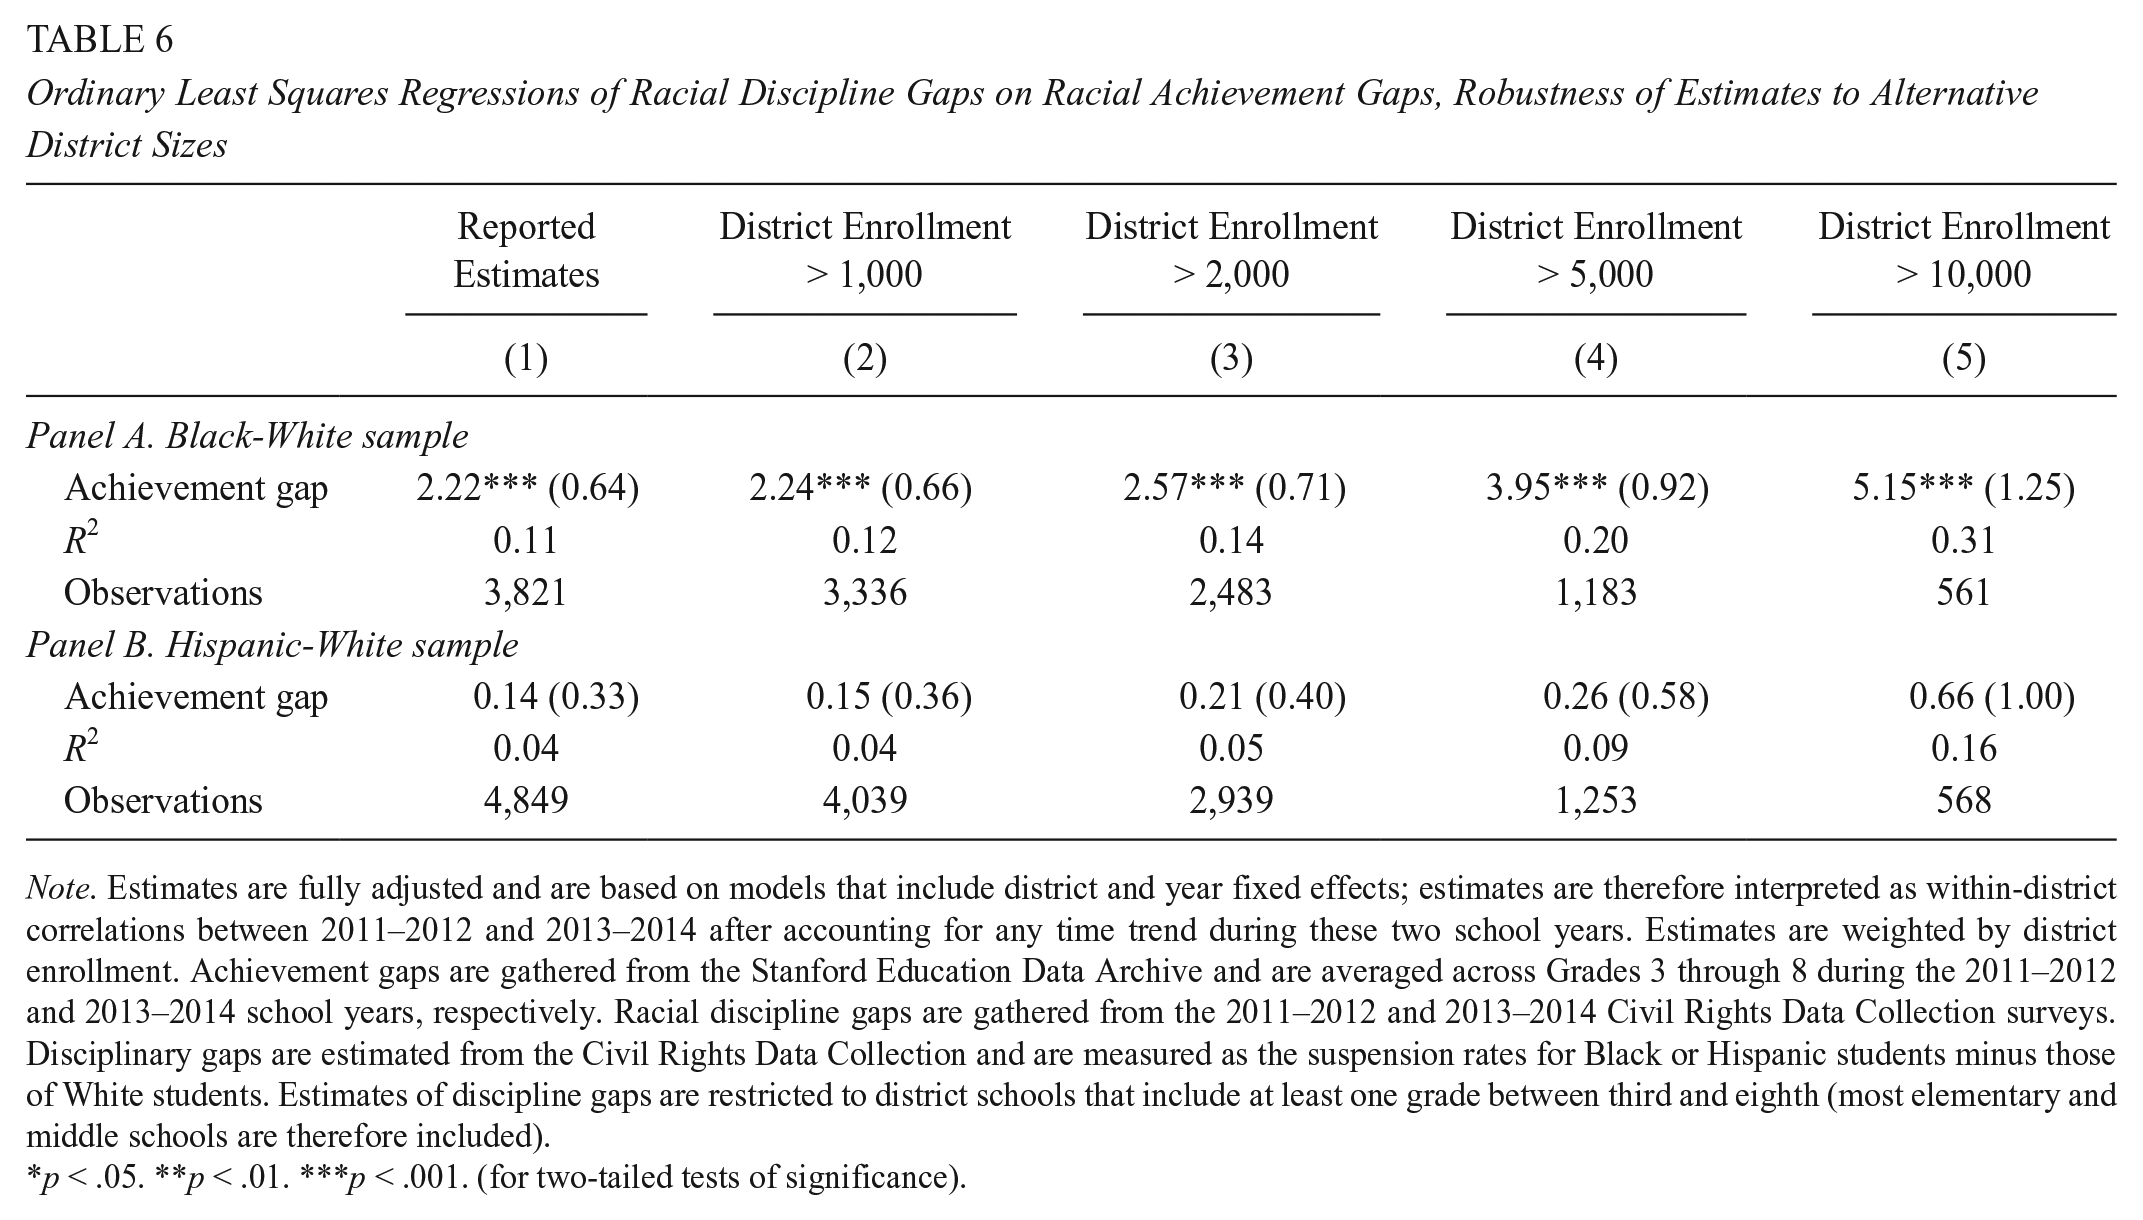
Note. Estimates are fully adjusted and are based on models that include district and year fixed effects; estimates are therefore interpreted as within-district correlations between 2011–2012 and 2013–2014 after accounting for any time trend during these two school years. Estimates are weighted by district enrollment. Achievement gaps are gathered from the Stanford Education Data Archive and are averaged across Grades 3 through 8 during the 2011–2012 and 2013–2014 school years, respectively. Racial discipline gaps are gathered from the 2011–2012 and 2013–2014 Civil Rights Data Collection surveys. Disciplinary gaps are estimated from the Civil Rights Data Collection and are measured as the suspension rates for Black or Hispanic students minus those of White students. Estimates of discipline gaps are restricted to district schools that include at least one grade between third and eighth (most elementary and middle schools are therefore included).
p < .05. **p < .01. ***p < .001. (for two-tailed tests of significance).
Estimates Based on Alternative Measure of Discipline Gaps (Risk Ratios)

Note. OLS = ordinary least squares. Estimates are based on models that include district and year fixed effects; estimates are therefore interpreted as within-district correlations. Estimates are weighted by district enrollment. Achievement gaps are gathered from the Stanford Education Data Archive and are averaged across Grades 3 through 8 during the 2011–2012 and 2013–2014 school years, respectively. Racial discipline gaps are gathered from the 2011–2012 and 2013–2014 Civil Rights Data Collection surveys. Disciplinary gaps are estimated from the Civil Rights Data Collection and are measured as risk of suspensions for White students divided by the risk of suspension for Black (Hispanic) students. Estimates of discipline gaps are restricted to district schools that include at least one grade between third and eighth (most elementary and middle schools are therefore included).
p < .05. **p < .01. ***p < .001. (for two-tailed tests of significance).
Disciplinary and Achievement Levels
That the Black-White discipline gap was positively associated with the Black-White achievement gap and vice versa could be driven by (a) the racial discipline gap being negatively associated with Black students’ achievement, (b) the racial discipline gap being positively associated with White students’ achievement, or (c) both. To answer this question, we turn to a series of regression models, summarized in Tables 8 and 9, that decompose the racial achievement gap and racial discipline gap into achievement and disciplinary levels, overall and by race. All models are fully adjusted and include district and year fixed effects. For concision, this section only discusses estimates related to the Black-White sample (Columns (1) through (3) of each table) because this was the sample for which significant relations were observed in fully adjusted models.
Ordinary Least Squares (OLS) Regressions of Achievement Levels on Discipline Gaps and Levels
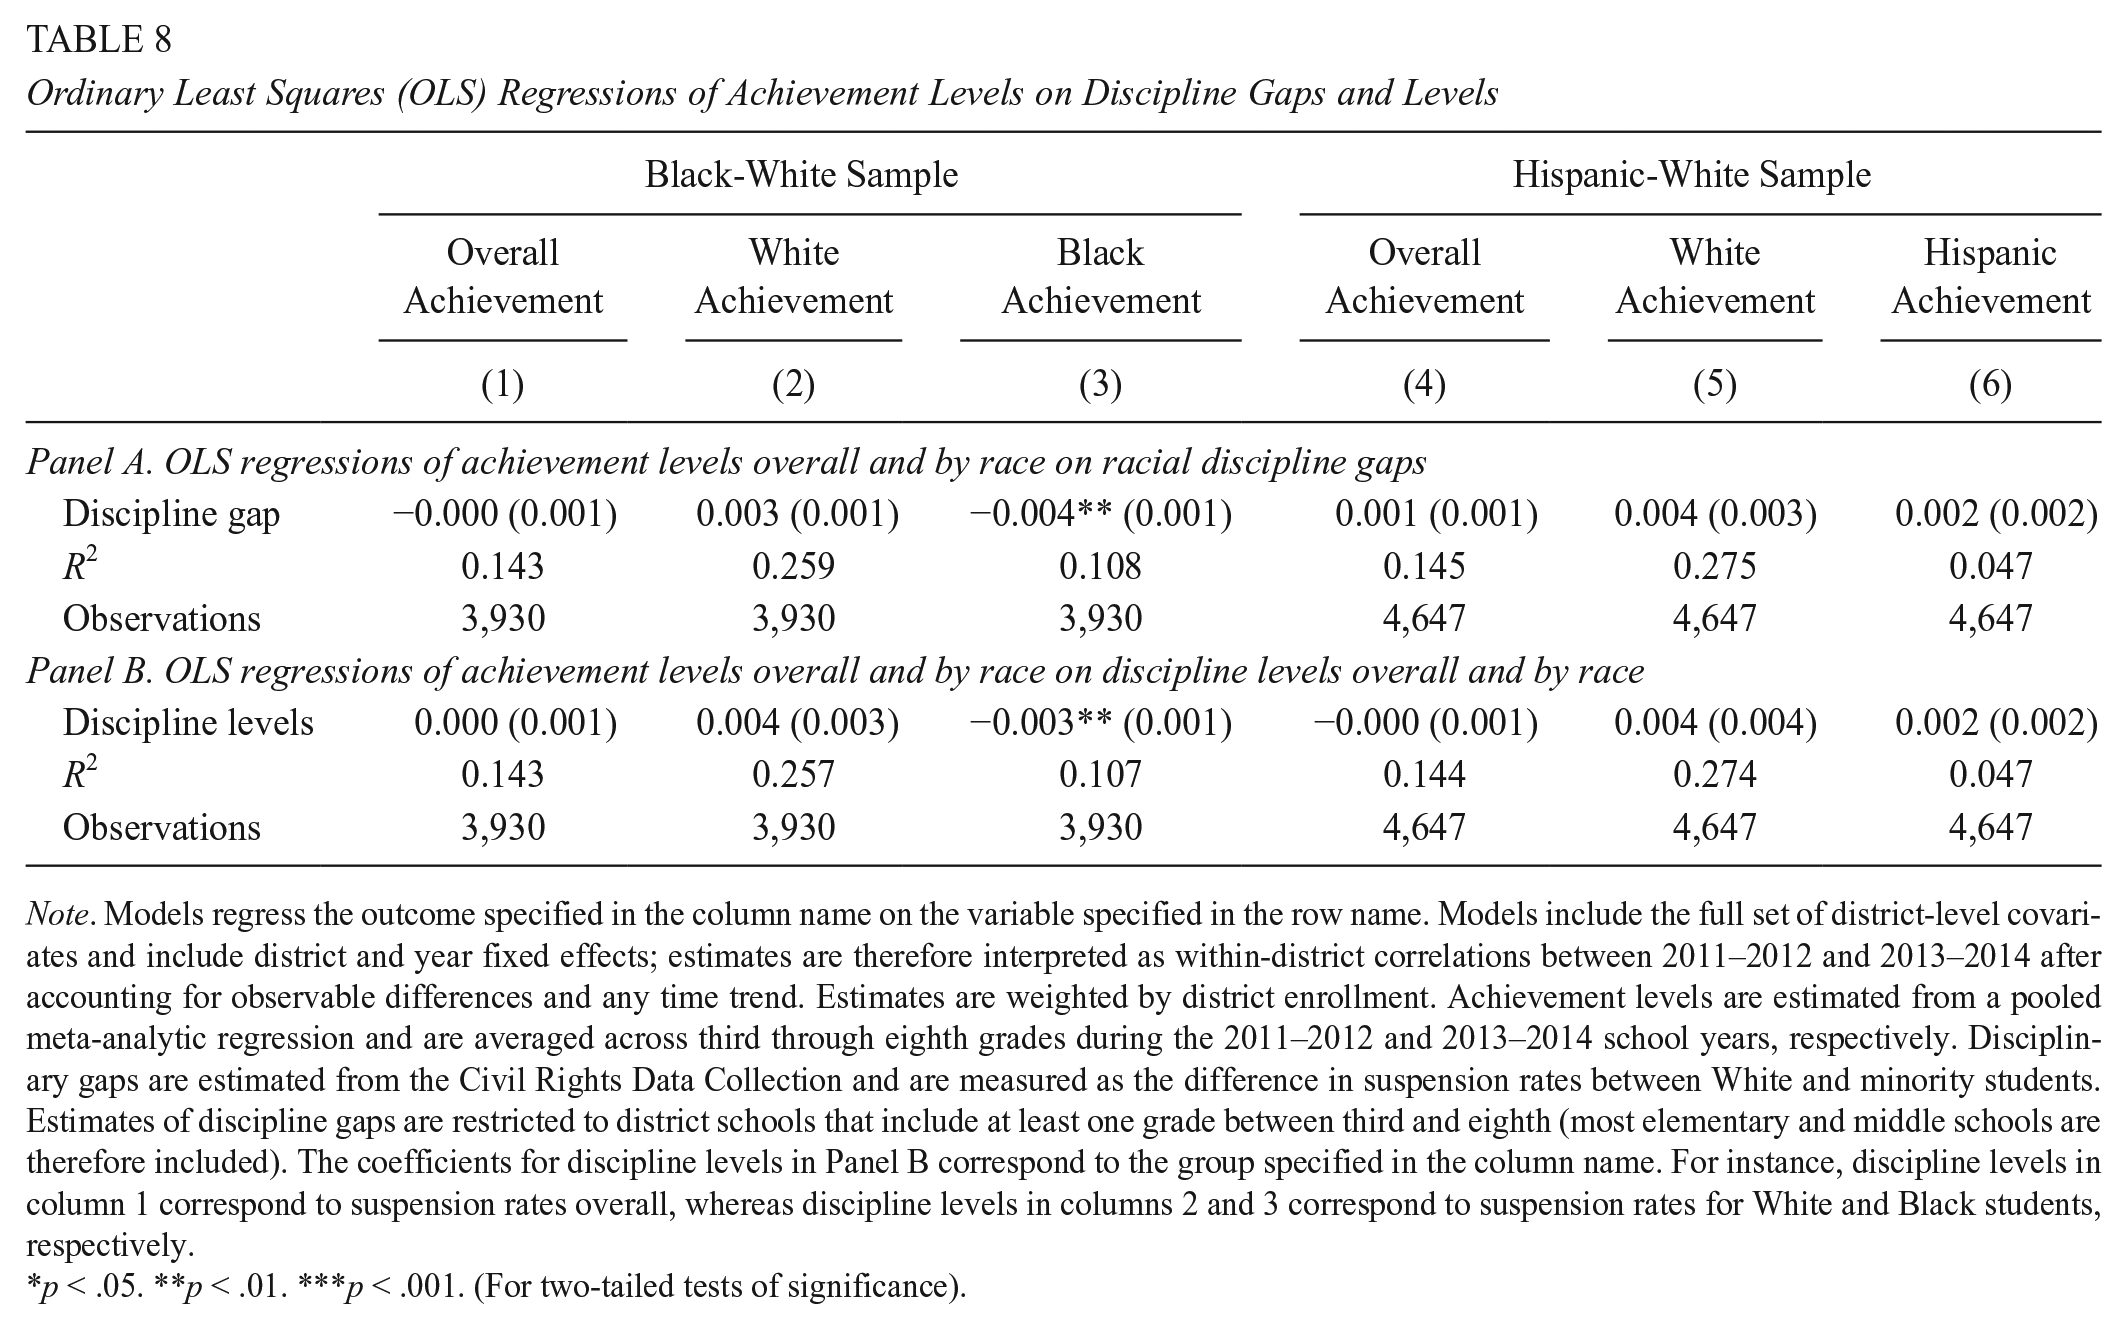
Note. Models regress the outcome specified in the column name on the variable specified in the row name. Models include the full set of district-level covariates and include district and year fixed effects; estimates are therefore interpreted as within-district correlations between 2011–2012 and 2013–2014 after accounting for observable differences and any time trend. Estimates are weighted by district enrollment. Achievement levels are estimated from a pooled meta-analytic regression and are averaged across third through eighth grades during the 2011–2012 and 2013–2014 school years, respectively. Disciplinary gaps are estimated from the Civil Rights Data Collection and are measured as the difference in suspension rates between White and minority students. Estimates of discipline gaps are restricted to district schools that include at least one grade between third and eighth (most elementary and middle schools are therefore included). The coefficients for discipline levels in Panel B correspond to the group specified in the column name. For instance, discipline levels in column 1 correspond to suspension rates overall, whereas discipline levels in columns 2 and 3 correspond to suspension rates for White and Black students, respectively.
p < .05. **p < .01. ***p < .001. (For two-tailed tests of significance).
Ordinary Least Squares (OLS) Regressions of Disciplinary Levels on Achievement Gaps and Levels

Note. Models regress the outcome specified in the column name on the variable specified in the row name. Models include the full set of district-level covariates and include district and year fixed effects; estimates are therefore interpreted as within-district correlations between 2011–2012 and 2013–2014 after accounting for observable differences and any time trend. Estimates are weighted by district enrollment. Achievement gaps are gathered from the Stanford Education Data Archive and are averaged across Grades 3 through 8 during the 2011–2012 and 2013–2014 school years, respectively. Discipline levels are gathered from the 2011–2012 and 2013–2014 Civil Rights Data Collection surveys. Estimates of discipline gaps are restricted to district schools that include at least one grade between third and eighth (most elementary and middle schools are therefore included).
p < .05. **p < .01. ***p < .001. (for two-tailed tests of significance).
Column (3) in Table 8 shows that one reason for the positive adjusted association between the Black-White discipline gap and the Black-White achievement gap is that Black students perform poorer, on average, in districts that suspend them at elevated rates compared with their White counterparts (β = −0.004, p < .01). In contrast, Column (2) provides no evidence that the racial discipline gap is predictive of White students’ achievement. In other words, the Black-White discipline gap being positively associated with the Black-White achievement gap is attributable, in part, to the Black-White discipline gap being predictive of lower achievement for Black student but unpredictive of White students’ achievement. Moreover, Panel B in Table 8 indicates that while suspension rates for Black students are predictive of Black students’ achievement levels (β = −0.003, p < .01), that is, districts that suspend greater share of Black students have lower levels of Black student achievement, this is not the case for White students. In particular, there is no evidence that White students’ suspension rates are related to their achievement in fully adjusted models.
Table 9 turns attention to the adjusted predictive capacity of achievement patterns, regressing suspension rates overall and by race on achievement gaps (Panel A) and levels (Panel B). Column 3 of Panel B indicates districts with higher levels of achievement for Black students have lower suspension rates for Black students (β = −2.35, p < .01). No evidence is found that achievement levels predict associated suspension rates for White students or students overall. Despite that White students’ achievement levels are unpredictive of their own suspension rates, column 2 of Panel A, interestingly, shows that districts that have larger achievement gaps suspend higher percentages of White students (β = 0.57, p < .05). This pattern of larger achievement gaps predicting higher suspension rates also holds for students overall (β = 1.03, p < .01) and with respect to Black students (β = 2.79, p < .001).
Discussion
This study set out to answer a set of descriptive questions about the relation between discipline and achievement disparities. Our primary objective was to determine whether there exists an association between discipline gaps and achievement gaps, and, if so, the magnitude of these correlational relations. Despite finding evidence in bivariate models that Hispanic-White discipline gaps are positively related to Hispanic-White achievement gaps, this relation did not persist after the inclusion of community-level characteristics or district fixed effects. In other words, the bivariate relation we observed was actually explained by other differences across districts. In contrast, the previous analyses indicated that discipline and achievement disparities were positively associated when looking at Black and White students, even in fully adjusted models: Districts with larger Black-White discipline gaps have larger Black-White achievement gaps and vice versa. In fully adjusted models, we found that a 1 percentage point increase in the Black-White discipline gap was associated with a 0.01 standard deviation increase in the Black-White achievement gap. Conversely, we found in fully adjusted models that a 1 standard deviation increase in the Black-White achievement gap was associated with a 2.2 percentage point increase in the Black-White discipline gap.
We also found evidence that the association between the Black-White achievement gap and the Black-White discipline gap was attributable, in part, to the tight coupling of achievement and discipline for Black students in particular, who experience higher suspension rates in districts with larger achievement gaps and who experience higher achievement in districts that suspend them less frequently. Notably, this tight coupling of discipline and achievement was not observed for White students. This pattern indicates that the mechanisms connecting achievement and discipline (e.g., teacher biases, peer effects, feelings of belonging) are more salient for Black than White students.
While the results of our study do not speak directly to solutions to discipline and achievement gaps, they do suggest that interventions aimed at addressing one gap may have potential to influence the other. First, recent research has found that teacher professional development focused on improving instructional capacity and other classroom practices improves classroom behavior and reduces racial disparities in discipline (Gregory, Allen, Mikami, Hafen, & Pianta, 2015), which may be particularly the case for curricular and pedagocial approaches deemed successful at raising the academic achievement of ethnoracial minorities, such as culturally relavant teaching and ethnic studies programs (see, for instance, Dee & Penner, 2017; Ladson-Billings, 1995; Milner, 2010). Second, a body of evidence is emerging on alternative disciplinary practices that can reduce the time students spend out of the learning environment. Schoolwide approaches like positive behavior interventions and supports as well as restorative justice practices have shown some promise at reducing the use of exclusionary discpline (Baker, 2008; Bradshaw, Mitchell, & Leaf, 2010; Gonzalez, 2015; Horner et al., 2009; Morrison, 2007). Although we acknowledge that simply reducing suspension rates and modifying instructional practices may not always mitigate racial disparities in discpline and academic achievement (e.g., Vincent, Sprague, Pavel, Tobin, & Gau, 2015), we do suggest that districts continue to explore alternative approaches, such as those just described, as possible mechanisms for improving racial equity in schooling.
Although this study provides considerable insight into the current relation between the achievement gap and the discipline gap in districts across the United States, it is important to underscore several limitations. First, it is important to bear in mind that the objective of this study, which was based on two waves of cross-sectional data, was purely descriptive, that is, we endeavored to document whether there exists an association between the racial discipline gap and the racial achievement gap nationwide. Consequently, the patterns described should not be interpreted as causal. Future research with longitudinal data, likely at the student level, that captures the relative timing of disciplinary exposures and achievement outcomes at various points in a given school year will likely be needed to determine the extent to which discipline gaps cause achievement gaps and vice versa. Second, the analyses used a common set of racial categories (i.e., Black, White, Hispanic) that do not encompass the totality of potential racial discipline or achievement disparities that may exist, including those pertaining to Native American or mixed-race students, or those that exist within racial groups (Blake, Keith, Luo, Le, & Salter, 2017; Vincent, Swain-Bradway, Tobin, & May, 2011). Moreover, the analyses did not examine how the relationship between discipline and achievement disparities may have varied by gender or socioeconomic status. Finally, these analyses were based on data spanning Grades 3 through 8. As a result, the observed relation between the achievement gap and the discipline gap described in the previous pages should not be generalized to earlier or later grades.
Conclusion
In this article, we combined SEDA and CRDC data to provide national estimates of the extent to which racial and ethnic patterns in exclusionary discipline are related to the underachievement of students of color. The analyses presented here confirm what many recent scholars have suspected: On average, districts with larger Black-White achievement gaps have larger Black-White discipline gaps and vice versa. It bears mentioning that despite growing attention to disparate discipline and the overuse of exclusionary practices, the U.S. Department of Justice and the U.S. Department of Education recently rescinded so-called Obama-era discpline guidelines, which called for increased equity in discipline (U.S. Department of Education, 2014). Consequently, recent efforts by districts nationwide to implemet policies designed to reduce the use of exclusionary discipline may soon wane (Steinberg & Lacoe, 2017). The results presented in this article should caution against such moves. While not a perfect one-to-one relationship, our results suggest that discipline gaps and achievement gaps are, in fact, parts of the “same coin” (Gregory et al., 2010).
Supplemental Material
DS_10.1177_2332858419875440 – Supplemental material for Are Achievement Gaps Related to Discipline Gaps? Evidence From National Data
Supplemental material, DS_10.1177_2332858419875440 for Are Achievement Gaps Related to Discipline Gaps? Evidence From National Data by Francis A. Pearman II, F. Chris Curran, Benjamin Fisher and Joseph Gardella in AERA Open
Footnotes
Notes
Authors
FRANCIS A. PEARMAN II is an assistant professor of education at Stanford University. His research focuses on social and educational inequality.
F. CHRIS CURRAN is an associate professor of educational leadership and policy at the University of Florida’s College of Education. His research focuses on issues of school safety and discipline, early elementary education, and teacher labor markets.
BENJAMIN FISHER is an assistant professor of criminal justice at the University of Louisville. His main research interests are school safety and discipline, particularly the impact of visible school security measures on students and schools.
JOSEPH GARDELLA is a postdoctoral fellow at Drexel University. His main research interests are prosocial approaches to education in high schools, paying particular attention to behavior management and school systems change.
References
Supplementary Material
Please find the following supplemental material available below.
For Open Access articles published under a Creative Commons License, all supplemental material carries the same license as the article it is associated with.
For non-Open Access articles published, all supplemental material carries a non-exclusive license, and permission requests for re-use of supplemental material or any part of supplemental material shall be sent directly to the copyright owner as specified in the copyright notice associated with the article.