
Abstract
Currently, the state of California has dedicated much focus to reducing absenteeism in schools through the In School + On Track initiative, which revitalizes efforts made to keep accurate and informative attendance data. Additionally, absenteeism has been integrated into California’s Local Control and Accountability Plan to monitor district performance and improvement. Given the heightened policy concern surrounding absenteeism and truancy, this study seeks to improve researchers’ understanding of the impacts of missing school for high school students. This study will be the first known study to use preregistered secondary data from a school district, let alone the first preregistered study that seeks to address student attendance in schools.
School absenteeism is a prevalent and pervasive problem in the American education system. The average rate of chronic absenteeism—defined as missing 10% or more of the school year—for American students may be as high at 10% to 15% and is even more evident among low-income students (Balfanz & Byrnes, 2012). Furthermore, approximately 5 to 7.5 million children across the country are missing at least a month of school, and as a result, educational policymakers are instigating greater discussion regarding student absenteeism given the concerns and evidence that students with greater absences have lower academic outcomes (Chang & Davis, 2015).
In California, new policies and reforms have been implemented to reduce absences. For instance, the In School + On Track initiative has pushed for improving communication between parents and districts regarding absenteeism, reducing the number of absences from schools due to suspensions, and increasing the number of meetings held by school stakeholders to discuss the trends and effects of absences (Harris, 2015). Importantly, California is among dozens of states that will use chronic absenteeism as an accountability metric and indicator under the Every Student Succeeds Act beginning in the 2018–2019 school year (Attendance Works, n.d.). Clearly, absenteeism has garnered attention from policymakers, but arguably, this educational issue is currently receiving more scrutiny, consideration, and resources than at any point in history.
Negative Impacts of Absenteeism
Such dialogue and attention from policymakers are largely grounded in a body of research showing consistent, statistically significant, negative associations of absenteeism on student academic outcomes. Absenteeism has become a major and continuous problem for high school students. Simply, students who are not in class miss out on opportunities to learn the material that enables them to succeed later in school. On a review of the current literature of the negative impacts of absenteeism, this study examined three academic outcomes that prior research has consistently illustrated are associated with student attendance.
Class Grades
First, much research has concluded that student attendance has a strong and positive correlation to course performance, measured primarily through course grades and general standardized test scores in certain subject areas. For example, a study from Chicago found that student absenteeism was the most significant predictor of course grades (Allensworth & Easton, 2007). From this study, the researchers found that course failures were primarily linked to students with lower standardized test performance who missed 2 or more weeks of school. Finally, while beyond the K–12 system, some research also links attendance in courses to course grades in college. Credé, Roch, and Kieszczynka’s (2010) meta-analysis on the subject found a moderate correlation (ρ = .44), and the authors concluded that absenteeism was a stronger predictor than SAT scores, high school grade point average (GPA), study skills, and study habits. Taken together, there is reason to believe that attendance in a course itself might link to the grade received in that course, and this study serves as another example that disentangles overall absenteeism to overall performance to examine a more detailed association.
School GPAs
While course grades and overall GPAs go hand in hand, the former concerns whether absenteeism functions as a mechanism related to students’ opportunity to learn in school and the latter concerns overall standing in school that also ties into students’ school attitudes and trajectories year after year (Finn, 1989). In other words, much research has justified how absenteeism throughout a school year, not simply one specific course or the general propensity for high school graduation, can also be linked to yearly GPA. Such research includes the study by McNeely, Nonnemaker, and Blum (2002), who found the strongest individual indicator of school connectedness, or engagement. Additionally, Steward, Steward, Blair, Jo, and Hill (2008) reported a similar finding in a specific study on rates of attendance of African American students, finding that students who were absent from school tended to have lower GPAs. These prior studies indicate that missing school links to the measure of GPA, a school-level indicator of student academic success.
School Dropout
Another concern related to students missing school is the increased propensity for these students to eventually drop out. In an evaluation of attendance in 8th to 10th grades, the Georgia Department of Education found that absence rates in these grades significantly predicted high school graduation rates, controlling for student background characteristics (Barge, 2011). There is also reason to believe that chronic absenteeism, the indicator for having missed 10% or more of the school year, is worth examining when researching the effect of absenteeism on academic outcomes. Byrnes and Reyna (2007) analyzed data from multiple school districts and consistently found chronic absenteeism to be the strongest predictor of high school dropout, even when compared with suspensions, being overage, and various background characteristics. Rumberger (1995) identified students absent for more than 15% of the year as a high risk of school dropout. Furthermore, the aforementioned evaluation by the Georgia Department of Education found disproportionate likelihood of high school dropout when students missed 6 or more days of school. Of note, chronic absenteeism has garnered additional attention when examining elementary school attendance, as studies find that rates of chronic absenteeism in elementary school are highly predictive of high school dropout (Balfanz, Herzog, & MacIver, 2007). This bolsters the case for stakeholders concerned with the effects of absenteeism to analyze links to high school dropout across the grade span.
One potential explanation for this link between absences and other academic outcomes might be that by receiving fewer hours of instruction during the school year, absent students have unequal opportunities to learn and consequently receive lower grades in classes, perform more poorly on exams, and have lower probabilities of high school graduation (Chen & Stevenson, 1995; Connell, Spencer, & Aber, 1994; Nichols, 2003). Greater time spent on instruction has shown to positively predict student academic outcomes. For instance, using national data, Bodovski and Farkas (2007) and Georges (2009) link time on math instruction to academic achievement for students in mathematics. Thus, missing school reduces the amount of time students can engage with these instructional practices, and students experience lower probabilities of success in their academics.
Context for the Present Study
Our study is motivated by several current issues concerning student absenteeism. The first concern arises based on the current education policy context in California. In light of the evidence of the harmful impacts of missing school, California, along with dozens of other states across the country, has recently begun evaluating school districts based on the threshold of chronic absenteeism. Chronic absenteeism, defined in California as missing 10% or more of the school year, has been integrated into the Local Control and Accountability Plan to monitor district performance and improvement. Specifically beginning in the fall of 2018, district rates of chronic absenteeism are used as one of the eight priorities of the state that factors into their local control funding formula. This policy is based on the established notion that absenteeism does indeed relate to negative educational consequences for students but also that the threshold of chronic absenteeism is a meaningful indicator of school success and failure. This study seeks to build on prior research regarding absenteeism and effects on academic outcomes for students.
Second, while absenteeism in elementary grades has gained substantial recent momentum in the research community (Balfanz & Byrnes, 2012; Connell et al., 1994; Connolly & Olson, 2012; Goodman, 2014; Gottfried, 2009, 2011a, 2011b, 2014; Gottfried, Egalite, & Kirksey, 2016; Ready, 2010), more replications of the association between absenteeism and academic outcomes in secondary grades is needed. Replications of currently known associations tend to be less desirable for publication in top journals, but in the spirit of the current issue, this study is motivated to give future studies another benchmark as to the negative association between absenteeism and academic outcomes in high school. Moreover, such replication is motivated during a time of increased attention of absenteeism as an indicator of school and student success.
Finally, this study is the first known study to use preregistered secondary data, where the method and analysis plan is set before the researcher receives the data. This added step in the research design intends to bolster the validity of the results and conclusions from a study using data not collected by the researcher or research team. While much of the discussion in the literature regarding the importance of preregistration is in the context of experimental studies, this study applies these same principles to provide the first example of how to expand the goals of preregistration to the analysis of existing, secondary data. This study promotes the use of preregistration in secondary data analysis to avoid common pitfalls that lead to better transparency and lower likelihood of producing “illusory results” (Gehlbach & Robinson, 2018).
For instance, while addressing absenteeism has garnered much attention from educational policymakers and researchers, most studies rely on quasi-experimental techniques using secondary data to establish relationships—both causal and associative—between absenteeism and relevant outcomes for students. An added problem from this collective reliance on such studies to inform current practice is the possibility that some studies produced false results via Type I error by taking advantage of p-hacking (Nuzzo, 2014). For example, Simmons, Nelson, and Simonsohn, (2011), who popularized the term, defined p-hacking as “trying multiple things until you get the desired results.” With rich, secondary data ranging from large, nationally representative data sets collected and disseminated by the U.S. Department of Education to large amounts of administrative data from school districts, researchers have the potential to put p-hacking into practice by dropping or adding control variables, changing model specifications, or altering analytic samples.
Another practice mitigated by preregistration is the lack of transparency when making multiple comparisons using the same data set (Gelman & Loken, 2014). With large, secondary data sets, a researcher may choose to run hundreds of models that represent associations for countless pairwise comparisons of independent and dependent variables. There is great liberty taken by researchers to find relationships in the data and justify such examination post hoc. Instead, some studies using secondary data ought to consider preregistering models that are theoretically driven and maintain full transparency as to model modifications and the number of empirical models tested in the scope of the submitted manuscript. Following this recommendation, this study preregistered models that were used to examine the associations between absenteeism and academic outcomes. This article also discloses modifications suggested following this preregistration.
Finally, another factor that should be considered when referencing research that used secondary data is the flexibility in reporting decisions by the researchers. With the potential for conducting hundreds of regressions with atheoretical models as well as the general motivation to lower p values to establish a predictive relationship, preregistration can set the norm of reporting all empirical tests conducted in the scope of a study. Simply, specifying what models will be run prior to attaining the secondary data then poses an obligation of the researcher(s) to report all results. This gives consumers of the research a fuller picture of the results, their context, and their reliability.
Each of these practices aims to report a p value of less than .05, the commonly accepted standard for publication in academic journals. It is speculated that these issues arise due to several norms in the educational research: the expectation that scholars should find statistically significant and large effect sizes to publish in top academic journals, the lack of attention and respect given to replication studies (Makel & Plucker, 2014), and the lack of transparency in how data are manipulated to produce reported results.
To serve as an example of ways to preregister secondary data in future research, this study was registered on December 7, 2017, on the Open-Science Framework (OSF) website (https://osf.io/nxksq). This preregistration entailed the detailed write-up of what data were requested from the school district as well as what models would be employed to answer prespecified research questions. Data were received from the school district on December 15, 2017. Note that while many preregistrations have included scripts for analysis and/or data for replication, privacy restrictions included in the memorandum of understanding between the school district and the research team do not allow for this to ensure the utmost privacy for students and teachers.
Chronic Absenteeism Threshold
Second, despite the extant research documenting clear effects between absenteeism and educational consequences, no work has directly examined the accuracy to which the chronic absenteeism threshold (generally defined as missing 10% of the school year) relates to the generally established linear relationship between absences and academic outcomes. In other words, there is no empirical research that supports the established policy designation that chronic absenteeism should be defined at 10% of the school year based on its relevance to student academic outcomes. In fact, two studies illustrate that outcomes due to absences function linearly and do not have turning points at specific thresholds. Gershenson, Jacknowitz, and Brannegen (2017) used data from the Early Childhood Longitudinal Study (2010–2011) and data from North Carolina to examine whether students experienced disproportionate consequences after a certain number of absences. Using multiple model specifications, the authors found that absences had linear effects on student achievement, a finding that is at odds with current policy thresholds. Additionally, Gershenson, McBean, and Tran (2018) used quantile regression analysis and found that student standardized test scores were incrementally affected with each absence, regardless of the quantity of absences. These studies call attention to future work to examine the chronic absenteeism threshold with regard to educational consequences for students.
Research Questions
Given the heightened policy concern surrounding absenteeism, this study sought to improve understanding of the impacts of missing school for high school students’ academic outcomes. Additionally, we examined the relevance of the chronic absenteeism threshold used by the school district. We specifically consider the following questions:
Research Question 1: Is class attendance associated with grades in that class?
Research Question 2: After missing 10% of available days to attend classes, do students earn disproportionately lower grades in those classes?
Research Question 3: Is yearly attendance associated with yearly GPAs in high school?
Research Question 4: After missing 10% of the school year, do students have disproportionately lower yearly GPAs?
Research Question 5: Is overall attendance associated with graduation from high school?
Hypotheses
Based on these research questions, this study proposes the following five hypotheses.
Hypothesis 1: Students with better attendance in classes will receive better grades in those classes compared with students with poorer attendance.
This hypothesis is confirmed if the number of absences, aggregated to the student-course level, predicts lower grades. An interpretation from this confirmed hypothesis would be that absenteeism from one course directly links to poorer performance in that course.
Hypothesis 2: The 10% threshold of chronic absenteeism is not an accurate designation of when students begin to earn disproportionately lower grades in classes.
This hypothesis is confirmed if the squared polynomial term included in Model 1 is either not statistically significant or indicates a different threshold at which a turning point in the outcome of grades occurs (i.e., students begin to earn disproportionately lower grades after missing 15% of the school year as opposed to the current chronic absenteeism threshold of 10%).
Hypothesis 3: Students with better attendance will have better yearly GPAs than students with poorer attendance.
This hypothesis is confirmed if the number of absences, aggregated to the student-year level, has a negative, statistically significant coefficient for the dependent variable of GPA that year. The interpretation from this confirmed finding would be that missing school throughout the school year links to poorer overall course performance, including additional course failures and lower grades.
Hypothesis 4: The 10% threshold of chronic absenteeism is not an accurate designation of when students begin to earn disproportionately lower yearly GPAs.
Similar to Hypothesis 2, this hypothesis is confirmed if the squared linear term included in Model 2 is either not statistically significant or indicates a different threshold at which a turning point in the outcome of GPAs occurs. That is, the data indicate that students earn disproportionately lower GPAs at a rate of absenteeism different from 10%.
Hypothesis 5: Students with better overall attendance will have higher graduation rates than students with poorer attendance.
This hypothesis is confirmed if the number of absences, aggregated to the student-school level, predicts lower likelihood of graduation from that school.
Method
Data
This study used administrative data from a small, urban California school district from the 2013–2014 and the 2016–2017 school years to determine the impacts of missing school on high school students’ academic outcomes, and the relevance of the district’s current chronic absenteeism threshold. The district enrolls approximately 7,500 students each year.
Records of daily absences for every student, along with corresponding state legislature educational code providing definitions and justification (e.g., excused and unexcused) for missing school were provided. Additionally, student demographics, standardized exam scores, course information, GPAs, suspension and expulsion records, school exit/dropout codes, classroom and school unique identifiers, and teacher characteristics were included in the data set. Descriptive statistics of all study variables are listed in Table 1.
Descriptive Statistics for Main Study Variables

Note. GPA = grade point average.
Attendance
The district provided day-by-day logs of attendance data specific to the day and student. As such, three aggregate absence variables were created. The first was aggregated to the year and student levels and used in analyses for Research Questions 1 and 4. The second was aggregated to the year and school levels and used in analyses for Research Questions 2 and 5. Finally, data were aggregated to the school level for analyses for Research Question 3.
Graduation
Annual enrollment data were provided by the district on all primary enrollments. This is consistent with prior research using school district administrative data. Of the school variables provided, only high school graduation required manipulation. School exit codes were used to create a binary indicator for whether students graduated from high school or not. Student enrollment is reported to the California Department of Education and includes a series of exit codes for students. A full description of the codes and requirements for graduation can be found at https://www.cde.ca.gov/ds/sp/cl/systemdocs.asp.
Demographics
All demographic variables included in the model specifications are listed in Table 1 under “Student characteristics.” All demographic variables were coded as binary indicators for regression analyses, excluding grade, age, and academic performance. Age was left as a continuous variable. Student grade was used in the fixed effects models as described in the models. Academic performance was standardized scores from the previous school year.
Peers
As school and classroom identifiers were blinded, new variables were constructed for each demographic characteristic at the classroom and school levels for each student. For example at the classroom level, using the student-level characteristic of gender means a variable for the percentage of students who were male was an included peer variable in the relevant models. All student demographic variables were used to construct these peer-level variables. Classroom variables were used for Research Questions1 and 4, and school variables were used for Research Questions 2 and 5. Peer characteristics based on the student’s 4-year cohort were used for Research Question 3.
Discipline
Discipline information is given on a per incident basis. Discipline variables were created to represent the total number of in-school and out-of-school suspensions received by a student each school year.
Course Information
Course information is given by year, by semester, and by teacher indicator. For Research Question 3, course credits were aggregated by student and were broken down by regular course credits, CTE (Career and Technical Education) course credits, and A–G course credits. A separate variable was created for course failure and coded based on the number of courses in which a student attempted credits but did not receive credits.
Grade Point Averages
In accordance with the University of California’s admissions policy, GPA variables were created. All course grades were transformed to fit a 4.0 scale, where A is 4 points, B is 3 points, C is 2 points, D is 1 point, and F is 0 points. Courses identified as honors or AP (Advanced Placement) courses had an additional 1 point added to their score.
Missing Data
In the case of missing data, chained multiple imputation will be used to fill missing data for each student in the data set based on their other reported characteristics (Royston, 2004).
Analysis
This study used ordinary least squares (OLS) regression supplemented with various levels of fixed effects modeling to account for the nested structure of the data. Fixed effects modeling has been used frequently to answer policy-relevant questions regarding the effects of absenteeism on student outcomes (Gershenson et al., 2017; Gottfried, 2009, 2010, 2011a, 2011b, 2014; Gottfried & Kirksey, 2017). Unlike alternative model specifications such as hierarchical linear modeling and structural equation modeling, fixed effects modeling does not assume that the lower units in the hierarchical structure (e.g., students) are randomly sorted into the higher level units (e.g., schools). In other words, the use of hierarchical linear modeling cannot distinguish the effect of being in a group from the reason for being in the group (Hoxby, 2000), which means that the propensity to experience change in the variable of interest (i.e., absenteeism) is determined by preexisting conditions.
The research questions and hypotheses examined the specific association between absences, which occur at the student level, and academic outcomes, which occur at the student level. To do so, it was necessary to eliminate all variation that could be attributed to factors beyond these student-level associations, such as confounding unobserved variables at the school or classroom level. In other words, the current study poses a series of research questions concerned with variables at the student level, so it was necessary to eliminate all heterogeneity that exists beyond this level in the data to understand the marginal effect of absenteeism on academic outcomes.
To evaluate the hypotheses, the following models were employed:
Hypotheses 1 and 2: Grade for Student i in Class k in School j in Year t
Model 1: OLS regression with teacher and student fixed effects

For Model 1, the grade (Y) for student i in class k in school j in year t is modeled as a function of the number of absences (Abs) of student i in class k in school j in year t; the demographics (Demos) for student i in year t; peer characteristics (Peers) for student i in class k in school j in year t; the number of suspensions (Disc) for student i in school j in year t; indicator variable (
Hypotheses 3 and 4: Overall GPA for Student i in School j in Year t
Model 2: OLS regression with school and student fixed effects

For Model 2, the overall GPA (Y) for student i in school j in year t is modeled as a function of the number of absences (Abs) of student i in school j in year t; the demographics (Demos) for student i in year t; peer characteristics (Peers) for student i in school j in year t; the number of suspensions (Disc) for student i in school j in year t; indicator variable (
Hypothesis 5: High School Graduation of Student i From School j in Year t
Model 3: Logistic regression with school fixed effects

For Model 3, the high school graduation (Y) for student i in school j in year t is modeled as a function of the percentage of absences (Abs) of student i across all years in the data set; the demographics (Demos) for student i in the last year of high school; peer characteristics (Peers) for student i in school j in the last year of high school; the number of suspensions (Disc) for student i; the number of course credits and course failures (Course) for student i; indicator variable (
To evaluate the second and fourth hypotheses regarding the threshold of chronic absenteeism, a squared linear predictor was then added to Models 1 and 2:

For each outcome, a turning point was calculated via the derivative above and compared with the policy threshold of 10% for chronic absenteeism.
It should be noted that some model subscripts change based on academic outcome. All models included in this study will contain year and grade-level fixed effects. All models were corrected using a Bonferroni adjustment of dividing by 5 to reduce the chance of Type I error in evaluating multiple outcomes for students. This means that those with a p value of equal to or less than .01 are considered statistically significant results. Note that these models are consistent with prior research documenting the effects of absenteeism on academic outcomes.
Additional Tests of Robustness
Models 1 and 2 use student fixed effects to control for student-level heterogeneity that could bias results, but these models do not necessarily control for time-varying, student-level characteristics, including students’ prior absences. To enhance the robustness of these models, two supplemental models were employed that consist of an additional lagged variable of the previous year’s absences. These suggested models are compared with Models 1 and 2. When considering the relationship between absenteeism and graduation, an additional model was employed that includes the Abs variable disaggregated into four separate variables—9th-, 10th-, 11th-, and 12th-grade absences—to show the cumulative effects of absences. This model illustrates how absences that occurred at different points in high school might disproportionately associate with graduation.
Results
Hypotheses 1 and 2
Table 2 presents findings from the empirical specification based on Model 1, which examined the association between absenteeism and class grades. The key predictor is listed in the first section of the table: the percentage of class missed in year t. Column 1 illustrates results from the baseline model where the estimated effects of absenteeism are considered to be linear. Column 2 shows results from an extended form of Model 1 that includes an additional polynomial term to determine the turning point of the effects of absenteeism, where absences begin to have disproportionately more or less effects on grades. This turning point is compared with the threshold of chronic absenteeism: missing 10% or more of class.
Estimates of the Effect of Students’ Class-Level Absences on Class Grades

Note. Standard errors are in parentheses.
p < .05. **p < .01. ***p < .001.
Looking at the first column, the results suggested that absences from class associated with receiving a lower grade in that class. Specifically, a one-unit change in the absence measure (i.e., missing 100% of the class) related to a decline of 0.68 (i.e., −0.68) of a letter grade. Recall that all models control for observed and unobserved time-invariant student, year, grade, and school heterogeneity.
Then looking at the second column, this figure jumped to a decline of 1.02 of a letter grade when treating absenteeism as having nonlinear associations to course grades. The polynomial term is positive and statistically significant. This squared linear predictor was used to calculate via the derivative outlined above to compare the turning point of absenteeism with the policy threshold of 10% as an indicator for chronic absenteeism. In this case, the result of this calculation amounts to 4.25, which is 425% of class missed. The implication of this figure, which lies outside the range of the data, is discussed in the next section.
The last column illustrates the standardized beta coefficients for the first empirical model. These coefficients yield similar estimates to the calculation of Cohen’s d standardized effect sizes (Cohen, 1992; Cohen, Cohen, West, & Aiken, 2013). The effect size estimate of the percentage of class missed on class grades was −0.18σ. Note that when looking across variables included in this study, the absenteeism variable had the largest effect size with exception to having been required to attend juvenile court.
Hypotheses 3 and 4
The second set of hypotheses explored the association between absenteeism across courses in school and overall GPA using the empirical model illustrated by Model 2. These results are displayed in Table 3. As was the case with prior models, these models controlled for all observed and unobserved time-invariant variation at the student, year, grade, and school levels.
Estimates of the Effect of School-Level Absences on Overall GPA

Note. GPA = grade point average.
As shown in column 1, missing 100% (one-unit change) of school during year t related to a decline of 0.70 (i.e., −0.70) in GPA points that year. Looking at column 2, this estimate changes to −0.88 when considering absenteeism from school as having a nonlinear relationship to overall GPA. As was the case with the prior model, the polynomial term is statistically significant and positive. Using this term to derive the turning point of absenteeism, the turning point of the percentage of school missed and nonlinear effects on GPA lies at 7.33, or 733% of missed school. This prediction is also outside the range of data and is discussed below. The effect size of the linear coefficient of percentage of school missed on overall GPA is listed in column 3 as −0.25σ.
Hypotheses 5
The final hypothesis inquired about the association between percentage of school missed on likelihood of dropping out of high school. This hypothesis was examined using the empirical specification illustrated in Model 3 above. Note that this model restricted the sample to students with 4 years of data, which means that a majority of students being considered are those who were in the ninth grade in the 2013–2014 school year. Given that the outcome is only observed once, this model does not include student, grade, or year fixed effects. This model does include school fixed effects, which accounts for all between-school differences in the data. Note that this model is a linear probability model, so unstandardized coefficients are interpreted as changes in percentage point likelihoods.
As seen in column 1 of Table 4, missing school was positively associated with high school dropout. Specifically, a one-unit change in the key variable—students who missed 100% of school across all 4 years—has an 8 percentage-point higher likelihood of dropping out of high school. The effect size for this estimate is significantly lower compared with the prior models: The effect size between percentage of school missed and high school dropout is 0.02σ.
Estimates of the Effect of Absences on Likelihood of High School Dropout

Note. Standard errors are in parentheses.
p < .05. **p < .01. ***p < .001.
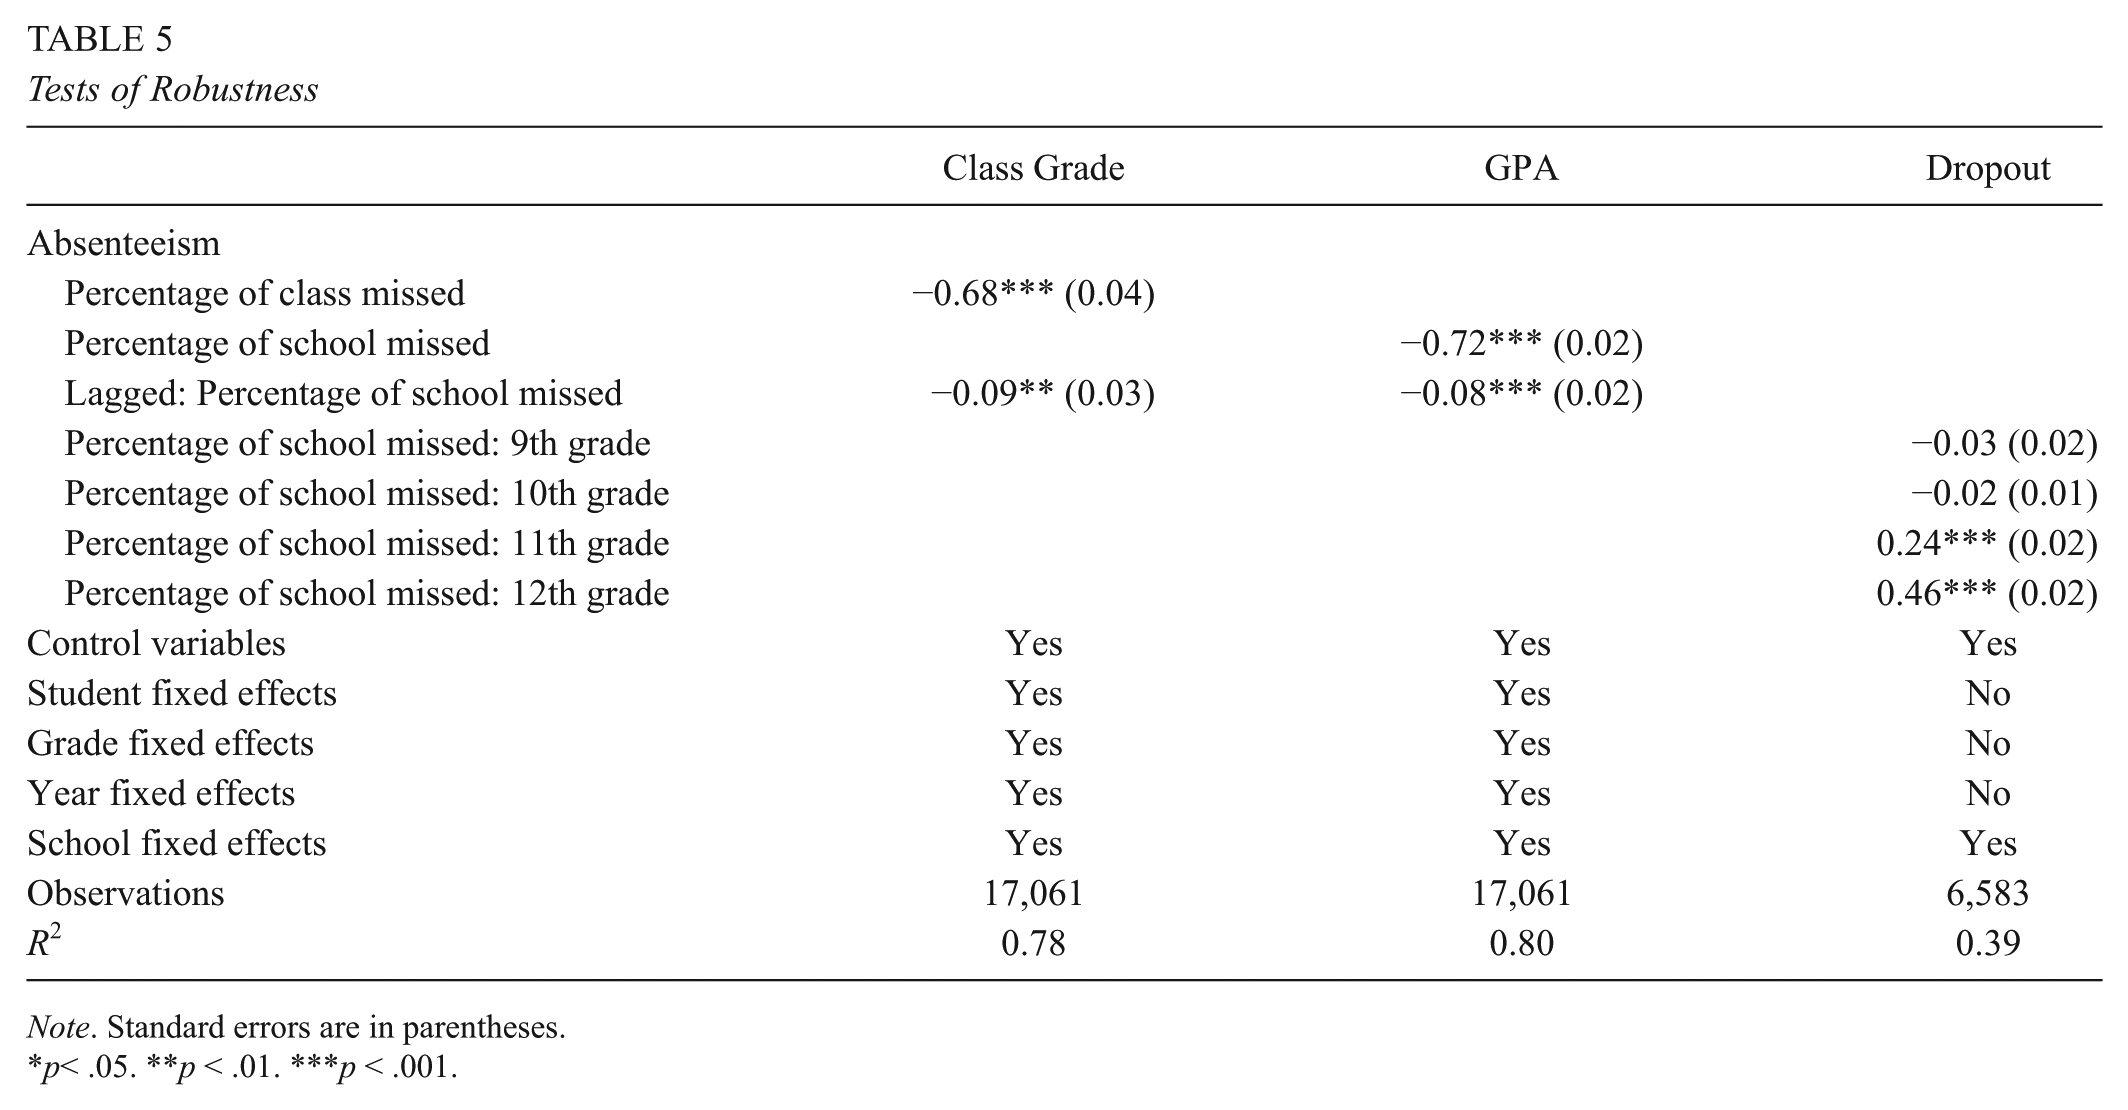
Tests of Robustness
Table 5 builds on the baseline set of findings by examining the association between absenteeism and academic outcomes using different specifications. First, for class grades and overall GPA, there may be concern that some time-variant student-level factors might confound the estimate of the association between absenteeism and outcomes. Namely, students’ prior rates of absenteeism in courses or school varies from year to year, and thus, the various fixed effects specifications do not account for this factor. Models 1 and 2, respectively, were extended to include a lagged variable that represents the percentage of school students missed in the previous year. Note that due to the need to include a lagged variable, students who were observed in the data set for the first time (e.g., observations of students in the ninth grade in 2013–2014 or the first year observations of students who transferred into the district at any time) were dropped from the analyses.
Tests of Robustness
Note. Standard errors are in parentheses.
p< .05. **p < .01. ***p < .001.
Beginning with column 1, the association between class missed and class grades is identical to the estimate shown in Table 2, that is, −0.68. But note that the lagged variable of prior absenteeism was statistically significant and negative—indicating that prior rates of absences do associate with declines in course grades. Similarly for GPA, the percentage of school missed in year t was associated with declines in GPA at a similar magnitude to what was shown in Table 3. Students’ prior rates of absences were also statistically significant and related to declines in overall GPA the following year.
Finally, prior analyses of the relationship between absenteeism and high school dropout did not include the potential for a nonlinear relationship. Using a binning method—breaking up absences by year in high school—is one method of understanding how the independent variable may have a nonlinear relationship to the outcome variable (Keele, 2008). In the case of absenteeism, this study considered whether missing school in a particular grade in high school related more/less strongly to the likelihood of high school dropout. These results are shown in column 3.
As seen from Table 5, there was no statistically significant association between absences in 9th and 10th grades and eventual high school dropout. Instead, only absences in grades 11th and 12th grades were statistically significant, and these coefficients are notably larger than the baseline presented in Table 4. Specifically, a one-unit change of the absence variable for the 11th grade—students missing 100% of the 11th grade—related to a 24 percentage-point increase in the likelihood of high school dropout. The estimates for absences in the 12th grade were even larger. Students missing 100% of the 12th grade had a 46 percentage-point increase in their likelihood of dropping out of high school. The differences between these estimates and those presented in Table 4 are discussed below.
Discussion
Though policymakers, educational stakeholders, and practitioners continue to raise concerns about the consequences of absenteeism on academic outcomes for students in schools, no study has utilized a preregistered study with the various hypotheses that have been confirmed in prior research. That is, prior research has shown consistently negative effects between absences and course grades, overall GPA, and high school dropout. This was the first study to examine these outcomes in tandem with a data set with hypotheses posed prior to the researcher receiving access to the data.
This study utilized empirical models used in prior research with a new data source from a secondary school district. The data set contained period-level daily absence logs, which allowed for the connection of course-level absences and course-level grades, school-level absences and overall GPA, and separate years of absences and high school dropout. Having these detailed data allowed for the ability to not only examine the previously confirmed hypotheses but also examine these hypotheses with more quantitative rigor.
Across all hypotheses posed in this study, absenteeism was confirmed as having a nonzero, negative association to course grades, overall GPA, and likelihood of high school dropout. All associations were found with a p value of p < .001. This means that preregistered Hypotheses 1, 3, and 5 were confirmed. As a result of these findings, this study calls for attention to absenteeism as an important metric for schools and policymakers to consider for affecting educational outcomes of students. Though as discussed below, it may be necessary to reframe policy discussions about absenteeism with regard to linear versus nonlinear impacts on students.
As for Hypotheses 2 and 4, the nonlinear relationship between absenteeism and course grades and GPA was found to be insignificant. In more detail, both estimates of the turning point of absenteeism were outside the range of the data (4.25 and 7.33, respectively). That is, according to the polynomial terms, the nonlinear effect of absenteeism on course grades and overall GPA exists at 425% and 733% of class and school missed, respectively. These empirical specifications model predictions that could and could not be possible given the data, and thus their estimates should be interpreted with precaution and in context. When considering the context of this study and acknowledging that students can miss a maximum of 100% of class or school, these terms indicate that absenteeism was best modeled as having a linear relationship to these outcomes. This confirms Hypotheses 2 and 4 that absenteeism would not have a disproportionate relationship to academic outcomes at a given threshold. Thus, this study calls for additional scrutiny to undue attention given to various thresholds of absenteeism, especially as policymakers and educational stakeholders continue to emphasize various thresholds related to chronic absenteeism. While these thresholds may be useful for comparisons of rates of schoolwide absences or categorizing students needing different tiers of academic support (http://www.attendanceworks.org/), this study yielded no evidence that absences have a nonlinear relationship to academic outcomes. This finding supports the findings of Gershenson et al. (2017) and Gershenson et al. (2018).
Conclusions and Further Research
In conclusion, it is clear that school attendance is related to academic outcomes for students in high school, and this study confirms numerous prior studies that have examined this phenomenon. But this study was the first to utilize a preregistered administrative data set and included more detailed variables, namely, period-level absences, than many prior studies.
Due to this study’s reliance on a secondary, administrative data source, there are several limitations that should be considered. First, the variable of absenteeism relies on accurate reporting by teachers. It could be the case that some teachers in this school district do not accurately report absences for their students, which limits our insight as to the true effect of absences on academic outcomes. Second, this study did not incorporate qualitative inquiry to investigate possible mechanisms that relate to the relationship between missing school and course grades, GPA, and high school dropout. With particular regard to the more unique findings of this study compared with previous work, future research ought to consider reasons for the disproportionate impact of absenteeism is 11th and 12th grades and high school dropout and the linear impact of absences on course grades and GPA. Finally, this study lacked key information on other potential time-varying confounders between absenteeism and academic outcomes. These variables include household characteristics, noncognitive student characteristics, neighborhood attributes, and measures of school/classroom climate.
Footnotes
Acknowledgements
This material is based on work supported by the National Science Foundation Graduate Research Fellowship Program under Grant No. 1650114. Any opinions, findings, and conclusions or recommendations expressed in this material are those of the author and do not necessarily reflect the views of the National Science Foundation.
Author
J. JACOB KIRKSEY is a PhD candidate at the Gevirtz Graduate School of Education. His research is dedicated to understanding untended consequences of education policies with a particular focus on disadvantaged students in K–12.