
Abstract
We investigate factors influencing student sign-ups for Washington State’s College Bound Scholarship program and consider whether there is scope for the program to change college enrollment expectations. We find that student characteristics associated with signing the scholarship pledge closely parallel characteristics of low-income students who attend 4-year colleges, suggesting that signing the pledge is driven largely by preexisting expectations of college going. We also find evidence that student sign-up rates are lower than have been previously reported, which is important given the perception among program administrators that nearly all eligible students sign up.
A state policy response to the relatively low level of college attainment of disadvantaged students is to make college more affordable and also alert disadvantaged students early, letting them know that college is within their grasp. One such program is an early-commitment, need-based scholarship in which states or local areas commit early in a low-income student’s schooling to provide financial aid for college if, in return, the student pledges to do well in school and stay out of trouble. A central theory of action of these early-commitment programs is that the pledge will change students’ expectations about college while they still have time to prepare for college.
There is very little evidence about the factors that predict whether students sign up for these early-commitment pledge programs. 1 This is an important gap in the financial-aid and college-going literature given that students can financially and academically benefit from such programs only if they sign up for them.
This paper evaluates Washington State’s College Bound Scholarship (CBS), an early-commitment scholarship that promises full tuition to low-income middle school students who participate. By examining student-level historical data and conducting qualitative interviews, this paper addresses the following questions: (a) What student and middle school characteristics are associated with signing the CBS pledge? (b) How closely do these characteristics parallel preprogram predictors of college enrollment? (c) What do program administrators report doing to encourage student uptake of the program? We address the first two questions through quantitative analyses, using administrative data from Washington State. The third question is addressed by a qualitative component of our work that involves semistructured interviews with administrators from the College Success Foundation (which, as we describe later, is involved with outreach efforts to promote the CBS) and middle school guidance counselors.
We find that factors associated with signing up are similar to factors associated with enrollment in college, and this pattern holds for each of the first three cohorts of CBS-eligible students. Indeed, there is little evidence that the demographic patterns predicting sign-ups change over the first three cohorts of program administration, calling into question the extent to which the pledge program is changing college-going expectations. Additionally, we find there is a positive correlation between predicted and actual sign-up rates at the school level, but the correlation (.40) is not overwhelmingly high, suggesting that targeting resources toward encouraging student sign-ups at schools with surprisingly low sign-up rates could significantly boost overall program enrollment.
Conceptual Model/Theory of Action for Early-Commitment Pledge Programs
Human capital theory posits that individuals make decisions about human capital investments that are thought to enhance productivity and earnings (Altonji, Blom, & Meghir, 2012; Becker, 1993). Early-commitment pledge programs may change the calculus when it comes to decisions about investing in college preparation by providing an early signal that the financial resources to attend college are within a student’s grasp.
However, the extent to which pledge programs influence college going is also likely to be influenced by the information that students receive about programs as well as the guidance they get about how to prepare for college success (Oreopolous & Dunn, 2012). The role played by school administrators in providing students information about college is likely to be particularly important for low-income students given that research (Avery & Kane, 2004) finds that they are substantially less likely to have an accurate picture of college admissions processes or costs.
The CBS provides clear guidance about academic and behavioral requirements for the receipt of a scholarship, along with the promise that students adhering to the requirements are likely to have the resources necessary to attend college (assuming they remain income eligible in 12th grade); for most eligible students, the program essentially eliminates the cost of attending a Washington public college (aside from room and board). Thus, the CBS should increase forward-looking students’ expectations about college (and hence make them more likely to prepare for college in high school, apply to colleges, and enroll).
Students must sign up in middle school for the CBS in order to be eligible for the scholarship in the 12th grade (more details about the CBS are available in Appendix A online). We believe signing up is an early indicator of college-going expectations. But students eligible for the CBS will also have heterogeneous expectations about college: Some, for instance, are likely to go to college irrespective of the CBS program. The hope is that the program, as it is rolled out over time, is encouraging eligible students who had not previously considered college to make college an expectation. Thus, given the theory of action, we test two hypotheses:
Hypothesis 1: The factors that predict college going among eligible students will also predict the likelihood of signing up for the CBS program.
Hypothesis 2: As the program is rolled out over time, the relationship between the factors predicting college going and signing up for the program will be lessened.
The first hypothesis reflects the fact that students with a high propensity to go to college should also have a high propensity to sign up for a program that provides them with a college scholarship. The second hypothesis reflects the hope that as the program is implemented and word spreads about the availability of this source of college funding, students who would not previously have considered college as an option begin to do so, weakening the relationship between the factors predicting college and program sign up.
Literature Review
Several states have implemented financial aid programs designed to address college enrollment and attainment gaps by offering in-state low-income adolescents an early promise of funding for college in exchange for a student’s early-commitment pledge (typically during seventh to ninth grades). Pledges commonly ask students to do well in high school, be a good citizen, and apply to college. Currently there are three states (Indiana, Oklahoma, and Washington) that are operating early-commitment pledge programs that meet Blanco’s (2005) “three core criteria for early commitment programs: that they make a guarantee of aid; that aid is designated only for economically disadvantaged students; and that students are identified in elementary, middle school, or early high school” (p. 9). 2
These early-commitment pledge programs are similar to other promise programs that spread rapidly in recent decades (Dynarski, 2004; LeGower & Walsh, 2017). 3 The effects of these promise programs, that is, programs in which states or local municipalities make a commitment to fund at least some part of in-state college tuition, have been studied extensively. The findings tend to show positive effects for in-state college matriculation (with some diversion of students from out of state to in state) and credit accumulation (e.g., Bartik, Hershbein, & Lachowka, 2017; Carruthers & Özek, 2016; Cornwell, Mustard, & Sridhar, 2006; Page, Iriti, Lowry, & Anthony, in press; Perna & Leigh, 2017; Scott-Clayton, 2011; Sjoquist & Winters, 2014). Yet, these programs may also exacerbate college attainment gaps between advantaged and disadvantaged students. For instance, Dynarski (2000) finds that “Georgia’s program has likely increased the college attendance rate of all 18- to 19-year-olds by 7.0 to 7.9 percentage points” yet “widened the gap in college attendance between blacks and whites and between those from low- and high-income families” (p. 629). 4
Although early-commitment pledge programs are similar to other promise programs insofar as they typically offer aid at in-state colleges for students achieving modest academic thresholds, they differ from other promise programs in a key way: They require students to sign an early-commitment pledge as a condition of eligibility. This programmatic element is designed to increase college going and, importantly, close college attendance gaps. In particular, they are thought to help low-income students directly by making college more affordable and indirectly by signaling to them early enough that college is financially within their reach. In doing so, the early promise of a college scholarship is expected to raise students’ expectations about the feasibility of college attendance and create a strong incentive for them to do well in high school and fulfill pledge requirements.
It is worth emphasizing that the opt-in nature of the pledge requirement is a feature designed to target students, particularly those who, due to financial concerns, might not have college-going expectations entering high school. College-going aspirations are expected to change high school behavior, for example, to lead students to take high school courses that ready them for college. But if opting in has no effect on subsequent behavior in high school, then it is likely that early-commitment pledge programs will be less effective than other promise programs wherein eligibility is automatic, because some students will fail to make themselves eligible for scholarships by not signing up; Thaler and Sunstein (2003) show in a variety of contexts that programs requiring participants to opt in tend to have lower participation rates than programs in which participation is the default option.
There is a striking dichotomy between the aspirations of younger students to attend college and the actuality of college enrollments. 5 And when college funding is available, low-income students are less likely to know about it, are less familiar with the process for attaining it, and/or lack a good understanding of the academic requirements needed to be admitted and to succeed in college (Bettinger, Long, Oreopoulos, & Sanbonmatsu, 2012; Dynarski & Scott-Clayton, 2006; Hahn & Price, 2008; Kirst, Venezia, & Antonio, 2004; B. Long & Riley, 2007; Rosenbaum, 2001). Not surprisingly, then, by senior year, low-income students are substantially less likely to have taken courses necessary to succeed in college (Choy, 2001; Jacob & Linkow, 2011). Nevertheless, Castleman and Goodman (2018) found that intensive high school counseling benefits low-income students, and the program they studied “successfully shifts enrollment toward four-year colleges,” which further resulted in “persistence through the third year of college” (p. 19).
Existing studies on early-commitment opt-in pledge programs are limited in their ability to identify treatment effects as they lack data needed to form appropriate comparison groups for those students who are eligible to participate in these programs. St. John and colleagues (St. John et al., 2004; St. John, Fisher, Lee, Daun-Barnett, & Williams, 2008; St. John, Gross, Musoba, & Chung, 2005; St. John, Hu, & Weber, 2001; St. John, Musoba, & Simmons, 2003) investigated the impact of Indiana’s program yet lacked both data on cohorts of students before the introduction of the pledge program and data needed to identify if a student was eligible for the program. As a result, they were forced to compare students who signed the pledge with a comparison group of students who may or may not have been eligible. 6 Fortunately, as we describe later, we have access to both CBS eligibility indicators and data on prepolicy cohorts of students. This allows us to explore the extent to which factors predicting whether students sign the pledge look similar to the factors associated with college enrollment from before the implementation of the CBS. In other words, we are able to investigate the degree to which the aspirations surrounding college attendance of different groups of students do or do not change. 7
Methods and Data
Quantitative Analytic Methods
We begin with a quantitative analysis of the individual and school characteristics that predict the likelihood of a student signing the CBS pledge in middle school. We estimate the specifications shown in Equations 1a and 1b using data on the first three cohorts of CBS-eligible students:


The subscript i denotes the student and m denotes the middle school attended in eighth grade. 8 The dependent variable for this analysis, Signed im , is an indicator variable that equals 1 if the student signed the pledge by the end of eighth grade (or ninth grade for Cohort 1 9 ). The student-level predictors (i.e., the Xi vector) include standardized scores on Washington’s reading and mathematics assessments—known as the Washington Assessment of Student Learning (WASL)—when the student was in sixth grade and indicators for taking the WASL tests out of grade level and taking a modified version of the WASL, 10 student’s age in May of eighth grade, and indicators for female, race-ethnicity group (Hispanic; non-Hispanic African American, Asian, Hawaiian or Pacific Islander, or Native American or Alaskan Native; or non-Hispanic and two or more races), disability status, migrant status, homeless status, “highly capable” status, “transitional bilingual” status, language spoken at home other than English, and attendance at a public school part-time (as a homeschooler or private school enrollee).
We estimate Equation 1a using a logit specification with middle school fixed effects, MSCE m , to account for time-invariant school-level factors that may influence students’ signing the pledge. 11 We cluster the standard errors of all the regressions at the middle school level to account for the fact that guidance counselors and school culture are both thought to be important determinants for whether middle school students sign the pledge; that is, there is likely to be within-cluster error correlation (Cameron & Miller, 2015).
We estimate Equation 1b (which drops middle school fixed effects and adds middle school characteristics, S m ) using a hierarchical logistic regression (i.e., the logit analog of hierarchical linear modeling) with random intercepts. The advantage of the fixed-effects specification (Equation 1a) is that it accounts for both observable and unobserved time-invariant school-level factors. The disadvantage of Equation 1a over Equation 1b is that the former does not estimate the way that student sign-up rates are influenced by observable school-level characteristics. The following middle school characteristics are included in Equation 1b: percentage of students receiving free or reduced-price lunch (FRPL), mean standardized student score on the sixth-grade mathematics WASL among eighth-grade students in the school, eighth-grade enrollment in fall (divided by 100), whether the school has a guidance counselor, the proximity to college slots (measured as the number of undergraduate students at a 4-year college within a 50-mile radius 12 ), and an indicator for the school’s region (Puget Sound [including King, Pierce, Kitsap, Thurston, and Snohomish counties], the remainder of western Washington [i.e., west of the Cascade Mountains], or eastern Washington). After running these logistic regressions, we compute the marginal effect of a one-unit increase in each variable (holding all other variables constant) on the probability that the student signs the pledge.
Next, we estimate versions of Equations 1a and 1b where we replace the outcome with an indicator for enrolling in any college within 4 years of ninth-grade entry, Enrolled im . 13


For these regressions, we use data from two pre-CBS cohorts. 14 These regressions allow us to evaluate whether there are meaningful differences between the β1 and β2 vectors of coefficients using “Signed” as the dependent variable and the γ1 and γ2 vectors of coefficients using “Enrolled” as the dependent variable. If these sets of coefficients are similar, it would indicate that the types of students who are more prone to attend college are also more likely to sign the pledge. Substantial differences in the coefficients may also provide useful information. 15
To assess the similarity of the estimated vectors of coefficients using “Enrolled” rather than “Signed” as the dependent variable, we examine the correlation between the sets of marginal effects found for the two dependent variables. Then, to gain a better sense of whether the CBS program is encouraging students who are demographically unlikely to attend college, we compare the predicted probabilities generated by the enrollment and pledge models. We investigate whether the predicted enrollment and pledge probabilities align or diverge for each cohort of students eligible to sign the CBS pledge. Specifically, we assess the extent to which the estimated coefficients from specification 2b (the coefficients from the college enrollment model) predict the estimated probabilities of signing the pledge for each CBS-eligible cohort (generated from estimating specification 1b, the pledge model, separately by cohort). 16
More formally, we generate two predicted probabilities for each individual in each postpolicy cohort:

We estimate Equation 3 as a cubic as we are particularly interested in whether there are differential changes in the likelihood of signing the pledge along the distribution of probabilities of enrolling in college.
Data for Quantitative Analysis
The data we utilize are compiled by Washington State’s Education Research and Data Center (ERDC). ERDC maintains individual student-level K–12 records for all public school students in the state that can be linked to information about enrollment in 2- or 4-year colleges in Washington state as well as those outside the state (through the National Student Clearinghouse). The ERDC data include K–12 student information dating back to the 2005–2006 school year, providing us data on two cohorts of students who did not have the opportunity to receive a CBS scholarship (those who were in eighth grade in 2005–2006 and 2006–2007) and three cohorts who were eligible to sign up (those who were in eight grade in 2007–2008, 2008–2009, or 2009–2010). We restrict the analysis to students who are known to be FRPL eligible, and therefore eligible to sign the pledge, in seventh or eighth grade (or eighth or ninth grade for the first postpolicy cohort due to a temporary change in eligibility for this cohort), which brings our analytical sample size to 191,337 students. 17
The CBS program is overseen by the Washington Student Achievement Council (WSAC), which “provides strategic planning, oversight, and advocacy to support increased student success and higher levels of educational attainment in Washington” (WSAC, n.d.). As part of its efforts to support the CBS, WSAC monitors sign-up rates across the state and by district. WSAC reported substantial success in increasing the sign-up rate since the CBS program began. Its initial calculations, reported in Figure 1, show that the sign-up rate was 57% for the first cohort of eligible students and rose to 85% by the sixth cohort. In 2016, its website stated, In 2015, 91% of the Class of 2019 (8th graders whose deadline was June 30, 2015) submitted complete applications. This year, 110 districts had sign-up rates of 92% or higher. Of these, 77 school districts saw 100% of their eligible students sign up.
18

Sign-up rates according to the Washington Student Achievement Council (personal communication, Rachelle Sharpe, senior director of student financial aid and support services, Washington Student Achievement Council, August 23, 2013).
Figure 1 suggests improvement over time in sign-up rates and little room for further improvement in a large number of school districts, as these approached 100% participation/sign-up. Our estimates, discussed next, confirm improvement over time, but as we describe, we found that the baseline/first-year sign-up rate to be significantly lower than the figures previously reported by WSAC, suggesting room for growth in sign-up rates.
In particular, our calculations were somewhat different than those previously used by WSAC (WSAC has, since the release of our working paper, adjusted its method for calculating sign-up rates). To calculate the sign-up rate, we utilize student-level FRPL data, which capture eligibility in both seventh and eighth grades corresponding to the policy’s eligibility requirements. In Table 1, we show our calculations of the sign-up rate for the first three eligible “postpolicy” cohorts. In row (A), we find that the number of students signing the pledge increased from 14,176 to 18,802 across these three cohorts. 19 By contrast, WSAC reported (as shown in Figure 1) that the number of students signing the pledge increased from 15,947 to 20,903 across these same three cohorts. Our total counts of students who signed the pledge are lower because we do not count pledges from foreign exchange students, students in foster care in seventh or eighth grade, students who have irreconcilable birthdays across observations, or students who did not attend eighth grade in a Washington school. (Note that these same students are not included in our denominator.) Also, we do not count pledges for which there was no corresponding student in our K–12 database.
Sign-Up Rates

“Clearly eligible” defined as a student that was marked as eligible for free and reduced lunch program at any point during seventh- or eighth-grade year (eighth or ninth grade for the first postpolicy cohort).
Next, in row (B), we show that the number of clearly eligible students remained stable, ranging from 37,519 to 38,659 across the first three cohorts. This denominator is substantially larger than the denominator previously reported by WSAC (i.e., 28,093 to 29,856 as shown in Figure 1). WSAC used the number of FRPL students in seventh grade as recorded in October of the corresponding school year. The result is an early snapshot of eligibility that does not include students who are added to FRPL programs throughout the remainder of their seventh grade or at any point during their eighth grade. 20
We believe the sign-up rates we report represent an upper bound given that they do not include students who are made eligible to sign the pledge by virtue of participation in the Supplemental Nutrition Assistance Program, the Food Distribution Program on Indian Reservations, or Temporary Assistance for Needy Families or who sign the pledge despite not being income eligible. 21 The sign-up rate we calculate by dividing (A) by (B) is 36.7% for the first cohort and 48.9% for the third cohort. These figures that are substantially lower than the 57% and 70% rates reported by WSAC in Figure 1, although the increase in our calculated rate over time is very close to that reported by WSAC (12.2 percentage points from first to third cohort vs. WSAC’s report of a 13-percentage-point change).
In an effort to better track progress on the CBS sign-up rates, soon after the release of our working paper on July 28, 2016, WSAC changed the way it calculates sign-up rates to have its denominators reflect student mobility into CBS eligibility and called the new rates “reconciled rates” (Shankster, Larson, & Kwakye, 2017). The distinction in the way sign-up rates are calculated may well be important because school districts and schools until 2017 could have thought that they had only a few eligible students who had not signed the CBS pledge when in fact there may be many more. 22
In the last rows of Table 1, we show that there were sizable differences in sign-up rates across the three regions of the state, particularly in the first cohort, with eastern Washington leading and western Washington counties that surround the Puget Sound counties trailing. It is interesting to note that although eastern Washington had a high sign-up rate for the scholarship program compared to western Washington counties (41.7% vs. 28.1% for the first scholarship cohort), both regions have similar college enrollment rates (28.2% vs. 27.1% for the first scholarship cohort). This heterogeneity in sign-up rates suggests the possibility of uneven communication and understanding of the program across the state and provides an argument for the qualitative research that we carry out.
Table 2 presents the descriptive statistics for our analytic sample, which consists of those students who are clearly eligible to sign up. Among eligible students, the share that enrolled in any college within 4 years after starting ninth grade increased across the two prepolicy cohorts (from 23.6% to 25.7%) and then increased again for the first postpolicy cohort to 27.2%. Eligible students saw small gains in their test scores relative to not-clearly-eligible students (e.g. students who qualify based on family income but do not receive free or reduced-priced lunch). Finally, note that eligible students tend to live closer to more undergraduate students than not-clearly-eligible students (as indicated by the standardized number of undergraduates within 50 miles being greater than zero for eligible students). See Appendix B online for a discussion of how missing data are handled.
Descriptive Statistics for Quantitative Analysis Sample
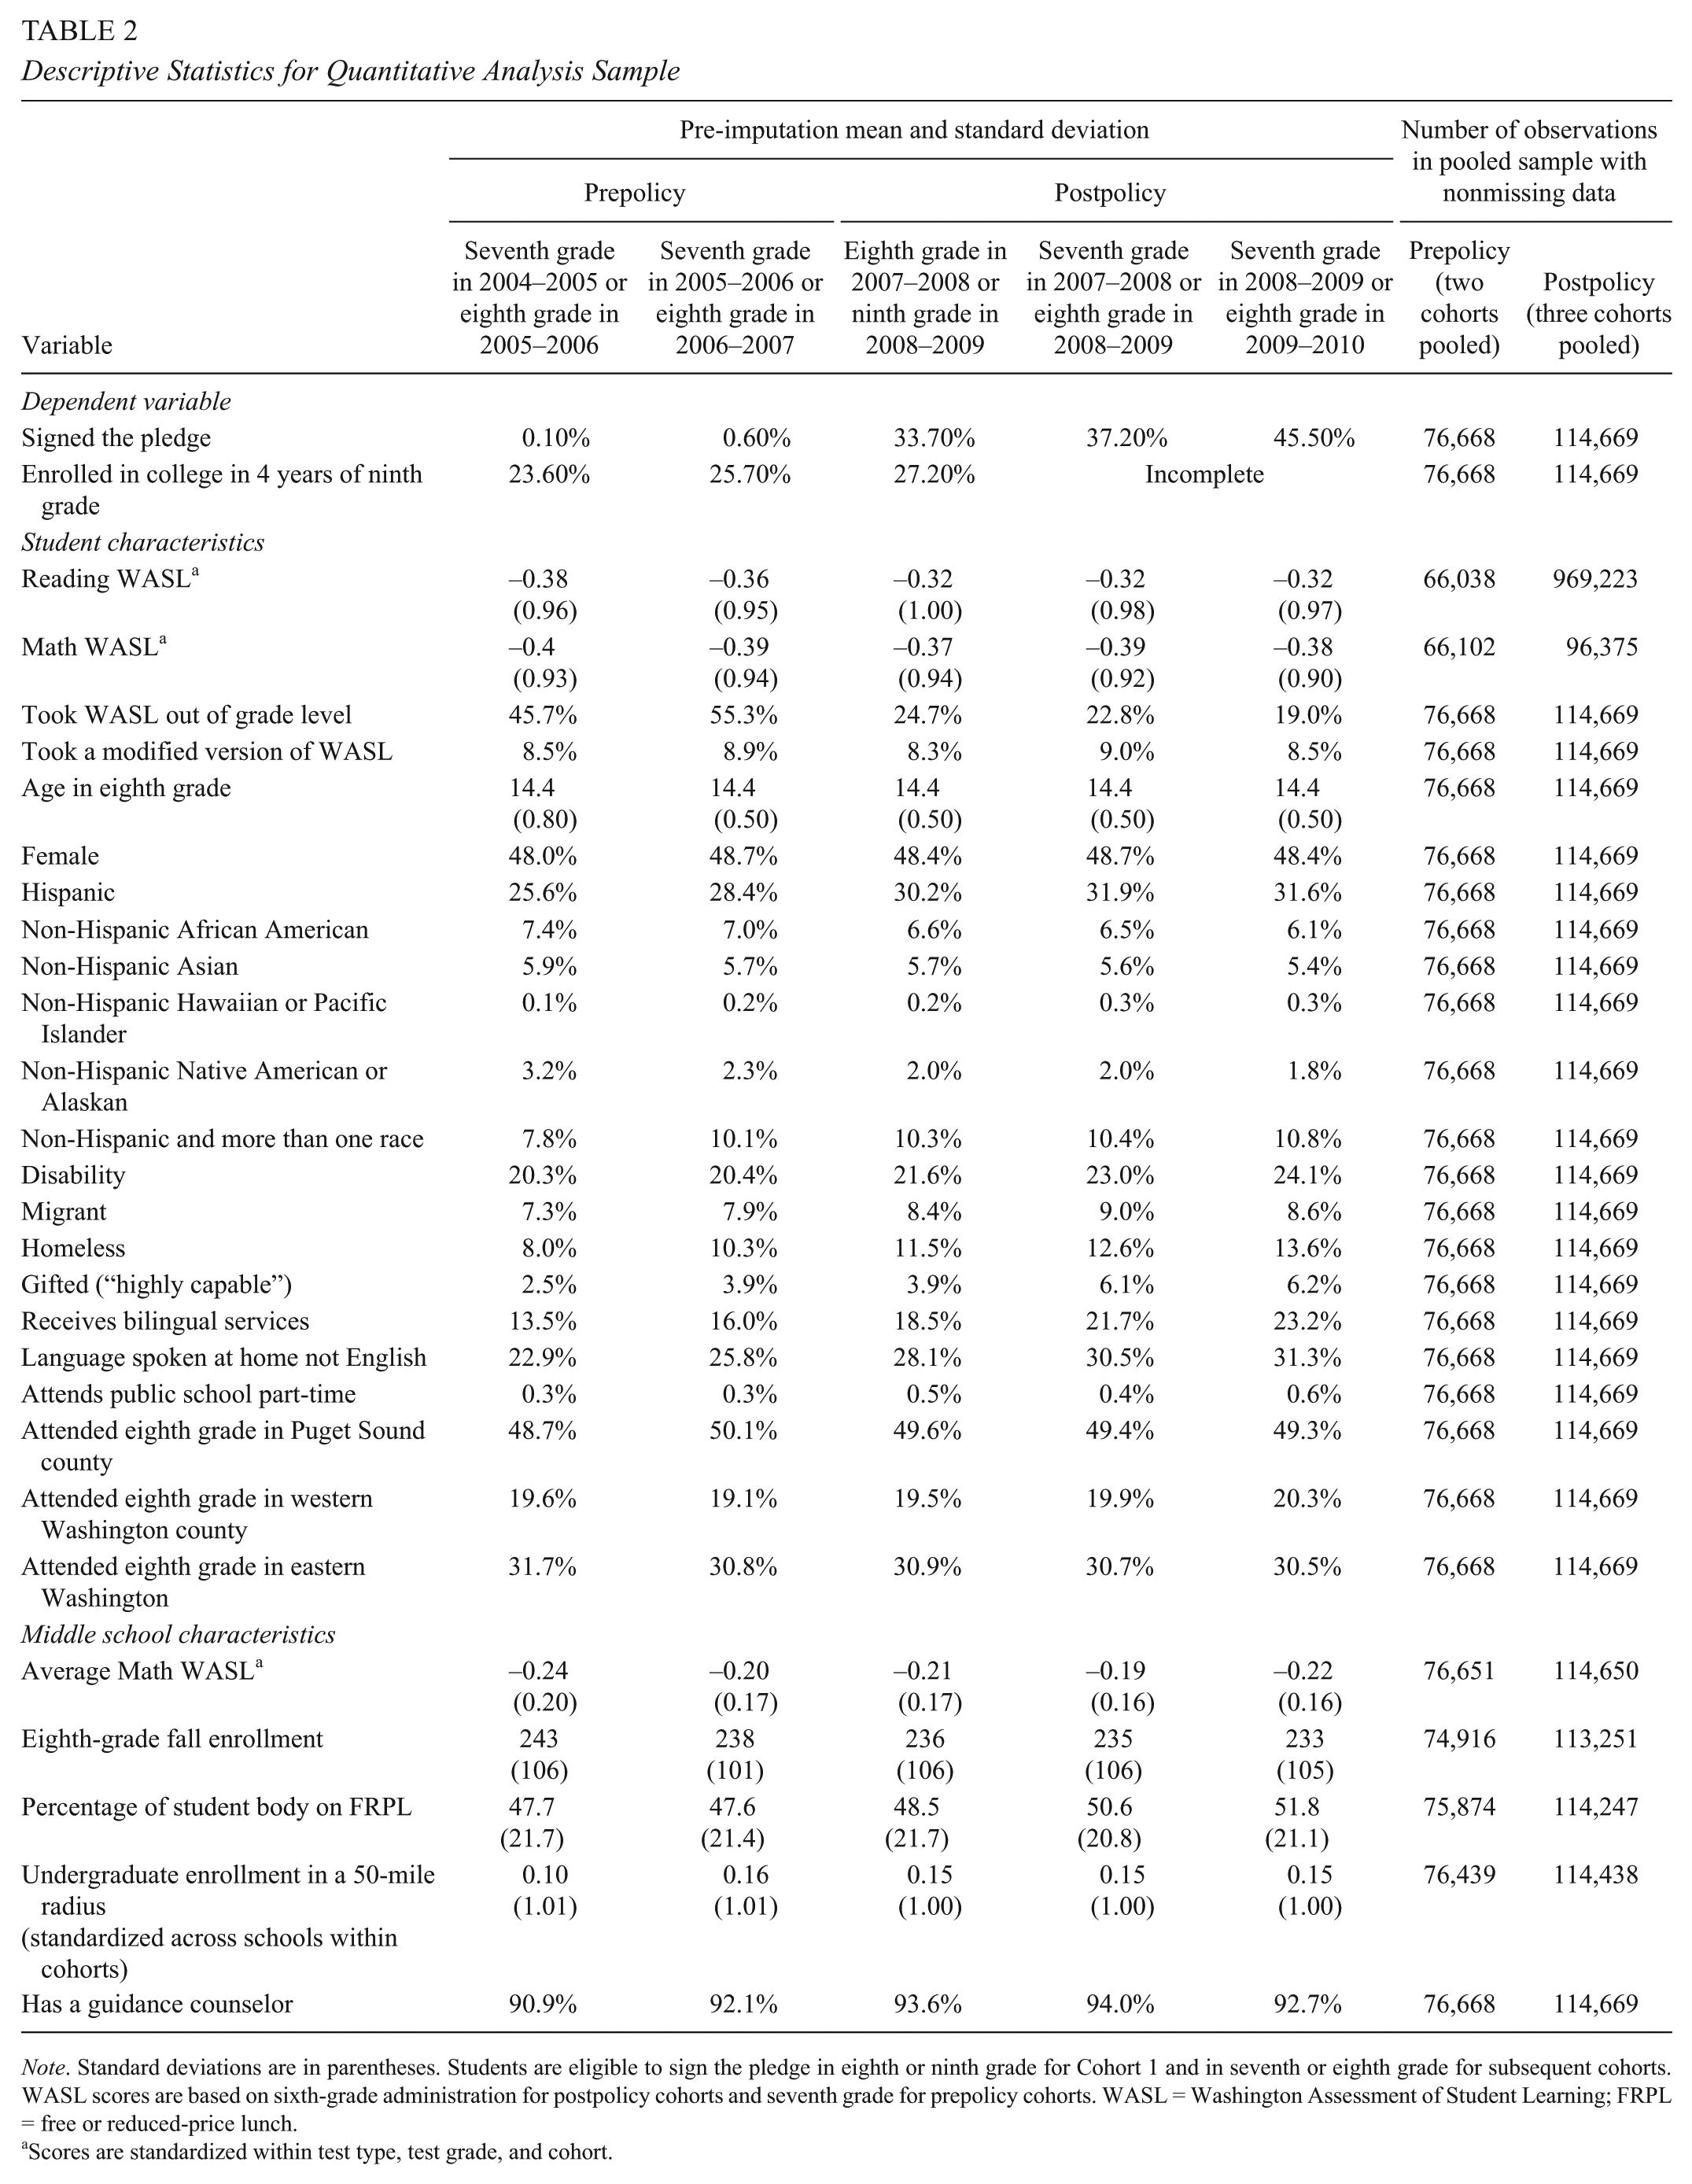
Note. Standard deviations are in parentheses. Students are eligible to sign the pledge in eighth or ninth grade for Cohort 1 and in seventh or eighth grade for subsequent cohorts. WASL scores are based on sixth-grade administration for postpolicy cohorts and seventh grade for prepolicy cohorts. WASL = Washington Assessment of Student Learning; FRPL = free or reduced-price lunch.
Scores are standardized within test type, test grade, and cohort.
Qualitative Data and Analytic Methods
The goal of our qualitative analysis is to complement the quantitative research on uptake of the CBS by providing a deeper understanding of how school-level administrators understand the CBS, how information is conveyed to students, and what efforts schools are making to get students to sign the pledge. As the empirical evidence in Hurwitz and Howell (2014) suggests, school administrators, and guidance counselors in particular, play a vital role in laying the groundwork for students to be on a college-ready track and successfully enroll in college. We believe such qualitative information is key to understanding the CBS take-up rate.
The qualitative analysis approach was intended to align with the structure of the CBS; that is, a set of regional officers oversee a geographical area and provide guidance and support to school administrators. School administrators then (almost always) delegate the program administration to their guidance counselor or administrative staff. Interviews were conducted at all three levels to see if there was a disconnect that was limiting program implementation or that could help explain any potential differences between the qualitative and quantitative findings.
Our qualitative analyses draws upon data from semistructured interviews. The first set of interviews included the five CBS regional officers and their director on the College Success Foundation staff. The interviews were conducted either individually or in a small group between November and December 2015. Interview protocols, which are included in Appendix C online, were designed to ensure consistent data collection on critical themes across respondents and to facilitate systematic analysis. At the same time, they allowed for unanticipated themes to emerge. A senior researcher led interviews while an analyst took notes. Interviews lasted between 60 and 120 min.
These interviews touched on a variety of topics, including
Efforts to inform and engage various stakeholders in the CBS program (schools, students, parents, community organizations), 23
Practices to encourage student uptake,
Factors limiting student uptake,
Evidence that the program is affecting students’ behavior, and
Factors limiting the program’s success.
After the interviews, the research team distilled notes into analytic themes. We then identified areas of agreement, areas of disagreement, and patterns with respect to these themes. Overall, these interviews provided a high-level perspective on the CBS’s sign-up activities around the state. These interviews were used to inform development of the protocol for the second set of interviews with middle school principals and guidance counselors.
For a second set of interviews, we selected a diverse sample of middle schools that were based on geographic region and the extent of their correspondence (or divergence) in the school’s actual sign-up rate to their predicted sign-up rates. We predicted each school’s sign-up rate for 2011–2012 as follows:

where
Respondent Sample by Region and Predicted Versus Actual Sign-Up Rate

Note. Predictably-low-sign-up schools are in the bottom 20% for both actual and predicted sign-up rates. Surprisingly-low-sign-up schools are in the bottom 20% for actual sign-up rate and in the top 20% for predicted sign-up rate. Typical schools are in the middle quintile for both actual and predicted sign-up rate. Surprisingly-high-sign-up schools are in the top 20% for actual sign-up rate and in the bottom 20% for predicted sign-up rate. Predictably-high-sign-up schools are in the top 20% for both actual and predicted sign-up rates.
Analysis of principal and guidance counselor interviews proceeded in three steps. First, the research team developed the infrastructure of a database corresponding to the interview protocols, with items organized around the research questions and key themes that emerged from the regional officer interviews. Second, a trained analyst coded interview notes as they were generated, entering information into the database with a senior adviser conducting periodic checks for quality and consistency of the data. Finally, researchers extracted and analyzed data across cases on the key questions and themes. Analytic themes that emerged from these interviews are discussed in detail in the Results section and the Discussion and Conclusion section.
Results
Findings for Research Question 1: What Student and Middle School Characteristics Are Associated With Signing the CBS Pledge?
Table 4 reports three model specifications for the likelihood of students signing the pledge. Column (1) of Table 4 presents raw (not regression-adjusted) differences in sign-up rates for each student characteristic, column (2) shows the school fixed-effects specification (Equation 1a), and column (3) shows the specification with school characteristics (Equation 1b). Although there are some differences in the estimated coefficients between the models that do not condition on other characteristics (column [1]) and those that do (columns [2] and [3]), there is a fairly consistent pattern of the coefficients decreasing in magnitude but maintaining their direction and significance with the addition of statistical controls. Those coefficients that do change substantially—such as taking a modified version of the WASL and attending public school part-time—are for smaller student subgroups.
Marginal Effects of Student and School Characteristics on Signing the Pledge

Note. Standard errors are in parentheses. WASL scores are based on sixth-grade administration for postpolicy cohorts and seventh grade for prepolicy cohorts. “Raw differences” are computed by an ordinary least squares regression of the outcome on the student characteristic (with no other controls). All models have standard errors clustered at the middle school level. Results for taking a modified version of the WASL, taking an out-of-grade-level test, age in eighth grade, being homeless, speaking a language other than English at home, attending public school part-time, and middle school eighth-grade enrollment are available upon request. WASL = Washington Assessment of Student Learning; FRPL = free or reduced-price lunch.
p ≤ .10. **p ≤ .05. ***p ≤ .01 (two tailed).
Some of the groups that are traditionally considered to be “advantaged” in terms of educational attainment are more likely to sign the pledge. For example, as shown in column (1), we find that females, Asian Americans, and students categorized as gifted (“highly capable” in the state’s terms) are 7.3, 9.8, and 12.9 percentage points more likely to sign up, respectively, than males, non-Hispanic Whites, and students not categorized as gifted. Similarly, we find that a one-standard-deviation increase in a student’s math or reading test score is associated with a 5-percentage-point increased probability of signing the pledge.
There are, however, some notable exceptions to the pattern of traditionally advantaged groups being most likely to sign up. For instance, as Table 4 shows, we also find that Hispanics, non-Hispanic African Americans, migrants, and transitional bilingual students are more likely to sign the pledge. 25 Similarly, the regional findings are somewhat surprising. As Table 4 shows, students who completed eighth grade in predominantly rural eastern Washington are more likely to sign up than their peers who completed eighth grade in the more urban and suburban Puget Sound region.
Column (2) of Table 4 shows the mean marginal effects corresponding to the parameters estimated in Equation 1a. Similar to column (1), we find that a one-standard-deviation increase in a student’s math test score is associated with a 4.5-percentage-point increase in the probability of signing the pledge, holding constant all other characteristics. Female students are 5.7 percentage points more likely to sign the pledge than otherwise comparable males. Relative to non-Hispanic White students, Hispanics and non-Hispanic African Americans, Asians, and multiracial youth are more likely to sign up, whereas Native American or Alaskan Native youth are less likely to sign the pledge. Net of these student characteristics, the middle school attended clearly affects the propensity to sign up; the null hypothesis that the addition of the school fixed effects is jointly zero is easily rejected (the F statistic is 17).
In column (3) of Table 4, we present the results including middle school characteristics rather than middle school fixed effects, corresponding to Equation 1b. We find higher sign-up likelihoods in schools that have more undergraduates within 50 miles and in schools with more students who are FRPL eligible, controlling for the student’s own characteristics. Interestingly, we find the indicator for a school having a guidance counselor is positive, but not statistically significant. Not surprisingly, the specification with middle school fixed effects (column [2]) has a substantially stronger fit than the model with five school characteristics (column [3]). 26
Findings for Research Question 2: How Closely Do the Characteristics That Predict Sign-Ups Parallel Pre-CBS Program Predictors of College Enrollment?
Table 5 presents a parallel analysis for the college enrollment of the prepolicy cohorts, which allows us to examine the extent to which the factors predicting CBS sign-ups mirror factors predicting college enrollment prior to the program’s introduction. Similar to what we found for predicting CBS sign-ups, we observe a general pattern of decreasing magnitude of the coefficients from the model that is not conditioned (column [1]) to those with either middle school fixed effects or characteristics (columns [2] and [3], respectively), with little difference between the latter two specifications. In the first column, we find that the disparities among CBS-eligible students mirror those typically found when examining all students (e.g., females, Asian Americans, and gifted students are substantially more likely to enroll in college “on time”). When estimating the logit specifications, we find a remarkable correspondence between the factors associated with signing the pledge and enrolling in college. The correlation between the marginal effects in the second columns of Tables 4 and 5 (i.e., the models with middle school fixed effects) is 0.75, and the correlation between the marginal effects shown in the third columns of Tables 4 and 5 (i.e., the models with middle school characteristics) is 0.69. These significant correlation coefficients clearly support the first hypothesis (see the Conceptual Model/Theory of Action section) that the factors related to the propensity to go to college also predict the likelihood of signing up for the CBS program.
Marginal Effects of Student and School Characteristics on Enrolling in College

Note. Standard errors are in parentheses. WASL scores are based on sixth-grade administration for postpolicy cohorts and seventh grade for prepolicy cohorts. “Raw differences” are computed by an ordinary least squares regression of the outcome on the student characteristic (with no other controls). All models have standard errors clustered at the middle school level. Models are estimated on prepolicy cohorts, and the outcome for enrolling in college considers on-time college enrollment at any college. Results for taking a modified version of the WASL, taking an out-of-grade-level test, age in eighth grade, being homeless, speaking a language other than English at home, attending public school part-time, and middle school eighth-grade enrollment are available upon request. WASL = Washington Assessment of Student Learning; FRPL = free or reduced-price lunch.
p ≤ .10. **p ≤ .05. ***p ≤ .01 (two tailed).
The estimated regression lines based on Equation 3, which models the extent to which the predictions generated from the sign-up models (Equation 2) are predicted by the predictions generated by using the prepolicy college-going regressions combined with the postpolicy student characteristics, are shown in Figure 2. The figure also shows scatterplots of probabilities of pledging and enrolling in college, using a 1 percent random sample of students. Black open circles indicate students in Cohort 1, green solid circles indicate Cohort 2, and red Xs are for Cohort 3. The intercept is highest for Cohort 3, reflecting the general increase in the likelihood of signing the pledge. For all three cohorts, the regression lines have a positive slope indicating that those more likely to enroll in college are more likely to sign the pledge. The predicted probabilities generated by using the prepolicy college-going coefficients are statistically significant predictors of sign-up probabilities, again supporting Hypothesis 1 more formally.

Relationship between probability of enrolling in college and probability of signing the pledge.
Moreover, the estimated regression lines in the figure are approximately parallel, suggesting little change in this underlying relationship, which argues against Hypothesis 2. Specifically, we might expect a change in the relationship between the factors predicting college going and signing up as the CBS program matures and changes college-going expectations (i.e., we should see a change in the relationship across eligible cohorts). To more formally test Hypothesis 2, we estimate a variant of Equation 3 next, which is a linear model that is fully interacted by cohort. In the equation, C2 and C3 are indicators for students in Cohorts 2 and 3.

This model enables us to test linear interactions between cohorts and the predicted probability of a post-policy student enrolling in college based on pre-policy enrollment coefficients,
Findings for Research Question 3: What Do Program Administrators Report Doing to Encourage Student Uptake in the Program?
With respect to school-level sign-up rates, Figure 3 shows the relationship between a school’s actual sign-up rate and its predicted sign-up rate for the 605 schools in Washington state that have program-eligible eighth-grade students. A few things merit note here. First, although the actual and predicted rates are correlated, there is substantial deviation (the raw correlation is .40). This result is consistent with our finding earlier that school fixed effects were significant predictors, controlling for student characteristics. Our qualitative analysis allows us to explore explanations for this variation.
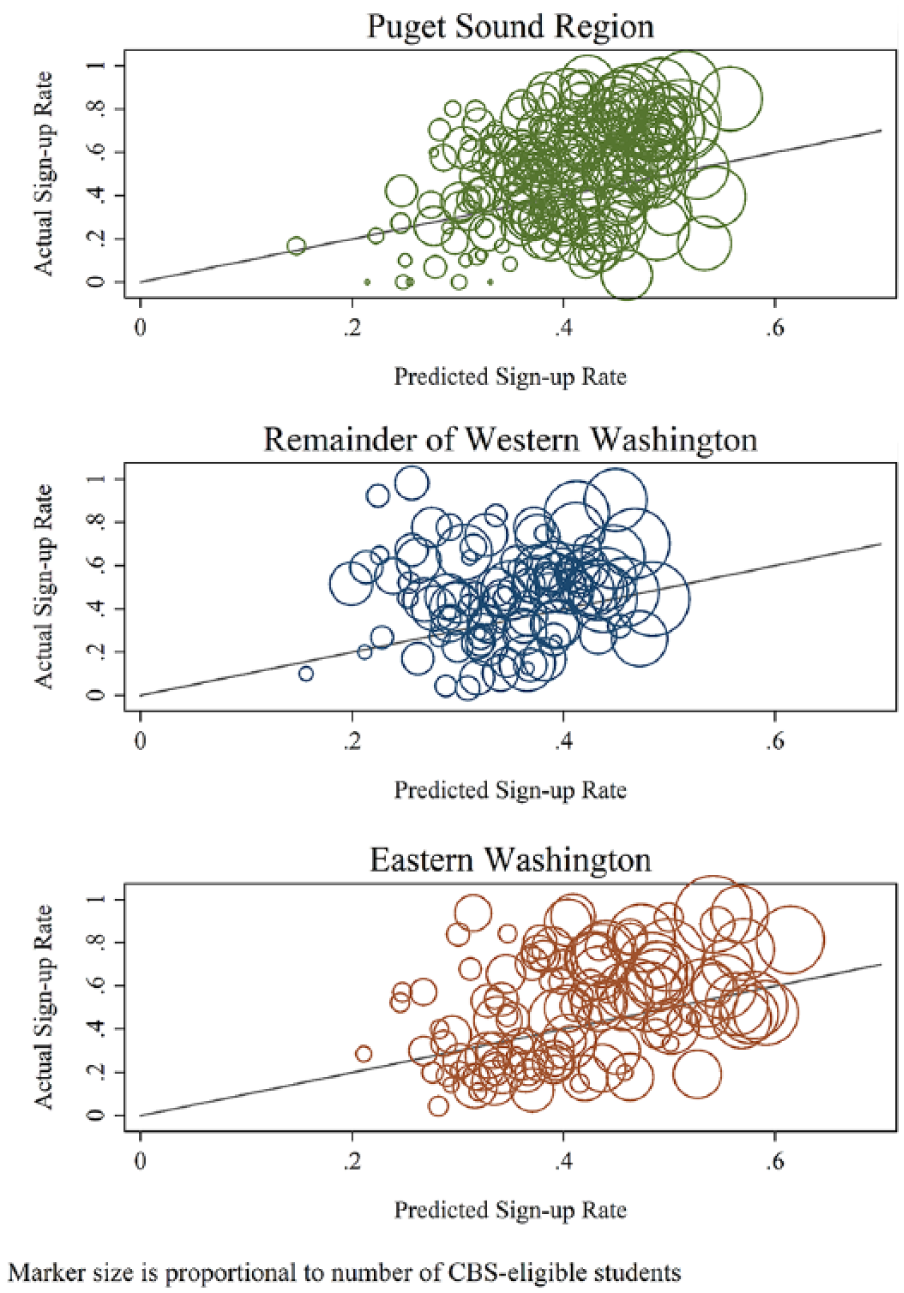
Correspondence of schools’ predicted and actual sign-up rates, by region.
Given the improvement in sign-up rates demonstrated in Figure 2 and the variation among schools in expected versus actual sign-up rates documented in Figure 3, we examine interview data to determine what activities College Bound administrators believe are most important for the program’s success. Regional officers reported that schools’ success in signing up students depends upon (a) district-level “buy-in” and support for the program, coupled with a school-level champion who takes “ownership” of the program; (b) counselors or other school staff having access to FRPL data in order to target individual students who are eligible for the program; (c) guidance counseling staff that are not overburdened with other responsibilities and have good relationships with students; and (d) being in a community or district with a strong college-going culture.
All schools included in the qualitative study reported using the fall FRPL list to identify eligible students, but more than two thirds of guidance counselors interviewed reported using additional means to identify eligible students who were not on the list. Most prominent among these other tactics were sending forms to all students for families to self-identify (40%), giving applications to any new student, and teachers identifying potential students (20% each).
Guidance counselors reported using a variety of approaches to promote the program and encourage sign-ups. The most common activities reported by respondents included individual meetings with students (80%) and parent–teacher conferences (60%); less common were phone calls home (40%), other group approaches (32%), other individual approaches (24%) and classroom approaches (20%); the tactics least commonly reported included schoolwide events (12%) and placing scholarship forms in orientation packets (8%) or FRPL application packets (4%). 27 Considering students at their own schools, a principal and a guidance counselor suggested that those likely to sign the pledge were those who are already “looking beyond high school” and “excited about college.”
Guidance counselors have an interest in signing up as many students as possible to ensure they do not miss any eligible students, and there is no significant consequences associated with signing up ineligible students. It is perhaps not surprising that fully half of the guidance counselors interviewed reported signing students up without checking their eligibility. Respondents at more than a third of schools reported sharing applications with all students. Two additional schools previously sent applications to all families but stopped because of complaints by ineligible families or because they did not want to promote “false hope.” One school asks every student to turn in a form and lets WSAC verify the eligibility, whereas at another school, if a parent asks about scholarships, the school requests that the parent sign the form and sends it to WSAC to verify eligibility. Another school signs up every student who ever qualified for FRPL.
Beyond the work of the counselors themselves, another important component for CBS program success—identified both in the literature and by CBS regional officers—is district support for the program. A third of counselor and principal respondents could identify a district-level “champion,” and almost one fifth reported that their district places accountability requirements on schools’ CBS sign-up performance. Of course, this also shows that two-thirds of respondents did not report district accountability requirements related to CBS sign-ups.
Reflecting on the program’s progress and results, respondents were not in close agreement about what works, but they did largely concur about primary challenges to the CBS program’s success. Among the various strategies to support the program, respondents most often identified one-on-one conversations with parents (42%) or students (35%) as the most effective approach. Other strategies considered most effective by at least one individual included classroom approaches, large incentives, persistence, and having a WSAC guest speaker come to the school. The greatest challenge to encouraging sign-ups, identified by more than half of respondents, was getting signed forms back from students. Other challenges included, for instance, unresponsive parents, parents not understanding eligibility requirements, the amount of time required for follow-up, and the fact that many middle school students are not terribly future oriented, so college going is not at the forefront of their minds. For example, one counselor, who said the availability of the program could “light kids on fire,” echoed others in noting the challenge of promoting college going among middle schoolers who often “have no sense of the future.”
A handful of respondents (13%) stated outright that the program had little to no impact on the culture at their school, but most regional officers considered the CBS program to be a success. Yet they also noted areas where it could be improved. In particular, to improve and maintain high sign-up rates, respondents pointed to two opportunities. First, because district leadership and school champions play such important roles, turnover among these positions is a concern. Regional officers emphasized the need for more systematic approaches, whereby all school faculty and staff have a role to play in encouraging program participation and sign-up rates serve as part of a school’s evaluation and accountability systems. Second, echoing the principals and counselors, there was broad agreement that stakeholders need easier access to better and more timely data to identify eligible students, target them for signing up, and support them as they move toward college enrollment.
Regional officers emphasized that program sign-up is just the first step. They promoted more attention to students’ actual uptake of the scholarship and success in college. Yet, maintaining students’ and families’ awareness of the program and encouraging them to adequately plan and prepare for college present a different set of issues from encouraging program sign-up. Similarly, if the goal of the program is college completion, students will require additional supports to help them enroll and persist in college.
Discussion and Conclusion
Early-commitment pledge programs are fairly new, so it is not surprising that we know relatively little about program effects and almost nothing about students’ decisions to sign up. This is an important gap in the literature given that this type of program can help students only if they choose to participate. In this paper, we provide the first evidence of the factors that predict the likelihood of students signing Washington’s CBS pledge.
We document that while the state has made considerable progress in increasing the number of eligible middle school students signing the pledge, sign-up rates were far below 100% in the early years of the program. This finding conflicts with earlier state reports, suggesting near-universal sign-up rates in many districts, which were based on a snapshot of eligible students rather than all eligible students. The difference between these state reports and the proportion of eligible students that we observe to have signed up may be important, as regional officers and guidance counselors working to encourage both CBS sign-ups and college going might have allocated their efforts differently if they received more accurate information about sign-up rates.
That said, although all schools report using FRPL lists to identify eligible students, more than two thirds of the middle school counselors interviewed also report using additional means of identifying eligible students. This suggests that counselors and other program administrators recognized that the FRPL list does not capture all eligible students; in fact, about a fifth of counselors believed that calculated rates were overestimates of program uptake. When asked about the characteristics of students likely to sign up for the CBS, the most common responses offered by principals and guidance counselors were academic strength, a college orientation or expectations, and engaged parents. 28
The largest process breakdown identified by program administrators (counselors and principals) was the difficulty in getting signed forms back from students. To account for this, counselors often attempted to engage parents directly rather than via the student. The most common approach to engaging parents was via school conferences (70%). Less common approaches include phone calls (44%), letters home (33%), and including scholarship forms in school orientation or FRPL packets (11%). Nevertheless, the most common approach, conferences, suffers from the fact that not all parents attend conferences and that conferences typically cover many topics. In this regard, students represent a linchpin through which information, communications, and program application paperwork flow.
The quantitative findings are largely in line with interview reports about what drives students to sign up for the College Bound program although not without a few exceptions. Regional officers emphasized the importance of school and district leadership, resources, and climate in supporting sign-ups. Specifically, regional officers agreed that schools are the most critical partner in targeting eligible students, where they highlighted the need for a “champion” to take ownership of the program at the school level and take responsibility for its success there. In addition to the school champion, respondents noted the importance of a strong community or school college-going culture, which may be reflected in the positive and significant coefficient for nearby undergraduate enrollment shown in Table 4.
Somewhat surprising is the lack of statistical significance of guidance counselors in predicting sign-ups, as regional officers had pointed to these individuals as critical to the program’s success, regardless of whether they served as the champion. It is worth noting, however, that these respondents did not consider the mere presence of a counselor to be adequate. Rather, they noted that heavy workloads can leave some counselors struggling to prioritize the program. Similarly, they described variability across counselors in their ability to develop meaningful relationships with students, which they viewed as key to encouraging students to sign up. Finally, they felt that counselors’ access to accurate and timely FRPL data was necessary for success but noted that many did not have such access, a problem echoed by the counselors themselves.
Our quantitative findings show a positive correlation between a school’s predicted sign-up rate and the school’s actual sign-up rates, but the correlation, .40, is not overwhelmingly high. This, combined with the fact that schools have lower sign-up rates than were reflected in public reports, suggests it may be beneficial to target resources toward encouraging student sign-ups at schools with surprisingly low sign-up rates. In doing so, we may consider the tactics suggested by program administrators, who agree that individualized approaches are critical for signing up more students and that good data are necessary for such implementation.
Consistent with our first hypothesis and the qualitative findings about having a “college orientation,” the individual student characteristics that are associated with signing the pledge are closely aligned with the characteristics that predict whether low-income students matriculate to 4-year colleges. High-achieving eligible students, for instance, are both more likely to sign the pledge and more likely to go to college.
In contrast to our second hypothesis, the relationship between the factors predicting college enrollment and signing the pledge did not appreciably change over the first three cohorts of program administration. Significantly more students are signing up for the CBS program over time, but the fact that the underlying relationship between the factors predicting enrollment and pledge signing are similar for the early eligible cohorts calls into question whether the pledge program is changing college expectations significantly for those students with a predictably low propensity to go to college.
The fact that sign-ups are not near to universal is actually somewhat surprising given the low cost to sign up and potentially high financial reward for doing so. One possibility is that the school outreach is too narrowly targeted to students. Middle school students unquestionably play a central role in the sign-up decision. However, given that program administrators identified getting signed forms back from students as the largest process breakdown and that parents/families clearly play a role in shaping students’ college expectations (Kirk, Lewis-Moss, Nilsen, & Colvin, 2011), focusing on family dynamics may prove fruitful. And although some guidance counselors report targeting parents/guardians, this is not an explicit part of the CBS program; encouraging a parent/family outreach component to the program could be considered as a means to reach those students who are least likely now to go to college.
That said, we believe it is premature to jump to strong conclusions about the efficacy of early-commitment programs relative to other approaches to increase college access, given that the ultimate test of the success of the program is whether it is encouraging disadvantaged students to enroll and graduate from college. This is the subject of ongoing work.
Supplemental Material
DS_10.1177_2332858419857703 – Supplemental material for Sign Me Up:: The Factors Predicting Students’ Enrollment in an Early-Commitment Scholarship Program
Supplemental material, DS_10.1177_2332858419857703 for Sign Me Up:: The Factors Predicting Students’ Enrollment in an Early-Commitment Scholarship Program by Dan Goldhaber, Mark C. Long, Ann E. Person, Jordan Rooklyn and Trevor Gratz in AERA Open
Footnotes
Acknowledgements
Generous financial support for this project was provided by the U.S. Department of Education (Grant R305A140380). Excellent research assistance was provided by Nick Huntington-Klein and Bingjie Chen. We thank Vivien Chen for and Alex Johann for help with data questions and structure, and Li Feng, Teresa Greene, Rachelle Sharpe, Lexi Shankster, and audience members at the Association for Education Finance and Policy 2016 conference for helpful comments on an earlier draft of this paper.
Notes
Authors
DAN GOLDHABER is the director of the Center for Analysis of Longitudinal Data in Education Research at the American Institutes for Research and the director of the Center for Education Data and Research at the University of Washington. His work focuses on issues of educational productivity and reform at the K–12 level; the broad array of human capital policies that influence the composition, distribution, and quality of teachers in the workforce; and connections between students’ K–12 experiences and postsecondary outcomes.
MARK C. LONG is the Evans School’s associate dean for faculty affairs and a professor of public policy and governance and adjunct professor of economics. His research examines the effects of public policies on economic opportunity and efficient social mobility, with emphasis on estimating the benefits and costs of those policies. His education-related research focuses on (a) the effects of high school course taking and school and college quality on test scores, educational attainment, labor market outcomes, and family formation and other behaviors; (b) the effects of college financial aid on college entry and household savings; (c) gender disparities in educational attainment; and (d) the effects of affirmative action and alternative college admissions policies on college entry.
ANN E. PERSON works at Mathematica as the director for the Center for Improving Research Evidence and serves as a project director for an evaluation of a grant to a three-state consortium of community colleges under the U.S. Department of Labor’s Trade Adjustment Assistance Community College and Career Training grant program. Her research interests include postsecondary education, employment training programs, college and career readiness, employment, and disability studies.
JORDAN ROOKLYN is affiliated with the Center for Education Data and Research as well as the Evan’s School of Public Policy at the University of Washington. Her research interests include program evaluation, financial aid, college readiness, the value of a statistical life, and regression discontinuity design.
TREVOR GRATZ works at the Center for Education Data and Research at the University of Washington. His research interests include educational outcomes for students with disabilities, career and technical education, K–12 human capital, college affordability, and college readiness.
References
Supplementary Material
Please find the following supplemental material available below.
For Open Access articles published under a Creative Commons License, all supplemental material carries the same license as the article it is associated with.
For non-Open Access articles published, all supplemental material carries a non-exclusive license, and permission requests for re-use of supplemental material or any part of supplemental material shall be sent directly to the copyright owner as specified in the copyright notice associated with the article.