
Abstract
When students with the capacity to succeed in a 4-year college do not take a college admission test, this represents a potential loss of opportunity for students and colleges alike. However, the costs of testing—both pecuniary and nonpecuniary—may exceed the benefits for students who lack the interest in or qualifications for college attendance. In states like Virginia, access to admission tests varies markedly with district and family circumstances. We estimate that universal testing in Virginia could increase the number of high school graduates with test scores competitive for admission at broad-access universities in the state by as much as 40%—and at the most selective institutions by nearly 20%—with larger increases for low-income students. Alternative policies that encourage testing among students with strong demonstrated academic performance could realize nearly these increases without generating testing costs for students who are unlikely to attend a 4-year college.
Keywords
The state of Virginia provides the laboratory for this study. In Virginia, 56% of high school graduates took the SAT in 2014 while about 71% took the PSAT. 1 There are wide differences among districts in test-taking: Participation in the exams is near universal in some districts, while in other districts, only a minority of students participate. While a number of states have moved to universal testing, states like Virginia leave decisions about student participation in college testing to district policy and parental discretion. Policies differ markedly at the district level, with some districts providing across-the-board access to the preliminary assessment (PSAT) and the college admission test (SAT), while other districts follow student-initiated opt-in for all tests.
At the outset, it is important to acknowledge that standardized tests like the SAT (along with the ACT and PSAT) are incomplete indicators of “college readiness” or whether a student is “well-matched” or “admission-eligible” at a particular college. Certainly, the skills and competencies needed for collegiate success transcend test scores. Nevertheless, test scores do contain information that is predictive of collegiate success. College Board and ACT identify scores that predict grades and successful completion of the first year of college as benchmark quantitative indicators of college readiness (Allen & Radunzel, 2017; College Board, n.d.). In addition, publicly available test score ranges for freshman students at each college can be used to determine whether a prospective student has academic achievement commensurate with that of a typical admitted student at a specific college. 2 Because college admission testing is a necessary gateway for application to many 4-year colleges and a source of information on qualifications for students and colleges, admission testing is an important component of the college application process and a key determinant of collegiate options.
We estimate the distribution of PSAT and SAT scores under alternative test-taking counterfactuals to answer the following questions: What fraction of the students who do not take a college admission test (nontakers) are predicted to be admission-eligible at 4-year colleges and universities of different levels of selectivity? In turn, how are these nontakers distributed by race, geography, and expected socioeconomic status? Finally, are the predictions sufficiently robust to guide the potential targeting of an intervention to increase test-taking?
Several other researchers have examined the impact of the adoption of state-mandated college admission testing on the distribution of scores and college-going (Bulman, 2015; Goodman 2016; Hurwitz, Smith, Niu, & Howell 2015; Hyman 2017; Klasik, 2013). These studies typically find limited but positive impacts of state-mandated testing on college enrollment based on comparisons before and after the adoption. Our approach utilizes a prediction framework: Given that a state (or district) does not mandate college admission testing, how can evidence from other state- or district-wide academic assessments be used to estimate the likely performance of students who do not take college admission tests?
We continue with a brief overview of college admission test-taking policies nationwide. The second section discusses the data sources and summarizes existing testing norms in Virginia. The third section describes the measurement challenge and our estimation approach. The fourth section presents the observed and estimated test score distributions for takers and nontakers, respectively. The fifth section examines how the representation of test-takers, particularly those likely to score at levels consistent with application to 4-year colleges of different levels of selectivity, would be expected to change under alternative policy counterfactuals that focus efforts to increase test-taking on subgroups of students and high schools. The final section concludes by discussing the potential application of this analysis to policy actions at the state and high school levels, along with the limitations of the analysis and open questions for future research.
A central result of this analysis is that in states like Virginia, missed college admission tests produce a substantial reduction in the pool of students positioned to apply to 4-year postsecondary institutions. We estimate that universal testing in Virginia could increase the number of high school graduates with test scores competitive for admission at broad-access universities in the state by as much as 40%—and at the most selective institutions by nearly 20%—with larger increases for low-income students. We also show that policies that generate test-taking among students who have demonstrated high levels of academic achievement in earlier grades could be nearly as effective as universal testing at increasing testing among students who are likely to succeed in 4-year college. Whether these increases would be realized depends on individual and school behavior. We also emphasize that while participation in college admission test-taking is a necessary step in the application process for many colleges, not all tested students with academic performance indicative of college success will complete the application and enrollment process.
College Admission Tests in the Context of State and Local Testing Policies
College Admission Tests
Beyond the basic measurement and assessment purpose of college admission tests in admission decisions, the tests serve a potentially important informational function for students, parents, school professionals, and colleges. 3 Students use scores to learn about the types of colleges at which admission is feasible and the score improvements needed to achieve aspirational admission outcomes. For high school counselors, testing may provide additional information to improve guidance offered to students and their parents in making postsecondary choices. For colleges and universities, admission testing (and the early-stage counterparts) provides a means to identify and recruit well-matched students (Howell, Hurwitz, & Smith, 2018). Efforts to reach college-ready students from low-income families, underrepresented minority groups, and traditionally underserved areas are enhanced when colleges and universities can contact students directly. Dynarski, Libassi, Michelmore, and Owen (2018) demonstrated how outreach to high-scoring, low-income students in Michigan dramatically increased application and matriculation to the flagship University of Michigan, while Gurantz, Hurwitz, and Smith (2017) showed how the identification of Hispanic students on the PSAT through the College Board’s National Hispanic Recognition Program shifts students from 2-year to 4-year colleges as well as resource-intensive flagship and out-of-state options.
The returns to test-taking depend on the costs and benefits, which likely differ among students. The direct costs of mandated college admission testing are modest on a per student basis—at approximately $50 per student for the SAT and $16 for the PSAT, the fees are each less than 0.05% of per student annual expenditures, on average. 4 But, the indirect costs of school-wide testing may be substantial given lost classroom time and administrative burden. The impact of lost classroom time relative to potential return may differentially impact students who lack academic preparation, while the administrative burden is likely to fall disproportionately on counselors, who may be already overburdened with student service and assessment responsibilities, particularly at schools serving students from low-income backgrounds.
Historically, the SAT and the ACT have been offered about seven times per year with testing generally conducted on Saturday mornings. In recent years, some states and districts have contracted with testing agencies to provide exam administration during the school day. College guidebooks typically advise students to take the SAT (or the ACT) during the junior year of high school, leaving the opportunity in the fall of the senior year to retake the exam if desired. While most institutions will accept either exam, one exam or the other predominates in each state based on historical precedent, which is generally tied to the state flagship institutions. In Virginia, the SAT predominates; thus, the analysis here focuses on the SAT and the associated PSAT. 5
In addition to the SAT and the ACT college admission exams, testing organizations have preliminary exams—the PSAT for College Board and the PreACT for ACT, intended to be taken in either the sophomore or junior years of high school. 6 The PSAT is offered once per year in October, with some schools offering the tests on Wednesday during a regular school day and others offering the test on a Saturday. These first-stage exams are intended to provide diagnostic information to students, their families, and their counselors on how test performance aligns with collegiate options and aspirations. The PSAT also provides an early opportunity for students to opt-in to the Student Search Service, which colleges and universities use to identify and inform students about various opportunities. The PSAT also serves as the qualifying exam for the National Merit Scholarship for junior year test-takers. 7 Virtually every college guide—such as Princeton Review or Peterson’s—advises potential college students to take the PSAT (or the ACT counterpart); yet, test-taking is far from universal. 8
State-Level Test-Taking Mandates
Over the course of the past 15 years, a number of states have entered agreements with the test providers to offer either the ACT or the SAT to all students in the state. By the spring of 2017, 25 states required students to take either the SAT or the ACT, with 12 of these states using the college admission exams to satisfy federal accountability guidelines (Gewertz, 2018). Many of these mandatory testing policies have been implemented within the past five years. That said, Colorado (2001) and Illinois (2001) have more than 15 years of required ACT testing, while Maine (2006, SAT), Michigan (2007, ACT originally, now SAT), and Kentucky (2008, ACT) have more than a decade of experience. This span of implementation experience affords some evidence on the impact of the testing requirements on the number of students taking the test, their scores, and their collegiate outcomes. State-level testing mandates generally encompass three types of changes: broadening the pool of test-takers, shifting the cost of testing from individuals to the state, and shifting the time of the exam from Saturday morning to a school-day administration.
Early studies focused on testing aggregates rather than microlevel student data, which limited the capacity to examine heterogeneity by school or district characteristics. In one of the earliest studies, Klasik (2013) examined the introduction of policies in Illinois, Colorado, and Maine and found evidence that the policies often shifted students from 2-year institutions to 4-year institutions. Goodman (2016) assessed adoption in five states relative to adjacent states, examining inducement into test-taking, test performance, and college-going. In Colorado and Illinois, the mandates induced between one-third and one-half of students to sit for the exams (compliers) while 40% to 45% of new test-takers earned scores sufficient to attend competitive colleges. 9 A particularly striking result is the finding that new test-takers came disproportionately from economically disadvantaged backgrounds, defined in terms of eligibility for free and reduced-price lunch and related social service programs. Hurwitz et al. (2015) followed a similar strategy with the SAT mandate in Maine and found significant enrollment effects, though attributing these effects entirely to the testing shift is complicated by concurrent changes in policies and guidance.
Focusing on the state of Michigan, analysis by Hyman (2017) employed micro data on test-taking before and after statewide ACT testing was introduced in Michigan to estimate the counterfactual or latent scores of pre-policy nontakers using a reweighting methodology (DiNardo, Fortin, & Lemieux, 1996). Hyman showed that there would be a 22.7% increase in the Michigan student population above a college-ready threshold of an ACT score of 20, with these students accounting for 21.3% of the nontaker pool. 10 Hyman found that among poor students scoring college-ready, nearly a third are nontakers. Hyman also estimated the impact of mandatory ACT-taking on postsecondary enrollment in a difference-in-differences framework that compared changes in college attendance between the pre- and post-policy periods among students in schools that were (and were not) the location of ACT test administration in the pre-policy period. While the overall impact of the policy change on 4-year college enrollment is a fairly modest 0.6 percentage points, or 2%, the effect is shown to be larger for poor students, those from the poorest high schools, and students otherwise unlikely to take a college entrance exam in the absence of the policy. Hyman also addressed the concern that those induced by the mandatory testing policy to attend college may not persist through college. While his data do not allow for an accurate measure of the effect of mandatory testing on degree completion, he found that marginal students persisted through the fourth year of college at approximately the same rate as their inframarginal peers.
While state-level testing policies have received the most attention in the research literature, changes in the supply of testing centers (generated in part by decisions made by College Board and ACT) and district-level policies also affect who takes college admission tests. Districts may choose to offer either the PSAT or the SAT free of charge during the regular school day under arrangements that provide bulk registrations, with the expectation that all students will take the exams unless they explicitly opt out. Bulman (2015) showed that while district-wide testing policies have a large effect on test-taking, enrollment and persistence among students induced to take the SAT through district-wide policies is much more modest. Bulman found that SAT test-taking is sensitive to the opening of new testing locations and the subset of students induced to take the test by the opening of a more proximate testing location have substantial gains in enrollment and persistence.
Data and Descriptive Characteristics for Virginia
Our data on college admission test-taking come from the Virginia Longitudinal Data System (VLDS) and include a complete census of student-level records for public high school students in the state. The VLDS represents a partnership among several state agencies in Virginia that allows analysis of data linked across the participating agencies. The Virginia Department of Education and the State Council of Higher Education for Virginia provide the data we use here, in association with College Board records on test-taking. While students may take the SAT more than once, our data record whether the test was completed and the most recent score. For the PSAT, we have multiple administrations and take the highest score within each section. In addition to the VLDS data, we use statistics on district-level population, median income, and educational attainment from the U.S. Census Bureau.
There is no statewide program for college admission testing in Virginia. For the 2014 graduating cohort, Virginia had the 10th highest SAT testing participation rate among the 35 states that had no mandatory testing policy (for either the SAT or ACT). Overall, Virginia is a national leader in college education, ranking seventh in the country in bachelor’s degree attainment among residents (U.S. Census Bureau, 2014). However, college-going varies widely by school district, with attendance at any 2- or 4-year college among high school graduates ranging from 44% to 89% of high school seniors, while attendance at 4-year public institutions varies from 5% to 55% (Cook, Romero, & Turner, 2017).
Of the students in the 2014 high school graduating cohort, 48.9% took both the PSAT and the SAT, 7.1% took only the SAT, 22.1% took only the PSAT, and 21.9% took neither. In the case of Virginia, there is considerable heterogeneity among schools, with the 5th percentile PSAT-taking equal to 17% (J. I. Burton High in Norton) and the 95th percentile equal to 94% (Dominion High in Loudoun County). There is some district-level provision of the PSAT test (Johnson, 2018), with PSAT-taking varying from near universal in those districts providing access in multiple grades to levels often below 50% in districts where registration is student-initiated. As shown in Figure 1, the distribution of PSAT-taking has a bimodal character that reflects the observation that some districts follow opt-out policies and others follow opt-in policies. In the former case, districts typically pay the cost of testing, while in the latter case, students are expected to pay, with some waivers available for those with financial hardship. The SAT reflects more student selection into test-taking, with a mean participation rate of 50% and a unimodal distribution of participation.
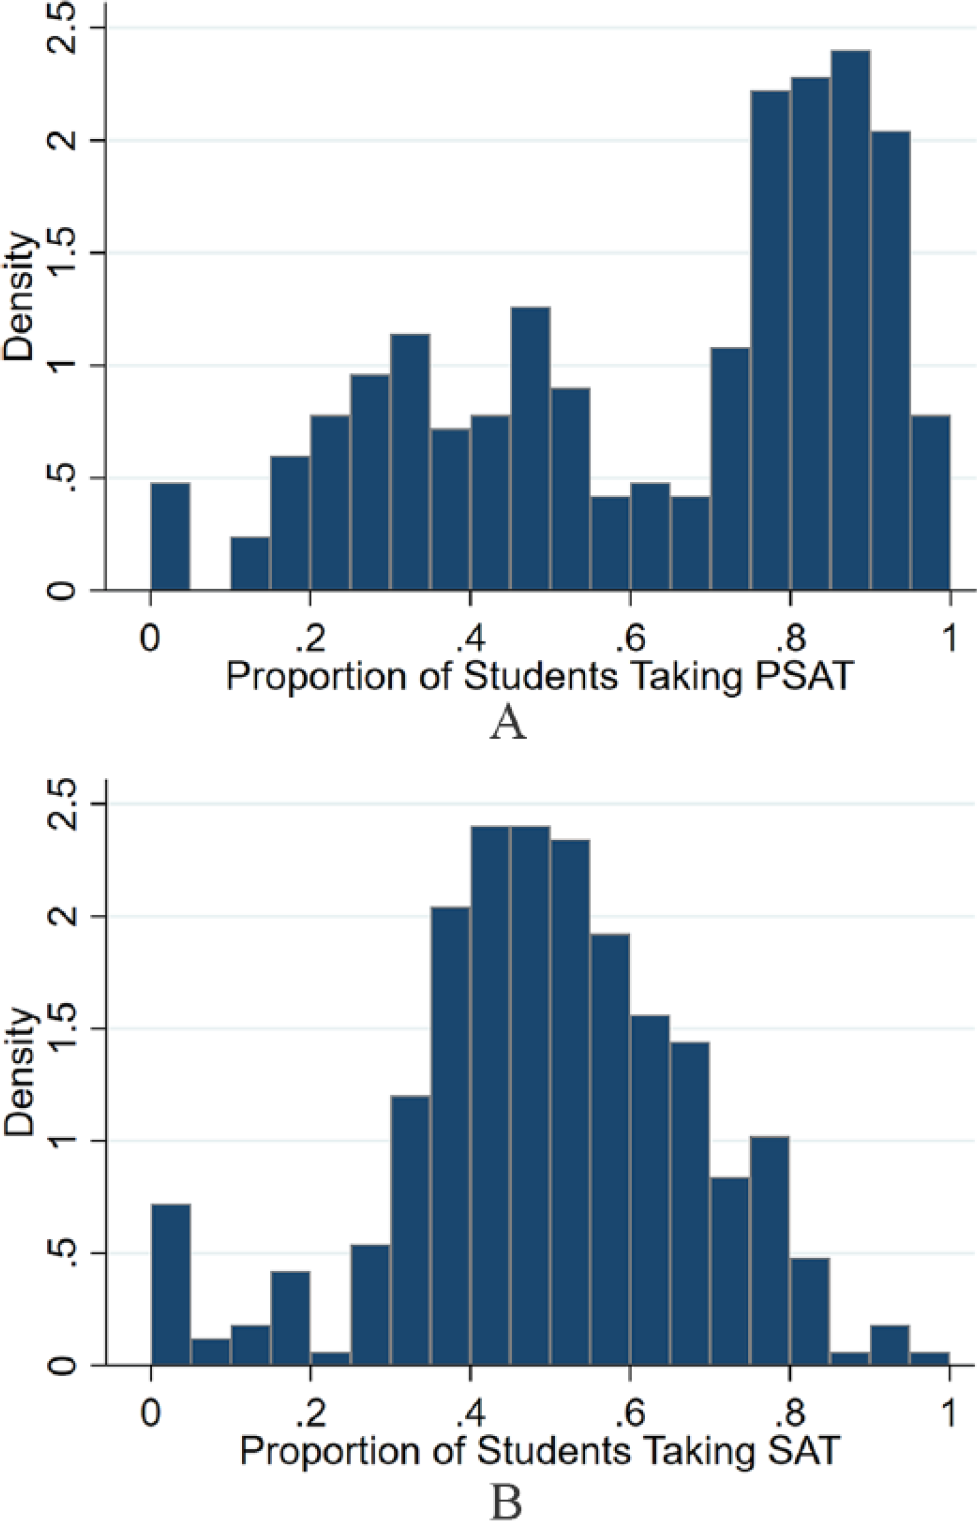
Test-taking rates by high school in Virginia. (A) PSAT takers. (B) SAT takers.
Small high schools and those in rural areas tend to have the lowest test-taking rates on both the PSAT and SAT. Using district as the level of geographic aggregation, Figure 2 shows that rates of test-taking are generally lowest in the southwestern part of the state. These counties historically had agriculture, mining, or manufacturing at the center of their local economies. Higher testing rates are found in urban and suburban northern Virginia, some areas surrounding Richmond and Virginia Beach, and a few other isolated counties.

Distribution of test-taking by district. (A) PSAT. (B) SAT.
The geographic variation in test-taking is particularly apparent for the PSAT. Districts surrounding major metropolitan areas (i.e., northern Virginia, the Richmond area, and Virginia Beach) and university towns typically have policies that provide for universal participation with bulk registration. Some of these districts administer tests in the 9th, 10th, and 11th grades, while others limit opt-out policies to either the 10th grade or the 11th grade. As an example, in 2014, the Loudoun County district offered the PSAT to 9th, 10th, and 11th graders while the Henrico County district provided the PSAT in only the 10th grade.
Table 1 distinguishes districts by above and below median test-taking and presents district-level means of student and district characteristics. Districts with low test-taking have lower levels of population density, family income, and collegiate attainment, with the differences in family income and collegiate attainment wider for the SAT than the PSAT. Districts (and schools within those districts) also tend to be smaller when test-taking is low. Districts with low test-taking tend to have a greater share of economically disadvantaged students as indicated by eligibility for free and reduced-price lunch, TANF, or Medicaid or homeless or migrant status (39% vs. 35% for the PSAT and 42% vs. 32% for the SAT), although the difference is not statistically significant for the PSAT.
District, School, and Student Characteristics by Test-Taking Rates in District

Note. Authors’ analysis of Virginia Longitudinal Data System (VLDS) data on students in the 2014 graduating cohort. Districts are separated into groups with above and below median test-taking rates for the PSAT and SAT. Values are averages across districts within each group. Disadvantaged status includes eligibility for free and reduced-price lunch, TANF, or Medicaid or homeless or migrant status. Asterisks indicate significant differences between districts below and above the 50th percentile:
p < .10. **p < .05. ***p < .01.
Unlike the college admission tests, Virginia’s state accountability assessments—the Standards of Learning Assessments (SOLs)—are required of all students at several grade levels. To ensure comparability in scores across the vast majority of students in the 2014 graduating cohort, we use the eighth-grade SOLs in reading, writing, and science and the Algebra I exam in this analysis. 11 We have valid scores from the regular SOL tests in all four subjects for nearly 87% of the 2014 high school graduating class. 12 Scores are reported in single-point increments from 0 to 600 for each subject separately, with 400 representing a pass/proficient score and 500 a pass/advanced score; any score less than 400 is a failing score.
Examining how SOL scores differ in high- and low-testing districts, we find a nonsignificant difference in mean SOL scores between districts with high and low rates of PSAT test-taking, though districts with relatively higher SAT-taking evidence slightly higher SOL scores (Table 1). Some differences across the distribution can be seen in Panels A and B in Figure 3, which shows the distribution of test-taking by individual SOL performance (x-axis) and an indicator of whether the district is above or below the median in test-taking rates (broken vs. solid lines). Still, most of the variation in student measured academic performance is within schools, not between schools—the R2 from the regression of student-level SOL scores on school fixed effects is only .14. Adding individual covariates such as race, gender, and disadvantaged status reduces the unexplained variation modestly; the R2 increases to .22.

Distribution of SOL scores by district and student PSAT- and SAT-taking. (A) High-low district PSAT-taking. (B) High-low district SAT-taking. (C) PSAT takers and nontakers. (D) SAT takers and nontakers.
When we focus on individual test-taking behavior in Panels C and D in Figure 3, self-selection in college admission test-taking is plainly evident: Those with higher SOL scores are more likely to take the college entrance exams than those with lower scores, with this difference more evident on the SAT than the PSAT. 13 Yet, there is also evidence of substantial common support in the distribution of SOL scores for takers and nontakers of college admission tests. It is this overlap of distributions that provides the motivation for the estimation of the counterfactual distribution for nontakers.
Imputation Method
In the analysis of the effects of admission testing policies, the measurement challenge is to estimate the distribution of potential scores for nontakers (counterfactual). In particular, our objective is to predict the combined math and verbal (formally, critical reading) score each nontaker would have received had they taken the PSAT and/or SAT. The combined math and verbal scores on the PSAT range from 40 to 160, while scores on the SAT range from 400 to 1600.
Predicting SAT and PSAT scores for nontakers can be seen as a missing data issue, following the framework of Little and Rubin (2002), where the test scores are absent for a subset of the high school population. While there are a number of methods including reweighting, imputation procedures, and model-based approaches for estimating counterfactual distributions, all rely on assumptions about the factors not observed by the researcher generating the missing data, or in this case, absence of a test score.
Studies of the adoption of mandatory testing policies (e.g., Goodman, 2016; Hyman, 2017) use before/after policy variation to recover the counterfactual distribution. In the Michigan case, Hyman (2017) used the method of Dinardo et al. (1996) to reweight the post-policy cohorts of students to address potential changes in the cohort size and composition of students, assuming that factors affecting testing and test performance in the state are stable across the pre– and post–mandatory testing periods. The absence of such policy changes in Virginia and other states precludes such an approach, though rich data on academic achievement in earlier grades combined with demographic information from the VLDS opens opportunities for other approaches to prediction.
Following the approach used in a number of other settings such as income estimation in the Current Population Survey (see e.g., Welniak, 1990), we employ a “hot-deck” imputation procedure where observed test scores are selected to provide values for the missing test scores. Hot-deck methods of imputation are often applied when variation within the data is a key outcome or the tails of a distribution are of interest. In our setting, an objective is to understand how thick the upper tails of the predicted SAT and PSAT distributions are so that we can understand how many nontakers are likely to be eligible for college admission. The lower tails of the distribution also provide information for policy as these students may face the greatest opportunity cost of testing. While regression imputation—using covariates from complete records to predict the missing data from the incomplete records—is a common approach to predicting values for missing cases, imputation from such a regression is the conditional mean, which understates variation in the missing data. 14
To implement the hot-deck approach, we employ the approximate Bayesian bootstrap procedure of Rubin and Schenker (1986), described briefly here and in more detail in the Technical Appendix. First, we group students into strata by observed characteristics that predict test scores. Then we implement the following sampling procedure for each test (PSAT and SAT) separately. Within each stratum, we create a bootstrap sample of test scores from observed test scores. Then we impute test scores for the nontakers using a random sample with replacement from the bootstrap sample for the same stratum. We conduct this imputation process five times and average the resulting summary statistics across imputations.
The key input is the selection of variables that define the strata. In the baseline specification, we define strata based on a Black/non-Black indicator, an indicator for disadvantaged status, and average SOL scores computed across scores in all four subjects (reading, writing, algebra, and science) and grouped in 25 quantiles. As a specification check, we consider several alternative specifications that vary the stratum definitions by using a different number of score quantiles and dropping the demographic indicators. In two additional specifications, we use PSAT-taking and PSAT scores as predictors for SAT performance. In the first, we define strata by SOL scores in 50 quantiles and an indicator for whether the student took the PSAT. In the second, we define a PSAT grouping variable as PSAT scores in 10-point ranges for takers and single group for nontakers and then take quartiles of SOLs within these ranges.
A key assumption in each of these specifications is that the data are missing at random (MAR)—that is, conditional on the observed prior academic achievement (eighth-grade and Algebra 1 test scores) and the demographics that we use to construct the groups of “similar” test-takers and nontakers, the takers’ and nontakers’ scores are sampled from the same population distribution. 15
We include race and disadvantaged status in our baseline version of the estimation because these two demographic variables are important predictors of college admission test performance, even conditional on SOL performance. One way to see this is to examine how the alignment between the PSAT (or SAT) and the SOL differs by race and disadvantaged status. Table 2 presents these descriptive regressions for PSAT and SAT test-takers. For Black and disadvantaged students, the gradient of the link between the SOL score and the college admission test score is lower than for non-Black and non-disadvantaged students, although the difference in the gradient is muted for the group who is both Black and disadvantaged. Two factors may drive such differences: First, minority group members may be selected into testing differently than their peers, and second, these students may face different high school environments or differential experiences within high school that impact trajectories from eighth grade to college.
Regression of SAT and PSAT Scores on Demographic Characteristics

Note. Authors’ analysis of Virginia Longitudinal Data System (VLDS) data on students in the 2014 graduating cohort. The table shows regressions of observed SAT and PSAT scores on 25 Standards of Learning Assessments (SOL) quantiles, race (Black/non-Black), disadvantaged status, and all of their interactions. SAT scores are scaled in units of 10 points (range, 40–160). Standard errors are in parentheses.
p < .10. **p < .05. ***p < .01.
The limitations of our analysis follow from the possibility that the assumptions imposed in estimation are violated. Naturally, the most significant concern is one of selection into test-taking on factors unobserved by the researcher as we assume that conditional on the factors used in imputation (SOL scores, race, and disadvantaged status), the decision to take a test is not correlated with test performance. Violations of this assumption might arise either because those who take the college admission tests have greater academic ability than nontakers in dimensions not captured by the SOL scores or those who choose to take the tests exert greater effort on the tests than nontakers. In our following analysis, we consider specification tests and alternative imputation strategies to assess these potential challenges. In addition, we emphasize that Garlick and Hyman (2018) assessed the impact of selection into test-taking and found that the availability of measures of prior academic achievement (the SOL scores) dramatically reduce the likely impact of selection.
Estimates of College Admission Test Performance for Nontakers
Baseline Estimates
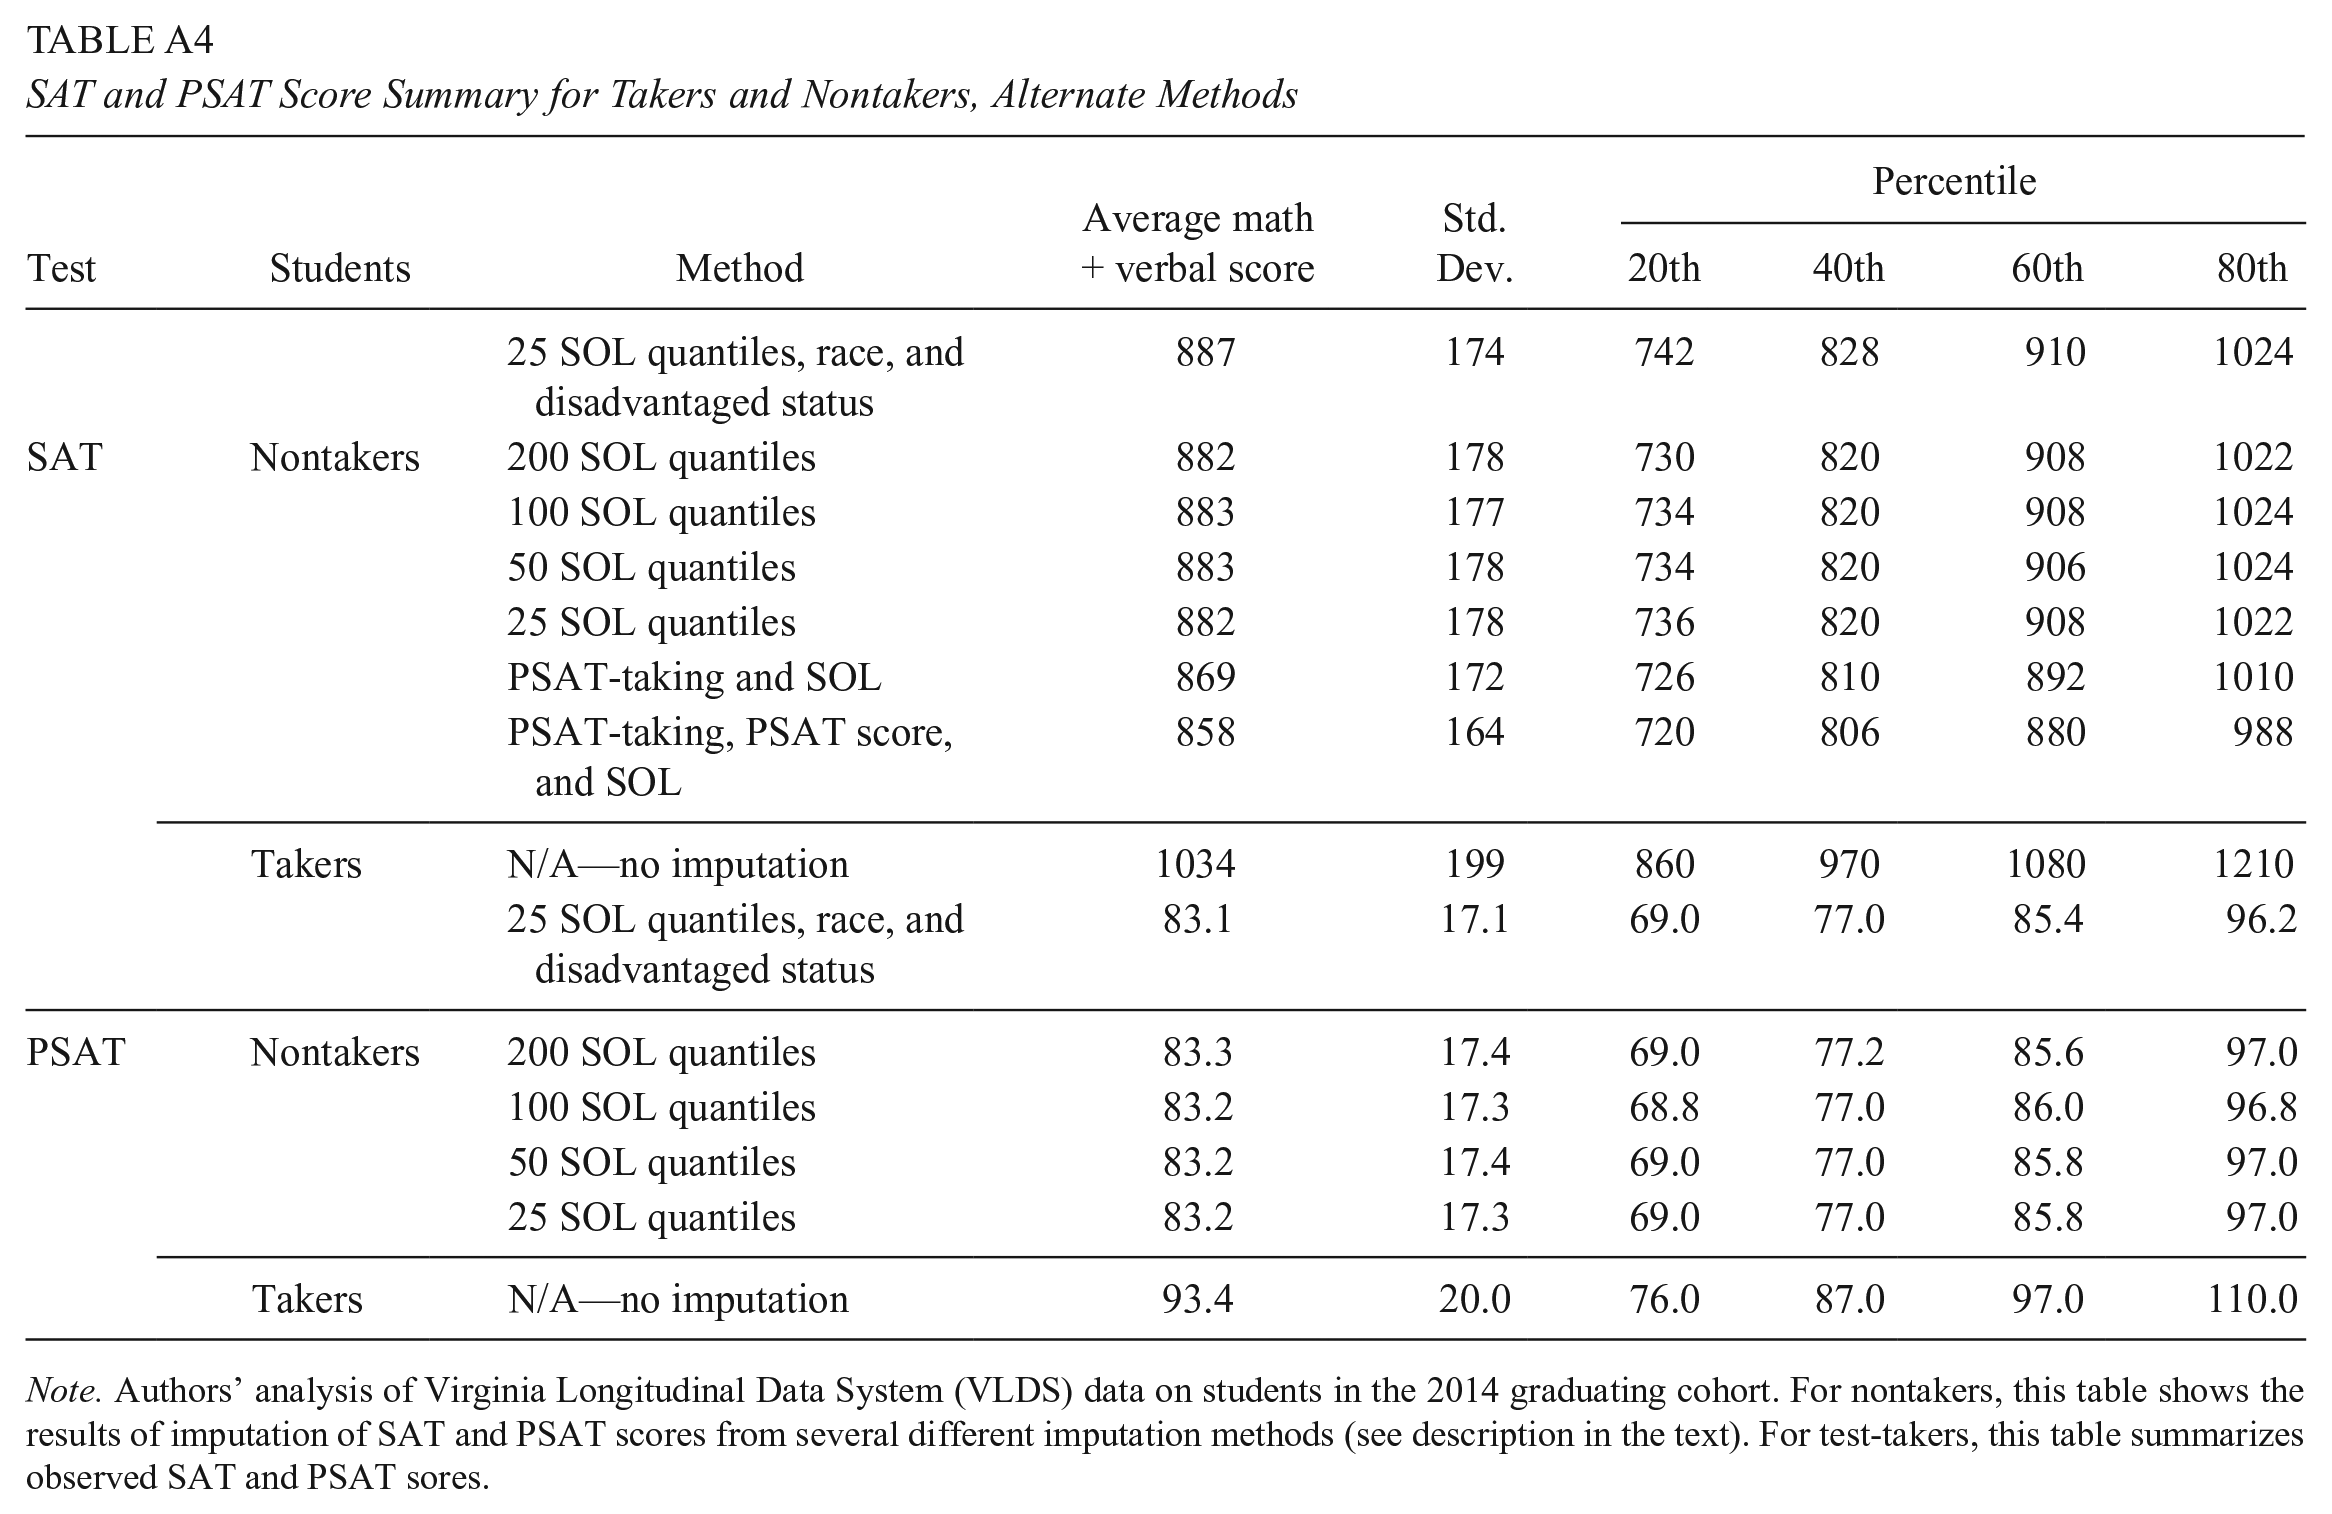
The overall results of the imputation approach are shown in Figure 4, which presents the estimated PSAT (Panel A) and SAT (Panel B) distributions for nontakers along with the observed distribution for test-takers. The means, standard deviations, and 20th, 40th, 60th and 80th percentiles are presented in Table 3, with estimates using alternative imputation criteria shown in Appendix Table A4. The combination of these two distributions reflects the distribution of scores among the potential pool of test-takers. Starting with the PSAT, we see that the score distributions for nontakers and takers have substantial overlap, even as the mean is lower for nontakers than takers (83 and 93, respectively). For the SAT, the difference in the expected mean between nontakers and test takers is greater (887 vs. 1034), reflecting the observation that prior academic achievement is a stronger predictor of taking the SAT than the PSAT. 16

Distribution of PSAT and SAT scores, realized and imputed. (A) PSAT. (B) SAT.
SAT and PSAT Score Summary for Takers and Nontakers

Note. Authors’ analysis of Virginia Longitudinal Data System (VLDS) data on students in the 2014 graduating cohort. For nontakers, this table shows the results of imputation of SAT and PSAT scores from the baseline method where imputation is conducted within 25 SOL quantiles, race (Black/non-Black), and disadvantaged status. For test-takers, this table summarizes observed SAT and PSAT sores.
Although the potentially college-ready may be a small share of nontakers, they would nonetheless constitute a substantial increase in the pool of potential applicants. Figure 5 shows the ratio of nontakers to takers across the test score range using realized scores for test-takers and imputed scores for nontakers. We consider how the inclusion of the missing SAT test-takers would change the potential pool of admission-eligible students by computing the ratio of nontakers to takers at a rough approximation of the admission standards (the sum of the 25th percentile math and 25th percentile verbal scores among enrolled freshmen) at different colleges in the state. Figure 5 (top panel) shows these results following a similar presentation by Hyman (2017) for the state of Michigan. Overall, institutions like Liberty University and Old Dominion University could expect their pool of potential students to increase by over 40%, while the University of Virginia and the College of William & Mary might gain just under 20% in the size of the potential pool of in-state students. These results are strikingly similar to estimates from other states like Michigan. Hyman showed that the ratio of nontakers to takers is about 0.2 at the threshold for the most selective institutions in Michigan, which is a 25 on the ACT (equivalent to 1200–1230 on the SAT).

Proportion of SAT nontakers at approximate admissions criteria. (A) All students. (B) By demographic group.
Demographic Differences in Testing and Predicted Scores
Given estimates of expected college admission test scores for nontakers, are there particular students who are likely to be underrepresented among test-takers based on geography or demographics? One way to characterize the demographic differences is to measure the ratio of nontakers to takers for broad demographic groups for different levels of expected test performance, as seen in Figure 5, Panel B.
The results differ substantively by disadvantaged status (which includes eligibility for free and reduced-price lunch, TANF, or Medicaid or homeless or migrant status). The most selective universities in the state would be expected to see a nearly 40% increase in the pool of economically disadvantaged, non-Black, admission-eligible students under universal testing, while the less selective 4-year universities may see a 110% increase in this pool of students. For economically disadvantaged Black students, the potential increase in the pool of test-takers is slightly greater than that observed for nondisadvantaged students from all races. Students not classified as disadvantaged have comparable outcomes across race; as seen in the figure, the two lines nearly overlap across most of the test score range. The admission-eligible pool of nondisadvantaged students—both Black and non-Black—would increase by nearly 40% at less selective institutions and about 20% at the most selective institutions.
Reflecting the geographic differences in test-taking evident in Figure 2, a substantial proportion of nontakers with high predicted scores are dispersed among the relatively small districts. While 72% of takers who score 1000 or greater and 77% of takers who score 1200 or greater on the SAT are in the 15 largest districts (districts with graduating classes larger than 1,000 students), a lower proportion of students predicted to be high-scoring among nontakers comes from these districts (54% of nontakers predicted to score 1000 or greater and 59% of nontakers predicted to score 1200 or greater). In other words, nontakers with high predicted scores are more likely than takers with high realized scores to reside in small or midsized districts.
Forecasting Precision and Specification Checks
A key question about this analysis concerns the precision of the estimates of the expected test performance of nontakers. The precision of the estimates impacts the overall evaluation of different policy approaches as well as the type of guidance that may be potentially useful to students, their counselors, and their families about the results they may expect from taking college entrance examinations.
In Figure 6, we present the mean scores and confidence intervals for forecasting individual SAT performance based on their average SOL performance, race, and disadvantaged status. For any level of SOL test performance, confidence intervals (95%) around predicted SAT scores are fairly wide, averaging about 430 points. Students below the 20th percentile on the SOL in any demographic group are highly unlikely to score above 1000, as the 95% confidence interval for these students has an upper bound near or below 1000. Similarly, students below the 40th percentile on the SOL are unlikely to score above 1100 on the SAT, although the confidence intervals on the SAT prediction include scores that would permit admission at a significant range of colleges and universities. While SOLs and basic demographics do not precisely forecast an individual’s potential SAT performance, these estimates demonstrate that there is some useful information to be gained from the SOL scores that may help shape individual recommendations about admission testing.
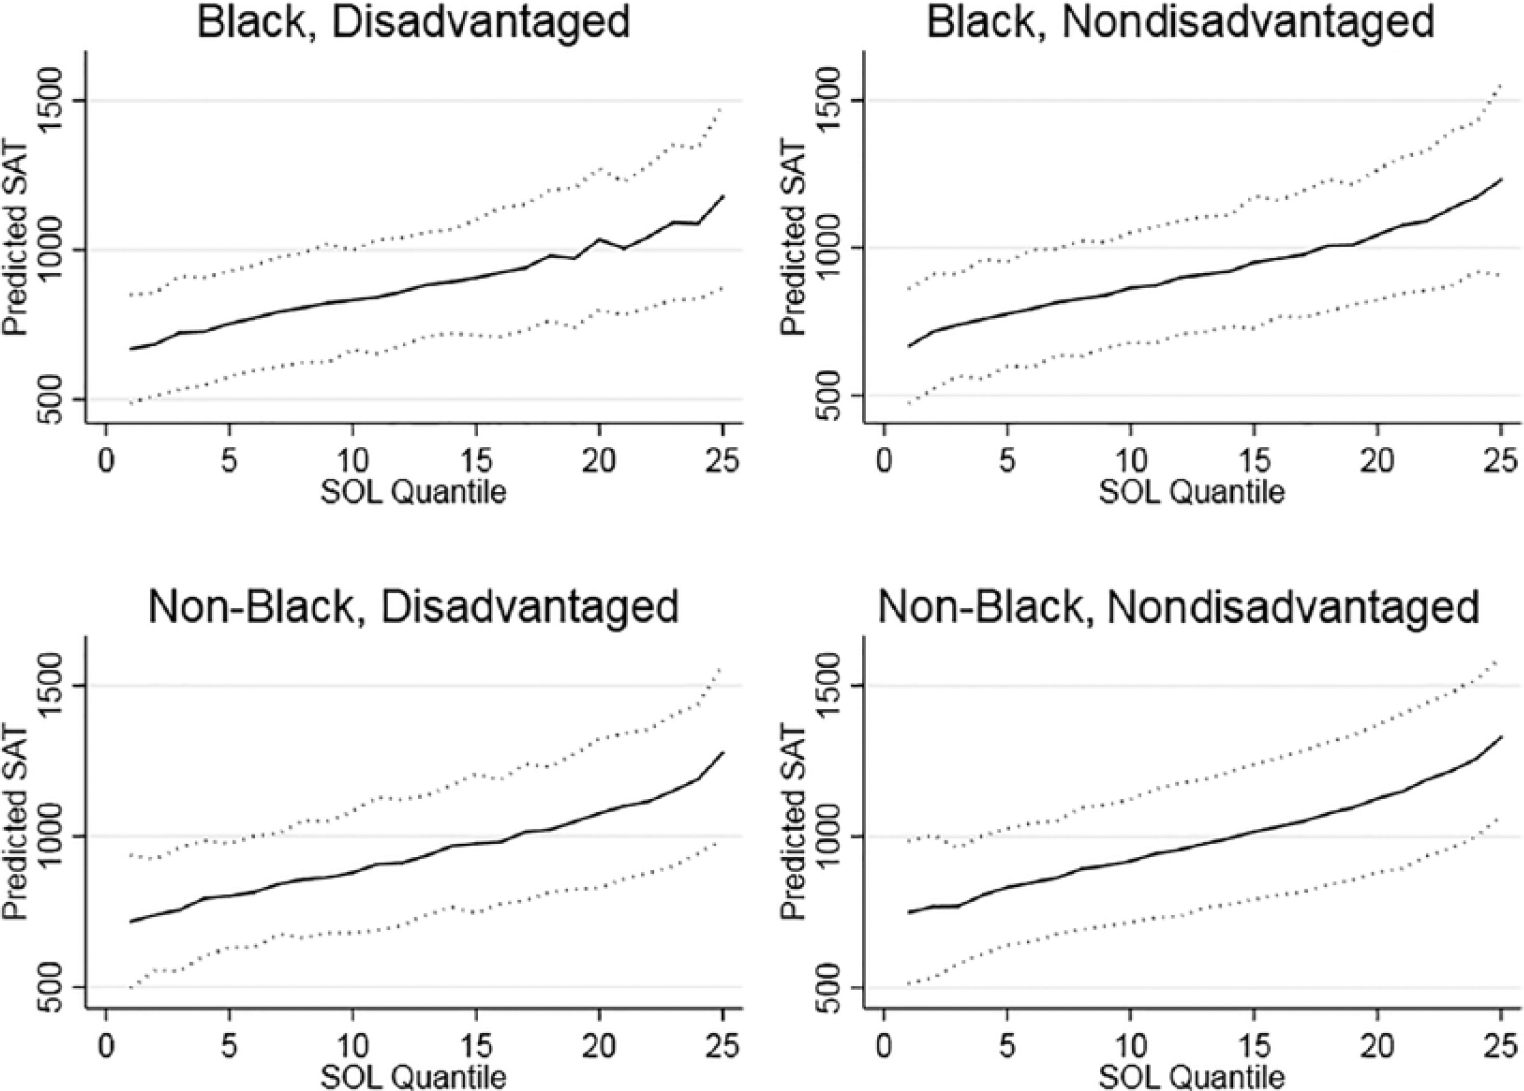
Mean and confidence intervals of forecasted SATs, by SOL quantile, race, and disadvantaged status.
As a specification check, we make use of alternative college entrance testing in the form of the ACT. In our sample, 1,825 students took the ACT and not the SAT. These students’ scores are not used in our estimation, so we consider whether the estimation on SAT scores alone predicts the ACT performance of these students well. We convert the ACT scores to the SAT scale using a concordance available from the ACT and College Board and compare to the confidence interval bounds presented in Figure 6. We find that 89% of the ACT results lie within the confidence interval. A graphical illustration is found in Appendix Figure A1.
The approximate Bayesian bootstrap procedure used in this analysis is one of a number of imputation-based and model-based strategies to address problems of missing data (for a detailed discussion, see Little & Rubin). In a paper focused on the evaluation of alternative sample selection corrections, Garlick and Hyman (2018) pursued a complementary alternative approach to predict the population distribution of scores in a context such as ours, where individual demographics and test-taking outcomes are available. They used multiple models of selection bias to predict scores given individual covariates. To preserve variation, they imputed from the observed distribution of residuals. They compared outcomes of these prediction exercises to the known post-policy distribution in Michigan and found that the richness of the data has a greater impact on the accuracy of these prediction exercises than the econometric model of selection. In fact, standard ordinary least squares (OLS) with a rich set of predictors (including prior achievement) did very well. Our approach is similar in that variation is maintained through imputation and prior achievement and demographics are used as predictors. Their findings lend support to our use of imputation without a selection-correction model as our test score and demographic data control for important sources of selection.
We imitated the OLS model and residual-imputation procedure used by Garlick and Hyman (2018) and found substantively similar results whether we used test scores alone as predictors or test scores along with individual-, school-, and district-level demographics. The results are substantively similar to those obtained with our hot-decking method. The procedure and comparison to our baseline methods are described in the Technical Appendix.
Test-Taking Under Counterfactual Testing Policies
In states that do not currently have a statewide college admission testing policy, it is conceivable that either district- or state-level policymakers may consider implementing universal testing in the future. To guide these decisions, we examine how the population of test-takers might change under four types of testing policies: (a) a statewide universal testing policy, (b) universal testing implemented in all districts that had observed test-taking less than a threshold (either 50% or 60%), (c) universal testing in districts with a high (above-median) proportion of disadvantaged students, and (d) a statewide policy targeted to students with a minimum SOL percentile—specifically, the 80th, 60th, and 40th percentiles. Table 4, Panel A shows the number of PSAT test-takers and nontakers covered under each counterfactual policy along with the number who are observed (or predicted) to score above 100 or above 120. Table 5, Panel A shows the same for the SAT. Panel B in each table shows the same statistics for the population of disadvantaged students.
PSAT Takers and Nontakers by Score Under Counterfactual Mandate Rules


Note. Authors’ analysis of Virginia Longitudinal Data System (VLDS) data on students in the 2014 graduating cohort. The table shows the number of students in the 2014 graduating cohort who have observed (takers) or predicted (nontakers) PSAT scores greater than or equal to the score listed on the column and would be covered by a policy mandating testing among the population listed on the rows. Predicted scores are from the baseline method where imputation is conducted within 25 SOL quantiles, race, and disadvantaged status. The total number of students in the data for 2014 is 74,885 students. There are 60 districts with PSAT test participation less than or equal to 50% and 68 districts with PSAT test participation less than or equal to 60%.
SAT Takers and Nontakers by Score Under Counterfactual Mandate Rules


Note. Authors’ analysis of Virginia Longitudinal Data System (VLDS) data on students in the 2014 graduating cohort. The table shows the number of students in the 2014 graduating cohort who have observed (takers) or predicted (nontakers) SAT scores greater than or equal to the score listed on the column and would be covered by a policy mandating testing among the population listed on the rows. Predicted scores are from the baseline method where imputation is conducted within 25 SOL quantiles, race, and disadvantaged status. The total number of students in the data for 2014 is 74,885 students. There are 75 districts with SAT test participation less than or equal to 50% and 113 districts with SAT test participation less than or equal to 60%.
We find that in 2014, a universal testing mandate in Virginia would induce 21,656 students to take the PSAT exam with an estimated 3,463 additional students scoring 100 or greater on the PSAT. While this represents an 18% increase in the number of students with scores of 100 or greater, more than 18,000 induced test-takers would score below this level. For the SAT, a universal testing mandate would have an even greater effect on total test-taking, inducing an additional 32,900 students to take the test. Of these, 24% are predicted to score at or above 1000.
Student-level policies that encourage testing for students based on prior demonstrated academic achievement would be effective at reaching students who are likely to achieve a high score on the SAT or PSAT without incurring costs of testing for all students. Had all students in the state who scored at or above the 40th percentile on the SOLs taken the PSAT, we estimate that there would have been an additional 3,316 students with scores or 100 or greater, which is 96% of the 3,463 additional scores of 100 or greater that might have been achieved under a statewide universal testing policy. This predicted outcome would follow with 9,937 rather than 21,656 new test-takers. For the SAT exam, about 89% of the nontakers expected to score 1000 or greater would be captured by a policy targeting students with SOL performance at or above the 40th percentile.
District-wide test-taking in districts that have low baseline test participation could be considered as an alternative way to induce testing among nontakers predicted to score 1000 or greater on the SAT (or 100 or greater on the PSAT). Recall from Table 1 that districts with below-median test participation have lower population density, relatively low income, and low parental education relative to districts with higher test participation. In Tables 4 and 5, we see that universal testing in districts with less than or equal to 60% test-taking would have produced an estimated 2,103 additional students with PSAT scores of 100 or greater (a 77% increase) and an additional 5,226 students with SAT scores of 1000 or greater (a 54% increase). The policy would draw in 61% of all nontakers in the state who are likely to score 100 or greater on the PSAT and 65% of all nontakers in the state who are likely to score 1000 or greater on the SAT.
A different policy approach would be to focus effort on those districts with a relatively high concentration of students from low-income families, given demonstrated interest in increasing the representation of low-income students at 4-year colleges and universities. In Panel B of Tables 4 and 5, we compare potential student-centered policies and district-level policies on the predicted change in test-takers among economically disadvantaged students. One result, which follows from other work like Hoxby and Avery (2013), is that many potentially college-ready low-income students are residing outside of the most disadvantaged school districts. For the PSAT, we find that adopting universal testing in all districts with above median concentrations of low-income students would potentially draw in about 43% of the low-income students likely to score 100 or greater and for the SAT, about 39% of the low-income students likely to score 1000 or greater. Policies targeting low test-taking districts or individuals based on SOL scores would attract a greater overall share of the low-income students currently missing from the college admission test-taking pool. For the PSAT, about 67% of low-income students likely to score 100 or greater would be induced into testing by a policy targeting districts with testing rates below 60%, and for the SAT the corresponding number is approximately 78%. A policy that targeted students with SOL performance above the 40th percentile would cover about 95% of disadvantaged nontakers predicted to score 100 or greater on the PSAT and about 88% predicted to score 1000 or greater on the SAT.
Conclusions and Further Considerations
Analysis of PSAT and SAT test-taking outcomes in the state of Virginia, which does not have a statewide mandatory testing policy, shows that the pool of potential 4-year college applicants is markedly lower than it would be if a broader group of students were to take the college admission tests. Using state assessments to predict scores for students who did not take the SAT, we estimate that universal testing in Virginia could increase the number of high school graduates with test scores competitive for admission at broad-access universities in the state by as much as 40%—and at the most selective institutions by nearly 20%—with larger increases for low-income students. Our estimates show that those students missing college admission tests in Virginia who are likely to be college-ready are disproportionately economically disadvantaged and often attend high school in relatively small districts in more rural parts of the state.
Differences in college admission test-taking by family circumstances may ultimately contribute to inequality in college application, college-going, and long-term economic outcomes. The link between admission test-taking and college-going outcomes is clear in the VLDS data. In Figure 7, we show college-going rates (total and 4-year) by testing status and test score for both the PSAT and the SAT. As one would expect, college-going rises markedly with test scores. And given the structure of the data available, it is entirely possible for students to be among the nontakers of the PSAT or SAT yet still attend a 4-year institution either by attending a test-optional institution or taking the ACT. Yet, two empirical findings are evident: First, nontakers are less likely to attend any college (by about 20 percentage points at the high end of the score range), and second, nontakers attended 2-year colleges at far greater rates than test-takers. For students scoring (or predicted to score) above 1200 on the SAT, the difference in college choice is particularly marked: Nearly 85% of test-takers in this range attended a 4-year college, and 52% attended a college where peer students had similar test scores (defined in terms of the college’s 25th percentile scores), while only 21% of nontakers with predicted scores in this range attended a 4-year college, and 10% attended a college in which peers had similar achievement.

College outcomes by test-taking and realized or imputed score. (A) PSAT. (B) SAT.
A salient question to consider in this discussion is whether the “supply-side” of higher education is sufficiently elastic to accommodate a substantial increase in the pool of students considering application to college. The most selective universities in the state engage in proactive efforts to increase the representation of low-income students, as evidenced by programs like AccessUVa, the William & Mary Promise, and the University of Richmond’s Promise to Virginia. While these selective universities might not increase total capacity in response to an increase in the pool of potential students, one would expect that the representation of low-income students would increase, making the institutions more meritocratic. Other public universities in the state have demonstrated considerable elasticity in enrollment over time, while small private colleges in the state like Sweet Briar would clearly welcome an expansion in the student pool.
Bringing data-driven analysis to the question of how many (and which) students are likely to benefit from universal adoption or alternative testing regimes is an important input to state policy assessment. The empirical approach employed in this article generalizes to other settings as statewide eighth-grade exams have been required for every state beginning with the No Child Left Behind Act, which was signed into law in 2002 (Klein, 2015). The Every Student Succeeds Act of 2015 continued the testing requirement but gave states more options for implementation (Klein, 2016). While the availability of statewide tests for the eighth grade ensures that our approach generalizes across states, variation in the distributions of student achievement and baseline college testing across states will necessarily affect the results.
The counterfactual results identified with this approach depend on assumptions about individual and school behavior, and these assumptions should be examined carefully. At the individual level, the concern is that conditional on other observed academic performance, nontakers may perform lower than those who are observed to take the test because they have different true academic achievement, may invest less in test preparation, or may be less motivated to perform on the test. In this case, our estimates of performance for nontakers will be biased upward. Available evidence, including Garlick and Hyman (2018), suggests that the availability of rich measures of prior academic achievement reduces this concern, though it is by no means eliminated. At the district level, the concern is that the districts that currently have high levels of test-taking (or universal testing) produce different gains in student achievement between the eighth grade and the point of administration of college admissions tests or that these districts make different investments in preparation for the college admissions tests. If either (or both) of these district-level selection concerns hold, our estimates may be biased. How school- and district-level policies affect both test-taking and test performance is an area of opportunity for future research.
If gains to expanded college admission testing are large, it is reasonable to ask why they have not already been realized. For individuals, particularly first-generation and low-income students, it is possible that students who would benefit from the tests do not take them because they are unaware of the potential benefits of 4-year college attendance or are poorly informed about the “gateway” steps (i.e., taking the ACT or SAT) required for college application and admission. It is also possible that inattentiveness and process barriers (such as simply missing deadlines) limit test-taking. While district-wide (or statewide) test registration resolves specific process challenges related to test sign-up, testing per se does not resolve the larger information gap faced by first-generation and low-income students in navigating an individual pathway to college.
Two quite different hypotheses account for the observation that district-wide testing and bulk registration exists in some districts not others. First, some districts lack the financial and logistical resources to implement such policies as district-wide testing requires not only financial resources but also considerable professional time and coordination to administer tests. A second explanation is that the relative costs and benefits of district-wide testing may vary with the proportion of students demonstrating academic proficiency.
Is it possible to achieve gains in college admission test-taking, particularly for low-income students, without incurring the full costs of statewide mandatory testing? Such costs are not only financial but may place the highest burden on students who are not well matched with 4-year colleges and districts with the most limited resources for test administration and student guidance. Individual guidance based on prior statewide assessments (the SOL exams in Virginia) as well as other information available to teachers, such as high school grades, may also be an effective tool for encouraging test-taking among potential high scorers. Students below the 20th percentile on the SOLs are highly unlikely to score in the range required for admission at competitive 4-year colleges, while students at the very top of the distribution are likely to achieve an admission-eligible score. Targeted outreach may generate a significant increase in test-taking among the college-ready without incurring the financial and administrative burden of statewide testing mandates.
Moreover, because admission test-taking is but one gateway step in the process of college choice, guidance about whether and when to take college admissions tests might be best situated in comprehensive and personalized interventions to help high school students make better informed postsecondary choices. Identifying the strategies and tools to achieve this objective is a subject for future research and policy innovation.
Supplemental Material
DS_10.1177_2332858419855030 – Supplemental material for Missed Exams and Lost Opportunities: Who Could Gain From Expanded College Admission Testing?
Supplemental material, DS_10.1177_2332858419855030 for Missed Exams and Lost Opportunities: Who Could Gain From Expanded College Admission Testing? by Emily E. Cook and Sarah Turner in AERA Open
Footnotes
Appendix
SAT and PSAT Score Summary for Takers and Nontakers, Alternate Methods
| Test | Students | Method | Average math + verbal score | Std. Dev. | Percentile |
|||
|---|---|---|---|---|---|---|---|---|
| 20th | 40th | 60th | 80th | |||||
| 25 SOL quantiles, race, and disadvantaged status | 887 | 174 | 742 | 828 | 910 | 1024 | ||
| SAT | Nontakers | 200 SOL quantiles | 882 | 178 | 730 | 820 | 908 | 1022 |
| 100 SOL quantiles | 883 | 177 | 734 | 820 | 908 | 1024 | ||
| 50 SOL quantiles | 883 | 178 | 734 | 820 | 906 | 1024 | ||
| 25 SOL quantiles | 882 | 178 | 736 | 820 | 908 | 1022 | ||
| PSAT-taking and SOL | 869 | 172 | 726 | 810 | 892 | 1010 | ||
| PSAT-taking, PSAT score, and SOL | 858 | 164 | 720 | 806 | 880 | 988 | ||
|
|
||||||||
| Takers | N/A—no imputation | 1034 | 199 | 860 | 970 | 1080 | 1210 | |
| 25 SOL quantiles, race, and disadvantaged status | 83.1 | 17.1 | 69.0 | 77.0 | 85.4 | 96.2 | ||
| PSAT | Nontakers | 200 SOL quantiles | 83.3 | 17.4 | 69.0 | 77.2 | 85.6 | 97.0 |
| 100 SOL quantiles | 83.2 | 17.3 | 68.8 | 77.0 | 86.0 | 96.8 | ||
| 50 SOL quantiles | 83.2 | 17.4 | 69.0 | 77.0 | 85.8 | 97.0 | ||
| 25 SOL quantiles | 83.2 | 17.3 | 69.0 | 77.0 | 85.8 | 97.0 | ||
|
|
||||||||
| Takers | N/A—no imputation | 93.4 | 20.0 | 76.0 | 87.0 | 97.0 | 110.0 | |
Note. Authors’ analysis of Virginia Longitudinal Data System (VLDS) data on students in the 2014 graduating cohort. For nontakers, this table shows the results of imputation of SAT and PSAT scores from several different imputation methods (see description in the text). For test-takers, this table summarizes observed SAT and PSAT sores.
Acknowledgements
The authors thank Charles Brown, Joshua Goodman, Victoria Roloff, Jeffrey Smith, and Jonathan Smith for insightful comments.
Notes
Authors
EMILY E. COOK is a PhD candidate in the Department of Economics at the University of Virginia. Her research interests include the economics of higher education, empirical industrial organization, and labor economics.
SARAH TURNER is University Professor of Economics and Education, Souder Family Professor, at the University of Virginia, and a research affiliate of the NBER. Her research focuses on the economics of higher education with particular attention to college choice, student financial aid, and high skill immigration.
References
Supplementary Material
Please find the following supplemental material available below.
For Open Access articles published under a Creative Commons License, all supplemental material carries the same license as the article it is associated with.
For non-Open Access articles published, all supplemental material carries a non-exclusive license, and permission requests for re-use of supplemental material or any part of supplemental material shall be sent directly to the copyright owner as specified in the copyright notice associated with the article.