
Abstract
We explore the discipline gap between Black and White students and between Hispanic and White students using a statewide student-level panel data set on Indiana public school students attending prekindergarten through 12th grade from 2008–2009 through 2013–2014. We demonstrate that the Black-White disciplinary gaps, defined in a variety of ways and robust to a series of specification tests, emerge as early as in prekindergarten and widen with grade progression. The magnitude of these disciplinary gaps attenuates by about half when we control for many student- and school-level characteristics, but it persists within districts and schools. In contrast, we find that Hispanic-White gaps are initially null and statistically insignificant at the prekindergarten/kindergarten level and attenuate substantially after adjustment for cross-school (district) variation and other covariates. We further disentangle the discipline gap using a decomposition technique that provides empirical support for the hypothesis that Black students nonrandomly sort into more punitive disciplinary environments.
T
Children who experience punitive disciplinary actions in school exhibit lower academic achievement on average (Arcia, 2006; Hwang, 2018; Lacoe & Steinberg, 2018). Because exclusionary disciplinary policies reduce children’s opportunity to learn and reduce the time that children spend engaged in educationally meaningful activities (Losen, Hodson, Keith, Morrison, & Belway, 2015; Rausch & Skiba, 2006), there is reason to hypothesize that punitive disciplinary actions may have causal adverse effects on children’s academic outcomes. Thus, racial disparities in adverse disciplinary outcomes likely exacerbate existing race-based achievement gaps (Morris & Perry, 2016).
However, several important aspects of race-based disciplinary gaps remain unexplored, in large part due to data limitations. For example, the federal Office of Civil Rights (OCR) only recently began (2013–2014 academic year) reporting biennial data on adverse disciplinary outcomes by student race/ethnicity for all schools and districts in the United States. Although the OCR data have national coverage, they cannot be disaggregated to the student or grade level or analyzed across a longer period, and they do not include an extensive set of covariates useful for explaining variation in student suspensions and expulsions. Other studies with disaggregated student-level data from state departments of education (Anderson & Ritter, 2017; Skiba et al., 2014) employed truncated data sets, including students who received only disciplinary infractions and thereby precluding an analysis that accurately predicts the probability of suspensions/expulsions with the full student sample.
In this article, we provide an extensive description of the racial disparities in school disciplinary outcomes that have eluded the literature thus far due to such data limitations. First, we highlight the early emergence of Black-White disciplinary gaps across multiple school disciplinary outcomes (likelihood, frequency, and length of suspension or expulsion) and the widening of these gaps across grades. Second, we answer questions regarding the source of these disparities: To what extent do these gaps arise within schools, across schools in the same district, or across districts? To what extent do disciplinary gaps attenuate when controlling for observable student-, school-, and district-level characteristics? Third, we document a key feature of segregation in Indiana—the substantial nonrandom sorting of Black students across a few districts—and examine to what extent this cross-district sorting explains racial disciplinary gaps.
We apply these methods to statewide panel data on all public school students attending prekindergarten through 12th grade in Indiana during the 2008–2009 through 2013–2014 academic years (N = 3,341,065 students and 7,223,752 student-year observations). Our data set includes a large number of student and school characteristics that enable us to explore different research questions and account for a much more extensive set of covariates than what were available in prior studies of the discipline gap.
Results from our analyses indicate that the probability that Black students in Indiana will experience a suspension/expulsion in any school year is between 13 and 16 percentage points higher than for White students. The Black-White discipline gap widens with grade progression, attenuating slightly but remaining significant after accounting for school or district fixed effects. This finding suggests that, at least in Indiana, the discipline gap is driven by variation both across and within schools (districts). Furthermore, there is substantial heterogeneity in the magnitude of adverse disciplinary outcomes and race-based disciplinary gaps across school districts. While we cannot fully disentangle the unobserved sources of that heterogeneity, we find that, on average, Black students attend schools in districts with markedly different average demographic characteristics and that racial sorting across districts explains a significant portion of the racial discipline gaps in our fixed effects and decomposition analyses. In contrast, we find that the Hispanic-White gaps are lower than the Black-White gaps in Indiana (zero and statistically insignificant in lower grade levels) and are mostly explained by observed student-level differences and cross-district variation. Our detailed descriptive analyses follow recommendations advocated in a recent Institute of Education Sciences report by Loeb et al. (2017), which stated that analyses such as those in this article are essential for hypothesis generation of causal mechanisms that can be tested in the future, as well as for the design and evaluation of appropriate policy interventions.
In the sections that follow, we provide a brief review of relevant literature, describe our data and methods, discuss results from our analysis, and conclude with policy recommendations.
Literature Review
The Children’s Defense Fund (1975) published one of the earliest reports documenting the overrepresentation of Black students in school suspensions. With national data obtained from the Office of Civil Rights, the report revealed that suspension rates among Black students exceeded those of White students in more than two-thirds of school districts. Since then, multiple studies have reported similar results. For example, Rocque (2010) found evidence of a Black-White disciplinary gap in disciplinary referrals. Costenbalder and Markson (1998), Gregory and Weinstein (2008), and Skiba et al. (2014) reported racial disparities in in- and out-of-school suspensions, and Theriot (2009) documented a race-based disciplinary gap in school arrests. Yet, most of these studies suffered from data and methodological limitations that precluded estimation of race-based discipline gaps with more varied measures of disciplinary outcomes capturing multiple infractions and the duration of suspensions/expulsions. Many previous studies also did not account for students’ prior disciplinary infractions—such as multiple suspensions and the length of suspensions/expulsion.
Furthermore, despite wide acknowledgment of the discipline gap, there is little consensus regarding its causes. One possible explanation is the individual deficit hypothesis, which may be grouped into two categories: differential behaviors and differential attributes. The differential behavior hypothesis posits that minority and White students exhibit different behaviors in school, which in turn contribute to racial disparities in adverse disciplinary outcomes. For example, Wright, Morgan, Coyne, Beaver, and Barnes (2014) used data from the Early Childhood Longitudinal Study–Kindergarten and found no evidence of racial differences in suspension rates among eighth graders after accounting for teacher assessments of early problem behaviors. Similarly, Rocque (2010) and Bradshaw, Mitchell, O’Brennan, and Leaf (2010) found that the magnitude of the race-based gap in disciplinary referrals decreased after accounting for teacher-reported measures of student behavior. Townsend (2000) raised the concern that Black students might use more emotive communication styles with louder voices, which may be misinterpreted as noncompliance, and that this behavioral difference may result in disproportionality. A major empirical issue in studies that accounted for teacher ratings of student behavior is that these measures may reflect racial bias. For example, if teachers’ perceptions of student behavior exhibit racial bias (Lindsay & Hart, 2017; Okonofua & Eberhardt, 2015), then estimates of the remaining race-based discipline gap will be biased downward. Some studies (Losen & Skiba, 2010; Skiba et al., 2014) argued that race-based discipline gaps may be attributed to racial bias if differences in student behavior do not fully account for the gaps. As discussed here, however, measures of student behavior themselves may be subject to racial bias. Furthermore, objective measures of student behavior are rarely available from statewide or nationally representative data sets. While our data do not include measures of student behavior or teacher attributes or perceptions of student behavior, these mechanisms may reside in the “unexplained” components in our analysis. In our results, we explicitly disentangle and discuss this unexplained component. Future research should explore these potential mechanisms with a multitude of research designs.
The differential attributes hypothesis implies that the distribution of individual and school characteristics across minority students is different from that of White students and that these differences in endowments are associated with the race-based discipline gap. For example, minority students are disproportionately economically disadvantaged, and economically disadvantaged students are overrepresented in adverse disciplinary outcomes (Brantlinger, 1991; Wu, Pink, Crain, & Moles, 1982). Studies that include controls for student socioeconomic status (e.g., Skiba, Michael, Nardo, & Peterson, 2002) found that measures of student poverty explain some but not all of the race-based discipline gap.
Another issue is that the disproportionate sorting of minority students into more punitive school environments does not imply evidence of discrimination per se. Previous studies found that minority students are disproportionately exposed to punitive institutional environments (Gregory & Weinstein, 2008; Kinsler, 2013; Peguero & Shekarkhar, 2011; Skiba et al., 2014; Wu et al., 1982). Wu et al. (1982), Kinsler (2011), and Skiba et al. (2014) found that school-based disciplinary policies account for a substantial portion of the race-based discipline gap. Yet studies that attributed all cross-school variation in disciplinary outcomes to racial bias likely overestimated the role of discrimination in the race-based discipline gap. However, other studies (e.g., Kinsler, 2011) defined racial bias as the differential treatment of Black and White students within the same school. After accounting for cross-school variation in adverse disciplinary outcomes with school fixed effects, Kinsler (2011) and Anderson and Ritter (2018) found no evidence of racial disparities within schools. We argue, however, that this approach likely underestimates the role of discrimination in the race-based discipline gap because any time-invariant structural racial discrimination at the school level will be subsumed in the school fixed effects. For example, principal attitudes toward school discipline (Skiba & Edl, 2004), accountability pressures (Figlio, 2006), and entrenched racial segregation may affect the cross-school variation in race-based discipline gaps. Some of these time-invariant school-level characteristics are attributable to racial discrimination. Additionally, schools that are more racially homogeneous might “drop out” of fixed effects analyses given the absence of within-school racial variation, thereby biasing measures of race-based discipline gaps. Yet, the existence of several racially homogeneous schools, especially schools with high rates of minority student composition, are prevalent in the United States and exhibit high exclusionary disciplinary rates.
Since the 1954 Brown vs. Board of Education Supreme Court decision outlawing de jure school segregation, several studies have explored school segregation in the United States (e.g., Clotfelter, 2004; Coleman, Kelley, & Moore, 1975; Orfield & Lee, 2007). Nonetheless, there is little consensus about the mechanisms through which segregation influences student outcomes (Reardon & Owens, 2014). Furthermore, we are aware of only one study that examined the direct effect of segregation on school disciplinary outcomes. In that study, Billings, Deming, and Rockoff (2014) stated that they found no effect of segregation on school disciplinary outcomes, such as out-of-school suspensions, although they did not report results from that analysis. Even though several studies (e.g., Rocha & Hawes, 2009; Skiba et al., 2014; Welch & Payne, 2010) found that the racial composition of schools and school districts—as measured by the share of Black students—predicted suspension/expulsion rates, we are aware of no other study that examined the extent to which the nonrandom sorting of minority students across districts (schools) was associated with the race-based disciplinary gap.
Far less attention has been paid to racial disparities in discipline for non-Black minority students. For Hispanic students, the results are inconsistent (see Welsh & Little, 2018). While some studies found significant overrepresentation of Hispanic students in exclusionary discipline (Gregory, Skiba, & Noguera, 2010; Peguero & Shekarkhar, 2011), others found statistically insignificant differences (Ramey, 2018), especially in lower grade levels (Skiba et al., 2011). Furthermore, there is much less evidence on the sources of and mechanisms causing these disparities. The mechanisms through which racial discrimination may cause disparities across students from different minority races could be vastly different. For instance, Rueda (2015) found that teachers interpret Hispanic students’ behavior more positively as compared with Black students. She found that schools often do not punish Hispanic students, even when teachers catch them breaking rules. Furthermore, past studies showed that the “racialized legacy” (Ramey, 2018) of incarceration does not affect Hispanics in the same manner that it does Blacks; Hispanic children may thus not experience criminalization in the same ways as Black children (Irwin, Davidson, & Hall-Sanchez, 2013; Western, 2006).
Taken together, previous research suggests that poverty and school-level factors account for a significant share of the racial discipline gap. Prior research is mixed regarding Hispanic-White gaps and the persistence of within-school (district) racial discipline gaps, and their causes remain unclear. This study advances the extant literature in several important ways. First, we describe Black-White and Hispanic-White gaps across all grades using better measures of disciplinary outcomes than what are available in previous literature. Second, we depart from past studies to analyze within-district gaps more extensively and estimate the extent to which differences in the districts (schools) attended by students of different races may contribute to variation in racial discipline gaps, using fixed effects and decomposition analyses. Specifically, our decomposition and fixed effects analyses disentangle the sources of racial discipline gaps into within- and across-school (district) factors, which prior literature did not do.
Data and Measures
This study employs statewide student-level panel data obtained from the Indiana Department of Education (IDOE) on all prekindergarten–12th grade Indiana public school students in the 2008–2009 through 2013–2014 academic years. For each year, the data include information on student race, gender, poverty status (indicated by enrollment in a free or reduced-price meal program), special education status, attendance, grade, and school and district indicators.
We categorize student race into four main categories for ease of exposition: White, Black, Hispanic, and other. The “other” race category constitutes between 5% and 7% of the sample across years and grade levels and is composed of multiracial students (4%–5%), Asians (1%–2%), American Indians (<0.5%), and Native or other Pacific Islanders (<0.5%). 1
We link each student-year record to school-level data on the share of minority students, the share of students in poverty, the share of special education students, and attendance at the school level. IDOE requires all public schools in Indiana to provide this student-level information every year, including charter schools that receive some exemptions from reporting on bullying, gang, and arrest-related information. IDOE provides schools with detailed standardized data reporting guidelines, which include codes for classifying suspensions and expulsions. 2
For each student in each year, we also observe all suspensions and expulsions, including the length of the suspension/expulsion period. We use these data to construct a series of outcome measures, which include the following:
Dichotomous variables indicating, in each year, whether a student experienced any adverse disciplinary event (suspension or expulsion)
Duration of adverse disciplinary outcomes, in days, of all suspensions and expulsions 3
In addition to employing simple racial composition measures at the school and district levels in our analyses, we calculate district-level measures of exposure and unevenness (see Massey & Denton, 1988, for an overview of the various dimensions of segregation that can be broadly classified into these two categories). 4 Following Reardon (2016), we first calculate the within-district exposure of Black students to other Black students and to poor students (as measured by the share of students enrolled in free or reduced-price meal programs) by weighting the share of Black or poor students in each school by the proportional representation of that school’s Black students among all Black students within the district and then averaging that share across Black students in the district (see Table A10). This measure provides a district-level average share of Black or poor students in the schools attended by an average Black student within the district and is computationally equivalent to calculating the average share of Black or poor students within schools, conditional on being Black. In Indiana, the average district-level racial exposure of Black students to other Black students is 0.46; that is, for an average Black student in Indiana, across all schools in the district, 46 of every 100 students in the school also are Black. By comparison, the average racial exposure of White students to Black students in the district is 0.06. Similarly, the average share of free/reduced-price lunch recipients in an average Black student’s school, across all schools in the district, is a measure of Black students’ exposure to poverty in the school. This measure is on average 0.64 for Black students and 0.40 for White students.
Second, unevenness measures describe the difference in average school, district, or neighborhood racial or socioeconomic composition among children of different races (Reardon, 2016). For example, the aggregate district-level measure of racial unevenness between Black and White students in Indiana, on average, is 0.40. We calculate district-level unevenness measures by taking simple district-level differences between the exposures of Black and White students to Black and poor students within districts and across schools. Table A10 provides the calculations for these segregation measures. Each measure takes on a value ranging from 0 to 1, with values close to 0 representing low segregation levels and values close to 1 representing high segregation levels.
Descriptive Analyses
We first present descriptive statistics and results from basic regression analyses to characterize the discipline gap in our data set. In the 2008–2009 through 2013–2014 academic years in Indiana, 22% of Black students experienced a suspension or expulsion, as opposed to 8% of White students. Figure 1 depicts suspension/expulsion rates by race across the years in our data set. While the suspension/expulsion rates decline over time, racial disparities persist. We also observe substantial variation in adverse disciplinary outcomes across grade levels, both in terms of suspension/expulsion rate levels and in terms of the magnitude of the Black-White and Hispanic-White discipline gaps. On average, around 1% of White prekindergarten/kindergarten students receive an expulsion or suspension, as compared with 5% of Black and 1.2% of Hispanic prekindergarten/kindergarten students. Across the 2008–2009 through 2013–2014 academic years, 9% to 13% of White high school students received an expulsion or suspension versus 25% to 34% of Black high school students and 15% to 23% of Hispanic high school students (see Figure 2). Therefore, we estimate models separately for students at the prekindergarten/kindergarten, elementary and middle school, and high school levels. 5

Raw suspensions and expulsions rates, by race across Indiana. The analytic sample includes statewide panel data on all public school students attending prekindergarten through 12th grade in Indiana during the 2008–2009 through 2013–2014 academic years (N = 3,341,065 students).
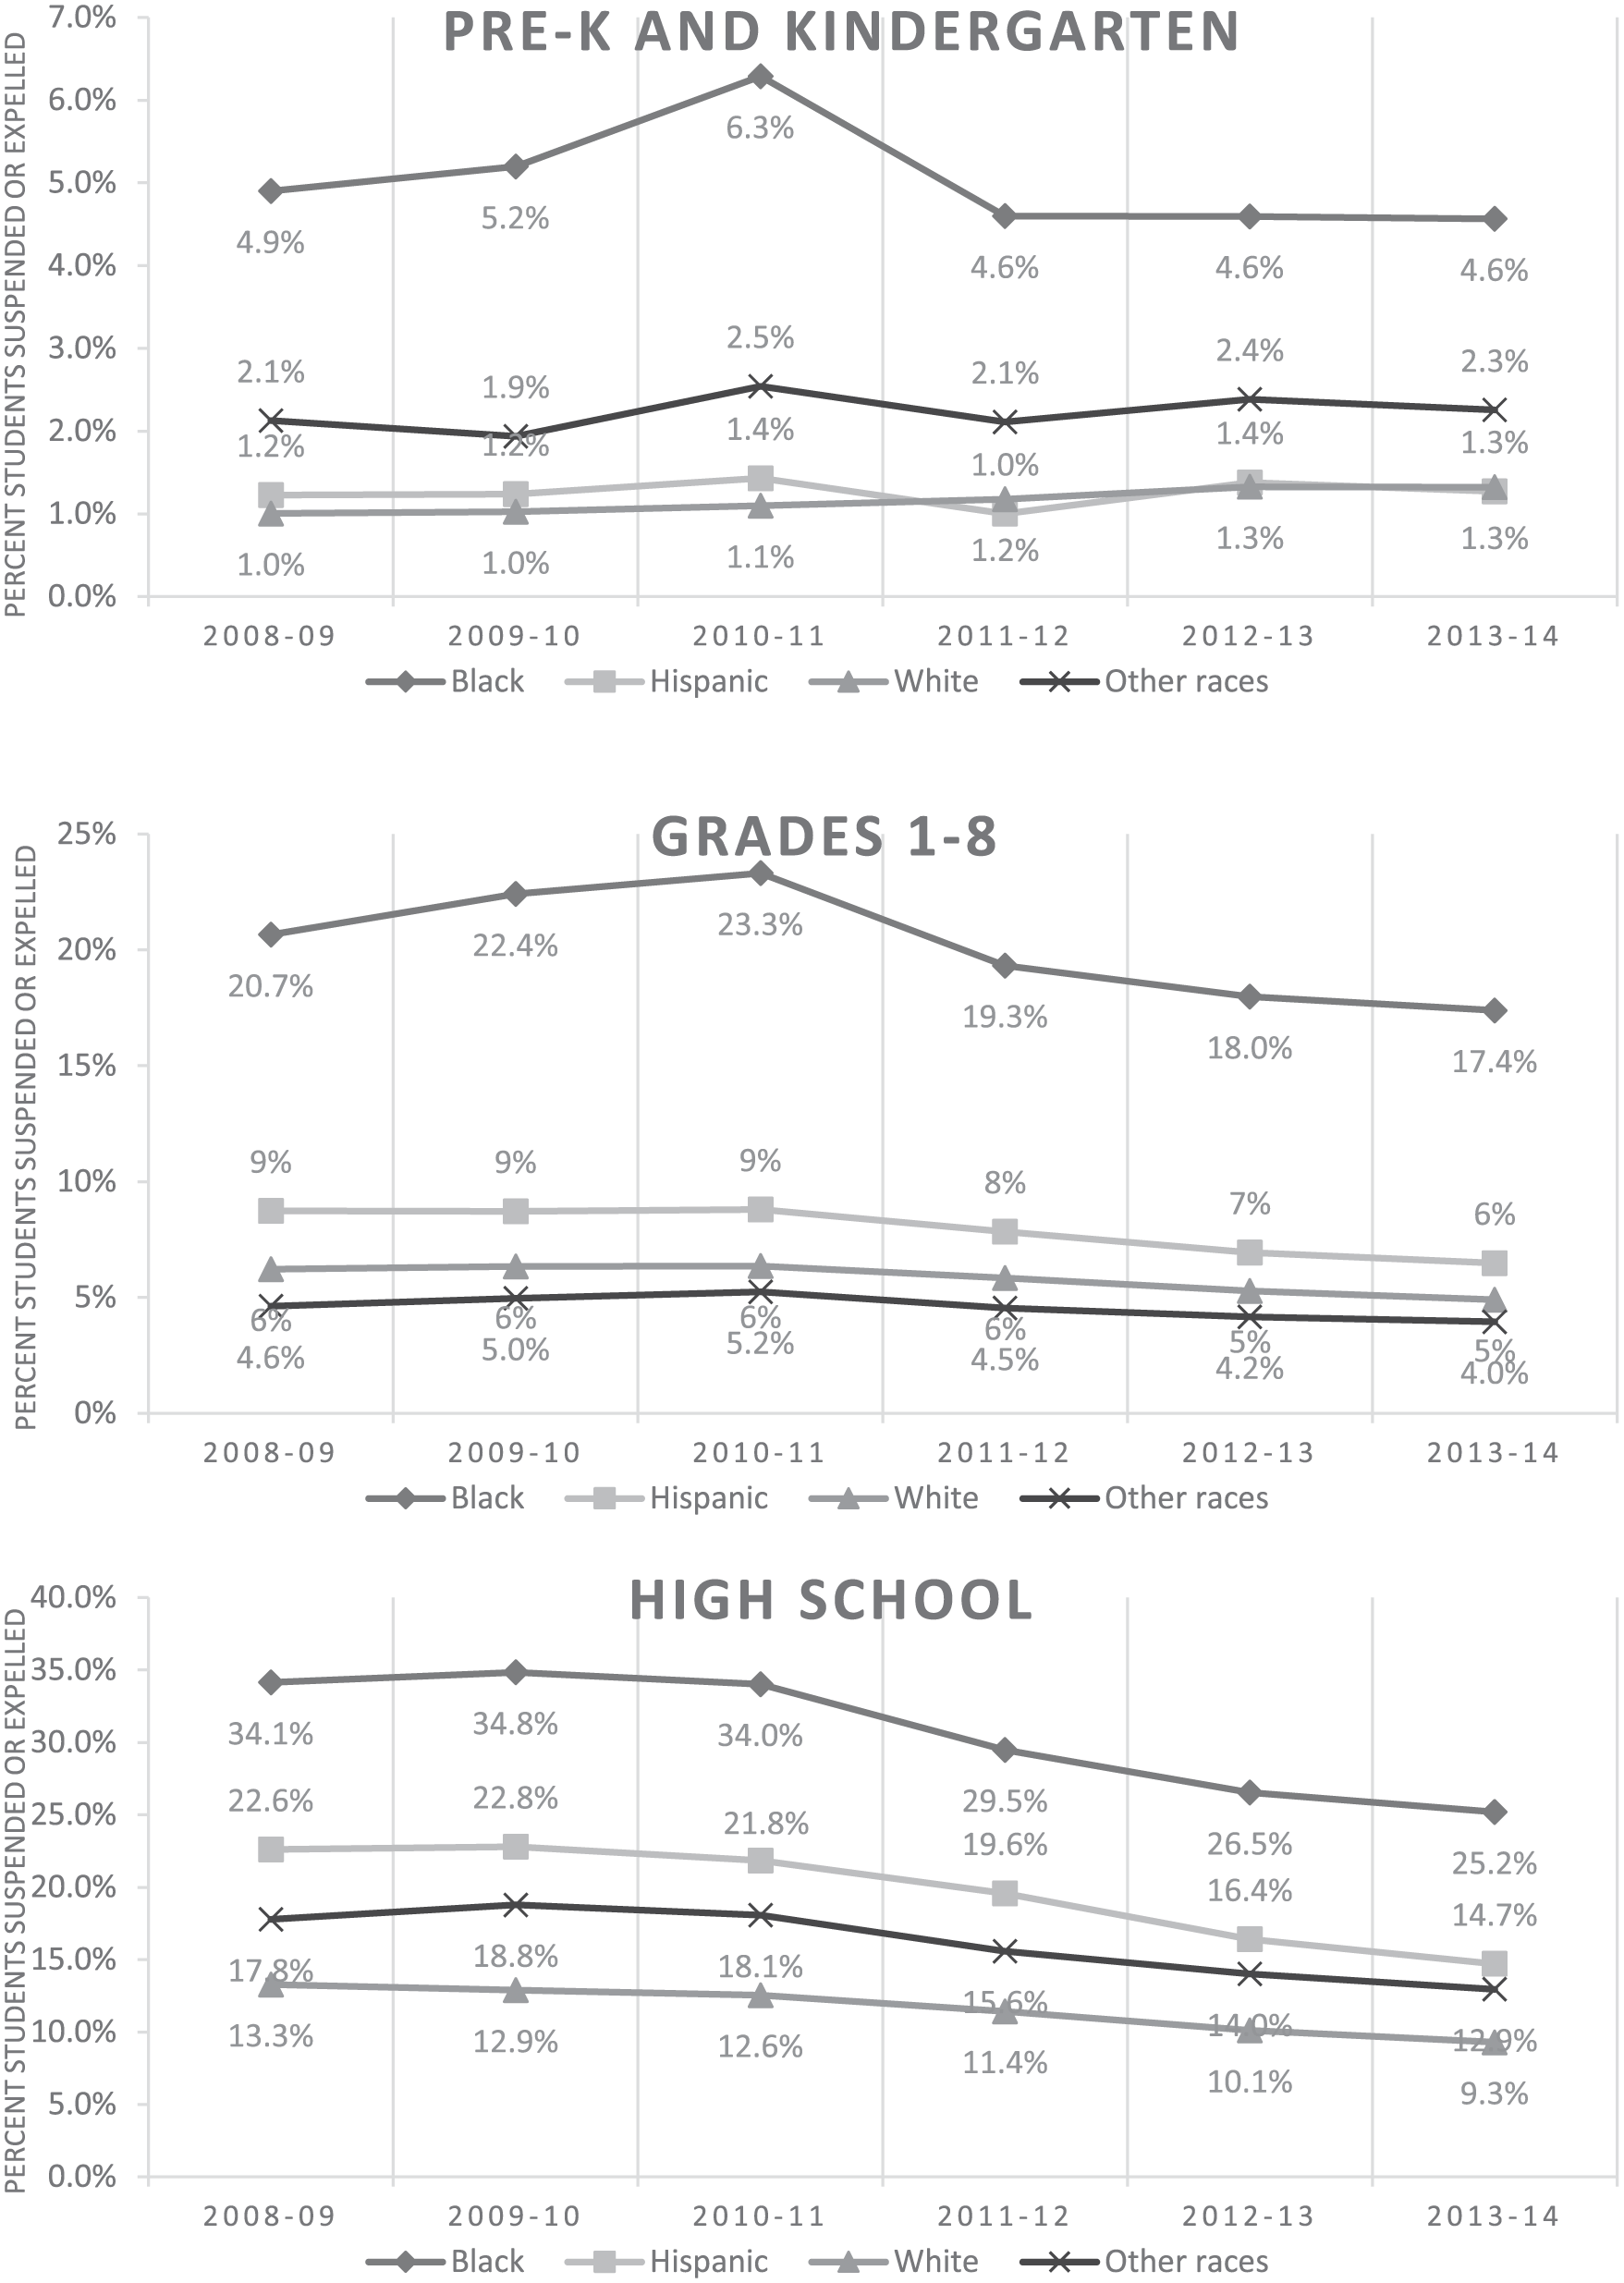
Suspension and expulsion rates, by race and partitioned by grade level—prekindergarten and kindergarten, elementary and middle school, and high school. The analytic sample includes statewide panel data on all public school students attending prekindergarten through 12th grade in Indiana during the 2008–2009 through 2013–2014 academic years (N = 3,341,065 students).
Table 1 further illustrates these descriptive statistics and reports summary statistics for the student- and school-level characteristics that we use in our core model specifications, by race and grade level.
Descriptive Statistics by Race and Grade Level

Note. The entries are means (that have been time de-meaned) and standard deviations (overall across the panel in parentheses) of student-level data. The unit of observation is a student-year. FRPL = free/reduced-price lunch.
We observe substantial cross-race differences in student and school characteristics—for example, White students, on average, attend schools with a lower share of students receiving free or reduced-price meals (29%–40%, depending on grade level) than do Black students (51%–70%) or Hispanic students (42%–60%). We also observe racial differences in school racial composition. An average White student in our sample attends a school in which 6% to 7% of students are Black and 5% to 6% of students are Hispanic, as opposed to Black students—who, on average, attend schools in which 45% to 50% of students are Black and 18% to 20% are Hispanic. On average, Hispanic students attend schools in which 15% to 25% of students are Hispanic and 18% to 20% are Black. In all, as compared with White students, Black students are more likely to be poor (as measured by their eligibility for the free lunch program), attend larger schools with higher minority student composition, and are more likely to receive suspensions and expulsions (with longer days of suspension/expulsion).
Results and Discussion
Magnitudes of Racial Disciplinary Gaps
To estimate raw racial disciplinary gaps, we first regress our outcome measures on race indicators and year fixed effects only, with White students serving as the omitted category. Therefore, the coefficients on the race indicators capture the mean differences in the outcomes between students of the corresponding race and White students. 6 We specify our initial regression model as follows:

In separate specifications, the dependent variable Y denotes, in each year, (1) an indicator for whether a student experienced any adverse disciplinary event (suspension or expulsion) and (2) the duration of adverse disciplinary outcomes, in days, of all suspensions and expulsions. We also explore alternative models with dependent variables measured in a variety of ways—count of suspensions and expulsions and likelihood of multiple suspensions/expulsions. The vector
We present results from this initial model specification in columns 1 and 5 of Table 2. We find that the Black-White discipline gap in the likelihood of suspension/expulsion is 3.8 percentage points in prekindergarten/kindergarten and widens with grade progression to 19.1 percentage points in high school. Black students also receive suspensions/expulsions that are, on average, 0.1 to 1.4 days longer than those of White students. Consistent with past literature, we also find significant gender-by-race interactions for Black male students across most models (see Table A6). However, the magnitude of the Hispanic-White discipline gap in terms of likelihood of suspension or expulsion is smaller across grade levels and ranges between 0 (statistically insignificant) in prekindergarten/kindergarten and 8 percentage points in high school.
Estimates of Race-Based Discipline Gaps

Note. Standard errors in parentheses are clustered at the district level (except in columns 3 and 7, where they are clustered at the school level) to correct for heteroskedasticity and autocorrelation. The unit of observation is a student-year. Length of suspension or expulsion censored to 20 days to limit influence of potential outliers. To economize on space, we report race coefficients only. Alternate specifications include an extensive set of student- and school-level covariates as specified in the main text, school (or district) fixed effects, and year fixed effects.
p < .01. ***p < .001.
Do Student- and School-Level Factors Attenuate Racial Disciplinary Gaps?
To understand the importance of factors other than race that may influence the outcomes, we next expand our specification in Equation 1 to include a comprehensive set of student and school characteristics. Thus, the race coefficients in these models capture the mean differences in the outcomes between students of the corresponding race and White students, controlling for other factors in the equations. In other words, they provide estimates of regression-adjusted racial discipline gaps. Student characteristics in these models, in addition to race, include indicators for gender, poverty status, grade, special education status, indicators for students’ adverse disciplinary events in prior years (a lagged dichotomous measure of whether a student received a suspension/expulsion: 1 = yes, 0 = no), 7 and attendance. School characteristics include the share of minority students, the share of students receiving free or reduced-price lunch, the share of special education students, and the log of school size. Finally, we include district-level measures of exposure and unevenness to Black and poor students, as well as attendance. We adapt Equation 1 as follows:

In this specification,
Cross-District (School) Versus Within-District (School) Magnitudes of Racial Disciplinary Gaps
Given the mixed evidence in past literature regarding the source of racial discipline disparities within versus across schools, we next employ a series of fixed effects regressions to estimate within-school (district) racial disciplinary gaps. In other words, the race coefficients now capture the mean regression-adjusted within-school (district) differences between the students of the indicated race group and White students. We adapt Equation 2 to accommodate these fixed effects:

where θ d alternately denotes time-invariant school and district characteristics. Coefficients on the school (district) fixed effects indicate how the outcome measures vary with systematic features of particular schools (districts) that are constant over time, and they capture variation in disciplinary outcomes across schools (districts). A coefficient associated with a particular school (district) fixed effect should be interpreted as the average baseline level of the outcome variable across periods in that particular school (district). Because school (district) fixed effects account for cross-school (district) variation in the outcomes, the coefficients on school characteristics in γ and on student characteristics in X are estimated with within-school (district) variation; in the school fixed effects specifications, any school characteristics in γ that do not vary over time are subsumed in the school fixed effect and drop out of the model. We report results from our school (district) fixed effects specifications in columns 3 and 7 (columns 4 and 8) of Table 2.
A comparison of results reported in columns 3, 4, 7, and 8 reveals that the coefficients on the Black race indicators attenuate very little after accounting for school (district) fixed effects. Alternatively, to explore the extent to which the unadjusted race-based discipline gaps are driven by within- versus between-district variation, we add district fixed effects prior to adding all the other student- and school-level characteristics. We find that the Black-White disciplinary gap attenuates by about a third but remains significant when we account for district fixed effects (see Figure A1), demonstrating that Black-White disciplinary gaps persist within schools (districts). In contrast, the Hispanic-White disciplinary gap is very small at the lower grade levels, reverses in direction after inclusion of fixed effects in the elementary and middle school models, and attenuates the high school Hispanic-White gap by about half. These findings provide evidence that cross-district variation forms a substantial portion of the Hispanic-White gap in our sample. Taken together, this finding suggests that, at least in Indiana, cross-school (district) differences in disciplinary practices reduce but do not eliminate the race-based discipline gap; within-district (school) racial discipline gaps persist.
Within-District Racial Disciplinary Gaps
We turn next to a deeper exploration of the within-district, regression-adjusted Black-White discipline gaps that persist across grade levels. First, we estimate the magnitude of the Black-White gaps based on the likelihood of receiving multiple suspensions/expulsions in a year to better understand if racial disparities persist across multiple disciplinary infractions (see Table A6 for estimates of race-based discipline gaps with the number of suspensions/expulsions as a dependent variable). We also examine the robustness of the within-district race gaps using multiple strategies. For example, we examine if racial gaps in the length of suspension/expulsion are sensitive to extreme values by limiting the analysis to include only students who received at least 1 day of suspension. Furthermore, we explore three interrelated hypotheses. Do within-district Black-White gaps in the length of suspension/expulsion arise (1) from a reduced likelihood of White children ever being suspended and/or (2) from a reduced likelihood of White children receiving fewer suspensions and/or (3) from White children being suspended for fewer days conditional on being suspended? We report results from these additional robustness checks in Table 3.
Within-District Race-Based Gaps: Additional Robustness Checks

Note. Standard errors in parentheses are clustered at the district level (except in columns 3 and 7, where they are clustered at the school level) to correct for heteroskedasticity and autocorrelation. The unit of observation is a student-year. Length of suspension or expulsion censored to 20 days to limit influence of potential outliers. To economize on space, we report race coefficients only. Alternate specifications include an extensive set of student- and school-level covariates as specified in the main text, school (or district) fixed effects, and year fixed effects.
p < .05. **p < .01. ***p < .001.
Column 1 of Table 3 shows that the Black-White within-district gap in the likelihood of receiving more than one suspension/expulsion is statistically significant yet smaller in magnitude as compared with the likelihood of ever receiving a suspension/expulsion across grade levels (also see Table A5, which shows that Black students receive, on average, 0.05 to 0.3 more suspensions in a year as compared with White students). On average, the likelihood that Black students receive multiple suspensions/expulsions in a year is between 1 and 7 percentage points higher than that of White students.
Next, given the statistically significant and large coefficient on the disciplinary history variable in the previous regressions, we explore the sensitivity of the race-based discipline gaps to the inclusion/exclusion of this variable. We also test the robustness of our primary results by including a richer specification of prior disciplinary actions; specifically, we include as controls the number of times that a student was suspended/expelled in prior years and the length of past suspensions/expulsions in prior years within the same school. Columns 2, 3, and 4 of Table 3 reveal these results. We find that while the disciplinary history measure is a predictive student-level characteristic, it does not explain a very large portion of the observed Black-White discipline gaps independently. In other words, students’ disciplinary histories do not appear to affect students differentially across race. We substantiate these results in our decomposition analysis in the next section.
Column 5 includes race-specific time trends for Black students given that our descriptive results showed an overall downward time trend in adverse disciplinary rates. The Black-White gap attenuates by a small extent at the prekindergarten/kindergarten, elementary, and middle school levels. However, the magnitude of the Black-White gap is higher by 2 percentage points at the high school level. Several states have adopted policies to limit the use of suspensions and expulsions only to serious infractions at lower grade levels. While we are not aware of any such official policy adoption in Indiana, we do observe downward time trends affecting Black students favorably to some minor extent in the lower grade levels, potentially due to greater awareness of such policies and the negative effects of exclusionary discipline among educators in recent years. Finally, in column 6, we limit the analysis to ninth graders in the high school models to explore the sensitivity of race-based discipline gaps to students dropping out of school in subsequent grades. The magnitudes of the racial disciplinary gaps are marginally higher, potentially indicating that differential dropout rates by race may attenuate racial disciplinary gaps at the high school level. 9
Column 7 reports results from models that limit the analysis to only those students who receive at least 1 day of suspension. As expected, the magnitudes of these race gaps are larger than those reported in Table 2, because a large number of students have 0 days of suspension. Column 8 controls for the total number of prior disciplinary infractions. Together, these models show that Black-White gaps in the length of suspension/expulsion arise from multiple sources: the reduced likelihood of White children to ever be suspended, to receive multiple suspensions, and to be suspended for longer durations conditional on being suspended.
We also examine the robustness of our results to the exclusion of charter schools 10 and by exploring alternative fixed effects specifications. We ran models including Grade × Year fixed effects, School (or District) × Year fixed effects, and School (or District) × by Grade fixed effects (results not shown). School (or District) × Grade fixed effects account for variation in school disciplinary outcomes that vary by grade within schools or districts (e.g., due to policies that vary behavioral standards by grade). Results from these alternative specifications were qualitatively similar to those reported in Table 2 and are available upon request.
How Does Racial Sorting Across Districts Explain Racial Disciplinary Gaps?
The fixed effects in Equation 3 capture systematic differences across schools (districts) in average suspension/expulsion outcomes that are constant over time and therefore subsume any time-invariant discriminatory behavior at the school (district) levels. Thus, the effect of discriminatory school (district) actions that do not vary over time cannot be identified separately from other time-invariant school (district) features that also explain variation in adverse disciplinary events. For example, a positive coefficient on a school fixed effect captures not only potentially discriminatory attitudes among school administrators that do not vary over time but also other structural features of the school that systematically contribute to higher suspensions/expulsions on average (e.g., the location of the school in an area with high crime rates or a zero-tolerance disciplinary policy).
Approximately 82% of all Black students in Indiana attend a school in one of 35 districts (out of nearly 400 districts), and those 35 districts account for 51% of all suspensions or expulsions in the state but only 38% of total enrollment. Figure 3 depicts the distribution of Black students across districts by the share of Black students in the district, averaged across the 2008–2009 and 2013–2014 academic years. The columns indicate the share of Black students in Indiana who attended school districts in which the average share of enrolled Black students in the district is equal to the column label. For example, the leftmost column indicates the share of Black students in Indiana (16%) who attended one of the 301 school districts in Indiana in which <10% of enrolled students were Black. The secondary Y-axis depicts the average suspension/expulsion rate in those districts.
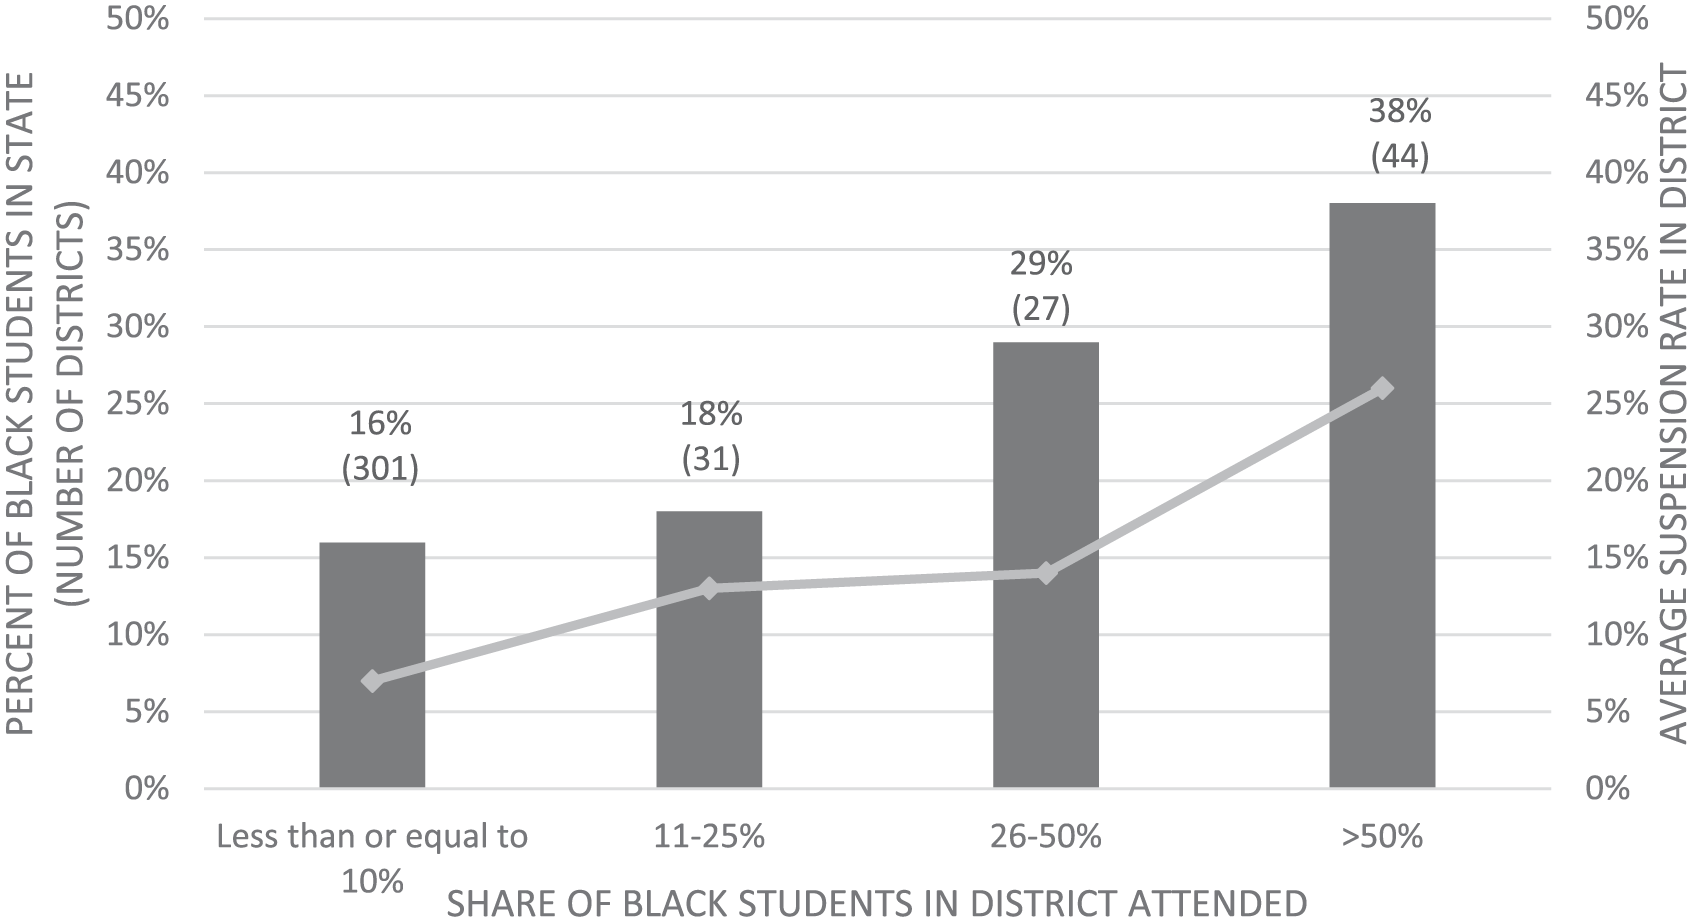
Distribution of Black students across districts with varying shares of Black students. The number of districts is shown in parentheses. For example, the leftmost column indicates the share of Black students in Indiana (16%) who attended school districts in which <10% of enrolled students were Black. The secondary Y-axis and the line graph show the average suspension/expulsion rate in those districts.
The racial composition of districts in Indiana is uneven. Sixteen percent of Black students in Indiana attend schools in districts in which the share of Black students is less than10%, while 38% of Black students attend schools within majority-Black districts. Furthermore, there is little variation over time in the share of Black students within school districts, indicating the entrenched nature of segregation in our sample.
In this final section, we examine, using decomposition techniques, the extent to which the cross-district racial sorting of students explains race-based discipline gaps. We carry out a Blinder-Oaxaca decomposition (Blinder, 1973; Oaxaca, 1973) to determine how much of the Black disadvantage in exclusionary discipline can be attributed to differences in the districts in which Black and White students attend schools. In the counterfactual decomposition, we simulate the level of adverse disciplinary outcomes that we would expect Black students to experience if they exhibited sensitivities to the underlying covariates that are identical to those of White students. We decompose the discipline gap into two components: the component due to differences in the distribution of observed covariates by race (the “endowment effect”) and the component due to differential race-based sensitivities to the underlying covariates and other unobserved heterogeneity (the “coefficient effect”).
In Equation 4, Y indicates whether a student experiences any suspension/expulsion in a particular year. For the subsamples of Black students, denoted by subscript A, and White students, denoted by B, we obtain coefficient estimates

To determine the share of the racial discipline gap attributable to the nonrandom sorting of Black and White students across districts, we decompose each race gap into the portion that can be explained by differences in the covariates. We report the portion of each gap incrementally attributable to district fixed effects
Black-White Discipline Gap Decomposition Analysis (Based on Likelihood of Suspension/Expulsion as Dependent Variable)

Note. Discipline gap expressed as percentages in parentheses. Standard errors (not reported) are clustered at the district level to correct for heteroskedasticity and autocorrelation. pp = percentage points.
p < .05. ***p < .001.
Hispanic-White Discipline Gap Decomposition Analysis (Based on Likelihood of Suspension/Expulsion as Dependent Variable)

Note. Discipline gap expressed as percentages in parentheses. Standard errors (not reported) are clustered at the district level to correct for heteroskedasticity and autocorrelation. The raw discipline gap is close to zero for the prekindergarten-kindergarten level; therefore, we do not decompose the gap further into the endowment and coefficient effects. pp = percentage points.
p < .001.
We argue that there are two possible explanations for the contribution of the district fixed effects to the Black-White discipline gaps. The first explanation is that the gap is due to the disproportionate enrollment of Black students into districts with punitive disciplinary environments. The second possibility is that these estimated fixed effects subsume the influence of omitted, unobserved student and/or neighborhood attributes. Our models control for several characteristics. But if, for example, Black students exhibit higher behavioral problems than White students with similar disciplinary histories in ways that we have not observed but select into districts that place a high emphasis on exclusionary discipline, then the causal role of the district will be overestimated. We suspect that the true interpretation lies somewhere in between these two extremes. We also include supplemental district-level analyses to investigate how the effects of de facto segregation across (and within) districts may be associated with school disciplinary outcomes through mechanisms beyond simple racial and socioeconomic composition effects (see appendix for details). Note that we are unable to attribute directly the sources of racial gaps to the districts per se.
Additionally, our decompositions reveal that about a third of the Black-White discipline gap remains unexplained due to unobserved heterogeneity, even after controlling for multiple student-level characteristics. In other words, if Black students exhibited the same average characteristics as White students (i.e., if Black students were on average as poor and had comparable past disciplinary histories) and were exposed to schools (districts) exhibiting similar average characteristics, the observed Black-White gap would attenuate but would not be eliminated. We argue that this finding provides suggestive evidence of differential treatment discrimination, which may be subsumed in omitted variables not captured in the model. Relatedly, we argue that our specifications that account for multiple student-level characteristics provide an upper bound estimate of the endowment effect because the fixed effects also capture some time-invariant unobserved heterogeneity (also see Elder, Goddeeris, & Haider, 2010).
Conclusion and Policy Implications
Our analysis of statewide, administrative data in Indiana adds to the body of research on racial discipline gaps by focusing on six large cohorts of students across all grades in a large state. We precisely estimate disciplinary gaps for students in two minority groups and look beyond dichotomous measures of exclusionary discipline to uncover a more complicated pattern. Data limitations restrict the ability of many prior studies to investigate disparities across multiple measures of school discipline outcomes and estimate precise race-based discipline gaps.
We demonstrate that Black-White disciplinary gaps emerge as early as in prekindergarten, widen with grade progression, and persist even after controlling for an extensive set of student- and school-level characteristics. Our primary descriptive analysis reveals that between 2008–2009 and 2013–2014, more than 5% of Black children enrolled in Indiana prekindergarten or kindergarten programs experienced a suspension or expulsion, as opposed to about 1% of White children. This Black-White disparity continues to increase through high school, with approximately 34% of Black high school students experiencing a suspension/expulsion in any year, in contrast to 13% of White high school students. We find that the estimated Black-White discipline gaps attenuate by about half after including a comprehensive set of control variables and school or district fixed effects. Additionally, we find that while a student’s disciplinary history is an important determinant of the likelihood of future exclusionary discipline, it does not explain a large portion of the Black-White disciplinary gap.
Hispanic-White disciplinary gaps, while lower in magnitude across grade levels when compared with Black-White gaps, show minor increases across grade levels as well; however, almost all of the gaps can be explained by school or district fixed effects and student-level control variables. We view these findings as a substantive contribution to the literature given the conflicting data on Hispanic-White disciplinary gaps in prior studies.
We also identify a key mechanism underlying this disparity: the nonrandom sorting of Black students into school districts with higher suspension/expulsion rates. Is it then possible to achieve some reduction in Black-White discipline gaps by redistributing children across schools? Our estimates suggest that if Black students re-sorted into districts predominantly attended by White students in the state and received disciplinary sanctions at the average rates of those districts, the Black-White disciplinary gap would decline by 11% to 25% across grade levels. The uneven distribution of Black students across districts likely corresponds to the uneven distribution of resources, teacher quality, and other factors that are associated with adverse disciplinary outcomes. Furthermore, it is possible that minority students who attend schools with more minority (or poor) students exhibit similar behaviors but are treated differently. For example, schools with more minority and poor students may experience a larger presence of school resource officers, which may increase the likelihood of punitive disciplinary action conditional on behavior. Future research should also seek to understand the impact of peer effects on student misbehavior and subsequent disciplinary outcomes and whether those effects differ across race.
Nevertheless, as emphasized earlier, even if we were able to achieve such a re-sorting across schools, significant Black-White discipline gaps would persist within districts (schools). Our estimates suggest that even after controlling for individual characteristics, disciplinary history, school-level factors, and the district in which the student attends school, within-district Black-White discipline gaps remain across a range of outcomes. Although the magnitudes of these discipline gaps are larger for boys across grade levels, we observe similar patterns in covariate-adjusted and within-district gaps across gender. We also observe the pervasive nature of the Black-White discipline gaps within districts. For example, Black students are more likely than White students to ever be suspended/expelled or to receive multiple suspensions. Furthermore, Black students are likely to receive longer suspensions and expulsions unconditionally as well as conditional on being suspended; this finding persists across models with and without additional controls for the number of prior disciplinary infractions.
Despite extensive covariate adjustment, about a third of the observed Black-White discipline gap remains unexplained due to unobserved heterogeneity. One potentially important source of unobserved heterogeneity is student behavior. Unfortunately, our data do not capture information on student behavior, and so we are unable to examine whether disciplinary gaps may be attributed to actual differences in student behavior. Such data on objective measures of student behavior are rarely available for research. Thus, we recommend that schools and districts implement improved, innovative data collection techniques that will allow administrators and researchers to examine how differences in student behavior contribute to observed discipline gaps. For example, researchers could access the corpus of classroom video collections available from the Measures of Effective Teaching project to develop objective measures of student behavior as well as the ways in which teachers and administrators translate those behaviors to infractions that result in exclusionary discipline.
What policy prescriptions can we recommend to schools, districts, and states given our empirical analysis? First, our analysis reveals considerable heterogeneity across grade levels in the magnitude of race-based disciplinary gaps—a finding that we hope will inform the design and focus of future interventions and policy reforms aimed at reducing punitive disciplinary practices. Given the emergence of Black-White gaps in exclusionary discipline as early as in prekindergarten—a significant portion of which can be attributed to racial sorting across districts in early grade levels—standardization of disciplinary policies that limit the use of exclusionary discipline at lower grade levels across the state could lead to meaningful reductions in exclusionary disciplinary rates for all students and especially Black students attending school in highly punitive districts. For example, several states and school districts (e.g., Texas, District of Columbia, Denver, Michigan, and Chicago Public Schools) have introduced policies to eliminate exclusionary discipline at lower grade levels; such policies could be adopted more widely.
Second, at higher grade levels, we recommend reenvisioning school discipline. For example, it may be beneficial to enact policy-level changes that limit the use of exclusionary discipline to serious violations only, in addition to providing targeted supports to build alternative restorative justice programs within schools and districts exhibiting high exclusionary discipline rates. We draw on our empirical results regarding cross-district variation in exclusionary discipline as well as the growing literature on these topics to motivate these policy implications. For example, when the School District of Philadelphia banned the use of exclusionary discipline district-wide, researchers observed poor fidelity in implementing this policy, especially in disadvantaged schools with high minority student compositions. As a result, these policies resulted in minimal impacts on racial discipline gaps (Steinberg & Lacoe, 2018). Thus, policy reforms must be accompanied by robust monitoring of implementation fidelity as well as supports to ensure that teachers and school administrators use alternatives to punitive disciplinary practices. Professional development for teachers and administrators must strive to include evidence-based, restorative justice programs that are theoretically informed and appreciate the inherent complexity of this issue (Welsh & Little, 2018).
Third, none of our models provide evidence against the potential presence of differential treatment discrimination, which may arise due to the differential response of teachers and school administrators to behaviors of Black students. Given that about a third of the Black-White discipline gap remains unexplained even after extensive covariate adjustment, policy makers must continue investigating potential cases of differential treatment discrimination within schools and districts. Future research should also strive to disentangle the potentially differential mechanisms that may drive racial disparities in school discipline across students of different minority races differentially, given our findings regarding the low magnitudes of Hispanic-White discipline gaps.
Finally, continued collection and dissemination of robust, disaggregated, student-level data on disciplinary outcomes is paramount to move research forward in this area. In all, policy prescriptions must embrace the complexity of cross- and within-school (district) Black-White disciplinary gaps. As we point out throughout our article, potential sources of racial discrimination exist within as well as across schools and districts. Therefore, a more pragmatic approach would be to understand the sources of these observed racial disparities and design policy prescriptions and interventions that go beyond a one-size-fits-all approach.
Footnotes
Appendix
1.
The race variable included in the administrative data contains a nonmissing value for nearly all student observations. However, we cannot identify the multiple races/ethnicities of multiracial students, so we classify multiracial students into the “other” race category.
2.
The latest school guidelines for reporting data on exclusionary discipline can be found at the following IDOE website: https://learningconnection.doe.in.gov/Library/FilingCabinet/ViewFileDetail.aspx?lfid=80366&et=USER_GROUP&eid=975&clid=&ret=~%2fUserGroup%2fGroupDetailFileBookmarks.aspx%3fgid%3d975%26ugfid%3d4504
3.
We explore alternative model specifications with outcome variables defined to capture multiple suspensions/expulsion (likelihood of receiving multiple suspensions or expulsions in a year and a count variable indicating number of suspensions/expulsions in a year as alternative dependent variables in Table 3 and Appendix ![]() ). Additionally, we explore outcome variables defined in a variety of ways: as any suspension, any out-of-school suspension, any expulsion, and duration of adverse disciplinary outcomes, in days, of suspensions, out-of-school suspensions, and expulsions. The results are qualitatively similar and are available upon request.
). Additionally, we explore outcome variables defined in a variety of ways: as any suspension, any out-of-school suspension, any expulsion, and duration of adverse disciplinary outcomes, in days, of suspensions, out-of-school suspensions, and expulsions. The results are qualitatively similar and are available upon request.
4.
Another common measure of segregation used in past literature is the dissimilarity index of segregation, which measures spatial segregation and is usually interpreted as the proportion of a minority group that would need to hypothetically move to create a uniform distribution of the overall population. Therefore, the dissimilarity index is an aggregate measure calculated for a higher-order unit, such as city or state, based on racial composition in the lower-order units, such as census tracts or counties within the city or state. For example, in our sample, the Black-White dissimilarity index of segregation for students in Indiana is 0.64—which means that 64% of Black students would need to move across districts to achieve a uniform distribution of Black and White students in each district in Indiana. Given that this is an aggregate measure for the state, it cannot be used in the district- or student-level regressions as there is no variation across students within districts. Alternatively, we could calculate the dissimilarity index for each school district by analyzing the within-district dissimilarity index using variation across schools. However, we need to have enough schools within districts (at least five based on suggestions in prior literature) as well as a minimum number of students (overall as well as within each racial category) in those schools for meaningful interpretation. Hence, we have not included the district-level dissimilarity index in the regressions.
5.
From a theoretical perspective, several reasons have been put forth in the larger literature regarding why we might expect age-level differences in discipline and, specifically, larger racial disciplinary gaps at higher grades. For example, Goff et al. (2014) found that Black boys are viewed as older and less innocent than their White peers. Developmentally speaking, we also expect that teenagers may be more likely to question authority and that harsher disciplinary sanctions may be more prevalent in high school. Our study finds higher rates of exclusionary discipline and wider racial disciplinary disparities at higher grade levels.
6.
We believe that the most parsimonious model specification is the one with race indicators and year fixed effects only, carried out separately by grade level. The results are near identical when we include grade fixed effects in addition to year fixed effects in the elementary, middle, and high school baseline models (see Appendix ![]() ).
).
7.
Our lagged measures of disciplinary history can be considered a noisy proxy for behavioral differences. In the appendix, we show the decompositions without the inclusion of the past disciplinary history variable and for subsamples of male students as additional robustness checks. As mentioned, while the disciplinary history of a student positively predicts exclusionary disciplinary outcomes, it explains only between 0% to 3% of observed Black-White discipline gaps (we obtain this figure by comparing the endowment effects estimated with and without past disciplinary history variables; see Appendix ![]() ).
).
8.
Note that the race coefficients in our models cannot be interpreted as evidence of the causal effect of race on adverse disciplinary outcomes. Our models do not account for omitted variables that may be correlated with race and adverse disciplinary outcomes (e.g., the models do not account for time-invariant features of districts or schools, although students sort nonrandomly into district and school environments that differentially affect their disciplinary outcomes). Thus, those sources of unobserved variation reside in the error term and bias the estimated model coefficients.
9.
Appendix ![]() reports racial gaps estimated for 10th, 11th, and 12th graders separately. We find decreasing race-based gaps at higher grade levels within the high school model. Note that, on average, across the years in our sample, the share of Black students decreases from 14% in the 9th grade to 11% in the 12th grade. Similarly, the share of Hispanic students decreases from 7% to 5%. These patterns are suggestive of differential rates of dropout behavior among minority students.
reports racial gaps estimated for 10th, 11th, and 12th graders separately. We find decreasing race-based gaps at higher grade levels within the high school model. Note that, on average, across the years in our sample, the share of Black students decreases from 14% in the 9th grade to 11% in the 12th grade. Similarly, the share of Hispanic students decreases from 7% to 5%. These patterns are suggestive of differential rates of dropout behavior among minority students.
10.
Strict “no excuses” disciplinary policies in charter schools and high levels of exclusionary discipline in charter schools are a topic of ongoing scholarly and policy interest. An in-depth exploration of disciplinary outcomes in charter schools is beyond the scope of this article. However, we find that, at least in Indiana, high exclusionary discipline and high racial discipline gaps do not seem to be driven exclusively by charter schools.
Authors
MAITHREYI GOPALAN is an assistant professor at The Pennsylvania State University. Her research examines the causes and consequences of racial and socioeconomic disparities in student outcomes through interdisciplinary perspectives.
ASHLYN AIKO NELSON is an associate professor at the O’Neill School of Public and Environmental Affairs, Indiana University- Bloomington. Her research examines the causes and consequences of inequality in the overlapping housing and public education sectors.