
Abstract
African American students continue to be suspended at rates disproportionate to same-aged peers. The purpose of this study is to use empirical evidence to determine the associated influence of restorative justice (RJ) on a large urban district by studying discipline gap data for the 3 years before and after implementation. Results of the study indicate that since the implementation of RJ in the SFUSD, there has been a significant decrease in expulsions, but not in suspensions. Suspensions for African American students at the end of the 3-year implementation period mirrored the suspension rate reported the year before implementation.
Keywords
The Implementation of Restorative Justice Practices: What Does Six Years of Data Reveal About the Changes in the Reported Discipline Rates for African American Students?
Over the past several decades, the national rise in suspensions and expulsions has prompted a laser focus on school-wide discipline practices and procedures, as well as their subsequent impact on students. Legislation such as the Gun Free School Act of 1994 led to zero-tolerance policies that have disproportionately impacted students of poverty, students of color, and students with disabilities (Gowdey, 2015). Achievement rates, truancy rates, graduation rates, college readiness, and involvement with the juvenile justice system are a few of the effects examined in conjunction with different philosophies on discipline. Current research on the impact of exclusion from school acted as a catalyst to the 2014 “Dear Colleague” letter issued by the DOJ (2014) and DOE, Office for Civil Rights (2014). In it, schools were urged to take immediate and effective measures to reduce disparities in suspension rates.
As a result of positive behavior intervention and support frameworks, RJ practices and comprehensive threat assessment procedures have begun to emerge to reduce not only the disparities in discipline data but the exclusion of any student from his or her educational setting. More recently, research has begun to examine differences between states, districts, and schools that have succeeded in reducing exclusionary discipline practices and subgroup disparities, and those who have not (e.g., Augustine et al., 2018; Hantzopoulos, 2013; Hashim et al., 2018). Despite the work of these researchers, there is little information on the impact of RJ in reducing the discipline gap for students of color in K-12 public school settings in the United States. To take seriously the need to reduce exclusionary discipline practices, especially for our most fragile of subgroups, more research needs to examine if RJ reduces the discipline gap for African American students.
History of Restorative Justice
RJ has been defined, in both criminal justice and educational literature, as an approach to punishment that differs from most traditional systems of justice that focus primarily on rehabilitation, retribution, or both (Goodstein & Aquino, 2010). In contrast, RJ views wrongdoings as the violation of relationships between people as well as the violation of rules or laws (Goodstein & Aquino, 2010).
The history of RJ can be linked back to the practices of Native Americans, First Nation, and other Indigenous People of North America. It has also been implemented successfully in New Zealand and Australia. In New Zealand, for example, the use of RJ practices led to a 75% decrease in court cases in 4 years, and an 18 to two reduction in New Zealand’s Juvenile Court institutions (Cameron & Thorsborne, 1999). When it comes to the use of RJ in school settings, most researchers agree that Queensland, Australia, utilized the practice as far back as 1994. Due to the results of its use, and the pilot studies that followed indicating that despite some tensions between those with a traditional philosophy on discipline and those advocating for RJ, participants felt it was fair and were satisfied overall with the experience (Cameron & Thorsborne, 1999). As of 2005, approximately 773 RJ programs have been identified across the United States leading to increased collaboration and coordination between schools and juvenile justice systems (Schiff & Bazemore, 2008). In the societies, the focus of justice was one of healing and reintegration into the community through the bringing together of victims, offenders, and their respective supporters to resolve a problem and restore harmony and balance (Mirsky, 2006). In the school setting, this leads to offenses treated as teachable moments rather than actions requiring punishment and retribution.
To successfully implement a system of RJ, however, all stakeholders must be allowed to be heard and participate in the decision-making process. Otherwise, it fails to prevent domination or the silencing of one group or person by a more vocal or dominant group (Braithwaite, 2002). One form of domination that must be managed for restorative justice to work effectively in schools is the idea of an imbalance of power. In other words, adults must advocate for students and student voices must not be drowned out by adults or adult policies (Braithwaite, 2002; Hantzopoulos, 2013).
When implemented effectively, some theorists contend that the use of RJ practices helps address “power and status imbalances” that shape students’ perceptions of the fairness and legitimacy of discipline in schools (Morrison & Vaandering, 2012, p. 146). This legitimacy can then lead to a reduction in future infractions (Sherman, 1993).
Initial research completed regarding RJ practices in public schools in the United States has been promising. A study of RJ practices in Illinois schools resulted in a decrease in detention rates and second-time offenses (Gonzalez, 2012, p. 309). In Oregon, a 3-year pilot of RJ practices in schools led to the avoidance of 179 days of out-of-school suspension (p. 310), while in Maryland, RJ was applauded as the key to an 88% decrease in the suspension rate (Gonzalez, 2012, p. 312). Lansing, Michigan, schools reported a 15% decrease in suspensions during RJ’s pilot year, and over 1600 days of out-of-school suspensions were avoided to date (Gonzalez, 2012, p. 313). Decreases in physical aggression, suspensions, and expulsions were evident in four districts in Minnesota after they applied for a $300,000, 3-year grant for initiatives dedicated to finding alternatives to exclusionary disciplinary practices (Gonzalez, 2012, p. 313). Promising results from RJ frameworks were also noted in New Mexico, Pennsylvania, Virginia, and Missouri (Gonzalez, 2012).
More recent research regarding RJ in public schools in the United States all concluded that the use of RJ led to better relationships and better communications between staff and students resulting in more positive feelings about school climate (Augustine et al., 2018; Crowe, 2018; Waggoner, 2018). A study focusing on four high schools in Chicago reported that out-of-school suspensions were 30% less for students who used the “Peace Room” wherein RJ was practiced, when compared to students who did not (Rich et al., 2017, p. 25). An examination of RJ in the Los Angeles Unified School District found a reduction in suspension gaps between frequently disciplined students and less disciplined students but noted that disciplined gaps still existed between African American students and Caucasian students as well as between students with disabilities and their non-disabled peers (Hashim et al., 2018). A 2018 study focusing on students with disabilities in urban high schools on the west coast noted that the use of RJ resulted in a decline in the use of zero-tolerance, in addition to improved student-staff relationships and improved perceptions of school climate. In Pittsburgh, a 2-year study conducted by the RAND Corporation found that suspensions were significantly reduced and the discipline gap between African American and Caucasian students improved in the elementary schools studied (Augustine et al.). Somewhat surprising, however, was that the use of RJ was determined to have no significant impact on the middle school students studied in Pittsburgh, nor did it influence academic achievement (Augustine et al.). Feelings of improved relationships with students were noted by 63% of teachers, administrators, and other school personnel at all grade levels involved in the study.
The Impact of Zero-Tolerance Policies in Schools
The use of retributive justice practices in America’s schools was exacerbated by zero-tolerance policies dating back to the late 1980s, as well as the passage of the GFSA of 1994. Prompted by President Clinton and the threat of losing federal funding, America’s public schools were forced to create and implement policies requiring mandatory expulsions for students bringing weapons to school (Robbins, 2005). Despite provisions within the legislation also calling for conflict resolution, mediation, and counseling, the primary result of the GFSA of 1994 was an increase in the suspension and expulsion of students; especially students of color and students with disabilities (Gowdey, 2015). Many of the unintended consequences of the GFSA of 1994 were due in part to its subsequent amendments. In 1995, for example, the GFSA of 1994 was amended to change the word firearm to the word weapon, thus opening the door for mandatory expulsions in incidents not involving guns (Casella, 2003). Two years later, another amendment permitted expulsions for students having drugs and/or drug paraphernalia (Casella, 2003). As a result, a law meant to protect students and staff members from the dangers of guns was utilized to expel students for being caught with nail files, pocket knives, aspirin, fighting, and truancy, and, in the state of Michigan, for wearing stilettos (McNeal & Dunbar, 2010).
The Exclusion of African American Students
Academically, there is a well-documented pattern of African American students scoring lower than their Caucasian peers on standardized reading and math tests since the 1970s (Gregory et al., 2010; Hemphill et al., 2011; Slavin & Madden, 2006; Townsend Walker, 2014). This trend continues today. According to the National Center for Education Statistics (NCES), Caucasian students scored higher than African American students by an average of 20 points in reading and math in both 2009 and 2011. A more recent report analyzing 12th grade math and reading assessment scores indicated a 30-point difference in math scores and a 29-point difference in reading scores between Caucasian students and African American students. A 2016 report analyzing nationwide Science scores highlighted a 33-point gap in achievement among fourth graders, a 34-point gap among eighth graders, and a 35-point gap among 12th graders (NCES, 2016). Perhaps most interesting is an NCES report that looked at the achievement gap in both “high density” schools and “low density” schools. Results of the study indicated that the achievement gap between African American students and Caucasian students remained the same no matter the density of the school. Therefore, African American students who attend primarily Caucasian schools still lag significantly behind in both reading and math (Bohrnstedt et al., 2015, p. 1).
The exclusion of African American students from school using suspension has been noted since The Children’s Defense Fund (1975) reported their over-representation in a 1975 report. At that time, African American students were overrepresented in discipline data by two to three times than that of Caucasian peers. A longitudinal study conducted by Elliott et al. (1978, 1979, 1980), around the same time, measured the number of self-reported delinquent acts by sex, race, class, and age. Results of the study indicated no significant difference in the number of delinquent acts within the past year between Caucasians and African Americans, yet suspension rates for African Americans were double that of their Caucasian peers.
The pattern of disproportionate discipline for African American students continued well into the 21st century (Gregory et al., 2010; Long, 2015; Losen et al., 2015; Monroe, 2006; Skiba et al., 2011; Vincent et al., 2012; Welch & Payne, 2010). While suspension and expulsion rates for other racial and ethnic subgroups remained steady in the era of zero-tolerance, African American students saw an increase in exclusionary practices from 1991 to 2005 (Wallace et al., 2008). The National Association for the Advancement of Colored People (NAACP) Legal Defense and Education Fund indicated, in 2005 that, although African American students accounted for 17.1% of public school students, they comprised 37.4% of total suspensions and 37.9% of total expulsions. The disparate suspension data are supported by a 2008 nationally representative survey of 10th grade students in which 50% of African American students and 20% of Caucasian students reported having been suspended at some point during their educational career (Wallace et al.). One possible explanation for this phenomenon was that minority students are suspended more often for subjective behaviors or behaviors that require discretionary judgment from teachers and administrators (i.e. threatening behavior, excessive noise, and disrespect), while Caucasian students are suspended more for objective school rule violations such as smoking and fighting (Dupper & Bosch, 1996; Gowdey, 2015; Gregory & Weinstein, 2008; Skiba et al., 2002; Skiba & Knesting, 2001). The impact of disproportionate discipline lasts well beyond the length of one’s educational career.
The Impact of Exclusion
Positive school climate has long been positively associated with school success and school achievement (Hoy & Hannum, 1997; Loukas & Robinson, 2004). In schools with significant discipline gaps, however, African American students reported feelings of less school equity and less school belonging (Bottiani et al., 2017). These negative feelings manifest into concerns surrounding trust and lead to an unwillingness on the part of African American students to seek help from teachers, further decreasing the odds of school success (Shirley & Cornell, 2012).
Another consequence of disproportionate discipline for African American students is an increase in dropout rates. The National Association of School Psychologists (2013) directly correlated dropout rates with the repeated use of suspensions and expulsions in 2006. Research conducted by the Advancement Project (2010) supported this claim by correlating high rates of suspensions and expulsions with poor rates of academic performance, eventually leading to dropping out. The most recent National Center for NCES data on high school graduation rates from the 2015–2016 school year boosts the highest overall rates of graduation since it was first measured in 2010–2011. The overall graduation rate was 84%, however, the graduation rate for African American students was 76%, a full 12% lower than Caucasian students (2017).
The Cost of Exclusion
In addition to the moral and ethical implications involved in the disproportionate discipline of African Americans, there are financial implications for taxpayers as well. According to Henrichson and Delaney (2012), 39 billion dollars required by prisons in the United States fell outside of their correctional budgets; eventually falling on the backs of taxpayers (p. 69). Depending on individual states, the per-inmate cost can range from approximately $15, 000 to approximately $60,000 (Henrichson & Delaney, 2012, p. 70). This figure, calculated by VERA Institute of Justice, included only direct costs to taxpayers such as retiree healthcare, employee benefits and taxes, health and hospital care for inmates, and pension contributions. Of the 40 states that participated in the study, California taxpayers incurred the greatest cost of prisons: $7,932,388. They are followed by New York ($3,588,711), Texas ($3,306,358), and Florida ($2,082,531) (Henrichson and Delaney, 2012, p. 72). Collateral or indirect costs to communities such as the cost of social services, child welfare, and education were not calculated, but also have a significant impact on taxpayers (Henrichson & Delaney, 2012).
The current investigation compares expulsion and suspension data for the San Francisco Unified School district during the 3 years before the use of RJ practices, and the 3 years after utilizing RJ practices. Public record information regarding discipline data is used to determine the effectiveness of RJ programs. This approach was chosen over a qualitative study due to the dearth of known quantitative research on the effectiveness of RJ on students with disabilities in public schools in the United States. Most of the existing research focuses on RJ in other countries, RJ in the criminal justice system, and the use of RJ in Native American culture (Braithwaite, 2002; Cameron & Thorsborne, 1999; Mirsky, 2006; Morrison, 2002.) Although some studies have focused on the use of RJ in public schools in the United States, none have focused, primarily, on the impact of RJ on African American students (Gonzalez, 2012).
In February 2014, the SFUSD passed a board resolution supporting the full implementation of both restorative practices and SWPBIS. The current investigation focuses on RJ, and not SWPBIS.SWPBIS is expected to have a positive impact on students if it is implemented with fidelity (Heidelburg et al., 2021; (McIntosh et al., 2018). Understanding the implementation of SWPBIS is not possible with the publicly available data. RJ is, by nature, a system focused on healing after a discretion occurs, and therefore is implemented at the Tier II and Tier III levels. Since students of color are suspended and expelled at a rate disproportionate to their Caucasian peers, RJ is most likely to have an impact on students of color. As a basis for the enactment, the district cited information from various studies regarding the link between exclusionary practices and dropout rates as well as interactions with the criminal justice system. The district also cited the American Academy of Pediatrics (2013) report that called suspensions and expulsions counter-productive to the overall goal of reducing problematic behaviors. Within the resolution, it was noted that although African American students comprised only 10% of the district’s population in 2012–2013, they comprised almost 50% of all suspensions and expulsions. In addition, the resolution noted that African American high school students in the SFUSD missed “an average of 19 more instructional days than their peers annually.” Other interesting notations within the resolution addressed the fact that the category of “willful defiance” was the justification of 81% of all SFUSD suspensions for Latino and African American students for the 2012–2013 school year (SFUSD, 2014; SFUSD 2014 Meeting Archives. P. 2).
This information acquired from the SFUSD website confirmed that the full implementation of RJ, in addition to SWPBIS during the 2014–2015 school year, was aimed at specifically reducing suspensions and expulsions for African American and Latino students.
The implementation process at SFUSD focused on “a response to and prevention of harm,” equitable decision-making, positive school culture, and building a sense of safety and belonging (p.7). A continuum of RP was utilized in the district ranging from informal, Tier I practice such as affective statements and restorative questions to more formal Tier III practices like responsive circles and restorative meetings and conferences. According to the district website, the more formal the restorative practice the more time, planning, and people are needed to facilitate its implementation. More formal practices also require a more structured setup that allows for conferencing and re-entry.
The implementation of RP occurred at every building simultaneously according to the district’s “Restorative Practices Whole School Implementation Guide.” Each site created a RP team that consisted of a School Site Administrator, two RP site leaders, a RP parent leader, an after-school program coordinator, a classroom teacher, a non-teaching staff member, and representation from any other major school-wide stakeholder. Members of the team met multiple times per month and helped to lead building-wide professional development on RP. The professional development was delivered in two stages, each of which had four steps. The first stage involved introducing staff to the concept of RP, collecting information regarding individualized school climate and school needs, and determining preferred building-wide outcomes. The second stage involved professional development on restorative questions, restorative circles, determining systems of support within the practices, and determining progress checks for RP implementation.
As such, the current investigation will focus on addressing the following research questions:
1. How much did the introduction of restorative justice practices coincide with change in the suspension and expulsion rates of African American students?
2. How much did the introduction of restorative justice practices coincide with change in the size of discipline gap between African American students and Caucasian students?
3. At what educational level (elementary, middle, high school) are the introduction of restorative justice practices associated with the greatest change?
Specifically, this causal-comparative investigation used existing data pre-and post-implementation of RJ to see what changes if any occurred in the number of suspensions and expulsions, based on data provided by the SFUSD. Since SFUSD implemented district-wide policy implementing restorative justice practices in 2014, were these district-wide changes associated with frequency of suspensions, expulsions, for different student groups, and students at different educational levels (i.e. elementary, middle school, high school)? The hypothesis of the current investigation is that of the introduction of RJ will be associated with a reduction in expulsions and suspensions for African American students.
Methods
Sampling, Setting, and Participant Data
The SFUSD is home to n = 48,194 K-12 students in 100 schools. This does not include students in Pre-K, students in county units, students in continuation schools, or students in charter schools. The district employs over 10,000 individuals, about 3500 of which are teachers. Student demographics include: 35% Asian, 27% Latino, 15% Caucasian, 7% African American, 5% Filipino, 5% Multi-Racial, 5% declined to respond, 1% Pacific Islander, and <1% American Indian. Over half of the students in the SFUSD are poor and nearly 30% are English Language Learners (ELL). Despite making up only 7% of the district’s population, African American students have a 10% dropout rate. The dropout rate for Latino students is 15%, while the dropout rate for Caucasian students (11%).
Instrumentation
All public school disciplinary data for the years 2012 through 2018 was extracted from the California Department of Education’s (CDE) website. A systematic random sample of elementary schools was performed to acquire a sample of elementary schools relatively equivalent to the number of middle and high schools. The school levels were coded by level with two indicating high schools, 1 indicating middle schools, and 0 indicating elementary schools. Otherwise, the data was used in the form extracted from the CDE website. All available data for the middle schools and high schools that were available were used.
Procedures
After approval by the Youngstown State University (YSU) Institutional Review Board (IRB), pre-existing public data were downloaded from California state databases and/or the DOE Office of Civil Rights (2014) that are public and openly accessible. Data were extracted from the publicly available data, 3 years before the full implementation of RJ and for the 3 years after the full implementation of RJ: school years 2014–2015 through 2017–2018. General Linear Modeling (GLM) was utilized to determine whether a difference, if any, existed between the pre-and post-implementation of RJ and the suspension and/or expulsion of African American students. While Hispanic students were not a focus of this investigation, they were a focus of the San Francisco Unified School District’s effort to reduce suspensions and expulsions according to information published by the district at the time of implementation.
General linear modeling, using a fixed factor analysis, was used to answer the three research questions. The criterion variable for the analysis was the reported number of expulsions or suspensions; the predictor variables were the race of the students (African American, Caucasian, and Hispanic), academic level (elementary, middle school, and high school), and time. Time, which indicated the years before and after the implementation of RJ, was centered so that the first year of implementation began at zero. Centering was accomplished by subtracting the reported year from “2015.” Therefore, the 2015 school year is indicated with a “zero” value. The assumptions of the general linear model analyses are assumed tenable for all models, due to the large sample size (Tabachnick & Fidell, 2007). Variables were included in separate general linear models to specifically address each research question independently, as described in Chapter Four. The last research question was answered by computing the proportions of students and faculty represented in each racial group identified in the reported data.
Results
School year data was then centered so that data could be examined for the 3 years before the implementation of RJ and the 3 years following the use of RJ. A total of n=3062 schools provided expulsion and n=3065 schools reported suspension data. Table 1 Provides the frequency of schools represented across the three varying academic levels.
Number of Schools by Level.
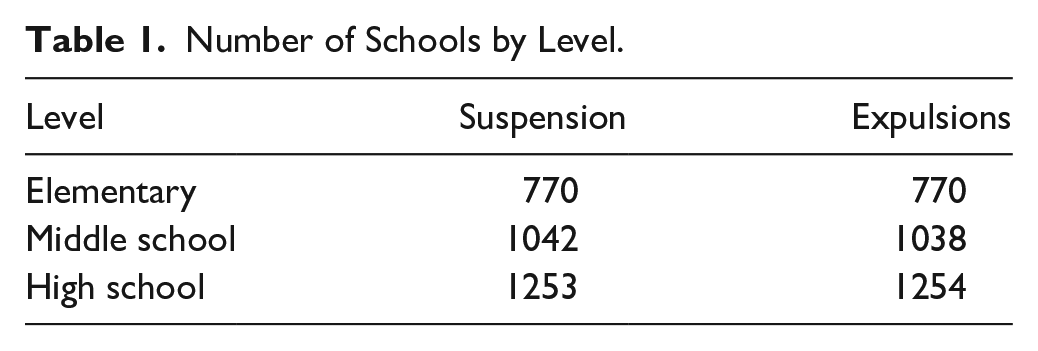
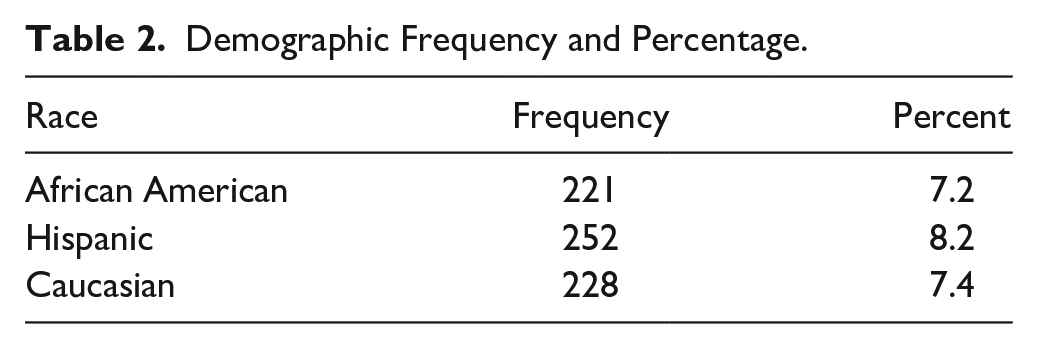
As indicated above, the greatest numbers of schools represented were at the high school level, followed by the middle school level, and then the elementary school level. Table 2 Provides the frequency of school level cases that also provided data by race.
Demographic Frequency and Percentage.
Research Question 1
Research question one asked how much did the introduction of restorative justice practices coincided with a change in the suspension and expulsion rates of African American students? Figure 1 provides a visual representation of expulsion data for African American students at all levels during the 3 years before the implementation of RJ and the 3 years after the implementation of RJ.
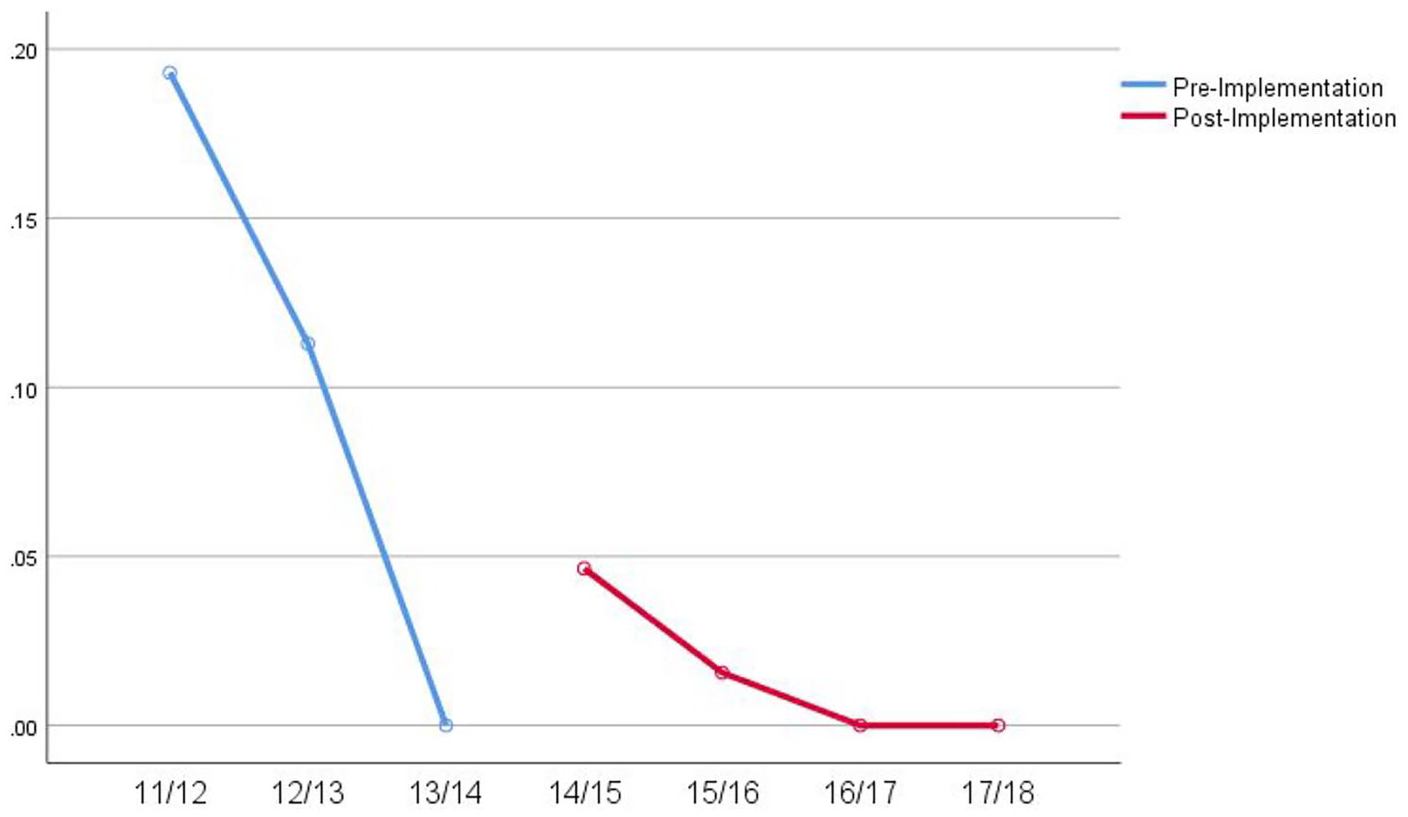
Pre-to Post-RJ implementation at SFUSD (n = 206).
As seen in Figure 1, before the implementation of RJ (blue line) the trend in expulsions was dropping. While post-RJ implementation reveals a small increase in the frequency, this increase is not practically significant. Results of the GLM analyses indicate that the frequency of expulsions did significantly change pre to post-implementation when examining data reported for all African American students in grades K-12, F (5, 200)=2.84, p = .017. Figure 2 represents suspension data for African American students in the 3 years before the implementation of RJ and the 3 years after the implementation of RJ.
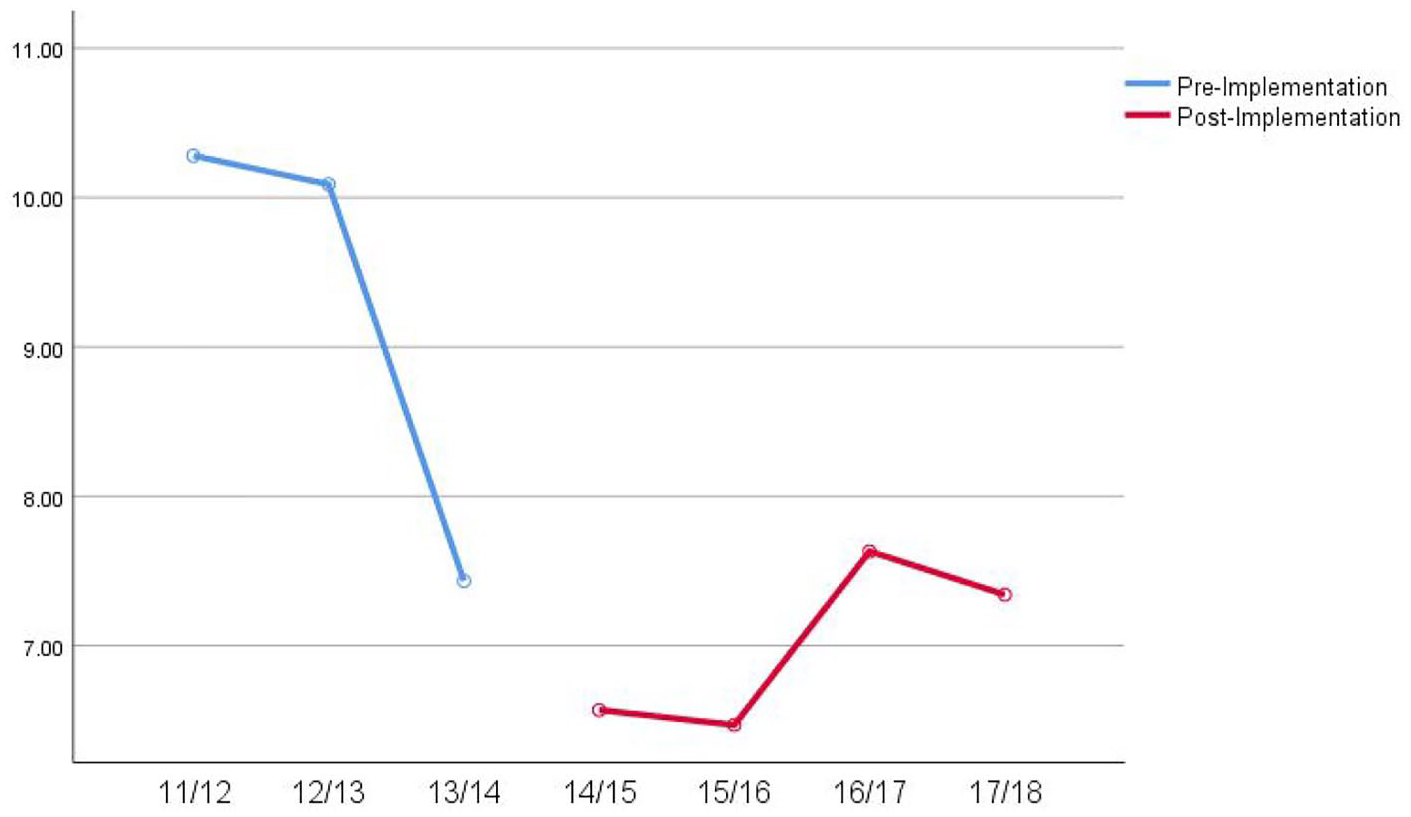
Suspension data, pre-to Post-RJ implementation for African American students (n = 206).
As indicated above, there was a sharp decline in the reported suspensions (blue) before RJ implementation, and the rates remained lower after post-RJ implementation (red). Results of the GLM analyses indicate that the frequency of suspensions did not significantly decrease when examining data reported for all African American students in grades K-12, F (5, 200)=.273, p = 928. Practically speaking, the average number of suspensions from the year before implementation and the years following implementation was neither meaningful nor significant.
Research Question 2
Research question two asked how much did the introduction of restorative justice practices coincided with a change in the size of the discipline gap between African American students and Caucasian students? Figure 3 Provides a graphical image of the reported expulsions for African American and Caucasian students pre-to post-RJ implementation.

Expulsion data, pre-to Post-RJ implementation, African American students relative to Caucasian (n = 441).
As indicated above, there is a drop in the reported expulsions for the African American students (blue line) before the implementation of RJ, while the rate for Caucasian students remains relatively consistent, although on a slight downward trend pre-to post-implementation. Results of the GLM analyses indicate that the frequency gap between African American and Caucasian students’ expulsions, pre-to post-RJ implementation is significant, F (5, 435)=3.89, p = .002. Specifically, the implementation of RJ significantly reduced the expulsion data of African American students, therefore minimizing the gap after RJ implementation.
Figure 4 Provides a graphical image of the reported suspensions for African American and Caucasian students pre-to post-RJ implementation.
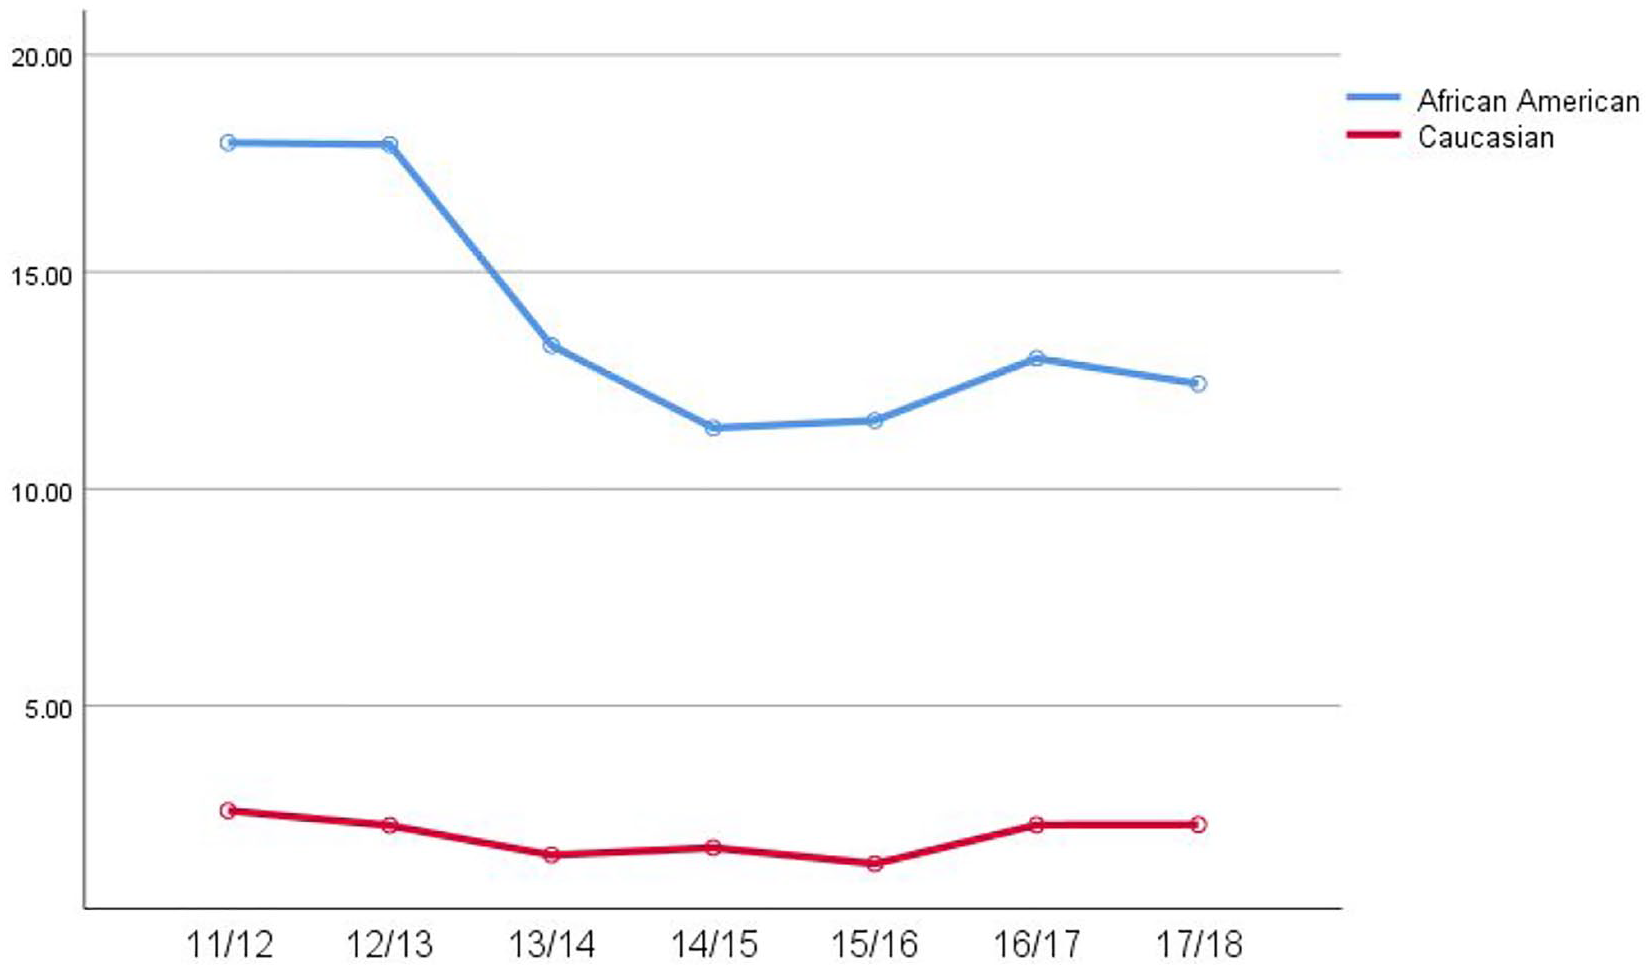
African American and Caucasian suspensions, pre-to Post-RJ implementation (n = 413).
As seen above, the rate of suspensions for the African American students (blue line) trends higher than the rate of suspension for the Caucasian students (red line). Results of the GLM analyses indicate that the gap between African American and Caucasian students’ frequency of suspensions, pre-to post-RJ implementation, is not significant, F (5, 407) =.191, p = .966. While there is a small reduction in the gap, the differences between the frequencies of suspensions are statistically significant for African American students relative to Caucasian students across all years F (5, 407)=96.46, p <.001. Although a reduction in the suspension gap is not statistically significant, the pre-to post-implementation data does show a decline in suspensions for African American students.
Research Question 3
Research question three examined at what educational level (elementary, middle, high school) is the introduction of restorative justice practices associated with the greatest change when examining the rates for all students? Figure 5 Provides a graphical representation of these trends.
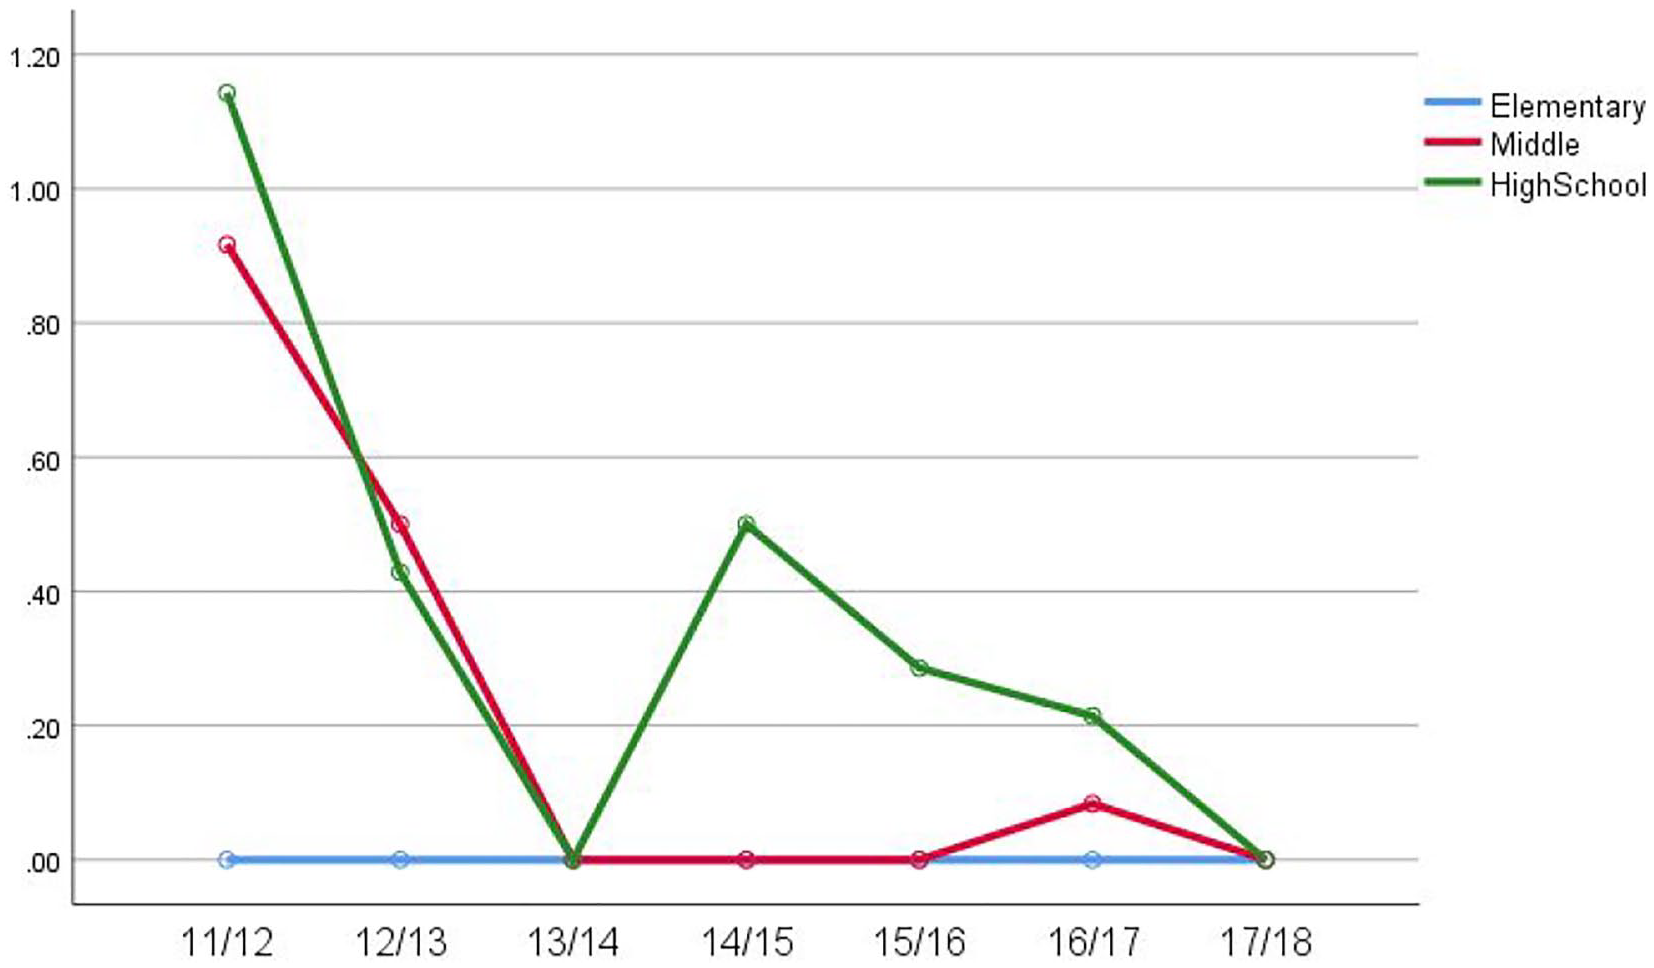
Trends in expulsion data across all student (n = 3422).
Results of the general linear modeling analyses indicate that the association of RJ with the different academic levels is significantly different when examining the data pre- to post-RJ implementation on expulsions, F (10, 3401)=6.54,p < .001. Figure 6 illustrates suspension data by school level.
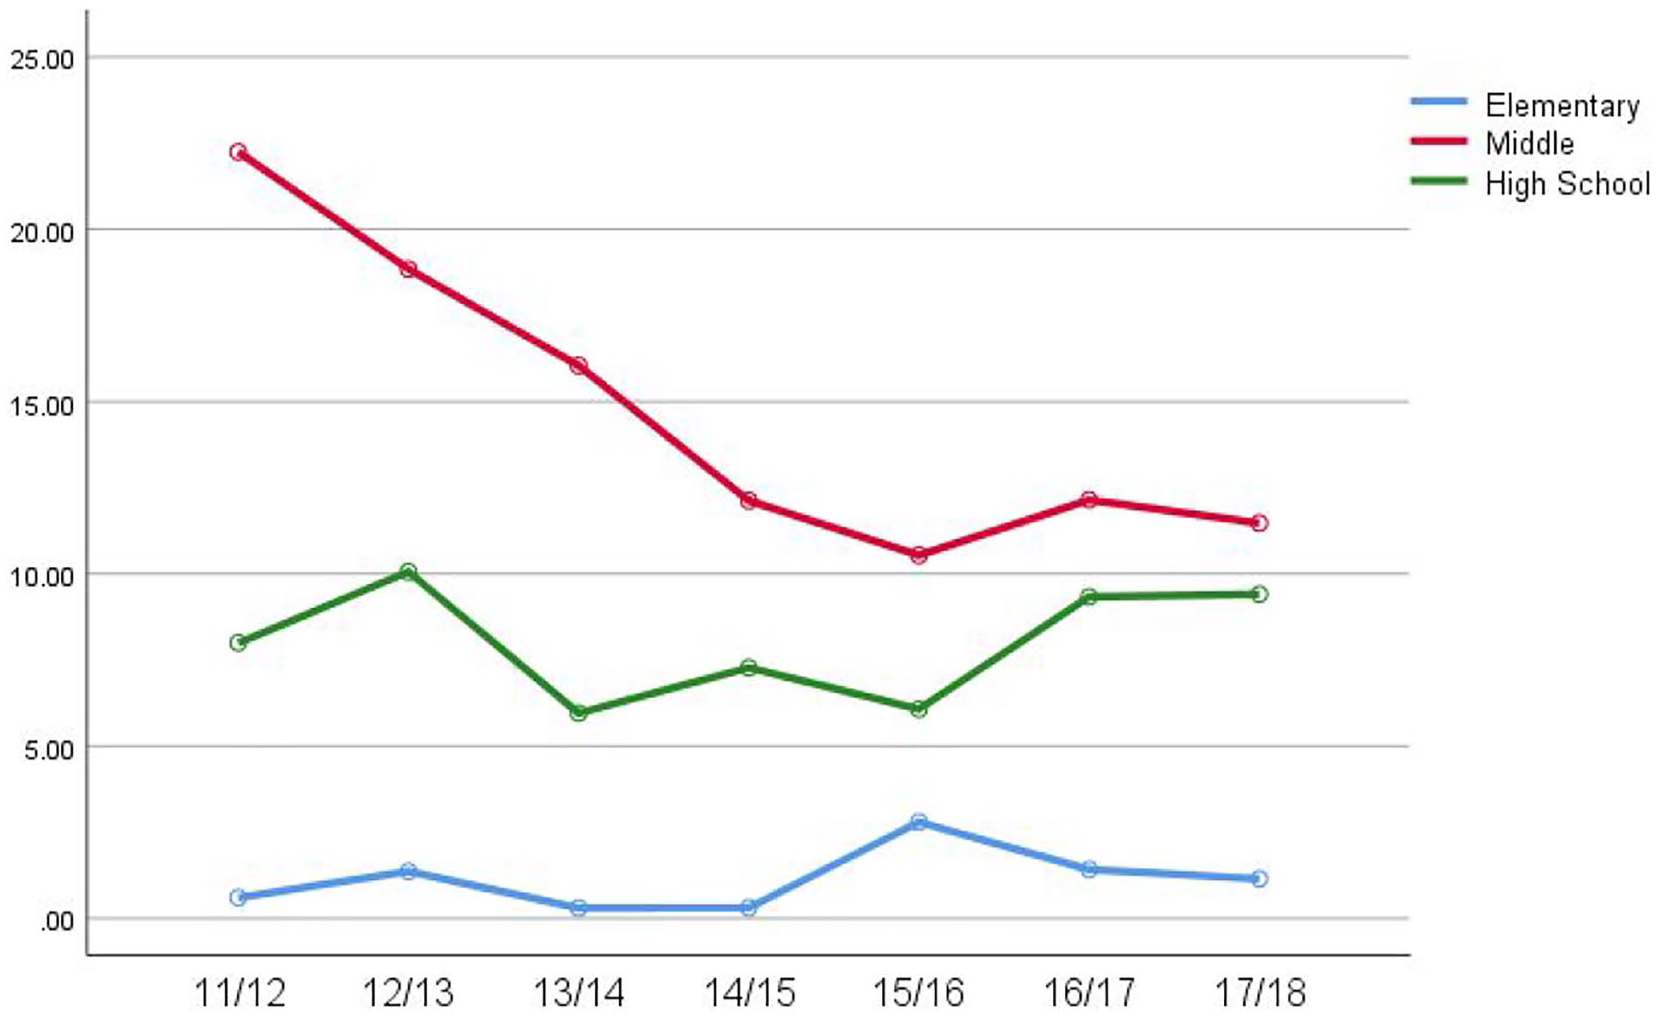
Trends in suspension data across all student (n = 3415).
As indicated above, the rate of suspensions is highest for the middle school students, followed by the High School level students. Results of the GLM analyses indicate that the association of the RJ across academic levels is significantly different when examining the data pre- to post-RJ implementation on suspensions, F (10, 3404)=1.81, p = .053. However, the suspension frequency for each academic level is statistically significant, F (10, 3404) =197.01, p <.001.
Discussion
The focus of this research was to determine what change if any, the introduction of RJ had on suspensions and expulsions for African American students in the SFUSD. The hypothesis of the study anticipated that the use of RJ would be associated with a reduction in expulsions and suspensions for African American students. The results of this investigation revealed that during its 3-year implementation, RJ was associated with reducing expulsions for African American students with the average expulsion rate for African Americans at the end of the 3 years averaging zero. The use of RJ was not, however, associated with a significant reduction in suspensions for African American students. Suspensions for African Americans at the end of the 3-year implementation period mirrored the suspension rate reported the year before implementation. Second, the pre/post data reveals that there was a reduction in the discipline gap between African American and Caucasian students. And, lastly, the most significant association between RJ and a reduction of suspensions and expulsions occurred at the middle school level. Suspensions and expulsions for the elementary and the high school levels after the implementation period remained relatively the same as before implementation.
Results of the study were not promising in comparison to other research on RJ in the criminal justice system, juvenile justice system, and other public school settings (Cameron & Thorsborne, 1999; Fronius et al., 2016; Mirsky, 2006). Although RJ in SFUSD is associated with a reduction in expulsions, it did not reveal the same trend with a reduction in suspensions, a reduction in the discipline gap between African American students and Caucasian students, or a reduction in suspensions at the elementary and high school levels.
One explanation for the reduction of expulsions could be that in place of long-term expulsions, administrators utilized shorter periods of out-of-school suspension as a disciplinary measure. Hence, expulsions would decrease, but suspensions would remain steady or increase. The possibility is supported by the data examined from SFUSD.
A lack of success at the high school and elementary levels may be the result of differences in implementation. According to the implementation plans posted on the SFUSD website, each building was allowed to create its own RJ implementation team. The team, in turn, was responsible for following the framework provided to introduce, develop, train, and maintain staff in the practices of RJ. If the plans were followed with fidelity at the building level, then RJ simply did not work in the SFUSD.
The use of RJ in K-12 public settings is relatively new in the United States. As a result, research examining its impact over long periods has just begun to emerge over the past five to 10 years. According to Gonzalez (2012), RJ in Oregon, Maryland, and Michigan led to reductions in suspensions, specifically (2012). In Oregon, 108 days of suspensions were saved due to the program; in Michigan, 1600 days of suspension had been avoided from 2004 to 2009 (Gonzalez, 2012). Likewise, 32 schools in Baltimore reported an 88% decrease in suspensions. However, although this district is similar in size to the SFUSD, RJ was only utilized at a handful of schools, unlike the mandatory systemic rollout process utilized at SFUSD. It is possible that the leadership at the district or building level were not fully prepared, trained, on-board or ready for the district-wide rollout, and the resulting increase in suspension was the result.
Based on the extant research, it appears as though districts that began implementing RJ at a few targeted schools saw better results than schools like SFUSD that attempted to implement the practices with the entire district. This phenomenon could explain the contradictions in data. Another possible reason for the contradictory data is SFUSD’s desire to implement both RJ and PBIS at the same time. According to the district website, a resolution stating that “Full Implementation of Restorative Practices (RP) and School-Wide Positive Behavior Interventions and Supports (SWPBIS) at All Schools” would begin, passed at a board meeting on February 25, 2014. Undertaking the full implementation of two important and time-consuming behavioral supports may have led to neither intervention being executed with fidelity.
The results of the current investigation add to the emergent literature regarding RJ in K-12 public schools in the United States. In addition, it also illuminates the question of how to implement RJ in a district. When compared to other districts outlined that have utilized RJ with more success, SFUSD was one of the only ones that attempted to implement the practice district-wide all at the same time. The exception was Parkrose School District, but this exception could be due to the small size of the district (3000 students). This information provides support for starting small when implementing RJ in a district.
Other factors that may have contributed to the lack of success in SFUSD include the buy-in of the administration, the type of professional development offered, the implementation of the professional development, and the fidelity of the implementation through the past 3 years. All these potential factors were not measurable in this study but may have influenced how RJ was utilized within the district. Confounders outside the district that may have also contributed to the result include the leadership within the district and individual buildings, individual school sizes, the demographics of specific schools, the transiency of the population served, and the socio-economic make-up of the city of San Francisco (Burke Harris, 2018).
The most profound implication of this data is the knowledge that students in the SFUSD continue to be excluded from school. Exclusionary practices have continually been associated with lower test scores, a decrease in school climate, an increased dropout rate, and a greater chance of interacting with both the juvenile justice system and the criminal justice system (Gowdey, 2015; Skiba et al., 2011). Therefore, students in the SFUSD are still at risk for dropping out, scoring lower on state-wide assessments, and intersecting with the school-to-prison pipeline. Based on the data examined in this study, RJ is not working in SFUSD and the students of the district will suffer unless exclusionary practices are reduced.
District and building leaders looking for alternatives to suspensions and expulsions or looking to reduce the discipline gap in their respective schools may be interested in this research. This information would be particularly beneficial to administrators in large urban districts, especially districts on the west coast with a high population of minority students. This material could be used as a blueprint for what not to do if reduced suspensions are desired. Research like this leads to helping practitioners develop a more definitive outline for execution based on district size, school size, school location, school demographics, et cetera.
The current investigation is limited in that the data that was used was reported by the SFUSD. This was pre-existing data; therefore, no manipulations of the data were possible.
The data were based on the self-reporting of SFUSD, which could skew the results in their favor should the reporting be incorrect. Since the results for the district were not favorable, there is less concern about data being slanted toward positive outcomes. The publicly accessible data were already disaggregated into varying subgroup components, so it is impossible to analyze potential moderators to the findings. Since the current investigation relied on publicly available data, another limitation is the inability to incorporate the potential moderator of SWPBIS into the analysis It was not possible for the researchers to understand where SWPBIS was implemented and to what degree of fidelity. While there is research that suggests that PBIS can have an impact on rates of suspensions and expulsions, understanding to the fidelity of each educator is incorporating PBIS into the students’ experience is a difficult measure to capture from outside of the school district (Barclay et al., 2022; Heidelburg et al., 2021). Furthermore, the study looked only at the SFUSD, a large urban district on the west coast. While this may limit the generalization of the results, the findings are based on a large sample of data. When comparing the results of this study with other research in the area, it became clear that many larger districts start small when initiating RJ. Many started with just one school or with just a handful of schools. More research is needed to determine the best method for implementing RJ, full implementation, or staggered implementation.
Conclusion
The use of RJ practices in the SFUSD did not reduce exclusionary practices for African American students and therefore did not significantly reduce the discipline gap. Contrary to other research on RJ, the use of RJ in SFUSD had the most promising data at the middle school level. Factors such as implementation processes, student transiency, administrator and staff philosophies and attitudes, as well as student demographic information by school may have all influenced the use of RJ in this study and the reported disciplinary events. Future studies in restorative justice are needed to add to the body of literature and to help determine the best path toward implementation based on school size, demographics, and staff attitudes. The emergence of equity training may aid in the potential for success in districts utilizing RJ and could help reduce the biases outlined in the Representative Bureaucracy Theory. Additionally, the successful models of RJ in New Zealand and Australia should be studied for those aspects that could be applied in the United States. Most importantly, researchers and practitioners have an obligation to continue to search for the most powerful and effective method of reducing exclusionary discipline practices for our most at risk subgroups.
Footnotes
Declaration of Conflicting Interests
The author(s) declared no potential conflicts of interest with respect to the research, authorship, and/or publication of this article.
Funding
The author(s) received no financial support for the research, authorship, and/or publication of this article.