
Abstract
Past research indicates that teacher math anxiety is related to student outcomes and can be decreased through intervention. However, there is little research on this topic, partially due to a lack of math anxiety measures validated for use with practicing teachers. In this study of 399 elementary school teachers, we report on the construct validation of the Math Anxiety Scale for Teachers. Factor analyses support a distinction between components of general math anxiety and anxiety about teaching math. Math anxiety scores correlate with other teacher characteristics in expected ways: higher math anxiety is associated with lower mathematical knowledge for teaching, more traditional beliefs about math teaching and learning, being a lower elementary school teacher, and a lack of math-specific teaching credentials. The 15-item Math Anxiety Scale for Teachers can be administered efficiently in large-scale studies and may support advances in research exploring relations among practicing teachers’ math anxiety, instruction, and student learning.
Keywords
Researchers have increasingly recognized the importance of teachers’ emotions for their well-being and their teaching (e.g., Sutton & Wheatley, 2003). A focus on one such emotion, anxiety, specifically in the context of math, is critical as research has found that college students who major in early childhood and elementary education have among the highest levels of math anxiety (Hembree, 1990; Kelly & Tomhave, 1985; Malinsky, Ross, Pannells, & McJunkin, 2006). Math anxiety among elementary school teachers is a particular concern because empirical findings suggest that teachers with higher levels of math anxiety spend less time on math instruction (Trice & Ogden, 1986), have classrooms with lower levels of student participation in mathematical activities (Bush, 1989), and have students with lower math achievement (Beilock, Gunderson, Ramirez, & Levine, 2010; Hadley & Dorward, 2011). Fortunately, a number of researchers (e.g., Gresham, 2007; Swars, Smith, Smith, & Hart, 2009) have reported that teacher math anxiety can be decreased through intervention. Despite this, there are few math anxiety instruments designed to be administered to practicing teachers.
In the present study, we introduce the Math Anxiety Scale for Teachers (MAST), the development of which we see as an important step in moving research on the consequences of teacher math anxiety forward. To provide evidence for its construct validity (Flake, Pek, & Hehman, 2017), we examine its reliability and scale structure as well as how scores on the scale relate to other teacher characteristics, including grade level taught, math teaching certification status, math knowledge for teaching, and beliefs about math teaching and learning.
Teacher Math Anxiety
Definition and Measurement
Teachers can experience a range of positive and negative emotions related to their teaching. These emotions may be about meeting their students’ needs, about the subjects they teach, and/or about their ability to teach those subjects. Importantly, research shows that these emotions matter for teacher well-being and retention (e.g., Chang, 2009) and are related to teacher quality and student emotions (Frenzel, Becker-Kurz, Pekrun, Goetz, & Lüdtke, 2018; Sutton & Wheatley, 2003). In recent research, Frenzel et al. (2016) worked to develop broad instruments in this area, focusing on teachers’ anger, enjoyment, and anxiety about teaching. Within the context of this work on teacher emotions, teachers’ anxiety about math has been identified as a potentially important emotion experienced by teachers, especially elementary school teachers.
To define teacher math anxiety, we first consider the broader constructs of anxiety and math anxiety. According to the American Psychological Association (2015), anxiety is an emotion characterized by feelings of tension, worried thoughts, and physical changes, such as increased blood pressure. Math anxiety has been defined in a number of ways in scholarly work, but a common thread is that math anxiety is discomfort or nervousness that arises when thinking about or while doing math. An oft-cited definition by Richardson and Suinn (1972) is that math anxiety involves “feelings of tension and anxiety that interfere with the manipulation of numbers and the solving of mathematical problems in a wide variety of ordinary life and academic situations” (p. 551). Researchers consistently conclude that high anxiety negatively relates to performance, including that in mathematics (e.g., Ashcraft & Kirk, 2001; Ashcraft & Krause, 2007; Beilock, 2008; Cassady & Johnson, 2002; Eysenck, Derakshan, Santos, & Calvo, 2007).
Math anxiety is often conceptualized as multidimensional. Some scholars have conceptualized math anxiety to include emotionality, the physiological and affective aspect of anxiety (e.g., palms sweating, heart racing, subjective feelings), and worry, the cognitive aspect of anxiety (e.g., worried thoughts, racing thoughts; Liebert & Morris, 1967; Wigfield & Meece, 1988). In other research, it is conceptualized as involving two components: math evaluation anxiety and math learning anxiety. Math evaluation anxiety is anxiety felt about math testing situations or when one feels that she or he is being otherwise evaluated, whereas math learning anxiety is anxiety felt during nonevaluative situations, such as that in the classroom or while doing math problems (e.g., Hopko, 2003; Plake & Parker, 1982). We considered both these distinctions during the development of a teacher math anxiety instrument.
Teachers’ math anxiety may present in multiple forms. One form is general math anxiety (GMA), or anxiety about one’s self doing math, which is what would normally be considered math anxiety in the general population. Researchers studying prospective and practicing teachers also proposed the existence of a related but distinct form of math anxiety: anxiety about teaching math (ATM; Brown, Westenskow, & Moyer-Packenham, 2011; Hadley & Dorward, 2011; Liu, 2008; Peker, 2009). This is different from the general construct of math anxiety because it refers to the anxiety that one feels about his or her ability to teach math but not necessarily to do math themselves. Peker (2009) defined this construct as “pre- and in-service teachers’ feelings of tension and anxiety that occurs during teaching mathematical concepts, theories, and formulas or during problem solving” (p. 336).
Two research studies found some evidence that these two constructs are correlated but not redundant. In a study involving 51 prospective elementary teachers, Brown and colleagues (2011) found various profiles across these two types of math anxiety: 41% of participants were neither math anxious nor anxious about teaching math; 21% had anxiety of both types; 20% were math anxious but not anxious about teaching math; and 18% were not math anxious but were anxious about teaching math. In a study with 692 practicing elementary school teachers, Hadley and Dorward (2011) found a moderate positive correlation (r = .42) between teachers’ own math anxiety, measured by the Math Anxiety Rating Scale–Revised (MARS-R; Hopko, 2003), and their ATM, measured by an instrument that they adapted from the MARS-R. The results from these two studies suggest that GMA and ATM are two correlated yet distinct constructs, but this has yet to be confirmed with factor-analytic methods.
One critical challenge to the measurement of GMA with teachers is that no measures have been developed to measure practicing teachers’ math anxiety. Questionnaires designed to measure math anxiety among college students are not suitable for use with practicing teachers, because the survey items reference situations not currently relevant to their experiences. For example, most of the extant research on practicing teachers’ math anxiety is based on the Mathematics Anxiety Rating Scale (MARS; Richardson & Suinn, 1972) or a shortened version of it, such as the sMARS (Alexander & Martray, 1989) or MARS-R (Hopko, 2003). These scales include items based on the assumption that the respondent is a student (e.g., asking about anxiety felt when “being given a ‘pop’ quiz in a math class” or “signing up for a course in math”). Instruments designed for use with practicing teachers to measure their math anxiety may serve to advance our collective understanding of the relations among teacher math anxiety, math instructional practices, student math anxiety, and student math learning.
For ATM, three measures have been developed but only one for use with practicing teachers (Hadley & Dorward, 2011; Liu, 2008; Peker, 2009). Liu (2008, 2016) and Peker (2009) developed instruments to measure ATM, but both instruments were designed and field-tested with prospective teachers; thus, their validity for use with practicing teachers is unknown. These items, for example, are written about expectations for the future (e.g., “I will worry . . .”) as opposed to current experiences as a classroom teacher. Hadley and Dorward (2011) created a scale based on the MARS-R GMA scale adapted to teaching situations. They provided some initial validity evidence for their scale through expert reviews. However, because they chose to stick closely to the wording and content areas in the original MARS-R items, this limited the types of items that they could include. For example, five of their items (e.g., “Looking through the pages in your math series teacher’s manual”) had a mean <1.5 on a 5-point scale, suggesting that a number of the items were not picking up on aspects of teacher math anxiety that make teachers anxious and therefore showed limited variability. Based on available measures, it seemed as though a new scale is needed that is designed for practicing teachers and that includes content more aligned with what makes those teachers anxious. During the development process for our new teacher math anxiety instrument, we examined the items in each of these previously developed scales and adapted some of them for use in our instrument.
Incidence
Elementary school teachers have higher levels of math anxiety than do people who pursue other fields of work or are teachers at other grade levels (Hembree, 1990; Kelly & Tomhave, 1985; Malinsky et al., 2006). One reason for this higher rate of math anxiety could be that elementary school teachers generally do not obtain math-related degrees or take many college math courses (Malzahn, 2002; National Center for Education Statistics, 2017). Thus, people with high math anxiety and/or low math achievement may self-select into early childhood or elementary education so that they do not have to take as many math courses. In turn, this lack of college coursework in mathematics may further contribute to math anxiety. In addition, higher levels of math anxiety could potentially be explained by the fact that women make up >90% of the elementary teaching force (National Center for Education Statistics, 2017) and tend to have higher levels of math anxiety than do men (Hart & Ganley, in press; Hembree, 1990). Thus, the fact that there are many more women in this field could explain why we see higher levels of math anxiety than we do for other fields.
Potential Consequences
Teacher math anxiety has potentially important consequences, as it has been found to be associated with instructional practices and student math achievement. A number of researchers have hypothesized impacts of math anxiety on instructional practices (Brady & Bowd, 2005; Gresham, 2007; Vinson, 2001), but there is little empirical research addressing this. Research does show that math anxiety is correlated with math achievement and avoidance of math among children and adults (e.g., Ashcraft, 2002; Ashcraft & Kirk, 2001). However, in the context of teaching, less is known. Based on our theoretical knowledge about math anxiety, it could be related to instructional practices in a few different ways. For example, theory and research suggest that math anxiety leads to impairments in working memory (Ashcraft & Krause, 2007; Beilock, 2008; Eysenck & Calvo, 1992; Eysenck et al., 2007), which could lead to a teacher explaining concepts superficially, struggling with explaining a math strategy, or having difficulty demonstrating a problem on the board. In addition, research suggests that math anxiety leads to math avoidance, which could have a number of consequences in the classroom. For example, one direct manifestation of avoidance could be that math-anxious teachers spend less time teaching math. A more indirect manifestation could be avoiding going into depth about particular topics due to discomfort about those topics. This could lead to teaching less cognitively demanding lessons (Brady & Bowd, 2005).
We are aware of four studies that examined the relation between teachers’ math anxiety and instructional practices. Trice and Ogden (1986) found a difference in quantity, in that teachers with higher math anxiety spent less time on math instruction, supporting a more direct avoidance of mathematics. Bush (1989) found that teachers with higher math anxiety spent more time on whole-class instruction and had lower levels of classroom discourse. In a case study, Karp (1991) found that teacher-centered instruction and a focus on algorithms was more common for teachers with higher math anxiety. In contrast, Battista (1986) found no relation between the math anxiety of prospective teachers and the quality of their lesson plans or teaching. Thus, there is some evidence that the math anxiety of practicing teachers may relate to their behavior in the classroom, but this may not be the case for prospective teachers.
Multiple researchers suggested that the consequences of math anxiety for instructional practices has further consequences for student achievement (e.g., Brady & Bowd, 2005; Kelly & Tomhave, 1985; Vinson, 2001). Beilock et al. (2010) reported that the math anxiety of lower elementary female teachers predicts poorer math performance of their female students. Hadley and Dorward (2011) found that teachers’ anxiety about their math skills was not related to student math performance, but their ATM had a small but statistically significant negative correlation with student achievement. Similar relations between teachers’ anxiety about doing math and student math achievement have even been found with high school teachers, who are generally math specialists (Ramirez, Hooper, Kersting, Ferguson, & Yeager, 2018). These results suggest a need for measures that can discriminate among different but related components of teacher math anxiety to understand the relation between teacher math anxiety and student math learning.
Fortunately, despite these potential consequences, teacher math anxiety appears to be malleable, suggesting potential means for interventions to reduce its consequences. A number of studies showed that participation in a math methods course decreases math anxiety among prospective teachers. This effect has been found mainly for GMA (Battista, 1986; Gresham, 2007; Harper & Daane, 1998; Johnson & vanderSandt, 2011; Sloan, Daane, & Giesen, 2002; Swars et al., 2009; Vinson, 2001; see Lake & Kelly, 2014 for an exception) but also for ATM (Liu, 2008). These results suggest that teacher math anxiety may be malleable and that math methods courses could serve to reduce prospective teachers’ math anxiety.
Relations With Other Teacher Factors
One potential factor related to teachers’ math anxiety is the grade level that they choose to teach. Teachers may choose to teach the earlier elementary grades or get an early childhood teaching certificate to avoid teaching any math content areas that may make them nervous (e.g., fractions, decimals), which appear in the upper elementary grades. In line with this, Johnson and vanderSandt (2011) found that undergraduate students who were early childhood education majors reported higher math anxiety than did elementary education majors. Hadley and Dorward (2011) compared practicing elementary teachers of different grade levels and found that ATM did not differ across teachers in first through sixth grades; however, GMA was higher for first/second-grade teachers than for fifth/sixth-grade teachers, and third/fourth grade teachers did not differ from either of the other two groups.
In general, formal math educational experience is negatively correlated with math anxiety (Hembree, 1990). This is especially relevant among teachers, as findings from large national surveys indicate that few teachers have a strong educational background in mathematics: <5% of elementary school teachers in the U.S. have a degree in math, and <2% have math teaching certifications (Malzahn, 2002; National Center for Education Statistics, 2017). Thus, as suggested by Kelly and Tomhave (1985), it is likely that elementary school teachers with certifications in math, which indicates a stronger educational background in math, may also have lower levels of math anxiety.
Scholars have hypothesized that the reason for higher levels of math anxiety among prospective teachers as compared with students who major in other fields is their relative lack of mathematical knowledge (Kelly & Tomhave, 1985). Past research with adolescents and adults found that math anxiety and math performance are related (Ashcraft & Kirk, 2001; Hembree, 1990; Ma, 1999; Ma & Xu, 2004); thus, it would be reasonable to expect a relation between these variables among teachers as well. Researchers examining these relations among prospective teachers found moderate to strong negative associations between teachers’ math anxiety and their subject matter knowledge in math: −.30 < r < −.70 (Battista, 1986; Jaggernauth & Jameson-Charles, 2015; Novak & Tassell, 2017; Rayner, Pitsolantis, & Osana, 2009).
It is also possible that teacher math anxiety is related to the beliefs that teachers hold about math teaching and learning. In one study of 24 prospective teachers, Swars et al. (2009) found that teachers with higher levels of math anxiety believed to a lesser extent that math skills should be taught in relation to problem solving, that children can construct their own math knowledge, and that math instruction should be organized to facilitate children’s construction of knowledge. Indeed, this could potentially be the link between math anxiety and teacher practices (Stipek, Givvin, Salmon, & MacGyvers, 2001). However, no work has examined relations between math anxiety and beliefs about math teaching and learning among practicing teachers.
Present Study
In the current study, we sought to establish the validity of the Math Anxiety Scale for Teachers for use with practicing teachers via the construct validation framework discussed by Flake et al. (2017). This framework outlines three types of validity, each of which is addressed in the development and analysis of the MAST.
We used a number of strategies during the development of the scale in an attempt to establish evidence for substantive validity. We selected items per a review of the past literature suggesting distinctions between GMA and ATM as well as distinctions within GMA among emotionality, worry, and social/evaluative anxiety. We also obtained substantive validity evidence through expert reviews and by conducting cognitive interviews with teachers.
With data from the scale, we assessed structural validity by initially examining item-level descriptive statistics, item-total correlations, and reliability estimates. We then conducted confirmatory factor analyses to examine whether our hypothesized scale structure, based on the literature, achieved the best fit to the data. We also assessed the scale for redundancy and any problematic items and removed these when necessary.
To assess external validity, we then examined how teacher math anxiety, as measured by the MAST, is related to other teacher characteristics. Given the findings reported and theorized by other scholars, we examined its relation to the grade level that teachers currently teach and are certified to teach, teaching certification in math, mathematical knowledge for teaching (MKT), and beliefs about math teaching and learning.
Method
Participants
Participants were 399 public school teachers in Florida in spring 2016: lower elementary (Grades K–2), n = 297; upper elementary (Grades 3–5), n = 102. The teachers were participating in two randomized controlled trials of professional development programs focused on elementary math. Approximately 57% of the participants attended the professional development program (treatment), and 43% did not (control). Ninety-five percent of participants identified as female, 81% as White, 14% as Black, 2% as Asian, 0.1% as American Indian, and 2% as multiracial. Fourteen percent identified as Hispanic. Teachers reported an average of 11.4 years of teaching experience (SD = 8.6 years).
Measures
Teaching certifications
Teachers indicated the teaching certifications that they had earned. We coded whether teachers had an early childhood certification (preK–3; n = 84) or not (n = 315). Those who did not have an early childhood certification had an elementary certification. We also coded teachers who selected that they had a middle school or secondary math teaching certification (or both) as having a subject-specific math teaching certification (n = 11, 2.8% of the sample).
Teacher math anxiety
To measure teacher math anxiety, we used the MAST, which initially consisted of 19 items (see Table 1): 11 corresponding to GMA (three subscales: emotionality, worry, social/evaluative anxiety) and 8 to ATM. Items were rated by participants on a 5-point scale (1 = not true of me at all, 2 = generally not true of me, 3 = somewhat true of me, 4 = generally true of me, 5 = very true of me). For the GMA items, participants were asked to think about when they do mathematics themselves, not in the context of their classroom, whereas for the ATM items, they were asked to think about the context of the grade in which they are currently teaching. Additional information about scale development is provided in the Results section as it pertains to the substantive validity of the scale.
Descriptive Statistics for the Items on the Math Anxiety Scale for Teachers

Note. All items were rated on a scale from 1 to 5.
Mathematical knowledge for teaching
MKT was assessed with two measures, determined by the grade level taught by participants. The participants with teaching assignments at K–2 completed the Knowledge for Teaching Early Elementary Mathematics (K-TEEM; version 2016). The K-TEEM is designed to measure teachers’ MKT in the area of number, operations, and equality with an emphasis on whole numbers (Schoen, Bray, Wolfe, Tazaz, & Nielsen, 2017). The K-TEEM test contained 32 items. Based on a sample of 387 Florida teachers, coefficient α for the K-TEEM was estimated to be .83. Participants with teaching assignments at the third, fourth, or fifth grade completed a test of MKT constructed by items drawn from various sources (i.e., Hill, Schilling, & Ball, 2004; Saderholm, Ronau, Brown, & Collins, 2010; Schoen et al., 2017; Zhou, Peverly, & Xin, 2006). The upper elementary test was designed to measure teachers’ MKT in the area of number, operations, and algebraic thinking as described in the Common Core State Standards for Math with an emphasis on fractions. Coefficient α for the upper elementary MKT test based on the sample used in the present study was estimated to be .90. Both assessments assess various aspects of MKT, including problem solving and reasoning skills, content knowledge, and pedagogical content knowledge. For each assessment, we used item response theory analyses to estimate a theta score to measure performance.
Beliefs about math teaching and learning
We administered a questionnaire about teacher beliefs about math teaching and learning (Schoen & LaVenia, in press), which has three subscales. All items in each subscale were rated on a 5-point scale from strongly disagree to strongly agree. These scales were developed through a series of factor analyses to identify the best-fitting model and have been field-tested with several large samples of practicing teachers. A confirmatory factor analysis suggested a three-factor structure, corresponding to the Transmissionist subscale, the Facts-First subscale, and the Fixed Instructional Plan subscale. These scales were modeled as three correlated latent factors.
Agreement on the Transmissionist subscale (11 items, α = .87) indicates that a teacher believes that students learn best by solving problems the way that the teacher shows them (e.g., “It is more effective to show students how to solve problems than to let them solve problems in their own way”). Four of the 11 items were reverse-coded (e.g., “Effective math teachers consistently create opportunities for students to solve problems in their own ways before the teacher has already shown them a good way to solve that type of problem”). Agreement on the Facts-First subscale (5 items, α = .78) indicates that a teacher believes students’ ability to recall number facts is an important prerequisite for solving word problems (e.g., “Students should master some basic facts before they are expected to solve word problems”). One of these items was reverse-coded (i.e., “Even students who have not learned the basic facts can have efficient methods for solving word problems.”). Agreement on the Fixed Instructional Plan subscale (5 items, α = .84) indicates a belief that instruction should follow the scope and sequence of topics presented in the textbook with strict adherence (e.g., “If the teacher deviates from the sequence in the textbook, students will not learn the math they are supposed to learn”).
Procedure
Participants completed all measures online. Participants first completed an online application, which included questions about their grade levels taught and teacher certification. Responses from the grade level question were used to determine which MKT assessment they should receive (i.e., lower or upper elementary grades). All measures were then accessed through links that participants received via email.
Results
Substantive Validity
Based on our review of the literature, we included items on the MAST to assess both GMA and ATM. We defined GMA as feelings of anxiety that occur when one is engaged in mathematical activities or thinks about doing math. We defined ATM as feelings of anxiety that occur when one is teaching mathematics. Within GMA, the items were designed to align with theoretical distinctions in math anxiety research—specifically, emotionality, worry, and social/evaluative anxiety (Hopko, 2003; Liebert & Morris, 1967; Plake & Parker, 1982).
To develop the MAST, we reviewed preexisting GMA questionnaires (Alexander & Martray, 1989; Bai, Wang, Pan, & Frey, 2009; Fennema & Sherman, 1976) and ATM questionnaires (Hadley & Dorward, 2011; Liu, 2008; Peker, 2009), adapted some of their items, and wrote new items to obtain an initial item pool of 35 items. We then submitted this item pool for external review by four education and psychology researchers and 12 practicing elementary school teachers. Feedback from these researchers and teachers was then used to select among items, make changes to items, select the rating scale, and develop new items to capture what any reviewers thought was missing from the scale.
After this review, we administered the initial 22-item version of the scale to a sample of approximately 700 teachers. Following this field test, we conducted 22 cognitive interviews with elementary school teachers using these items. In these interviews, teachers were asked to describe how they interpreted each item, and if their interpretation did not match the intended construct, they were asked for feedback on how an item could be improved to better capture the construct (Desimone & LeFloch, 2004; Hamilton, Nussbaum, & Snow, 1997). Information extracted from these cognitive interviews, including specific language that the teachers used to talk about math anxiety and unclear item wording, informed revisions to the survey items and item removal decisions. We thus used information from the first field test and the cognitive interviews to create a 19-item version of the scale, which was used in the present sample.
Structural Validity
To assess structural validity, we first examined item descriptive statistics (Table 1), item-total correlations, and reliability. No items posed serious issues with skew or kurtosis: skewness values were between −2 and 2 (Tabachnick & Fidell, 2013); kurtosis values were between −7 and 7 (Hair, Anderson, Babin, & Black, 2010).
We examined item-total correlations and reliabilities for three possible forms of the scale: unidimensional, two factors (GMA and ATM), and two factors (GMA and ATM) with the three subscales of GMA (emotionality, worry, social/evaluative) as subfactors of the GMA factor (hereafter referred to as the four-factor model). Across these specifications, all item-total correlations were > .65. If considered a unidimensional scale, the 19 items had a Cronbach’s alpha of .96. When GMA and ATM were considered separately (α = .97 and α = .91, respectively) and when GMA was split into its three subscales, they all had high internal consistencies (emotionality, α = .94; worry, α = .94; social/evaluative, α = .92).
To examine the factor structure of the scale, we conducted confirmatory factor analyses in Mplus 7.11 (Muthén & Muthén, 1998–2012) with the three aforementioned possible structures: unidimensional, two factors (GMA and ATM), and four factors (GMA: emotionality, worry, social/evaluative; ATM). These models are depicted in Figure 1. In these analyses, item responses were treated as categorical, and weighted least squares estimation was used. We evaluated the fit of these models using guidelines provided by Kline (2016). The guidelines suggest good model fit if there is a nonsignificant chi-square test of model fit (p > .05), a higher confirmatory fit index (CFI; values ≥ .90), a higher Tucker-Lewis index (TLI; values ≥ .90), and a lower root mean square error of approximation (RMSEA; values < .08 preferred). To compare the fit of the nested models, we used the Satorra-Bentler statistic (Satorra & Bentler, 2001). Table 2 presents standardized factor loadings for each model. Table 3 presents model fit statistics.

Three tested specifications of the structure of math anxiety: (A) unidimensional model, (B) two-factor model, and (C) four-factor model. These figures represent the original 19-item version of the scale. Italicized items were removed from the final 15-item version of the scale.
Standardized Factor Loadings for Items on the Math Anxiety Scale for Teachers
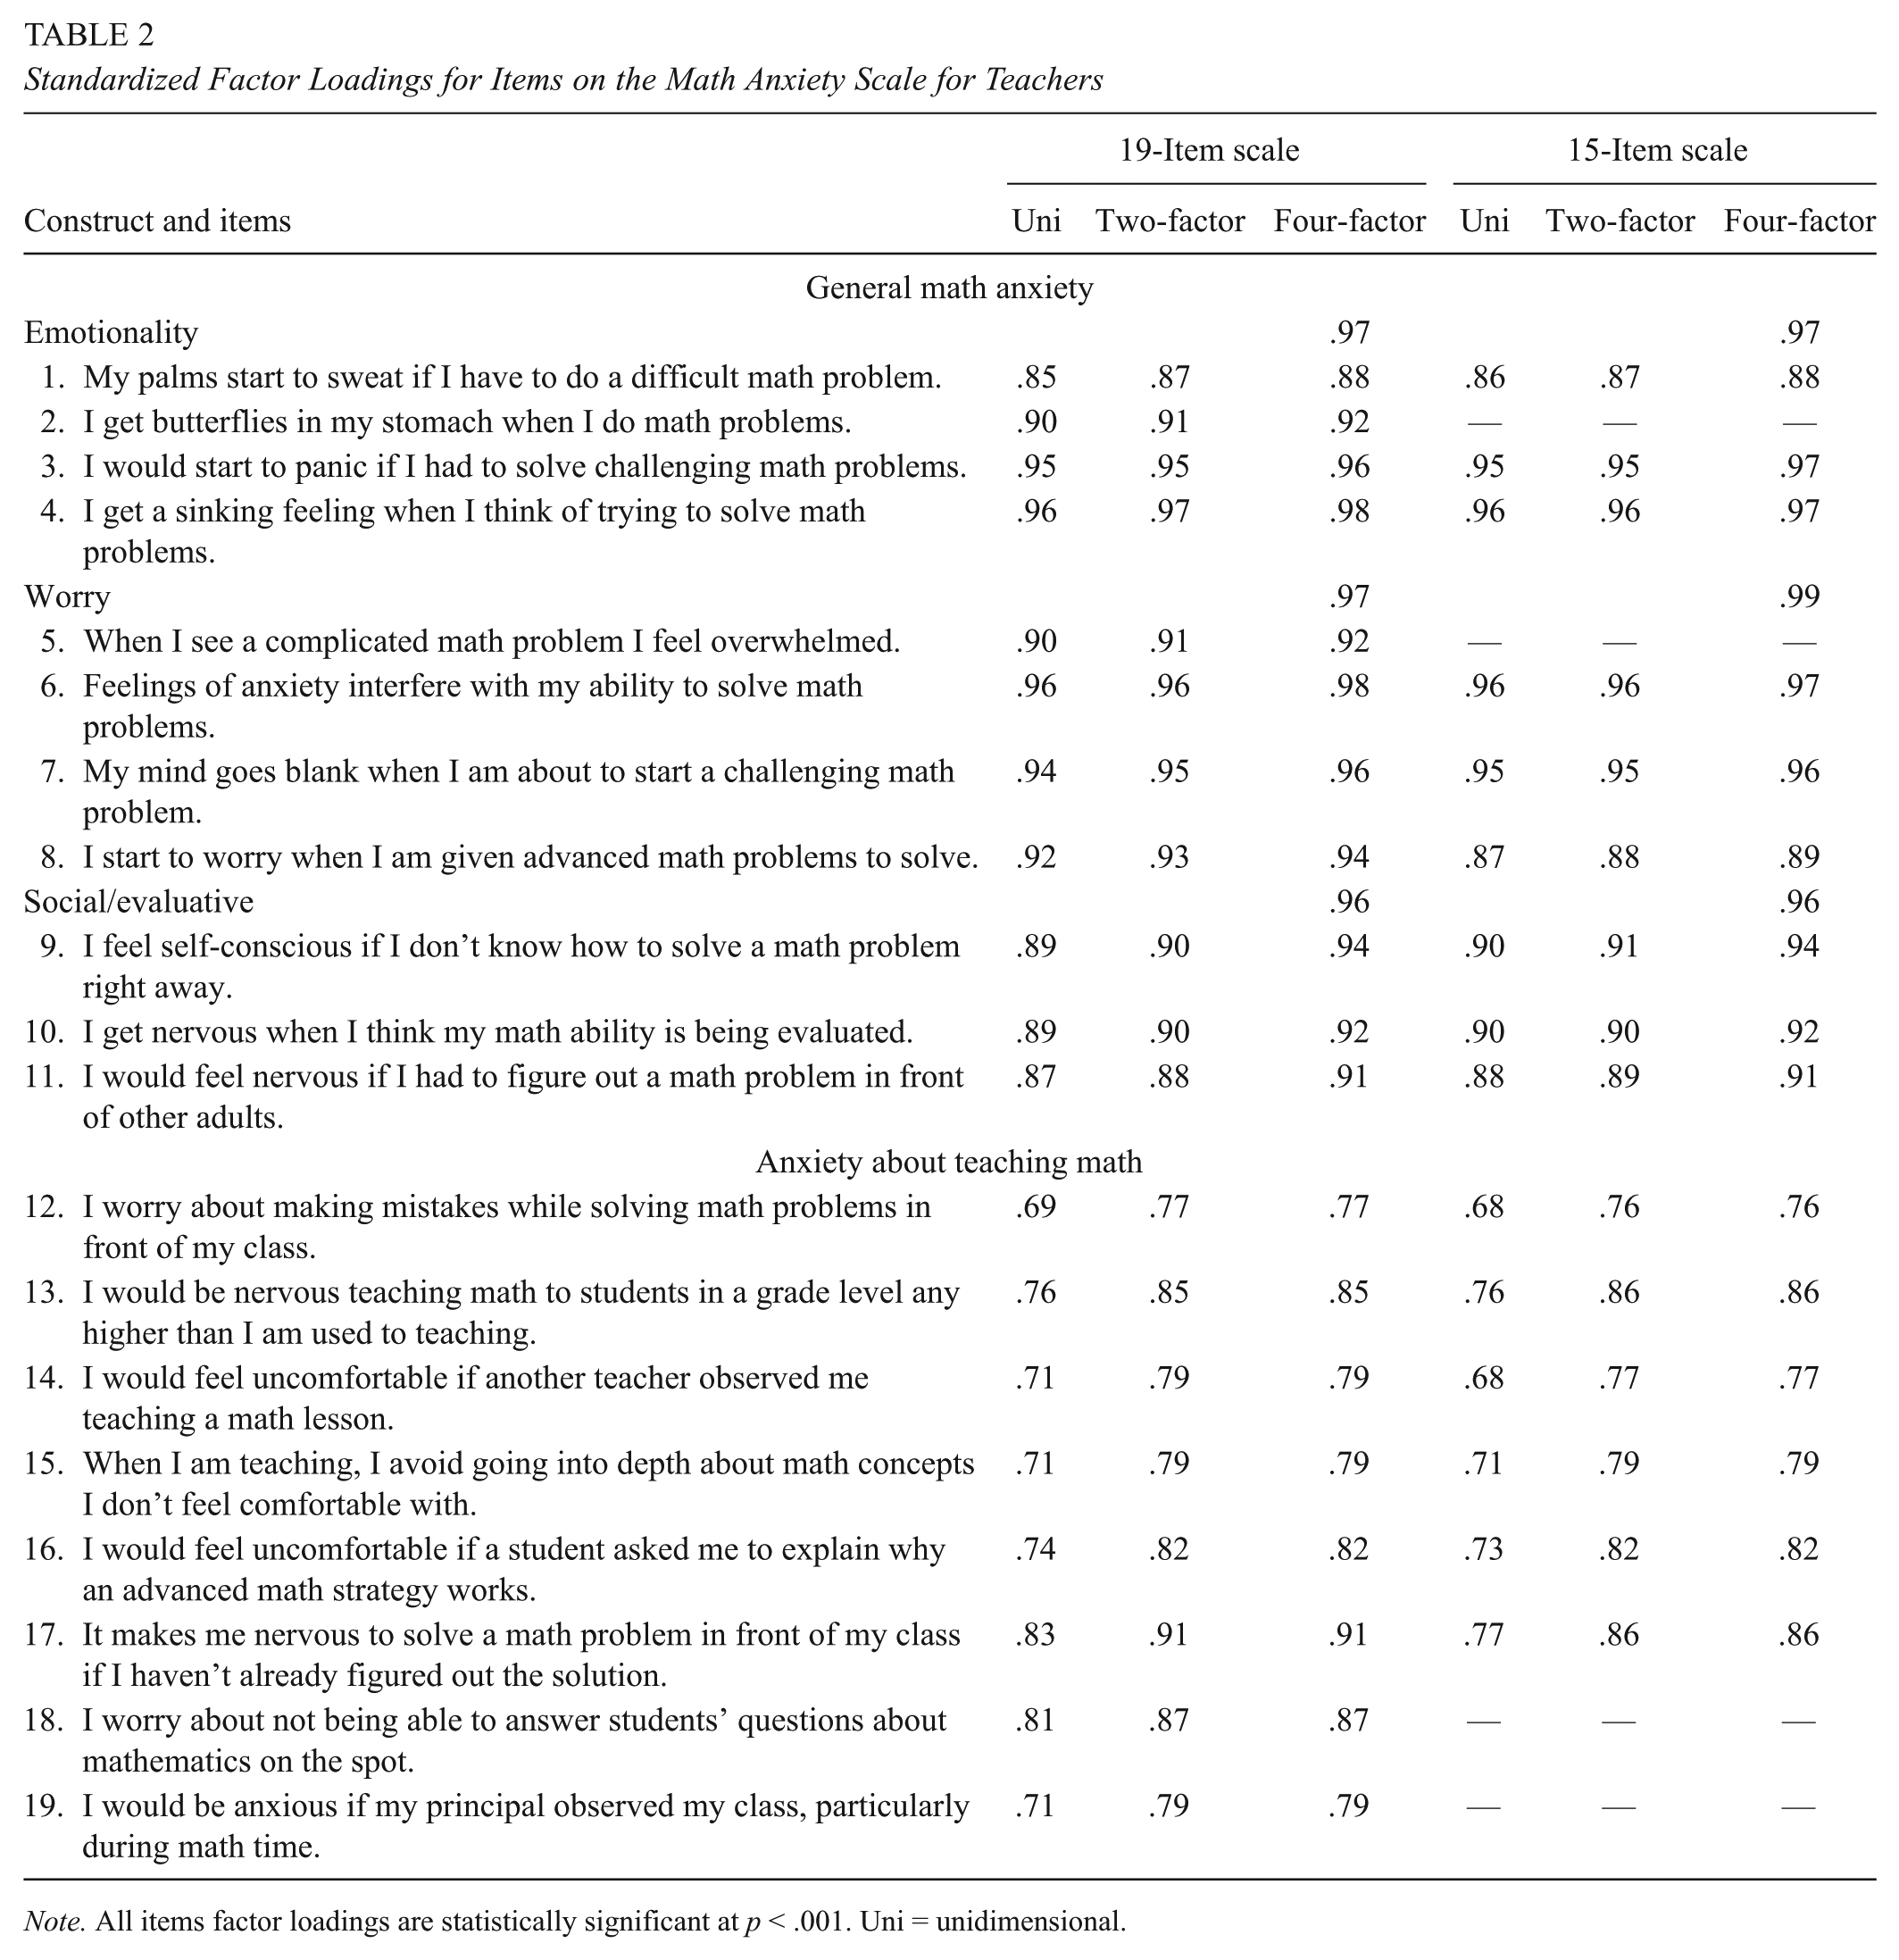
Note. All items factor loadings are statistically significant at p < .001. Uni = unidimensional.
Model Fit Statistics

Note. RMSEA = root mean square error of approximation; CI = confidence interval; CFI = comparative fit index; TLI = Tucker-Lewis index.
All models achieved good fit according to the CFI and TLI guidelines (> .90), but none of the models met the cutoff for the RMSEA for good fit (< .08; see Table 3). The two-factor model resulted in an improvement of model fit over the unidimensional model based on the Satorra-Bentler statistic (183.00, df = 1, p < .001). The four-factor model fit the data better than the two-factor model (134.51, df = 3, p < .001). In the four-factor solution, all standardized factor loadings were ≥ .77 (Table 3), and unstandardized factor loadings were statistically significant at p < .001. The correlations among subscales of GMA were high: between emotionality and worry, .94; emotionality and social/evaluative, .93; and worry and social/evaluative, .93. The correlations between the three GMA subscales and ATM were lower but still strong (r = .74 with emotionality and worry, r = .73 with social/evaluative). All correlations were statistically significant (p < .001).
We then attempted to reduce the number of items in the scale. To do so, we considered theoretical and empirical reasons for removing items. We used feedback from seven professors in math education and psychology who together reviewed the language in the items and the factor loadings to identify any items for removal. We also examined modification indices (MIs) to identify items for which the addition of correlated errors with another item within its subscale would improve model fit as an indicator of potential redundancy in the model. We then considered these item pairs to see if they had conceptual similarity, and if so, we chose to remove one of the items.
For the Emotionality subscale, we removed Item 2 (“I get butterflies in my stomach when I do math problems”) for theoretical and interpretation reasons. The phrase “butterflies in my stomach” was interpreted by some as being ambiguous, because it could be thought of as a positive affective response more related to excitement than anxiety (Brooks, 2014). For the Worry subscale, Item 5 (“When I see a complicated math problem I feel overwhelmed”) and Item 8 (“I start to worry when I am given advanced math problems to solve”) were identified by MIs as being potentially redundant (MI = 177.04). Upon inspecting these items, we believed that they likely do capture some of the same aspect of math anxiety—namely, the worry that one feels when presented with more difficult math problems. Because Item 5 had the lowest factor loading in its subscale, it was removed. To maintain model identification, we did not remove any items from the Social/Evaluative subscale, which comprised only three items.
For the ATM subscale, we found that Item 12 (“I would feel uncomfortable if another teacher observed me teaching a math lesson”) and Item 19 (“I would be anxious if my principal observed my class, particularly during math time”) were identified by MIs as being potentially redundant (MI = 58.66). Upon inspecting these items, we believed that they likely do capture similar aspects of anxiety—namely, how a teacher feels when she or he is being observed while teaching math. These two items had similar factor loadings, but Item 19 was removed because it is was interpreted by some as being a double-barreled question—that is, you could be anxious when being observed but not particularly during math time. Item 17 (“It makes me nervous to solve a math problem in front of my class if I haven’t already figured out the solution”) and Item 18 (“I worry about not being able to answer students’ questions about math on the spot”) were also identified by MIs as being potentially redundant (MI = 54.91). Upon inspecting these items, we believed that they likely do capture some of the same construct—namely, how a teacher feels when he or she is in front of the class and doing something when unprepared. Because Item 18 had a lower factor loading than Item 17, it was removed. After removal of Items 18 and 19, there was a large drop in the MI values, suggesting that we had removed most of the redundancy in the model.
We found that these changes did not change reliability estimates drastically (emotionality, α = .93; worry, α = .92; social/evaluative, α = .92; ATM, α = .88). We also retested the structure of the scale with this shortened version using the same three specifications tested with the full scale (Table 3). Model fit statistics were slightly better for the shortened version than for the full scale. Similar to findings with the full scale, the two-factor model resulted in an improvement of model fit over the unidimensional model (139.71, df = 1, p < .001), and the four-factor model was a better fit than the two-factor model (85.07, df = 3, p < .001). Thus, the four-factor structure remained intact. Model fit statistics for the 15-item four-factor model were better than those for the 19-item four-factor model, and the RMSEA was below the cutoff for good fit (RMSEA = .075), as were the CFI and TLI (both > .99; Table 3). However, we could not directly compare the model from the shortened scale with the original model, as they are not nested models. These results suggest that the 15-item version of the scale performs at least as well as, if not better than, the 19-item version; therefore, we used the 15-item version in subsequent analyses.
External Validity
All analyses examining the relations between teacher math anxiety and other constructs were conducted with correlations in Mplus with the factors of math anxiety from the 15-item scale modeled as correlated latent constructs. Analyses with the raw mean scores for each scale were also conducted, and all results were consistent with those reported here. Results from these alternative analyses are described in the online supplemental material.
Teacher math anxiety across grade bands
To assess whether there were differences in math anxiety for teachers of different grade levels, we examined the correlation between grade band (lower elementary, upper elementary) and the four anxiety types (emotionality, worry, social/evaluative, ATM). Results showed significant correlations for all anxiety types, with lower elementary teachers (coded 0, n = 297) having higher anxiety than did upper elementary teachers (coded 1, n = 102; −.28 ≤ rs ≤ −.21; see Table 4).
Correlations Between Teacher Math Anxiety and Other Teacher Variables
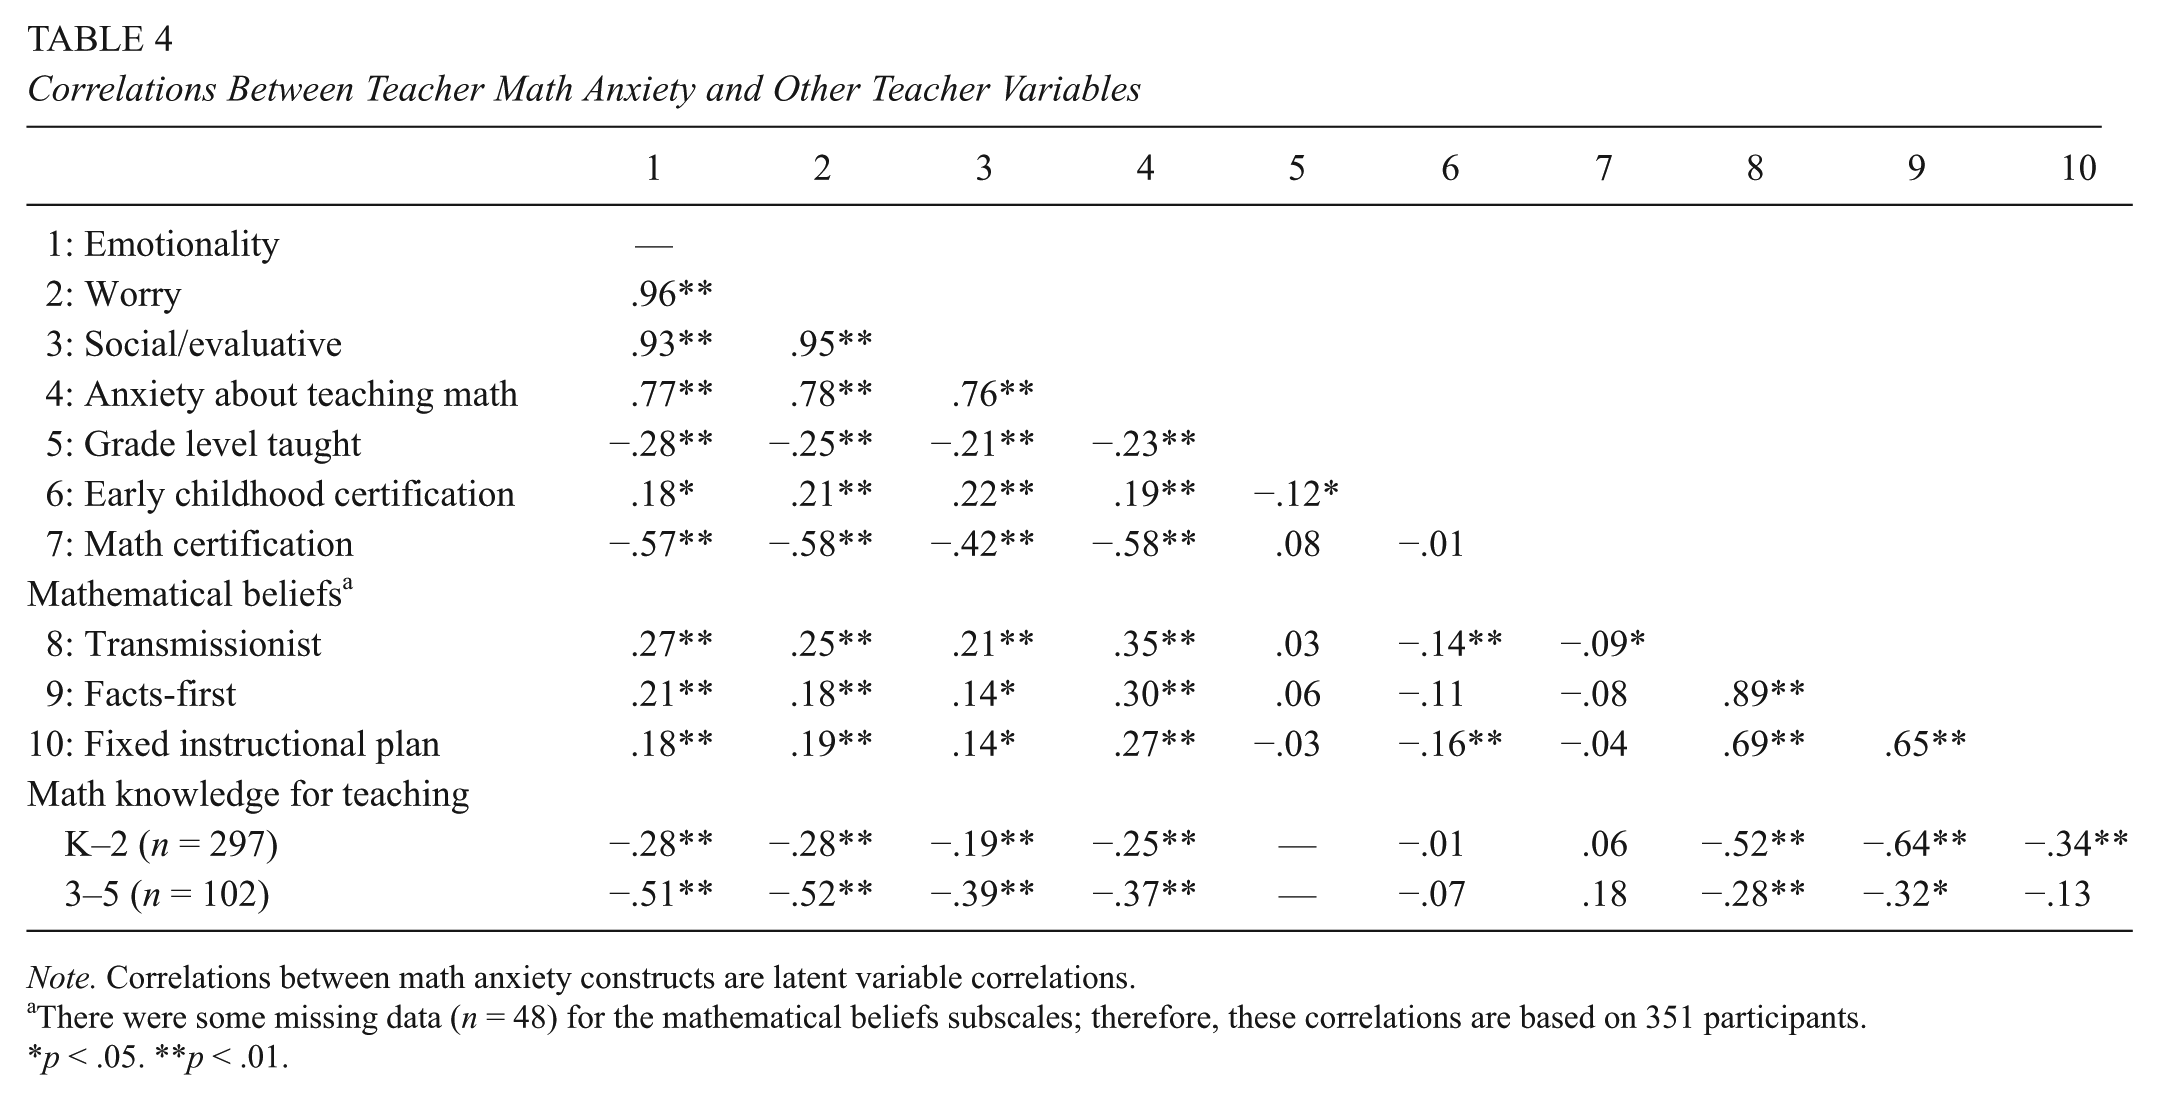
Note. Correlations between math anxiety constructs are latent variable correlations.
There were some missing data (n = 48) for the mathematical beliefs subscales; therefore, these correlations are based on 351 participants.
p < .05. **p < .01.
One way to quantify this difference is to consider that the raw scores for emotionality for lower elementary teachers show that 22% of teachers have an average score at or above the midpoint of the scale (midpoint = 3: somewhat true of me), but this is true for only 8% of the upper elementary teachers. These same comparisons for the other subscales are as follows: worry, 31% versus 17%; social/evaluative, 46% versus 26%; and ATM, 15% versus 8%.
We found similar results when we examined whether teachers with an early childhood teacher certification (preK–3) had higher math anxiety than those without an early childhood teacher certification. There were significant correlations for all anxiety types, with teachers with an early childhood certification (coded 1, n = 84) having higher anxiety than teachers without an early childhood certification (coded 0, n = 315; .22 ≤ rs ≤ .18; see Table 4).
Teacher math anxiety across math certification status
To assess whether there were differences in math anxiety between teachers with and without math teaching certification, we examined the correlation between math certification status (no math certification, math certification) and the four anxiety types. Results showed significant correlations for all anxiety types, with teachers without a math certification (coded 0, n = 388) having higher math anxiety than teachers with a math-specific certification (coded 1, n = 11; −.58 ≤ rs ≤ −.42; see Table 4).
One way to quantify this difference is to consider that the raw scores for emotionality for teachers without math certification show that 19% of teachers have an average score at or above the midpoint of the scale (midpoint = 3: somewhat true of me), but this is not true of any of the teachers with math certification. These same comparisons for the other subscales are as follows: worry, 28% versus 0%; social/evaluative, 42% versus 0%; and ATM, 15% versus 0%.
Relations among teacher math anxiety and other teacher factors
We were also interested in testing if expected relations exist among the subscales of teacher math anxiety, MKT, and beliefs about math teaching and learning (Table 4). Results from correlations show statistically significant negative correlations between MKT and all math anxiety subscales for lower elementary teachers (–.28 ≤ rs ≤ −.19) and upper elementary teachers (–.52 ≤ rs ≤ −.37). These patterns also show that correlations were slightly stronger for the upper elementary teachers than for the lower elementary teachers. The difference between correlations was statistically significant only for the emotionality (z = 2.37, p = .018) and worry (z = 2.48, p = .013) components of GMA but not for the social/evaluative component (z = 1.89, p = .06) or for ATM (z = 1.14, p = .25).
There were also significant associations between math anxiety and transmissionist (.21 ≤ rs ≤ .35), facts-first (.14 ≤ rs ≤ .30), and fixed instructional plan (.14 ≤ rs ≤ .27) beliefs about math teaching and learning. These correlations tended to be slightly stronger (.27 ≤ rs ≤ .35) for the ATM subscale than for the GMA subscales (.14 ≤ rs ≤ .27). The correlations for ATM were significantly stronger than those for the subscales of GMA for all beliefs subscales (zs > 2.2, ps < .03).
Discussion
Teachers’ emotions are critical aspects of their experiences as teachers as well as their students’ learning experiences in the classroom (Chang, 2009; Frenzel et al., 2018; Sutton & Wheatley, 2003). Among these teacher emotions, math anxiety has been identified as a potentially important emotion to consider. Research suggests that teacher math anxiety is a malleable factor that may explain variability in teaching practices and student math outcomes. As a first step to understanding the potential consequences of math anxiety for classroom teaching and student learning, it is important to have a well-validated measure of this construct for use in this population. In this study, our goal was to assess the construct validity of a new measure of math anxiety developed for use with practicing teachers: the Math Anxiety Scale for Teachers.
The development process of the scale provided evidence for substantive validity, including our use of available literature to identify the definition of the construct and through the consideration of feedback from expert reviews and cognitive interviews. Using data based on the responses of 399 practicing elementary teachers, we examined the structural validity of the scale, which provided some evidence of reliability and confirmed the scale structure to match that which we used to develop the items. Specifically, three highly correlated subscales of GMA were confirmed (emotionality, worry, and social/evaluative anxiety), and ATM was a separable construct. We also assessed the scale for redundancy and problematic items and removed four items, which led to a 15-item version of the scale for future use. In support of external validity, we find that math anxiety is more pervasive for lower elementary school teachers than for upper elementary school teachers and is lower for teachers with a math certification. We also see that teachers with higher math anxiety have lower levels of MKT and more traditional beliefs about math teaching and learning.
Substantive Validity
We took steps during the development process to maximize the validity of the MAST for use with practicing teachers by developing items to measure important theoretical distinctions in math anxiety, seeking item feedback from practicing teachers and math education researchers, and conducting cognitive interviews with practicing teachers (Desimone & LeFloch, 2004; Hamilton et al., 1997; Liebert & Morris, 1967; Wigfield & Meece, 1988). Using multiple sources of information to make item writing and editing decisions led to substantial changes to the items during the development process, which we believe led to an instrument that better reflects math anxiety as it is understood by researchers and practicing elementary school teachers.
Structural Validity
The MAST was designed to incorporate multiple components of teacher math anxiety that have been identified in published research literature, specifically addressing emotionality, worry, and social/evaluative facets of GMA (Liebert & Morris, 1967; Wigfield & Meece, 1988). The MAST is also designed to have the ability to differentiate GMA from ATM. Overall, we found that as long as we accounted for at least two factors, the confirmatory factor analyses fit fairly well, but the best-fitting model was with two factors (GMA and ATM), wherein the GMA factor was made up of three subscales (emotionality, worry, and social/evaluative). It is important to note, however, that the three subscales of GMA were highly correlated with one another (rs > .90); thus, although the model fit appears to be better when they are separated out, it is unclear whether these aspects of math anxiety are truly separable for teachers. It is possible that the wording of the items used across these scales was too similar and that items did not do a good enough job capturing the distinctions among these aspects of anxiety. Until the factor analyses are replicated, we are tentative in our conclusion that these truly represent three subfactors of math anxiety due to the potential for overfitting.
In addition, we found that our GMA subscales and the ATM subscale were more highly correlated with one another than what other studies had found (Brown et al., 2011; Hadley & Dorward, 2011). It is unclear why this correlation may be higher than that found by other researchers. Perhaps our scales about GMA were more targeted to nonstudent experiences with mathematics, whereas Hadley and Dorward (2011) used a version of the MARS that was designed for use with college students. It is difficult to compare with the findings of Brown et al. (2011) because they coded prospective teachers’ written reflections to see if they mentioned GMA or ATM; that is, they did not give a rating scale. Even with this higher correlation, these components were demonstrated to be separable in factor analyses. Additional evidence for a distinction between the anxiety constructs is that the correlations between ATM and teachers’ beliefs about teaching and learning are stronger than the correlations between GMA and teachers’ beliefs about math teaching and learning; thus, they are measuring slightly different components of math anxiety. Overall, the hypothesized scale structure for the shortened (15-item) scale fit the data well and provides evidence for the structural validity of the scale. Importantly, shortening the length of the scale increases its useability for researchers working within time constraints.
External Validity
Teacher math anxiety across grade bands
We found that lower elementary teachers in our sample had higher levels of all measured types of teacher math anxiety than did upper elementary teachers, which fits with expectations based on past research. Similarly, we found that teachers with an early childhood teaching certification had higher math anxiety than did teachers who did not have an early childhood certification (i.e., had an elementary teaching certification). This contrasts with Hadley and Dorward’s (2011) finding that there were grade-level differences for GMA but not for ATM. These results are worthy of further investigation to better understand why a difference within elementary school teachers might exist. One potential reason is that lower elementary teachers and those with early childhood teaching certificates self-select into teaching the earlier grades because they feel anxious about teaching the more difficult math content at the upper elementary level. It is especially interesting that there were differences in ATM, as one might argue that lower elementary teachers might be similarly anxious to upper elementary teachers because they are likely comfortable with the content that they teach at their current grade level. These results suggest that early elementary school teachers may be a particularly important group to consider when thinking about the consequences of teacher math anxiety and the ways to alleviate it.
Teacher math anxiety across math certification status
As expected, there was a very small number of elementary teachers who had a math teaching certification (2.0% lower elementary, 4.9% upper elementary), which is consistent with but slightly higher than available data describing the general population of elementary teachers in the United States (National Center for Education Statistics, 2017). Despite the small sample of teachers with math certification (n = 11), we were still able to see that teachers with math certification had lower levels of math anxiety of all types than those without. It may be the case that math-anxious teachers avoided gaining certification in math or that the preparation needed to gain a math teaching certification leads to reduced math anxiety. This fits with general research suggesting that those with a stronger educational background in math are less likely to have math anxiety (Hembree, 1990), but we are cautious in our interpretations due to the small sample size of teachers with math-specific certifications. We hope that future research with larger samples can examine this question and delve into why teachers might get a middle or high school math certification and then choose to teach in the elementary grades. This further work might help us to understand whether training more elementary teachers in math specifically or recruiting those pursuing math degrees into elementary education is useful for decreasing the overall math anxiety found in the elementary school teaching force.
Relations among teacher math anxiety and other teacher factors
Consistent with the findings of other research with practicing teachers (e.g., Battista, 1986; Rayner et al., 2009) and with general research on the relation between math anxiety and math knowledge, we found that elementary school teachers’ GMA and ATM had small to moderate negative correlations with their MKT. Thus, teachers with higher math anxiety are more likely to perform poorly on a test of their MKT, but the correlations are weak to moderate, suggesting that math anxiety is not merely a reflection of math knowledge, similar to what we find in the literature in general (Hembree, 1990). It is possible that because of their higher math anxiety, teachers perform lower on this test of their MKT as compared with their actual knowledge. In other words, the estimate of their MKT may be biased downward due to their math anxiety. Because there is not a perfect correlation between math anxiety and math knowledge, other factors (e.g., general anxiety) will be important to study with these variables to understand why people with similar levels of knowledge may or may not develop math anxiety.
Interestingly, we found a pattern that the correlations between math anxiety and MKT were higher for upper elementary teachers than for lower elementary teachers, although differences were statistically significant only for the emotionality and worry components of GMA. It is possible that math anxiety and MKT are more closely linked for these teachers, or it could be that the math content included on the upper elementary assessment is more challenging and thus more related to how teachers feel about math more generally. The main distinction between the two assessments is that items about fractions are included in the upper elementary assessment but not in the lower elementary assessment. Because fractions are often referenced by math-anxious teachers as the place where their mind goes when they think of things in math that make them anxious, this distinction could potentially explain the difference. In addition, it is possible that teachers with math anxiety experience more anxiety when completing the fractions problems on the test. This could magnify the effects of math anxiety and further impede performance on the assessment if they are anxious about the fraction items.
We also found that teachers with higher levels of math anxiety tended to espouse beliefs about math teaching and learning consistent with the prevailing cultural beliefs in the United States (i.e., transmissionist, facts-first, and fixed instructional plan), which is consistent with findings of Swars et al. (2009). Specifically, teachers with higher math anxiety were more likely to believe that students learn best by solving problems the way that the teacher shows them, that students’ ability to recall number facts is a prerequisite for solving word problems, and that instruction should strictly follow the scope and sequence of topics in the textbook.
It is possible that teachers with higher anxiety prefer that students follow the procedure taught because they would be anxious if confronted with other strategies with which they were not familiar or did not understand and it would require more cognitive resources to work through these newer strategies, resources that may be utilized by anxiety (Eysenck et al., 2007). Similarly, higher-anxiety teachers may believe that facts are important to learn before solving word problems because the idea of approaching word problems without the exact knowledge needed to solve them might be anxiety provoking for them. Higher-anxiety teachers might prefer a fixed instructional plan as a way to avoid unexpected situations that they are not prepared to encounter, which could lead to anxiety for them. The relation with reliance on a fixed instructional plan also suggests that it is possible that teachers with higher math anxiety might seek relief from their anxiety by adhering to a scripted textbook instead of potentially needing to improvise. These fixed plans could allow teachers to relieve some of the cognitive demands of teaching, which may be necessary if their anxiety is using cognitive resources (Eysenck et al., 2007). The relation between teacher math anxiety and beliefs about math teaching and learning suggests that math anxiety may be a barrier to teachers adopting student-centered teaching and formative assessment strategies.
Limitations and Future Directions
In this study, we present some initial evidence for the construct validity of the MAST for use with practicing teachers, but there are limitations to our work that we believe have important implications for future research in this area. First, the MAST may have captured only some of the important aspects of teacher math anxiety. Additional research with elementary school teachers may help to determine if there are additional components of math anxiety that are missing from our scale. For example, items capturing some of the consequences of math anxiety, such as task avoidance (in terms of doing math oneself and teaching math) could be useful or perhaps be a different, related scale. Similarly, we did not test whether the social/evaluative component of GMA might include emotionality and worry components within it, nor did we test this for the ATM scale. Thus, it would be worthy of future research to examine how these distinctions might play out in these constructs. In addition, our GMA items mainly focused on doing math problems, which does not capture all that is involved in mathematics, such as mathematical reasoning and conceptual understanding.
Second, the validity of the MAST for measuring math anxiety in practicing teachers should be assessed further, through correlations with existing math anxiety measures. Third, although the model fit and reliability estimates appear to be adequate for the 15-item scale with this sample, the MAST should be field-tested with additional samples of teachers to examine the generalizability of these findings and to see if other additions or modifications would improve the scale. Fourth, there is no clear cutoff determined for what constitutes evidence that a person is “high” in math anxiety. Thus, we used the somewhat arbitrary cutoff of the midpoint of the scale to provide descriptive data for the sample, but these results should not be interepreted as providing evidence for a certain percentage of teachers exhibiting high levels of math anxiety.
Although we conducted this study with a large sample of practicing teachers, there are still some limitations to our sample. Participants were part of a randomized controlled trial of math-focused professional development programs and therefore may have self-selected into the trial because they were lower in math anxiety; in contrast, those who were very high in math anxiety may have chosen to not attend math-focused professional development. As such, the participants could be, on average, lower in math anxiety than the general population of teachers. There are characteristics of the sampling procedure that help to alleviate this concern, including the fact that the professional development provided continuing education credit, which may have swayed those with math anxiety to attend. Alternatively, some people could have chosen to participate in the trial because they have math anxiety and thus want to improve their math teaching skills. There is some evidence to suggest that this sample is not different from the general population of teachers based on available data, as they are similar to teachers in the United States demographically and a generally similar percentage of the elementary teachers has a math/math education degree or certification (National Center for Education Statistics, 2017). Regardless, this sample may not be representative of the general population of teachers; thus, the scale should be further tested within a representative sample of teachers.
Conclusion
In this study, we presented some initial evidence for the construct validity of the MAST for use with practicing teachers. This scale showed the expected structure, teasing apart three theoretical components of GMA as well as ATM. Scores on the measure also correlated as expected with other variables. Specifically, math anxiety was higher among lower elementary teachers than upper elementary teachers, higher for teachers with an early childhood teaching certification than for those without, and lower for teachers with math teaching certification versus those without. We also find that teachers with higher math anxiety have lower math knowledge for teaching and more traditional beliefs about math teaching and learning.
Measurement quality is critical for any research field, and in this case, we believe that this measure can help to increase research in this important area. We encourage researchers to involve practicing teachers in their work so that we can better understand math anxiety’s potential consequences for math teaching and student learning. In addition, if effects of teacher math anxiety are evident, researchers must learn how and when to intervene as a way to guard against potentially harmful effects of math anxiety on math teaching and learning. To know if interventions are effective, we must have good measurement; thus, we hope that researchers can use the MAST for this purpose in the future.
Supplemental Material
DS_10.1177_2332858419839702 – Supplemental material for Construct Validation of the Math Anxiety Scale for Teachers
Supplemental material, DS_10.1177_2332858419839702 for Construct Validation of the Math Anxiety Scale for Teachers by Colleen M. Ganley, Robert C. Schoen, Mark LaVenia and Amanda M. Tazaz in AERA Open
Footnotes
Funding
This work was supported by the Florida Department of Education (Grant 371-2356B-6C001) and by the Institute of Education Sciences, U.S. Department of Education (Grant R305A170463). The opinions expressed are those of the authors and do not represent views of the institute or the U.S. Department of Education.
Authors
References
Supplementary Material
Please find the following supplemental material available below.
For Open Access articles published under a Creative Commons License, all supplemental material carries the same license as the article it is associated with.
For non-Open Access articles published, all supplemental material carries a non-exclusive license, and permission requests for re-use of supplemental material or any part of supplemental material shall be sent directly to the copyright owner as specified in the copyright notice associated with the article.