
Abstract
Students’ executive functions (EFs) are linked to school success. Although school-age children spend much of their time interacting with peers, few studies have explored how children’s classmates may promote EF development in elementary school. In this study, we test whether mean levels and variability in classmates’ EF skills are associated with growth in individual students’ accuracy and speed on EF tasks among third, fourth, and fifth graders (N = 806). We find that classmates’ speed, but not accuracy, on EF tasks is linked to significant improvements in individual students’ EFs over the school year. Classmates’ average EFs, as indexed by faster accurate responses on EF tasks, are associated with improvements in individual students’ speed on EF tasks. These results were robust to the inclusion of individual students’ general processing speed. In contrast, variability in classmates’ accuracy and speed on EF tasks was not associated with individual students’ EF growth. Our results highlight the role of peers and the school context for EF development in middle childhood.
Executive functions (EFs) are a set of higher-order cognitive skills that help students regulate their behaviors and attention (Diamond, 2013). Children’s EFs are important for the acquisition of academic skills (Cartwright, 2012; Kolkman, Hoijtink, Kroesbergen, & Leseman, 2013) and are predictive of academic achievement over and above intelligence and socioeconomic status (Blair & Razza, 2007; Bull, Espy, Wiebe, Sheffield, & Nelson, 2011). Students engage their EFs to behave appropriately in the classroom context, to learn new academic content, and to play and collaborate with peers (Ciairano, Visu-Petra, & Settanni, 2007; Finch & Obradović, 2017; Sasser, Bierman, & Heinrichs, 2015). During elementary school, interactions with peers become an increasingly important way for children to practice regulating their attention and behaviors (Gifford-Smith & Brownell, 2003). A few studies explored the role of classmates’ EF skills for EF development in early childhood (Montroy, Bowles, & Skibbe, 2016; Skibbe, Phillips, Day, Brophy-Herb, & Connor, 2012; Weiland & Yoshikawa, 2014). The current study extends previous literature to examine whether classmates’ EFs are associated with the development of individual students’ EF growth in middle childhood. We explore how average levels and variability in classmates’ performance on direct tests of EFs relate to changes in individual students’ EF skills during the school year.
EFs in the Elementary School Context
Although school influences on the development of EF skills have been predominantly studied in the early childhood period (Montroy et al., 2016; Weiland, Ulvestad, Sachs, & Yoshikawa, 2013), EFs continue to develop through the elementary school years and beyond (Best, Miller, & Jones, 2009; Lee, Bull, & Ho, 2013). In middle childhood, students face increased attentional and cognitive demands, as they are asked to manage their behaviors with less direct adult scaffolding. During this developmental period, students are expected to independently listen and keep track of directions, collaborate on group activities, complete work, and play appropriately with peers—all of which require children to regulate their attention and behaviors (Finch & Obradović, 2017; Sasser et al., 2015).
In preschool, EFs are typically measured by children’s accuracy (i.e., percentage correct) on tasks. As children get older, they demonstrate ceiling effects on accuracy measures; as such, researchers have also included children’s reaction times (RTs) on EF tasks such that faster RTs on EF-demanding task trials indicate better EFs (Zelazo, Blair, & Willoughby, 2016). In contrast, children’s RTs on task trials where EF demands are absent represent children’s general processing speed. During middle childhood, children’s abilities to monitor their performance and adjust their behavior (i.e., metacognition) increase substantially, supporting improvements in EFs (Best & Miller, 2010). For example, children begin to show a “speed-accuracy tradeoff” by slowing down to increase their accuracy during this developmental period (Davidson, Amso, Anderson, & Diamond, 2006). Thus, it is important to examine how children’s accuracy and RTs on EF tasks are each related to student outcomes during middle childhood.
In middle childhood, children engage in more frequent peer-to-peer interactions, which are less likely to be mediated by adults (Gifford-Smith & Brownell, 2003). The quality of children’s social interactions with peers plays a key role in shaping their social-emotional and academic skills in middle childhood (Pedersen, Vitaro, Barker, & Borge, 2007; Véronneau, Vitaro, Brendgen, Dishion, & Tremblay, 2010). Peer interactions become increasingly complex during middle childhood, requiring students to regulate their behaviors to engage in organized play and discussions. Indeed, there are reciprocal associations between developing social skills and children’s EFs across elementary and middle school (Holmes, Kim-Spoon, & Deater-Deckard, 2016). Therefore, it is possible that interacting with peers with high EFs may provide children with examples of well-regulated behavior, more opportunities to practice self-regulation skills, and the motivation to regulate themselves.
Furthermore, well-regulated peers might create an overall classroom environment conducive to practicing self-regulation skills. One study, for example, found that children who were better regulated spent less class time on unproductive activities, such as waiting, off-task behaviors, or disruptions (Day, Connor, & McClelland, 2015); others studies showed that children who were engaged in classroom tasks gained more self-regulation skills during the school year (Bierman, Torres, Domitrovich, Welsh, & Gest, 2009; Williford, Vick Whittaker, Vitiello, & Downer, 2013). The classroom composition of peers’ EFs likely shapes the culture of the classroom environment and affects classroom norms and expectations for individual students’ self-regulation.
Average Peer Effects and Children’s Development
Most studies examining the role of classmates’ skills for children’s development focused on links between classroom levels of children’s academic achievement or behavioral problems and individual students’ development in those domains (Gottfried, 2014; Hanushek, Kain, Markman, & Rivkin, 2003; Thomas, Bierman, & Powers, 2011). Typically, researchers estimate “peer effects” by analyzing how classmates’ average levels of a skill in the fall are linked to growth in individual students’ skills from fall to spring. Having classmates with higher average levels of reading and math scores has been associated with growth in individual students’ test scores during elementary school, even after controlling for a robust set of child-, classroom-, and teacher-level covariates (Boucher, Bramoullé, Djebbari, & Fortin, 2014; Gottfried, 2014; Hanushek et al., 2003). The literature also supports similar peer effects with regard to students’ behavior problems such that being in classrooms where peers have high average levels of aggression and delinquency is linked to increases in individual students’ behavior problems and reductions in individual students’ test scores in elementary and middle school (Figlio, 2005; Mercer, McMillen, & DeRosier, 2009; Muller, Hofmann, Fleischli, & Studer, 2016; Thomas et al., 2011; Yudron, Jones, & Raver, 2014). Given that EFs are related to both academic achievement and behavioral problems (Bull et al., 2011; Ciairano et al., 2007; Jacob & Parkinson, 2015; Kolkman et al., 2013; Schoemaker, Mulder, Deković, & Matthys, 2013), classmates’ EFs might be similarly important for children’s development during middle childhood.
A few studies explored associations between classmates’ average levels of EFs and children’s cognitive skills in the early childhood period. There is some evidence that classmates’ EFs are linked to preschoolers’ growth in early language and literacy skills (Montroy et al., 2016; Skibbe et al., 2012), although one study did not find an association between classmates’ EFs and preschoolers’ vocabulary achievement (Weiland & Yoshikawa, 2014). To our knowledge, only two studies examined whether classmates’ EFs are linked to individual children’s growth in EFs across a single academic year. Montroy and colleagues (2016) found that classmates’ average levels of EFs were positively linked to growth in individual preschoolers’ EFs in a relatively advantaged sample of children. In contrast, Weiland and Yoshikawa (2014) did not find evidence that classmates’ average levels of EFs were linked to individual children’s growth in EFs in a diverse sample of predominantly low-income preschoolers.
These divergent findings may be due to many factors, including sample characteristics and study design. Montroy et al. (2016) drew participants from private and public community-based preschool settings that did not have specific curricula. Children in the sample were predominantly Caucasian and had relatively well-educated mothers. In contrast, Weiland and Yoshikawa (2014) drew participants from urban public prekindergarten programs that were part of a large-scale intervention study to improve preschool quality. The intervention program, which increased students’ EFs (Weiland & Yoshikawa, 2013), included empirically validated curricula with personalized coaching for teachers. The sample was racially and ethnically diverse, and most children were eligible for free or reduced-price lunch. It is possible that differences between community-based child care centers and more public school-based prekindergarten programs influence peer effects, but more information is needed about why classmates’ EFs may be more salient in certain school contexts.
In addition, coverage (i.e., the number of children used to estimate the classroom-level average EFs) differed between these studies. Similar to authors of other peer effect studies (Justice, Petscher, Schatschneider, & Mashburn, 2011; Mashburn, Justice, Downer, & Pianta, 2009), Weiland and Yoshikawa (2014) randomly tested five students per classroom on average. In contrast, Montroy et al. (2016) tested 12 students per classroom on average, with over half of the students recruited in most (65%) classrooms. Higher classroom-level coverage supports more precise estimate of classmates’ skills and may have enabled Montroy and colleagues to better detect peer effects.
Variability of Classmates’ Skills
To more fully characterize the distribution of classmates’ skills, some researchers measured the variability of classmates’ skills, in addition to average levels of classmates’ skills. The standard deviation of classmates’ skills represents how closely individual students’ skills are clustered around the classroom mean. Theoretically, classrooms that are more homogeneous in students’ skills might run more smoothly. Classroom activities would likely be at the appropriate level to support most students’ academic and behavioral development when students have relatively similar skill levels (Tomlinson et al., 2003). Two studies that explored variability in students’ academic skills found null effects on elementary school students’ academic growth, based on state-level administrative data with high coverage (Burke & Sass, 2013; Hanushek et al., 2003). This suggests that variability in classmates’ achievement may not be strongly linked to students’ academic learning in the early grades. However, variability in classmates’ social-emotional skills might operate differently in the classroom context.
Greater levels of variability in peers’ skills may not necessarily have a negative effect on individual students’ socioemotional development. For example, research on parent-child interactions highlights the benefits of variability in emotional states and switching more frequently among different emotional states during an interaction, including negative emotions (Granic & Patterson, 2006; Hollenstein, 2007). These studies suggest that more variability in parents’ and children’s emotional states may help children practice regulating positive and negative emotions by providing them opportunities to deal with a variety of emotional states (Granic & Patterson, 2006; Hollenstein, Granic, Stoolmiller, & Snyder, 2004). Similar mechanisms might extrapolate to peer groups such that more variability in peers’ self-regulation skills would provide individual children with more practice regulating their emotions and behaviors in response to their peers’ actions.
Empirical studies examining the effects of variability in classmates’ nonacademic skills on individual students’ development are rare. The main obstacle is that there are few direct measures of children’s nonacademic skills (e.g., EFs) that can be easily used in a classroom context at scale (McKown, 2017). Using teacher reports of children’s mental health symptoms, Yudron and colleagues (2014) demonstrated that more variability in classmates’ externalizing behavior problems was linked to increased internalizing behavior problems and lower social competence for preschoolers. No studies, to our knowledge, examined whether variability in classmates’ EFs are associated with individual students’ EF growth.
Current Study
This study is the first to examine associations between classmates’ EFs and individual children’s EF development in middle childhood. We leveraged a unique data set that includes repeated direct assessments of third-, fourth-, and fifth-grade students’ EFs for nearly all children across 33 classrooms. This study design enabled us to have high coverage of students within each classroom (M = 90%). We used accuracy and RTs across four tasks to create two measures of classmates’ EFs: average levels and variability. First, we investigated how average levels of classmates’ EFs are linked to growth in students’ EF skills from fall to spring. We hypothesized that higher average levels of classmates’ EFs would be linked to more growth in individual students’ EFs between the fall and spring of the school year. Second, we conducted exploratory analyses to examine whether variability in classmates’ EFs are linked to growth in individual students’ EF skills, after controlling for average levels of classmates’ EFs.
Method
Sample and Setting
Third-, fourth-, and fifth-grade teachers were recruited from two public school districts in the San Francisco Bay Area in the academic year before data collection took place. All students in target classrooms were invited to participate through home mailings and Back to School Night presentations. For children’s participation in classroom assessments of EF skills, parents provided passive consent (i.e., parents were notified of the study procedures and were offered an opportunity to withdraw from the study; only one family withdrew its child from participation in this part of the study), and each student provided an active verbal assent (n = 813). Furthermore, we obtained an active written consent from a subset of 569 parents to access students’ school administrative data, including state-administered standardized test scores and demographic data about parents and children. All 33 teachers gave informed consent.
The analytic sample for this study included 806 children (275 third graders, 354 fourth graders, and 177 fifth graders; 48% female) with valid data for the fall or spring EF assessment. A quarter of students in our sample (24.69%) were in multigrade classrooms, where students from different grade levels were combined into a single classroom with one teacher (e.g., fourth- and fifth-grade class). Some third-grade students were in combined second- and third-grade classrooms. Second-grade students in these classrooms were not included in the study. Our sample was socioeconomically and ethnically diverse: Among the 70% of parents who reported their children’s ethnicity, 6% were identified as African American, 23% as Caucasian or White, 34% as Asian or Pacific Islander, 32% as Hispanic/Latino, and 6% as multiracial or other. Among the 58% of parents who reported their educational attainment, 37% had a high school degree or less, and 21% had a graduate degree.
Procedures
Data for this study were collected from two assessments: in the fall and spring of a single academic year. The fall and spring assessments were collected within 3 weeks of the beginning and end of the school year, respectively. All students completed EF tasks on tablet computers at each time point. Developmentally appropriate and widely used EF tasks were adapted to Android tablet computers. During the assessment, each child was given a tablet computer, and all students in the classroom completed the four EF tasks as a group (Obradović, Sulik, Finch, & Tirado-Strayer, 2018). In each session, three research assistants were present to administer the EF tasks to the entire class at one time. One assessor stood at the front of the class, using large posters to explain the task and guide children through each step. The two remaining assessors assisted children with their tablets and helped address any technical problems as needed.
The tasks and instruction screens were illustrated with cartoon pictures, designed to be fun and appealing to children. Tasks were presented with simplified rules that children could read on their own. Each task included a set number of practice items and test trials. Password-locked screens were used to ensure that all students were on the correct task when the research assistant explained the instructions and that they began each task at the same time. Except for the Digit Span Backward task, each set of EF trials was timed so that children finished at approximately the same time. Findings from a prior study demonstrated that this group EF assessment administered with tablets was a valid approach to directly measuring students’ EFs (Obradović et al., 2018).
Measures
Executive functions
The Digit Span Backward task, drawn from the Wechsler Intelligence Scale for Children–IV (Flanagan & Kaufman, 2009), is a measure of children’s working memory skills. A series of digits were presented sequentially on the tablet screen. The student was instructed to enter those numbers backward onto a numeric keypad after the last digit was presented. There were four practice trials, each with strings that were two digits long. These practice trials were followed by eight test trials of increasing difficulty (two trials each of two, three, four, and five digits). Accuracy scores were computed as the proportion of correct test trials (fall, α = .80; spring, α = .77).
The Hearts and Flowers (HF) task is a measure of inhibitory control and cognitive flexibility skills (Davidson et al., 2006). There were three blocks: 12 congruent “heart” trials, 12 incongruent “flower” trials, and 33 mixed “heart and flower” trials. On each trial, students were presented with an image of a heart or a flower, which appeared on the right or left side of the screen. For congruent heart trials, students were instructed to press the button on the same side as the heart. For incongruent flower trials, students were instructed to press the button on the opposite side of the flower. Accuracy scores were drawn from the incongruent block (fall, α = .89; spring, α = .83) and the mixed block (fall, α = .90; spring, α = .90). Although the window of time in which children could respond to the HF task (750 ms) was based on previous research (Davidson et al., 2006), the pacing for the mixed block was too rapid for children in this study, resulting in many missing RT scores during the mixed block. Consequently, RT scores were drawn only from the incongruent block (fall, α = .87; spring, α = .94), and we increased the maximum response time to 1,250 ms for the spring assessment.
The Multi-Source Interference Test (MSIT) is a measure of inhibitory control skills (Bush & Shin, 2006). There were two blocks: 24 congruent trials and 24 incongruent trials. In both blocks, students were presented with a sequence of three digits. For each trial, two of these digits (the distractors) were the same, and one differed (the target; e.g., “2 2 1”). Students were instructed to press a button whose numeric value corresponded to that of the target. For example, the correct response to the sequence “2 2 1” would be “1.” For the congruent trials, the distractors were always zeroes, and the position of the target always corresponded to the numeric value of the correct button press (i.e., “1 0 0,” “0 2 0,” “0 0 3”). For the incongruent trials, the distractors were nonzero, and the numeric value of the correct button press was always different from the position of the correct response (e.g., “2 3 3,” “2 2 1,” “1 3 1”). Accuracy and RT scores from the incongruent block of trials were used (fall accuracy, α = .94; spring accuracy, α = .92; fall RT, α = .89; spring RT, α = .91).
The Flanker task is a measure of students’ inhibitory control and cognitive flexibility skills (Diamond, Barnett, Thomas, & Munro, 2007). There were three blocks: 17 blue fish trials, 17 pink fish trials, and 45 mixed trials (blue and pink fish). Students were asked to focus on a given stimulus while inhibiting attention to stimuli flanking it. They were shown a row of fish on a screen and told to press the right or left arrow, depending on the direction that the target fish was facing. In the first block (blue fish), the target was the middle fish, whereas in the second block (pink fish), the target fish were the flanking outside fish. In the third block, pink and blue fish were mixed. During congruent trials, all fish faced the same direction, whereas during incongruent trials, the middle and outside fish did not face the same direction. Accuracy scores were drawn from the 12 incongruent blue and pink trials (fall accuracy, α = .96; spring accuracy, α = .97) and 45 mixed trials (fall accuracy, α = .89; spring accuracy, α = .91). We found that children who were slower on the Flanker mixed block demonstrated higher accuracy on it and better scores on the other task blocks. This suggests that quicker RTs during the Flanker mixed block are not a valid measure of EFs; therefore, RT scores were drawn from the 12 incongruent blue and pink trials only (fall RT, α = .94; spring RT, α = .95).
Scoring of EF tasks
Anticipatory responses—defined as a response <200 ms after stimulus presentation—were recoded as missing for the accuracy and RT scores. Furthermore, the HF, MSIT, and Flanker tasks were timed such that students were unable to respond after 750 ms (fall) / 1,250 ms (spring), 2,500 ms, and 1,500 ms, respectively. If the student failed to respond during this window, the trial was counted as incorrect for the accuracy score and as missing for the RT score. Finally, following standard practice, RT scores were calculated only for the accurate trials and not for the first trial in each block. Outliers, defined as accuracy or RT scores that were >4 SD above or below the sample mean, were winsorized to the highest nonoutlier value observed for that task. Across all task blocks, there was only one outlier value in the fall and four in the spring.
We used confirmatory factor analysis to inform our data reduction approach for the accuracy and RT scores. Mplus 7.3 (Muthén & Muthén, 2014) was used to estimate these models. For the accuracy composite, we started with six indicator variables: Digit Span Backward (working memory), MSIT incongruent block (inhibitory control), HF incongruent block, HF mixed block (cognitive flexibility), Flanker blue and pink incongruent blocks (inhibitory control), and Flanker mixed block (cognitive flexibility). To account for similarity between different blocks for each task, we estimated a one-factor model in which we correlated the residual variances for the two HF blocks and for the two Flanker blocks. Model fit was acceptable in both fall and spring—fall: χ2(df = 7) = 26.529, p < .001, root mean square error of approximation = .062, comparative fit index = .964, standardized root mean square residual = .033; spring: χ2(df = 7) = 20.802, p = .004, root mean square error of approximation = .052, comparative fit index = .980, standardized root mean square residual = .026. Given these confirmatory factor analysis results, we standardized and averaged the HF incongruent and mixed blocks and the Flanker incongruent and mixed blocks to create a single score for each task. We then averaged and standardized the scores from each of the four tasks to create a single accuracy composite score for the fall and spring (fall, α = .62; spring, α = .64). The spring task scores were standardized per the fall mean and standard deviation to measure growth in EF scores from fall to spring. As shown here, fall-standardized spring scores (zis) were calculated as individual student i’s raw scores on each task (xis) in the spring minus the fall mean score on the task (xf) and divided by the sample fall standard deviation on the task (sf). Standardizing spring task scores based on the fall mean and standard deviation allowed us to measure growth in EF scores from fall to spring.

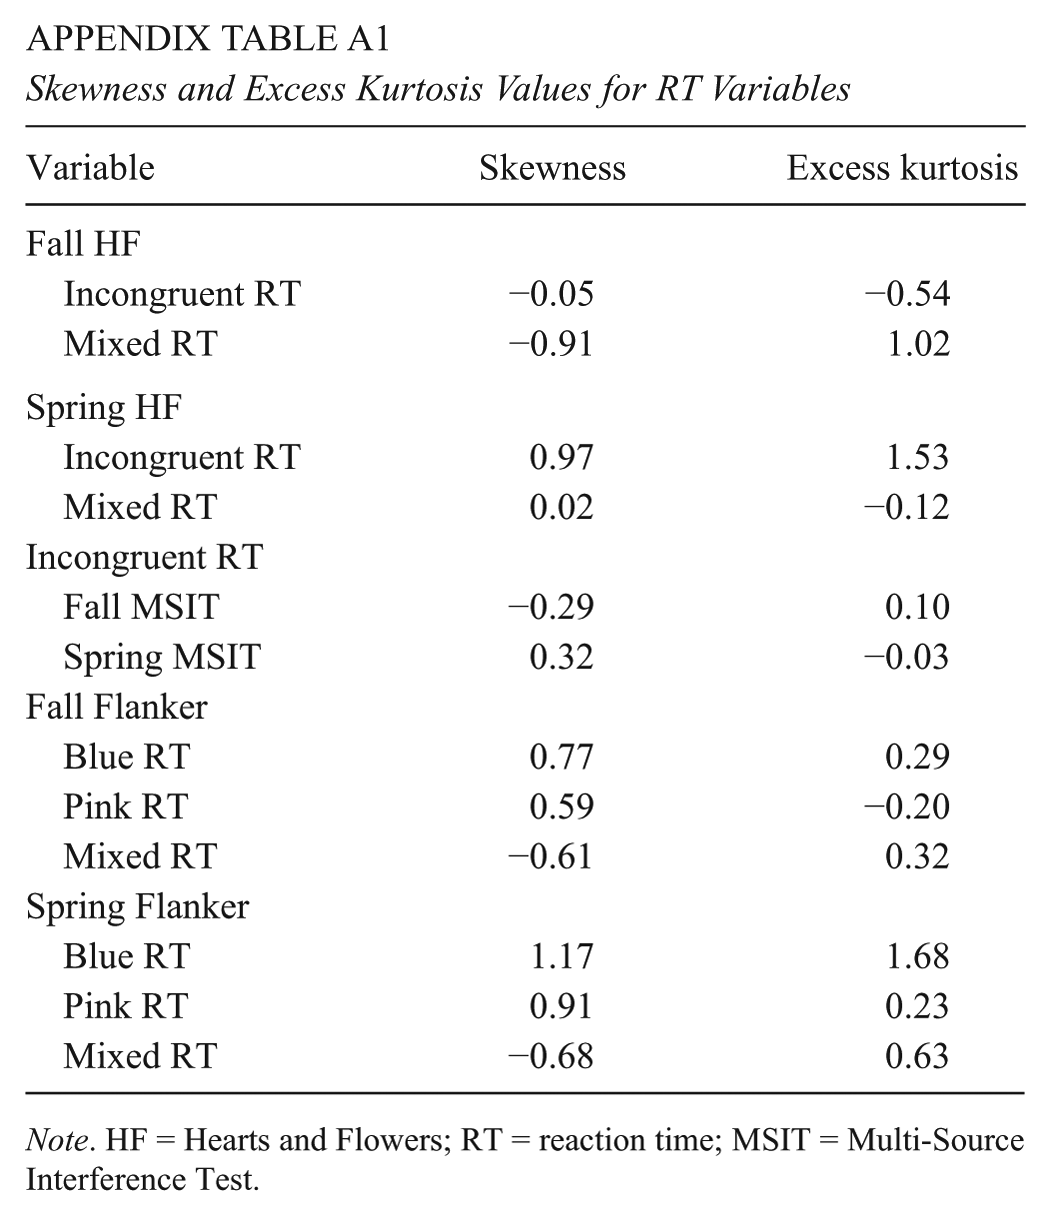
For the RT composite, we started with three indicator variables: MSIT incongruent block (inhibitory control), HF incongruent block (inhibitory control), and Flanker blue and pink incongruent blocks (inhibitory control). We examined the normality of the RT variables using the skewness and excess kurtosis indices (see Appendix Table A1). All variables were relatively normally distributed; thus, we did not need to transform the variables. We standardized and averaged the scores from each of the three tasks to create a single RT composite score for the fall and spring (fall, α = .57; spring, α = .72). As with the accuracy composite score, the spring RT task scores were standardized with the fall mean and standard deviation. For ease of interpretation, RT composite scores were reversed so that higher scores can be interpreted as children demonstrating better EF skills.
We calculated difference scores by subtracting the average RT on congruent trials (which have no EF demands) from the average RT on incongruent or mixed trials (which do have EF demands). Across all tasks, the difference scores were not significantly correlated with children’s accuracy composites on the same blocks or with measures of their academic achievement. Therefore, we did not use the difference scores, as they did not seem to capture EFs in our sample.
A measure of processing speed was created from three indicator variables: MSIT congruent block, HF congruent block, and Flanker blue congruent trials blocks. We standardized and averaged the scores from each of the three tasks to create a single processing speed composite score for the fall (α = .73). For ease of interpretation, the processing speed composite scores were reversed so that higher scores can be interpreted as children demonstrating quicker processing speed.
Classmates’ EFs
We created two measures of classmates’ EFs from students’ individual EF composites. We used leave-out measures of classmates’ EFs so that each student’s own score was not included in the calculation of the composition of classmates’ EFs. First, the leave-out (N − 1) mean represented the average levels of EFs for a student’s classmates. Second, the leave-out (N − 1) SD around each classroom’s mean represented the amount of heterogeneity of peers’ EFs at the classroom level.
The average number of children whose EFs were assessed in the fall was approximately 23 per classroom (SD = 5.32, range: 12–32). This represented, on average, 90% (SD = 7%, range: 76%–100%) of students in the class, which far exceeds previous peer effect studies that measured classmates’ skills with a quarter to half of the children in classrooms (Justice et al., 2011; Mashburn et al., 2009; Montroy et al., 2016; Weiland & Yoshikawa, 2014).
Covariates
Child gender (0 = male, 1 = female) was included as a covariate because of prior research demonstrating gender differences in students’ EF scores (Matthews, Ponitz, & Morrison, 2009). Student age was included because children show significant age-related gains in EF skills during elementary school (Lee et al., 2013). Class average grade was included to account for the mixed-grade classrooms in the study. Inherently, mixed-grade classrooms will have more variability in EFs, as students have more variability in age. Finally, a school-level measure of the proportion of free and reduced-priced lunch was included to control for school-level differences in student disadvantage. No other covariates were tested and removed.
Analytic Plan
To explore how classmates’ EFs were linked to individual students’ EF growth, we estimated regression models in a hierarchical linear modeling framework (also called multilevel modeling) such that students were at Level 1 and classrooms were at Level 2. To adjust parameter estimates and standard errors for the clustering of students within classrooms, all models included random intercepts for classrooms. In Models 1a and 2a, we predicted students’ spring accuracy and RT scores, respectively, with the leave-out mean, controlling for fall accuracy and RT scores (respectively), student gender, classroom average age, and the proportion of students receiving free or reduced-price lunch in the school. Model 1b adds a measure of fall RT when predicting spring accuracy, and Model 2b adds a measure of fall accuracy when predicting spring RT. Models 1c and 2c add a measure of fall processing speed. To each of these models, we added a measure of the standard deviation of EFs in the classroom, to explore whether variability in EFs explained growth in individual students’ EFs.
Missing data were addressed with multiple imputation with 20 complete data sets, which is methodically superior than other methods of addressing missing data in complex data sets (Enders, 2017). The percentage of missing data for all study variables ranged from 0.5% for student gender to 16% for the accuracy score on the fall Digit Span Backward task. The accuracy and RT scores for EF tasks were first imputed and then standardized and averaged to create the accuracy and RT composite scores, as described earlier. There were no differences in rates of missing data for fall EF tasks by student age, grade, gender, or school-level proportion of students receiving free or reduced-price lunch. In the spring, students from schools with higher proportions of students receiving free or reduced-price lunch were more likely to have missing data across all four tasks. Furthermore, younger students were more likely to have missing data in the spring on the HF and Flanker tasks.
Results
Descriptive Statistics and Bivariate Correlations
Table 1 shows that students’ individual EF scores, on both RT and accuracy measures, increased between the fall and spring (fall accuracy = 0.00, spring accuracy = 0.93, fall RT = 0.00, spring RT = 0.62). It follows that the average leave-out mean of classmates’ EF scores also increased between the fall and spring (fall class mean accuracy = 0.03, spring class mean accuracy = 0.94, fall class mean RT = 0.02, spring class mean RT = 0.62). Variability in classmates’ EF scores decreased slightly for accuracy scores and increased slightly for RT scores during the school year (fall class SD accuracy = 0.87, spring class SD accuracy = 0.77, fall class SD RT = 0.94, spring class SD RT = 1.09). Students’ processing speed also increased during the year (fall mean = 0.00, spring mean = 0.72). Due to multigrade classrooms, classroom average grade ranged from 2.58 to 5.00 (M = 3.77, SD = 0.77). The proportion of students eligible for FRPL varied across the schools in our study, ranging from 10% to 70.2% (M = 0.43, SD = 0.23).
Descriptive Statistics for All Study Variables

Note. All EF scores are standardized per the fall scale. Individual EF composite ICCs are at the classroom level. Classroom means and standard deviations were calculated such that the individual student’s score was not included in his or her score. RT scores were reversed such that higher scores can be interpreted as children demonstrating better EF skills (faster RTs). ICC = intraclass correlation; class = classmates’; RT = reaction time; FRPL = free or reduced-priced lunch (proportion of eligible students at the school).
Intraclass correlations (ICCs) test what proportion of the total variance in children’s EF scores is accounted for by observed and unobserved factors operating at the classroom level. Therefore, a high ICC (close to 1.00, or 100%) would indicate high levels of selection bias, as children’s EF scores would be entirely explained by the classrooms they are in. ICCs of the fall EF composite scores (accuracy ICC = 0.212, RT ICC = 0.088) demonstrate that a small proportion of the variance in students’ EF scores at the beginning of the year was at the classroom level (e.g., between-classroom differences). This indicates that most of the variance in students’ fall accuracy (78.8%) and RT (91.2%) scores was associated with individual child-level differences.
Bivariate correlations (Table 2) show that the leave-out mean and standard deviation were significantly and negatively correlated for accuracy in both the fall and the spring such that classrooms with higher mean accuracy scores had less variability in accuracy scores. Associations between classroom mean and classroom SD were not as highly correlated for RT scores. Individual students’ processing speed was highly correlated with individual students’ accuracy and even more highly correlated with individual students’ RT. Older children and those in higher grades had higher EFs and less variability in EFs. Generally, schools with higher proportions of students receiving free or reduced-price lunch had lower EFs and more classroom variability in EFs.
Bivariate Correlations Among All Study Variables
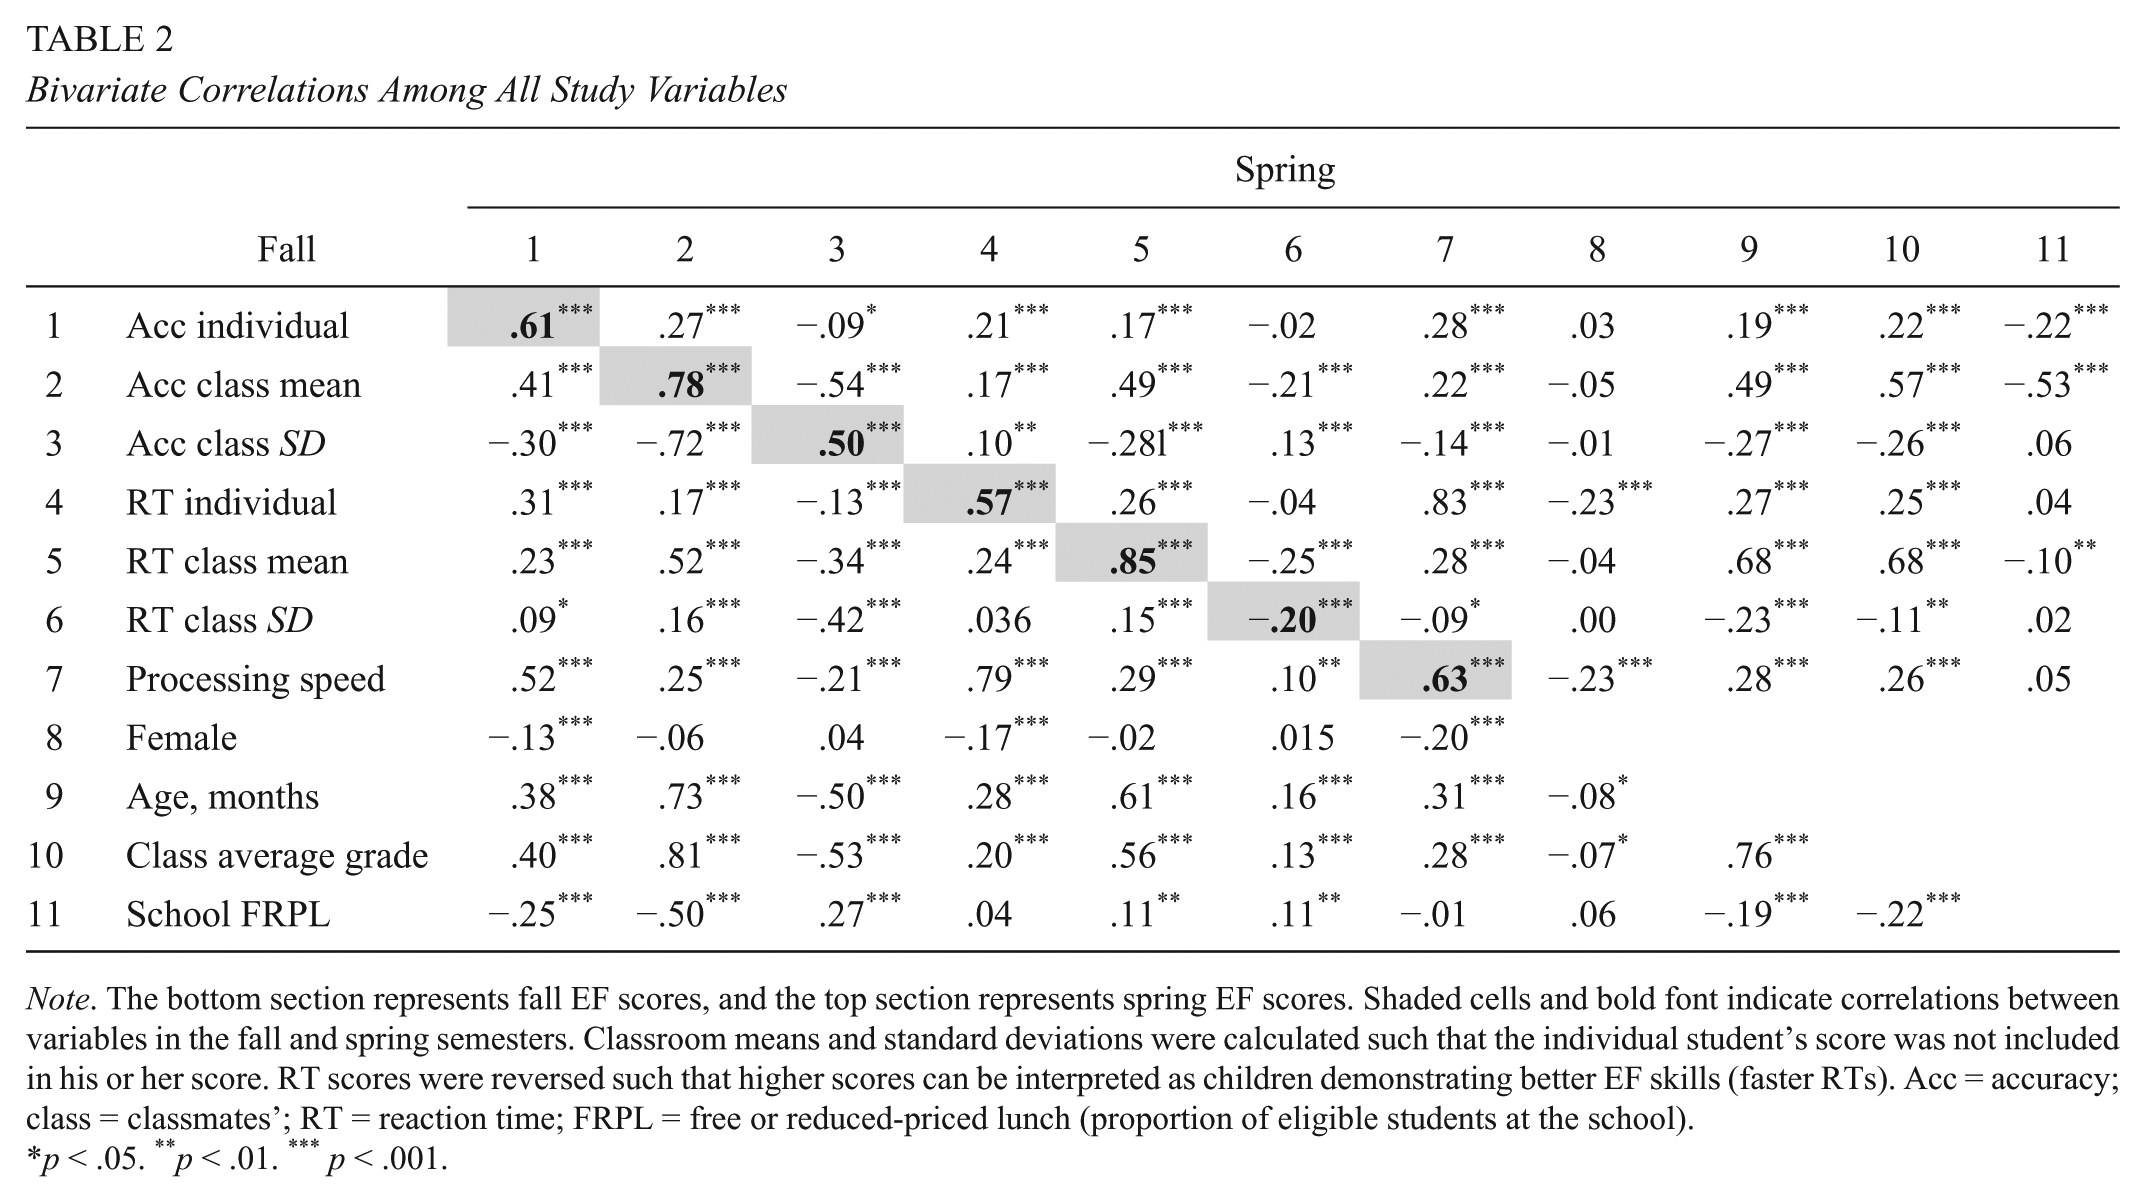
Note. The bottom section represents fall EF scores, and the top section represents spring EF scores. Shaded cells and bold font indicate correlations between variables in the fall and spring semesters. Classroom means and standard deviations were calculated such that the individual student’s score was not included in his or her score. RT scores were reversed such that higher scores can be interpreted as children demonstrating better EF skills (faster RTs). Acc = accuracy; class = classmates’; RT = reaction time; FRPL = free or reduced-priced lunch (proportion of eligible students at the school).
p < .05. **p < .01. *** p < .001.
Predicting Growth in EFs Through Measures of Classmates’ EFs
As shown in Table 3, measures of classmates’ accuracy on EF tasks were not associated with growth in accuracy scores (Model 1a; β = 0.046, p = .688). This was unchanged in Models 1b and 1c with the inclusion of individual students’ fall RT and fall processing speed, respectively. Individual students’ fall accuracy scores were a strong predictor students’ spring accuracy scores (Model 1a; β = 0.507, p < .001). Girls had significantly higher growth in accuracy scores across all models (Model 1a; β = 0.154, p = .001). Furthermore, students’ fall RT scores had a trend-level association with growth in their accuracy scores (β = –0.056, p = .057, in Model 1b), suggesting that individual students’ fall RTs uniquely contribute to their growth in accuracy scores over the year. Students’ fall processing speed was not associated with growth in students’ accuracy scores (β = –0.032, p = .309, in Model 1c). Variability in classmates’ accuracy scores was not significantly associated with growth in students’ accuracy scores and did not change results in any models.
Multilevel Models With Associations Between Fall and Classmates’ EF Scores on EF Tasks With Spring EF Scores

Note. N = 806 students in 33 classrooms. All models presented account for the clustering of students within classrooms based on two-level multilevel regression analyses. RT scores were reversed such that higher scores can be interpreted as children demonstrating better EF skills (faster RTs). Model 1 predicts children’s spring accuracy scores, and the classroom mean EFs represent classroom mean accuracy scores. Model 2 predicts children’s spring RT scores, and the classroom mean EFs represent classroom mean RT scores. The inclusion of variability in classmates’ EF scores (SD) did not change the results; therefore, these analyses are not presented. Values are presented as betas and standard errors in parentheses. EF = executive function; RT = reaction time; PS = processing speed; FRPL = free or reduced-priced lunch (proportion of eligible students at the school).
p < .10. *p < .05. **p < .01. ***p < .001.
However, RTs on EF tasks were associated with students’ growth in speed on accurate trials from fall to spring (Table 3). It is important to note that RT scores have been reversed such that higher scores on the RT composite can be interpreted as better EFs. Model 2a shows that classmates’ mean RTs were significantly associated with growth in individual students’ RTs (β = 0.332, p = .004). This result remained significant with the inclusion of individual students’ fall accuracy scores (Model 2b; β = 0.305, p = .007) and individual students’ fall processing speed scores (Model 2c; β = 0.300, p = .009). Students whose peers had faster RTs, on average, responded more rapidly by the end of the school year as compared with students in classrooms whose peers had slower RTs.
Measures of individual students’ RTs on EF tasks in the fall were significantly associated with their RTs in the spring across all models (Model 2a; β = 0.607, p < .001). In contrast with accuracy scores, boys demonstrated more growth in RT scores as compared with girls across all models (Model 2a; β = –0.254, p < .001). Students’ fall accuracy scores were positively associated with growth in students’ RT scores (β = 0.354, p < .001, in Model 1b). This shows that students who were more accurate on EF tasks in the fall responded more quickly by the end of the school year on the EF tasks. Furthermore, students’ fall processing speed scores were positively associated with growth in students’ RT scores (β = 0.356, p < .001, in Model 1c). This shows that both RT, representing children’s EF abilities, and processing speed uniquely contribute to growth in RT scores. Variability in classmates’ RT scores was not significantly associated with growth in students’ RT scores and did not change results in any models.
Discussion
During the elementary school years, EFs play a key role in supporting children’s engagement and adaptive behaviors in the classroom, as well as in learning academic skills (Finch & Obradović, 2017; Jacob & Parkinson, 2015; Nelson et al., 2017). Given the increasing importance and frequency of peer interactions in middle childhood (Gifford-Smith & Brownell, 2003), classmates’ EFs may be a critical aspect of children’s school experiences that influence children’s self-regulation during this developmental period. This study provides initial evidence for an association between classmates’ EFs and individual students’ EFs among third, fourth, and fifth graders. Higher average levels of classmates’ EFs, as measured by students’ RTs on direct EF assessments, were linked to increased growth among individual students’ RTs on EF tasks. In contrast, classmates’ accuracy on the EF tasks was not associated with individual students’ growth in accuracy scores.
Classmates’ Accuracy Versus RT on EF Tasks
Our study revealed that students whose classmates had faster responses on direct assessments of EF skills, on average, demonstrated increased improvement in their speed over the academic year. These findings remained with the inclusion of children’s processing speed, suggesting that these results are driven by EF-related speed on the tasks. Classmates’ accuracy on EF tasks, however, was not associated with individual students’ EF growth. There are several reasons why there may be discrepancies between these two metrics of EFs for children’s development. First, it is possible that RT data are more sensitive to short-term changes in children’s EFs. Accuracy on the incongruent blocks of the MSIT and HF tasks showed indications of ceiling effects such that 19% and 34% of students attained perfect scores, respectively. Second, accuracy data are coarser than RT scores. When one is trying to capture small improvements in children’s skills, it may be best to use a continuous measure of children’s abilities, such as RTs, rather than ordinal accuracy scores. Therefore, RT scores may be able to more precisely capture improvements in EF skills over an 8-month period and may be particularly important for assessment of children in middle childhood. Alternatively, accuracy and RT scores on the same EF tasks may measure conceptually different aspects of EFs. Results demonstrated that students’ fall RT scores contributed uniquely to growth in accuracy scores (at a trend level) and that students’ fall accuracy scores contributed uniquely to growth in RT scores. These independent effects suggest that these measures capture unique aspects of children’s EFs. Our results also highlight significant gender differences on the EF scores such that girls demonstrate more growth in accuracy scores and boys demonstrate more growth in RT scores. Additional research is needed to understand whether measures of accuracy and RT differentially affect social dynamics and classroom behaviors for children.
Classmates’ EFs and EF Growth
Our results are consistent with the broader literature, which has demonstrated the importance of peers for elementary school students’ academic and behavioral development (Gottfried, 2014; Hanushek et al., 2003; Thomas et al., 2011; Yudron et al., 2014). In addition, our findings corroborate an early childhood study demonstrating that classmates’ average levels of EFs were associated with growth in individual preschoolers’ EFs in a sample of children drawn from community-based school programs without a specific intervention component. The one study that did not find peer effects of EFs was conducted with low-income children involved in a preschool intervention program that significantly increased classroom quality and children’s EFs (Weiland & Yoshikawa, 2013, 2014).
We did not find effects of variability in classmates’ EFs for individual students’ EF growth. This aligns with the two studies that examined variability in classmates’ academic skills, which also found null effects (Burke & Sass, 2008; Hanushek et al., 2003). The one study that examined variability in classmates’ mental health symptoms found negative effects of heterogeneity in classmates’ externalizing behavior problems for individual children’s behavioral development (Yudron et al., 2014). However, they used teacher-reported measures of children’s behaviors, which tend to be highly skewed such that most students are rated as having no behavioral issues and then a small number of students are identified as displaying behavioral problems (Miner & Clarke-Stewart, 2008; Sulik, Blair, Greenberg, & the Family Life Project Investigators, 2017). Therefore, classrooms with more variability in students’ externalizing problems likely indicate that those classrooms have at least one student with externalizing behavioral problems. It is not surprising that this is negatively associated with individual students’ behavioral development, as externalizing behavior problems are highly disruptive in the classroom context (Thomas, Bierman, & the Conduct Problems Prevention Research Group, 2006). In contrast, variability in EFs, as measured on direct assessments, would not likely have a strong impact on the classroom climate, given that these measures are normally distributed. Therefore, higher variability in classmates’ EFs does not stand as a proxy for classrooms with children who have very low EFs.
Possible Mechanisms for Understanding Classmates’ EFs
This study is the first to highlight that classroom measures of EFs play a role in children’s EF development in middle childhood. Although we were not able to directly test the underlying mechanisms for our results, it is likely that our findings reflect processes among students and between students and teachers. Since the 1970s, researchers have highlighted that classroom environments should be viewed as social ecologies (Doyle, 1977; Vygotsky, 1978), where learning is a socially organized process (Kindermann & Vollet, 2014). Peer interactions and teacher-child interactions together shape children’s opportunities to build and practice their self-regulation skills. Accordingly, we propose three mutually informative mechanisms that are all fruitful areas for future research.
Classmates’ EFs and peer interactions
It is possible that being in a classroom with well-regulated peers may provide individual students with more examples of appropriate behavior and increased opportunities to engage in play and academic work that require self-regulation skills. Research focused on the development of children’s behavioral problems demonstrates that children who are in classrooms with low average levels of aggression are less likely to establish friendships with aggressive peers, decreasing their own aggressive behaviors over the school year (Powers, Bierman, & the Conduct Problems Prevention Research Group, 2013). Children who are in classrooms with higher average levels of EFs may be more likely to interact and establish friendships with well-regulated peers, who motivate and support them to improve their own EFs.
Teachers’ influences on peer interactions
Links between classmates’ EFs and individual students’ EFs may be also mediated through teacher-student interactions (Farmer, McAuliffe Lines, & Hamm, 2011; Hughes & Chen, 2011). Teachers’ behaviors and expectations shape peer interactions, as teachers establish classroom norms for what is considered acceptable and they model social interactions through their own relationships with students (Farmer et al., 2011). Supportive relationships between teachers and students have been linked to more positive interactional patterns among peers (Hendrickx, Mainhard, Boor-Klip, Cillessen, & Brekelmans, 2016; Hughes, Cavell, & Willson, 2001; Mikami & Mercer, 2017). It is plausible that individual relationships between teachers and students shape peer interactions in ways that increase or reduce opportunities for the development of EFs.
Students’ EFs eliciting teachers’ behaviors
Our results may also be explained by how children’s behaviors influence teachers’ instructional choices (Doyle & Ponder, 1975). Students with higher EFs demonstrate more learning-related behaviors, such as increased on-task behavior, more leadership skills, better prosocial skills, and decreased behavior problems (Finch & Obradović, 2017; Nelson et al., 2017; Sasser et al., 2015). Higher average levels of students’ EFs may induce teachers to design activities that further benefit students’ EF development. There is some evidence that elementary school students’ self-regulation skills are linked to the quality of their interactions with teachers (Hernández et al., 2017; Portilla, Ballard, Adler, Boyce, & Obradović, 2014), but limited work has examined how students’ self-regulation skills affect teachers’ choices about learning activities in the classroom.
Limitations and Future Directions
Although our study represents an important effort to understand the role of classmates’ EFs for children’s developmental trajectories, it has several limitations that need to be addressed in future work.
First, our study does not examine the role of teachers’ behaviors and teacher-student relationships in concert with classmates’ EFs. Given studies demonstrating bidirectional associations between teachers’ behaviors and peer group interactions (Farmer et al., 2011; Hughes & Chen, 2011; Luckner & Pianta, 2011), future work should build on our study to better understand how classroom measures of EFs affect teachers’ instructional choices and behaviors.
Second, it is possible that our findings are driven by teachers’ behaviors very early in the school year. Teachers who foster classroom climates that encourage good behavior and regulation may have influenced students’ EF scores in the fall and growth in EFs over the school year. This seems unlikely, however, given that the fall assessments were completed within the first 3 weeks of the school year.
Third, it is possible that ceiling effects limited the sensitivity of our accuracy measures and explained the null findings for our accuracy composite. Longer and more challenging EF tasks might have yielded a similar pattern of results for both accuracy and RT measures. Future studies exploring peer effects in middle childhood should include more demanding tasks that produce more variability in children’s accuracy scores.
Fourth, our study is correlational in nature and does not provide causal estimates of peer effects on students’ EF development. It is possible that selection effects of students into classrooms and schools influence our findings. Within schools, students are nonrandomly sorted into classrooms. For example, teachers with higher scores on licensure exams tend to get fewer minority students; more affluent students, whose parents are more likely to be college graduates; and students who have higher average test scores (Clotfelter, Ladd, & Vigdor, 2006). Therefore, peer EFs may be a proxy for teacher quality such that students whose peers have higher EFs also have higher-quality teachers. To better explore the causal role of peers, future studies could use experimental designs to randomly assign students into teachers’ classrooms with differing peer groups or leverage quasi-experimental designs.
Finally, our EF composite measures had relatively low reliability, likely because they are based on only three (RT) and four (accuracy) task-level variables. In future studies, including more EF tasks would help improve reliability on composite EF measures.
Conclusion
In summary, our findings suggest that classmates’ EFs play a role in individual children’s EF development during middle childhood. We highlight the need to identify specific aspects of classrooms that influence EF development in elementary school. Future studies should examine the dynamic interplay among classmates’ EFs, teachers’ behaviors, and interactions among teachers and students in the classroom to better understand the mechanisms explaining peer EF effects. This work demonstrating the importance of peer effects for EF development has implications for how students are assigned to classrooms and how teachers group students for learning activities.
Footnotes
Appendix
Skewness and Excess Kurtosis Values for RT Variables
| Variable | Skewness | Excess kurtosis |
|---|---|---|
| Fall HF | ||
| Incongruent RT | −0.05 | −0.54 |
| Mixed RT | −0.91 | 1.02 |
| Spring HF | ||
| Incongruent RT | 0.97 | 1.53 |
| Mixed RT | 0.02 | −0.12 |
| Incongruent RT | ||
| Fall MSIT | −0.29 | 0.10 |
| Spring MSIT | 0.32 | −0.03 |
| Fall Flanker | ||
| Blue RT | 0.77 | 0.29 |
| Pink RT | 0.59 | −0.20 |
| Mixed RT | −0.61 | 0.32 |
| Spring Flanker | ||
| Blue RT | 1.17 | 1.68 |
| Pink RT | 0.91 | 0.23 |
| Mixed RT | −0.68 | 0.63 |
Note. HF = Hearts and Flowers; RT = reaction time; MSIT = Multi-Source Interference Test.
Acknowledgements
We thank the children, teachers, and school administrators who participated and made this research possible and the students who helped collect and process the data.
Authors’ Note
This research was supported by a William T. Grant Foundation grant to Jelena Obradović. The preparation of this manuscript was also supported by a William R. and Sara Hart Kimball Stanford Graduate Fellowship to Jenna E. Finch.
Authors
JENNA E. FINCH is an assistant professor of psychology at the University of Nebraska–Lincoln. Her research interests include executive functions, motivation, early childhood education, and contextual influences on children’s cognitive and social-emotional development.
ELISA B. GARCIA is an early childhood researcher in the education division at SRI International. Her research addresses early childhood development, with a focus on dual language learners and early education.
MICHAEL J. SULIK is a postdoctoral scholar in the Graduate School of Education at Stanford University. He studies the development of children’s self-regulation.
JELENA OBRADOVIĆ is an associate professor in the developmental and psychological sciences program in the Graduate School of Education at Stanford University. Her research examines how the interplay of children’s physiological arousal, self-regulatory skills, and the quality of caregiving environments contributes to children’s adaptation over time.