
Abstract
Our work aims to substantiate and extend earlier findings on the effects of student-teacher race matching on academic achievement using longitudinal data for students in Grades 3 through 8 in Tennessee. We examine heterogenous effects not only by racial subgroup and student preparedness, as explored in prior literature, but also by levels of teacher effectiveness, drawing on data from the state’s teacher evaluation system. We find that student-teacher race congruence does not have a significant overall effect on test scores. However, subgroup analyses reveal a positive, significant race-match effect in elementary school math. We observe meaningful effects for Black students in both reading and math, race-matched students in the bottom-most preparedness quartile in math, and race-matched students assigned to teachers in the middle two teacher performance quartiles in math. Our results align with prior findings, emphasizing that race-match effects transcend state borders. Findings support policy efforts to diversify the educator labor force.
Keywords
Introduction
It is no secret that there are stark differences in the educational resources and outcomes for minority students compared to their White peers in the United States (Coleman et al., 1966; Darling-Hammond, 2007; Ogbu, 1994; Reardon, Kalogrides, & Shores, forthcoming). In an analysis of funding inequities by race concentration across states, the Education Trust reported that public school districts serving the most students of color receive about $2,000, or 15%, less per student than districts serving the fewest students of color. Nationally representative data from the Stanford Education Data Archive show the average White-Black and White-Hispanic achievement gaps to be 0.66 and 0.52 SDs, respectively (Reardon et al., forthcoming), and, in 2013, only 16% and 20% of Black and Hispanic students, respectively, met standards of eighth-grade reading proficiency on the National Assessment of Educational Progress, compared to 40% of their White peers. As Ladson-Billings (2006) aptly describes, the amassed economic, political, and historical losses in educational services has created an “educational debt” toward students of color (Ushomirsky & Williams, 2015).
One manifestation of resource disparities for people of color comes in the form of the race-representation gap. While students of color represent 51% of the public elementary and secondary school population, only 18% of public school teachers identify as belonging to a minority group (U.S. Department of Education, 2016). The representation gap reduces opportunity for minority students to experience the benefits of a race-congruent teacher. Movements calling for a more diversified teaching force have prompted governing bodies at the local, state, and federal levels as well as institutions of higher education and educational nonprofits (e.g., Teach For America, Teaching Fellows) to promote strategies that develop, recruit, and retain teachers of color (Piercynski, Matranga, & Peltier, 1997; Villegas, Strom, & Lucas, 2012) with the hope of increasing the ratio of minority students who have a teacher of the same race (Ahmad & Boser, 2014; Boser, 2014).
Teachers of race-congruent students are shown to provide increased attention, time, resources, and supports to their students for a number of hypothesized reasons. A race-congruent teacher may (a) possess a better understanding of his or her students’ abilities, experiences, and beliefs (Gershenson, Holt, & Papageorge, 2016; Grissom, Kern, & Rodriguez, 2015); (b) demonstrate this understanding through culturally competent practices (Ladson-Billings, 1995); (c) serve as a role model for students from socially significant minority populations; or (d) decrease the stereotype threat students of color may experience (Dee, 2004, 2005; Egalite, Kisida, & Winters, 2015; Ehrenberg & Brewer, 1995; Ehrenberg, Goldhaber, & Brewer, 1995; C. Steele, 1997).
To date, a handful of empirical studies have reported a positive association between a race-congruent teacher and academic improvements for minority students. For example, using data from a large-scale randomized control trial on K–3 students in Tennessee, Dee (2004) found that students experienced test score gains ranging from 2 to 4 percentile points when matched with a race-congruent teacher. More recently, using administrative data from Florida, Egalite et al. (2015) found effect sizes on student test scores for students with a race-congruent teacher ranging from 0.002 to 0.008 SDs in Grades 3 through 10. While the pooled sample effect estimates in Florida are arguably inconsequential for students’ test score outcomes, the reported race-match effect in elementary grades was more meaningful, particularly for Black students, which lends support to the hypothesis that closing the race-representation gap will improve educational opportunity for students of color.
Our present work aims to substantiate earlier race-match findings and extend their analytic approach using longitudinal data for students in Grades 3 through 8 in Tennessee. We also examine heterogeneous effects not only by racial subgroup and student preparedness, as explored in prior literature, but also by level of teacher effectiveness, drawing on unique data from the state’s long-standing teacher value-added assessment system. Specifically, our paper addresses the following research questions:
Research Question 1: To what extent do students experience improved test scores when assigned to a race-congruent teacher?
Research Question 2: To what extent do the effects of the race-match 1 vary by race, student preparedness, and teacher quality?
For our pooled sample, we find race-matching does not have a significant, meaningful impact on student test scores in reading and math. The estimated gain in test scores for the complete sample across reading and math is approximately 0.005 to 0.006 SDs when accounting for teacher quality. However, similar to Egalite et al. (2015), we find a positive, statistically significant race-match effect in elementary school math (0.037 SDs), while gains in reading are not statistically significant when examining by elementary and middle school grades. Stratifying the elementary school sample further reveals statistically significant, positive, and meaningful effects for Black students in both reading and math, race-matched students in the bottom-most preparedness quartile in math, and race-matched students assigned to teachers in the middle two performance quartiles in math. We note that while we generally find small, positive point estimates of the effect of race-matching, robustness checks using alternative modeling strategies indicate that the significance of our subgroup estimates are highly model dependent. Our results align with prior findings, emphasizing that race-match effects occur in a variety of instructional settings.
A Conceptual Model for Understanding Student-Teacher Race Congruence
Educational sociologists following the interactionist tradition reject the conventional examination of schools as input-output factories, arguing that such a model fails to consider the role of human agency and interactions in creating outcomes. Instead, interactionists contend that social actors perceive and react to the behaviors of people and systems around them, filtering behaviors through their own individual set of beliefs (Downey & Pribesh, 2004; Mehan, 1992; Pigott & Cowen, 2001). Scholars examining the role of student-teacher interactions and race-based interactions for minority students in particular adopt interpretive frameworks in their work, placing a heavy emphasis on the interactional dependencies between actors that ultimately influence outcomes (Bonilla-Silva, 2006; Ferguson, 2003; Jencks & Phillips, 1998; Ogbu, 2004).
Social interaction in schools is structured as a dynamic interplay between students’ and teachers’ cultures, social rules, and school policies. Students’ home cultures shape how they act in school, and teachers’ cultures influence how they treat students (Heath, 1988). As wielders of institutional authority, teachers direct how students are taught and labeled and how policies are instituted. Students also make choices in response to rules and norms, negotiate their status through interactions with the teacher, and modify their behavior through feedback loops (Mehan, 1992). Teachers’ knowledge and beliefs about students alter both what they expect of students and how they treat them. They may give preferential treatment to students who exhibit particular traits (e.g., hold students to different expectations based on race; Downey & Pribesh, 2004). Furthermore, teachers may subconsciously structure their classroom in ways that benefit or reward students of a certain background (Heath, 1988).
Thinking about outcomes as the result of interpersonal interactions explains the microlevel processes through which race-congruency affects student-teacher interactions. Scholars have examined how teachers’ perceptions of students differ by race (McGrady & Reynolds, 2013; Morris, 2005), how teachers view students’ classroom behavior as a function of race (Downey & Pribesh, 2004), how student-teacher relationships are affected by race (Crosnoe, Johnson, & Elder, 2004), and even how students’ perceptions of their teachers depend on race (Cherng & Halpin, 2016). In each of the aforementioned studies, scholars emphasize the role of student-teacher interaction.
While our data do not permit us to deeply explore specific mechanisms, prior literature suggests both passive and active channels through which student-teacher race congruence affects student outcomes. Passive teacher effects result when student-teacher race congruence produces positive effects without any deliberate teacher actions; rather, they are byproducts of students’ perceptions of their teacher’s race. For example, race-congruent teachers may serve as role models for minority students who might not interact with many adults who share their race in positions of authority (Irvine, 1992). The presence of a race-congruent role model may inspire students to emulate their teacher, become more receptive to working with their teacher, or realign personal goals (King, 1994; Stewart, Meier, & England, 1989). Passive teacher effects may also benefit the students assigned to race-congruent teachers through the removal of stereotype threat (C. Steele, 1997). Assuming students’ sense of academic self-worth is critical to their sustained academic development, stereotype threat describes how students’ sense of academic self-worth may decrease because of the perceived stereotypes students expect to experience from having a race-incongruent teacher. When placed with a race-incongruent teacher, students may react negatively to the perceived threat of being judged or mistreated based on racial or cultural stereotypes (C. M. Steele & Aronson, 1995). Such negative reactions lower students’ sense of academic self-worth and may increase students’ anxiety levels, thereby decreasing student achievement (Good, Aronson, & Inzlicht, 2003; Osborne, 2001). Having a race-congruent teacher, however, could decrease the stereotype threat and/or possibly improve a student’s sense of academic self-worth, which would correspond with increases in academic outcomes.
A second mechanism for explaining positive outcomes for students’ matched with a race-congruent teacher is through active teacher effects, where teachers treat race-congruent students differently than students of another race, as mediated by teachers’ positive beliefs and attitudes about same-race students, as well as teachers’ potentially negative attitudes toward racially incongruous students (Kumar, Karabenick, & Burgoon, 2015). For instance, minority teachers are more likely to nominate minority students for opportunities like gifted and talented programs or provide culturally responsive instructional support in the classroom (Grissom et al., 2015; Grissom, Nicholson-Crotty, & Nicholson-Crotty, 2009).
Another active teacher effect that has not yet been discussed in prior literature on student-teacher race congruence is cultural competency. This is produced when race-congruent teachers implement culturally responsive teaching (CRT) practices. Since the late 1960s, the model of cultural competence and the practice of CRT have played increasingly prominent roles in pedagogy, curriculum, and teacher mindsets and beliefs (Gay, 2000, 2002; Villegas & Lucas, 2002; Wlodkowski & Gisberg, 1995). CRT is derived from the idea that students’ culture is pivotal to their learning, development, and achievement (Gilchrist, Hughes, & Holloway, 2005; Gollnick & Chinn, 2012; Ladson-Billings, 1995; Landa, 2011). While CRT may be practiced by teachers of any race or ethnicity, race-congruent teachers are arguably better equipped to implement CRT or may be more likely to possess cultural competencies from sharing the values, norms, and backgrounds of their student (Gollnick & Chinn, 2012). Race-congruent teachers may also better understand students’ culture and family life and may serve as “cultural translators” by using teaching practices, mannerisms, language, and curriculum that better connect with their race-congruent students (Irvine, 1988, 1989). Culturally responsive teaching has also been found to improve student attendance, GPA, and credits earned for students identified as at risk of dropping out of school (Dee & Penner, 2017).
Review of Race-Match and Test Score Literature
Few studies have estimated the impact of student-teacher race congruence on student test score outcomes using rigorous analytic methods. Two studies leverage data from a single random assignment design, due in part to the difficulty of randomly assigning students and teachers to classrooms. We are aware of only a handful of race congruence studies that use rigorous nonexperimental methods to make inferences. As such, we restrict this review to methodologically rigorous studies that estimate the effect of a positive student-teacher race-match on test scores.
Dee (2004) creatively leveraged the random assignment of students to teachers as part of the Tennessee STAR study to approximate a random assignment study of the impact of having a race-congruent teacher on student achievement. In addition to using ordinary least squares (OLS) and two-stage least squares (2SLS) estimation strategies with grade, entry year, and school fixed effects to estimate the race-match effect for students in Grades K–3, Dee also modeled the cumulative effect of student exposure to a race-congruent teacher over a 4-year period. He reports a statistically significant increase of 2 to 4 percentile points in math and reading scores as measured on the Stanford Achievement Test for both Black and White students. By using data from the Tennessee STAR experiment, Dee’s estimates are unconfounded by unobserved student characteristics affecting achievement.
Penney (2017) also makes use of data from the Tennessee STAR experiment. He extends the work of Dee (2004) by examining the role that both dosage and timing play on the effect of racial matches between students and teachers on student achievement. Penney finds that both the timing and dosage of a positive race-match influence test scores, though much of the reported benefit in his analysis is driven by positive race-matches in kindergarten and first grade. The strongest benefit is found on the word recognition test scores where a positive student-teacher race-match from kindergarten to third grade yields an increase of 0.34 SDs.
Notably, a study by Egalite et al. (2015) uses student-, school-, course-, and grade-level fixed effects on a large, administrative data set provided by the Florida Department of Education to test for the effect of race-congruent matching in Grades 3 through 10 for reading and math. The authors find small but significant effects for Black and White students assigned to race-congruent teachers in reading (0.004–0.005 SDs) and Black, White, and Asian students in math (0.007–0.041 SDs). The study also reports statistically significant effects by race, low student performance, grade level, and low performance within a racial subgroup. Egalite et al.’s work expands on prior analyses by examining a broader range of student grade levels. However, as the authors note, it is unclear whether these findings can be generalized to school systems outside of Florida.
Several of the aforementioned studies identify the important role teacher effectiveness can play as a mediating factor of student test scores. Egalite et al. (2015) discuss how some of the achievement effects attributed to student-teacher race congruence may be indicative of systematic differences in teacher quality by race. Teacher quality is widely known to be the single most important within-school determinant of student learning, accounting for differences across region, students’ socioeconomic status, race, and school, and could serve as a potential mediator for the effect of a student-teacher race-match on test scores. Moreover, schools containing greater numbers of minority, low-income and/or low-achieving students are more likely to be taught by lower quality teachers (Boyd, Lankford, Loeb, Rockoff, & Wyckoff, 2008; Goe, 2007; Peske & Haycock, 2006; J. L. Steele, Pepper, Springer, & Lockwood, 2015). By including measures of teacher quality, our study provides valuable evidence of the differences in race-match effects depending on prior achievement and teacher effectiveness.
Data, Sample, Measures, and Analytic Strategy
This section provides a description of the data utilized in this study, sample of students and teachers, measures, and analytic methods applied to examine the effect of a race-congruent teacher on student test scores.
Data
To examine the effects of student-teacher race-matching on student test scores, this study relies on statewide student-, teacher-, and school-level data from the 2009–2010 to 2014–2015 school years collected and maintained by the Tennessee Education Research Alliance (TERA) at Vanderbilt University’s Peabody College. The student-level data consist of students’ standardized test scores for reading/English language arts and mathematics on the state’s end-of-year assessment, the Tennessee Comprehensive Assessment Program (TCAP), for Grades 3 through 8. It also contains student and teacher demographic information, including teacher value-added scores, from the Tennessee Value-Added Assessment System (TVAAS). The school-level data come from multiple sources, including state school accountability reports, the National Center for Education Statistics Common Core of Data, and aggregated student- and teacher-level information.
Sample
Our analytic sample consists of 1,088,166 student-year observations between the 2009–2010 to 2014–2015 school years, totaling 412,785 and 675,184 unique student observations in reading and math, respectively, assigned to 13,920 teachers in 1,607 schools. 2 Students are matched to teachers using student-teacher linkage files that provide unique student and teacher identification numbers, teacher-reported percentages of claims of students’ instructional time (0%–100%), and students’ availability for instruction (based on student attendance). For the purposes of this analysis, we excluded students who spent less than 100% of their time with a core-subject teacher (e.g., if a teacher claimed 50% of a student’s math instruction) or with more than one teacher, as well as observations belonging to school-year-grade cells with fewer than 10 students. We also exclude students who only had test scores from the modified TCAP assessment.
Table 1 displays summary statistics for our complete analytic sample as well as the analytic sample delineated by students that do not experience a positive race-match and students that do. An interesting pattern emerges. Approximately 70% of students in the analytic sample are White, with 90% of all race-matches occurring between White students and White teachers. The inverse is true for Black students. Although 20% of students in the full sample are Black, matches between Black students and Black teachers account for only 10% of observed race-matches. Since we observe little to no race-matching for Hispanic and Asian 3 students, we interpret race-match effects for White and Black students only. The above-average test scores in the complete analytic sample is a function of sample restrictions to students with prior year test scores, teachers who had prior year evaluation scores, students who had 100% claims, and students who had “full” instructional availability. The above-average scores reflect the fact that the complete analytic sample is more stable than the population, leading to upward drift in the sample achievement mean. 4
Summary Statistics for Student Covariates by Race-Match

Note. The “Non-race-match” and “Race-match” columns show the means and standard deviations of the student-level covariates for students paired with same-race and non-same-race teachers. The third column shows the overall means and standard deviations for these covariates. “Standardized difference” indicates the significance of a test for difference in means across non-race-match and race-match students in units of their pooled SD. The standardized difference is calculated as the absolute difference in full and analytic sample means divided by the estimated pooled SD of a given variable as discussed in Stuart (2010) and Xu and Jaggars (2011). A difference greater than or equal to 0.25 between the two standardized means is considered large and is denoted using an *. Percentage peer variables are clustered at the teacher-grade-year level. The Asian category includes students who identify as Asian American, Pacific Islander, or other racial subgroup. “(t – 1)” represents a lagged variable. TCAP = Tennessee Comprehensive Assessment Program; FRPL = free or reduced-price lunch; SPED = special education.
Table 2 displays summary statistics for teachers using an analogous sample breakdown as Table 1. The majority of teachers in our sample are women (87%) and White (88%). The non-race-match and race-match teacher samples have similar total years of credited experience, salary, and degree attainment. On average, teachers in our full analytic sample have between 11 and 12 years of teaching experience and earn around $45,600. Roughly 93% of teachers have either a bachelor’s or master’s degree as their highest degree earned. The most notable differences between the two subsamples relates to the racial composition of colleagues. Non-race-match teachers have a higher percentage of Black colleagues (19.8% vs. 9.5%). Appendix Table A3 contains descriptive statistics for school-level covariates.
Summary Statistics for Teacher Covariates by Race-Match

Note. The “Non-race-match” and “Race-match” columns show the means and standard deviations of the teacher-level covariates for teachers paired with same-race and non-same-race students. The third column shows the overall means and standard deviations for these covariates. “Standardized difference” indicates the significance of a test for difference in means across non-race-match and race-match teachers in units of their pooled SD. The standardized difference is calculated as the absolute difference in full and analytic sample means divided by the estimated pooled SD of a given variable as discussed in Stuart (2010) and Xu and Jaggars (2011). A difference greater than or equal to 0.25 between the two standardized means is considered large and is denoted using an *. The Asian category includes teachers who identify as Asian American, Pacific Islander, or other racial subgroup. “(t – 1)” represents a lagged variable. TVAAS = Tennessee Value-Added Assessment System.
Measures
Dependent variable
Our outcomes of interest are students’ reading and math test scores on the state-mandated TCAP exam. Since raw scores on the TCAP vary from year to year based on the distribution of scores, we standardize student test scores by grade, year, and subject to have a mean of zero and standard deviation of one. This standardization allows effect sizes to be interpreted as a student’s relative change in position within the distribution of test scores for that grade, year, and subject.
Indicator variables
Our primary indicator of interest is a binary indicator of a student-teacher race-match, which equals one when a student is matched to a race-congruent teacher in a subject-year. 5 To construct our race-match indicator, we first created binary indicator variables for each race category for students and teachers and then matched observations for whom student race and teacher race were the same. The reference category for this indicator is students not matched to a race-congruent teacher.
We also create a series of indicator variables that are interacted with our race-match indicator to analyze heterogeneous race-match effects. For example, to explore variability in the effects of race-matching by race subgroup, we create interactions between the race-match variable and the White and Black racial subgroups. We do not examine the interaction for Asian students due to the rarity of teacher-student race congruence for these subgroups. In all instances, less than half of 1% of race-matches occur for these racial subgroups.
We further assess race-match effects by levels of student preparedness. Our measure of student preparedness is created by bucketing a student’s test score in a given subject in the first year they appear in the data into four performance quartiles. Based on a student’s performance at the end of the first year he or she is observed, we assign students into one of four preparedness quartiles for the remaining years the student is observed in the data. We create binary indicators equaling one if a student had a same-race teacher in a subject and if the student fell into the first, second, third, or fourth performance quartiles, respectively, and zero otherwise. Student placement into performance categories is defined by the first year they appear in the data because one identifying source of variation in our analytic strategy is a student switching from a race-congruent to a different-race teacher (or vice versa), and another source of identifying variation comes from students who experience no change in same-race teacher but move between performance quartiles. Using a time-invariant indicator for student preparedness ensures that the coefficient estimates reflect only changes in race-congruent teachers. We also explore race-match effect by level of teacher quality. We generate teacher effectiveness quartiles based on a teacher’s lagged three-year cumulative TVAAS percentile rank. Thus, the teacher quality indicator variable equals one when there was a student-teacher race-match and a teacher fell into a particular performance quartile and zero otherwise.
Control variables
We control for a series of student-, teacher-, and school-level control variables to account for time-varying characteristics that may influence test scores as well as control for student sorting by schools based on achievement levels and/or race. We include in our models controls for students’ eligibility for free or reduced-price lunch (FRPL) and special education (SPED) status and peer characteristics that may also influence a student’s test scores. Students’ “classroom” peers are defined as students in the same school, grade, year, and subject and assigned to the same teacher for a subject. Our student controls include percentage White, Black, Hispanic, and Asian; percentage peers eligible for FRPL; percentage peers receiving SPED services; and average peer achievement. The inclusion of the aforementioned percentage and peer variables accounts for differences between classrooms that can be attributed to the demographic composition of the grade. To illustrate, we would expect the effects of a race-match to operate differently in a classroom consisting of mostly race-congruent peers compared to a classroom of mostly race-incongruent peers. Furthermore, we include a control for students’ preparedness using students’ prior year test score in a given subject in our OLS model. 6
We include three types of teacher controls. First, we include standard teacher demographic information such as gender, race, and salary. Second, to account for teacher-level sorting between schools based on race as well as changes in teacher behavior based on the racial composition of their school site, we include controls for the percentage of a teacher’s colleagues of any given race within the school. Finally, we include controls accounting for teacher quality, such as teacher age, years of experience, highest degree obtained, and three-year cumulative value-added (i.e., TVAAS) score for the prior year. School controls are grouped by year and include school enrollment, student-teacher ratio, total teachers per school, and school averages of student performance in reading and math.
Analytic Strategy
The purpose of this analysis is to obtain unbiased estimates of the effects of having a race-congruent teacher on student test scores. Unlike Dee (2004), who used randomized assignment from the Tennessee STAR experiment, our analysis leverages nonexperimental data and therefore must account for the nonrandom sorting of students to teachers. Our approach to estimating the impact of student-teacher race congruence on student test scores uses a student fixed effects model following from Egalite et al. (2015):
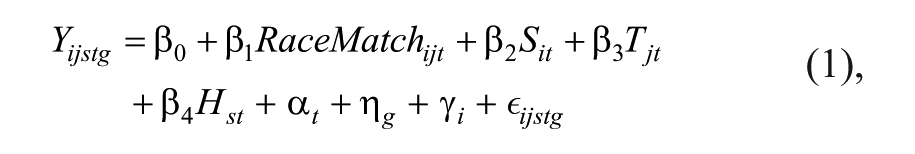
where
We estimate variants of Equation 1 using OLS and teacher and classroom fixed effects. The OLS model removes the student fixed effects and adds in control variables for students’ time-invariant characteristics. The teacher fixed effects model includes these controls for students’ time-variant and -invariant characteristics but omits time-invariant teacher characteristics. The classroom fixed effects model is similarly modified. Estimating these additional models allows us to parse out different sources of variation and compare the consistency of the point estimates. The student fixed effects model relies on within-student, across-year variation and relies on the approximately 34% of students in our analytic sample observed as being assigned to both a race-congruent and race-incongruent teacher (see Appendix Table A4). Our preferred specification is the student fixed effects model. The benefit of exclusively using within-student comparisons is the ability to account for unobserved, persistent student factors that may otherwise confound our estimates. Our student fixed effects specification, augmented with an extensive series of observable student classroom, school, and teacher characteristics (including teacher value-added estimates), guards against many of the potentially endogenous factors present in the student-teacher assignment process.
Using student fixed effects with controls for teacher quality, we estimate student race-specific effects by replacing the generic race-match indictor in Model 1 with a series of race-specific race-match indicators for White, Black, Hispanic, and Asian students. The student race-specific model can be written as:

where
Results
Using the student fixed effects estimation strategy, we find that a positive race-match does not have a significant and meaningful effect on student test scores in our full analytic sample. However, we find that having a race-congruent teacher in elementary school has a significant, positive effect for students in math (0.037 SD). We do not find significant gains in test scores in reading for the full, elementary, or middle school samples. Further stratifying the elementary school sample reveals statistically significant, meaningful effects of having a race-congruent teacher for Black students in both reading (0.042 SD) and math (0.075 SD). We also observe positive effects for students in the bottom-most performance quartile in math (0.061 SD) as well as students assigned to teachers in the middle two quartiles of performance in math (0.044–0.049 SD). We do not find significant effects by student or teacher performance in reading.
Effect of Race-Match on Student Achievement
In Table 3, we report estimates from models estimating the effect of race congruence on student test scores in math and reading across our full sample. In addition to our preferred student fixed effects specification, we also present estimates from OLS, teacher, and classroom fixed effects models to examine the sensitivity of our estimates to different modeling strategies. All models use similar student-, teacher-, classroom-, and school-level covariates. Additionally, because controlling for teacher quality may potentially mediate the effect of race congruence, we also estimate all models in Table 3 with and without teacher quality controls (e.g., years of experience, education, value-added). In the pooled sample, none of our specifications yield significant estimates of the effects of race-match on student test scores. The point estimates in Table 3 are comparable in size to those estimated by Egalite et al. (2015), but are not statistically significant within our data.
Effects of Race-Match on Test Scores by Subject
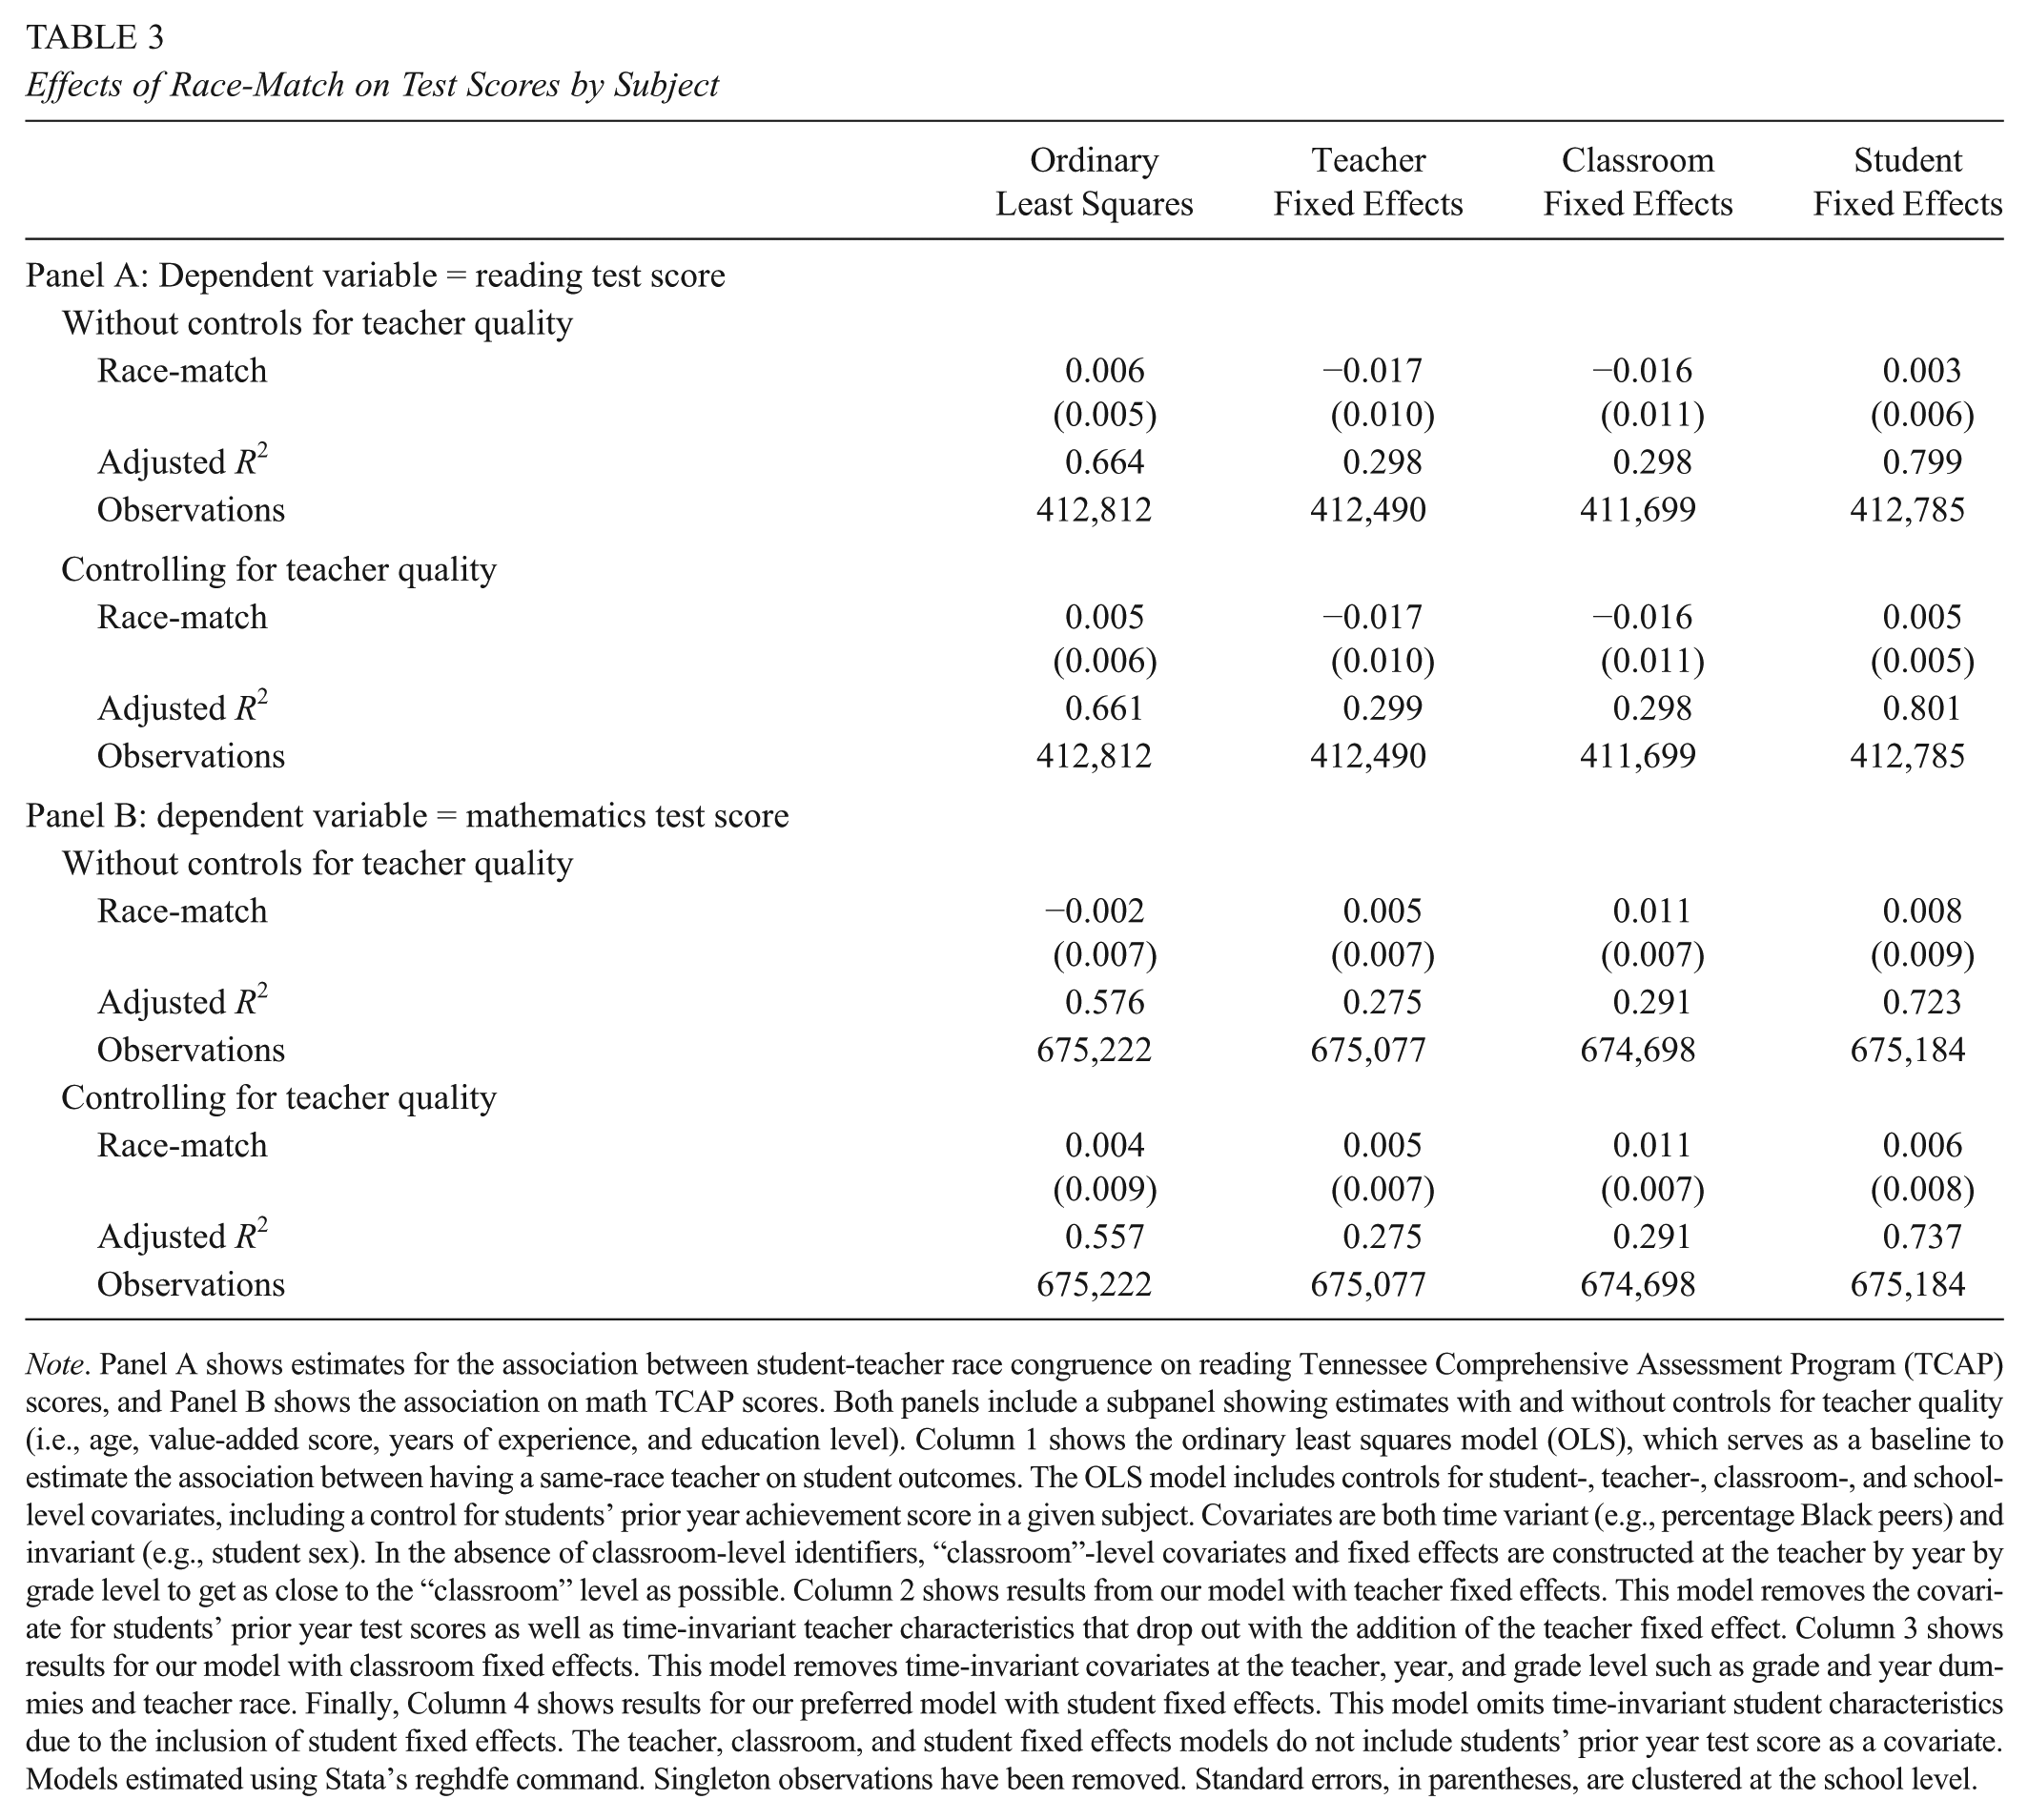
Note. Panel A shows estimates for the association between student-teacher race congruence on reading Tennessee Comprehensive Assessment Program (TCAP) scores, and Panel B shows the association on math TCAP scores. Both panels include a subpanel showing estimates with and without controls for teacher quality (i.e., age, value-added score, years of experience, and education level). Column 1 shows the ordinary least squares model (OLS), which serves as a baseline to estimate the association between having a same-race teacher on student outcomes. The OLS model includes controls for student-, teacher-, classroom-, and school-level covariates, including a control for students’ prior year achievement score in a given subject. Covariates are both time variant (e.g., percentage Black peers) and invariant (e.g., student sex). In the absence of classroom-level identifiers, “classroom”-level covariates and fixed effects are constructed at the teacher by year by grade level to get as close to the “classroom” level as possible. Column 2 shows results from our model with teacher fixed effects. This model removes the covariate for students’ prior year test scores as well as time-invariant teacher characteristics that drop out with the addition of the teacher fixed effect. Column 3 shows results for our model with classroom fixed effects. This model removes time-invariant covariates at the teacher, year, and grade level such as grade and year dummies and teacher race. Finally, Column 4 shows results for our preferred model with student fixed effects. This model omits time-invariant student characteristics due to the inclusion of student fixed effects. The teacher, classroom, and student fixed effects models do not include students’ prior year test score as a covariate. Models estimated using Stata’s reghdfe command. Singleton observations have been removed. Standard errors, in parentheses, are clustered at the school level.
Nonetheless, as seen in Table 4, when we estimate the effect by school level (i.e., elementary and middle school), similar to prior research, we find a larger, meaningful effect among elementary school students. Using our preferred student fixed effects specification, we estimate a significant 0.037 SD effect of race-match on math test scores. We do not observe any significant effects on test scores for reading in any level or middle school math, though the signs on the race-match effects in reading are in the hypothesized direction.
Effects of Race-Match on Test Scores by Subject and School Level

Note. All models use student fixed effects and include student-, teacher-, and school-level covariates, including all controls for teacher quality. Models estimated using Stata’s reghdfe command. Singleton observations have been removed. Standard errors, in parentheses, are clustered at the school level.
p < .05.
Effect of Race-Match by Race, Student Preparedness, and Teacher Quality
Our next set of analyses are designed to inform whether differential effects in student-teacher race-matches exist by race subgroup, student preparedness, and teacher effectiveness. Table 5 shows results for the estimated effects of race-matching on reading and math test scores by racial subgroup using our preferred model specification of student fixed effects with controls for teacher quality. We find that Black students assigned to a Black teacher are expected to have test scores 0.042 SDs higher compared to years when assigned to a non-same-race teacher in elementary reading and 0.075 SDs higher in in math. We do not find a significant relationship for White students in the elementary sample. We do not interpret the estimates for Hispanic and Asian students due to the small populations of these students and teachers in Tennessee. 7
Effects of Race-Match on Test Scores by Subject and Student/Teacher Race

Note. All models use student fixed effects and include student-, teacher-, and school-level covariates, including all controls for teacher quality. Models estimated using Stata’s reghdfe command. Singleton observations have been removed. Standard errors, in parentheses, clustered at the school level. Due to an insufficiently large sample of Hispanic and Asian teachers and students in the Tennessee data, the estimated effects for Hispanic and Asian students were not interpreted. For parsimony, estimates for Hispanic and Asian students have been removed from this table. Estimates for Hispanic and Asian students can be found in Appendix Table A10.
p < .10. **p < .05.
Table 6 reports results examining the differential effects of a race-congruent teacher on student test scores in math and reading by levels of student preparedness. In general, we do not find any effects of having a same-race teacher in the full or middle school samples or in the elementary reading sample. We do observe a significant positive effect for students in the bottom quartile of the elementary sample in math (0.061 SD). This finding suggests that low-performing students in elementary math in particular experience a positive benefit from having a race-congruent teacher. Table 7 reports results examining the differential effects of having a race-congruent teacher by teacher effectiveness quartiles. We observe that race-matched students in the elementary math sample benefited more than non-race-match students when assigned to teachers in the middle two quartiles, experiencing test score gains of 0.044 to 0.049 SDs. We did not observe significant differences in student outcomes in the full and middle school samples in math. This suggests that having a race-congruent teacher does not seem to be of particular benefit if the teacher is low or high performing. Having a race-congruent teacher seems to matter particularly when the teacher is in the middle of the teacher performance distribution. In reading, we do not observe significant effects of having a race-congruent teacher in any performance quartile. This suggests that students assigned to race-congruent teachers of any performance level do not benefit any more or less in reading.
Effects of Race-Match on Test Scores by Student Preparedness

Note. All models use student fixed effects and include student-, teacher-, and school-level covariates, including all controls for teacher quality. Student preparedness quartiles created using students’ location in the performance distribution in reading or math for the full population of public school students in Tennessee within the grade and year of the students’ first observed test score in the data. Wald tests present the probability that the two coefficients are equal. Models estimated using Stata’s reghdfe command. Singleton observations have been removed. Standard errors, in parentheses, are clustered at the school level.
p < .05.
Effects of Race-Match on Test Scores by Teacher Quality

Note. All models use student fixed effects and include student-, teacher-, and school-level covariates, including all controls for teacher quality. Teacher quality quartiles created using teachers’ lagged three-year composite performance score. Wald Tests present the probability that the two coefficients are equal. Models estimated using Stata’s reghdfe command. Singleton observations have been removed. Standard errors, in parentheses, are clustered at the school level. “(t – 1)” represents a lagged variable.
p < .10. **p < .05. ***p < .01.
Robustness and Sensitivity Checks
Internal validity describes the ability of a study to avoid or eliminate confounding variation and isolate a treatment effect. We seek to isolate the effect of student-teacher race congruence on student achievement. We identify four primary threats to internal validity, namely, (a) endogenous variation at the classroom level related to both student achievement and assignment to a same-race teacher, (b) covariates functioning differentially across racial groups, (c) endogenous sorting of students to race-congruent teachers, and (d) benefits experienced by students paired with other types of race-matches (e.g., minority student paired with any minority teacher). We discuss each threat to internal validity and the respective test(s) performed in the following.
Several recent papers studying the effects of student-teacher race congruence advocate for the use of two-way student and classroom fixed effects to account for both student and classroom unobservables (Fairlie et al., 2014; Holt & Gershenson, 2017). While we include an extensive set of teacher, classroom, and school covariates in our model to protect against the sources of endogeneity that would be accounted for by a classroom fixed effect, there are innumerable classroom dynamics that cannot be captured within administrative data that may affect both students’ achievement and assignment to a race-congruent teacher. As a robustness check, we estimate all models using a two-way student and classroom fixed effect and present elementary and middle school specific effects (analogous to the student fixed effects estimates in Table 5) in Appendix Table A5.
Taken together, both the student and two-way fixed effects models point to the same substantive finding: Teacher-student race congruence has a small, positive, but marginally significant effect on math test scores. However, the student and two-way fixed effects estimates suggest somewhat different conclusions regarding the specific student subgroups most affected by race congruence. The student fixed effects model suggests that race congruence effects are most pronounced in elementary grades, whereas the two-way fixed effects model suggests these effects are more pronounced in middle school. We would prefer the two-way fixed effects model if it was evident that the differences between models was driven by endogenous variation unaccounted for in the student fixed effects model. However, if this were the case, there would need to be a set of remaining unobservables that positively bias elementary results and negatively bias middle school results in student fixed effects models. It is difficult to hypothesize a set of unobservables that would fit this pattern. Importantly, we do not claim that our student fixed effects model is free from potential endogeneity. Rather, our claim is that the irregular patterns in differences in estimates across models do not resemble the effect of any classroom factor that might potentially be picked up by the inclusion of the classroom fixed effects in the two-way model.
Absent clear evidence of bias reduction, we prefer the more parsimonious student fixed effects model for two primary reasons. First, the inclusion of a high-dimensional fixed effect can alter the weight each unit contributes to the fixed effect estimate (Gibbons, Serrato, & Urbancic, 2018). In the presence of heterogeneous treatment effects, this change to each unit’s “effective weight” can result in the fixed effect estimate differing from the sample average treatment effect. If two-way fixed effects do not offer any substantial reduction in bias, we prefer the more parsimonious model to avoid distorting the “effective weights” of our analytic sample further. Second, as noted by Kropko and Kubinec (2018), while there is a mechanical understanding that two-way fixed effects account for unobservables across both dimensions, there is no intuitive explanation of the source of identifying variation of these models. The relative clarity of the student fixed effects model is preferable, all else held equal. While we ultimately prefer our student fixed effects model, this robustness check certainly indicates the strong model dependence of our estimates. As a result, interpretations of our subgroup-specific estimates should be made with caution.
Second, there is a concern that the covariates we include in our models may function differently for students of different races. If this is the case, our decision to pool all students together for our main analyses may mean that the included covariates are not equally effective for “sweeping out” bias across all racial groups. Empirically, we do find differences in our estimate of the effect of race-matching when using separate subsamples of White and Black students (Appendix Table A6). Specifically, unlike in our analysis that uses pooled covariate estimates in Table 5, the separate subgroup analysis in Appendix Table A6 finds a significant coefficient for Black students in reading (0.02 SD) for the full sample.
We conduct a Chow test to determine whether the coefficients between the Black and White samples are equivalent. If covariate coefficients do not differ significantly across groups, it would suggest that the difference we observe on the race-match covariate is due to a loss of precision, motivating us to use the pooled model. Conversely, if covariate coefficients do differ significantly across groups, it would suggest that the differences we observe are due to differences in how covariates function for students of different races, motivating the use of interacted models or stratified samples. We reject the null hypothesis that the estimated coefficients across race-specific subsamples are jointly equal. While the results of the Chow test suggest it would be more appropriate to stratify our models by racial subgroup in Table 5, we lack adequate sample size to do so. Given that our estimated effects are small and sensitive to model specification, we were concerned about the loss to precision that could result from fully interacting the model by race indicators or stratifying the sample by race and grade.
Third, given the lack of experimental variation and our use of longitudinal data, our results are susceptible to endogenous sorting of students to race-congruent teachers over time. If principals are aware of the potential benefits of race-congruent teacher assignment, they may be more likely to strategically place certain students and teachers in these arrangements. We implement a test modeled after Fairlie et al. (2014) that uses a differences-in-differences approach to estimate whether prior characteristics of Black students assigned to Black (i.e., race-matched) teachers differ significantly from those assigned to non-Black teachers. With full results in Appendix A7, we find that Black students assigned to Black teachers do not significantly differ from Black students assigned to non-Black teachers with regard to prior achievement but are 13% percent less likely to be SPED eligible and 1% more likely to be FRPL eligible. This likely signals other unobservable differences between these students and more specifically, unobservables that are more strongly correlated with SPED and FRPL than prior achievement.
However, we believe that these findings might have only limited impact on our estimates for the following reasons. First, the analytic strategy we use to estimate our main estimates, student fixed effects, accounts for a more thorough set of unobservables than the school-year-grade fixed effects model we use to conduct the Fairlie test. To the extent that the significant differences we observe in SPED and FRPL are indicative of time-invariant student unobserved factors, the use of student fixed effects in our primary analytic models will account for this endogeneity. Additionally, the fact that we do not observe differences in achievement bodes well for our analysis of current year academic outcomes, which are strongly predicted by prior year scores. If we were to investigate the effects of race-match on alternate outcomes (e.g., discipline, attendance), the type of unobservable differences suggested by the Fairlie test may be more problematic.
Another type of endogenous sorting that may affect our estimates is if assignment to a race-congruent teacher in the previous year is a significant predictor of race-congruent teacher assignment in the following year. If this type of endogenous assignment occurs, our estimates of the contemporaneous effect of race congruence may erroneously also reflect the contributions of prior race-congruent teachers. In Appendix Table A8, we find that conditional on their school-year-grade, White and Black students are 14 percentage points and 17 percentage points more likely, respectively, to be assigned to a race-congruent teacher if they were assigned to a race-congruent teacher in the prior year. However, when we reestimate our primary analytic models to include lagged race-congruence as a regressor, we find that whether a student was assigned to a race-congruent teacher in the year prior has no statistically significant effect on current year achievement. The lack of significant lagged effects suggests our primary estimates predominantly reflect only the contemporaneous effects of race-congruence.
Finally, there is concern that students may benefit from being paired with other types of “matches” (e.g., any minority teacher). We conduct a placebo test by estimating the effects of a series of noncongruent-race “matches.” The reference category in each of these regressions is the average student in years when he or she is not paired with this type of teacher. As seen in Appendix Table A9, in both reading and math, we find no relationship between these alternatively matched student-teacher pairs and students’ test scores. 8 This finding suggests there is indeed a positive effect on students from having race-congruent teachers that goes above and beyond students’ outcomes when paired with any non-same-race teacher.
Discussion
The goal of this analysis is to estimate the effects of race-matching on student test scores and determine whether these effects varied by racial subgroups, student preparedness, and teacher quality. Relying on a student fixed effect strategy that included controls for teacher quality, we found no significant increases in test scores from being assigned to a race-congruent teacher in reading and math in Grades 3 through 8. However, we found positive effects from being assigned to a race-congruent teacher for elementary school students in math. The effects for Black students are moderate in reading but more prevalent in elementary grades. We find no variation in the marginal effects when looking at heterogeneity by student preparedness and teacher quality in reading in the full, elementary, and middle school samples. In elementary math, however, low-performing students and students assigned to teachers in the middle two quartiles of performance were predicted to have higher achievement when assigned to a race-congruent teacher.
As evidenced in our robustness checks, we find that the significance of many of our subgroup estimates are contingent on our particular modeling strategy. While we believe our use of a student fixed effects model is justified, we note that readers should interpret our subgroup estimates with caution given their lack of robustness to other strategies. However, if taken at face value, there are intuitive and theoretical reasons why we observe more pronounced race-match effects for elementary students. First, elementary students spend a greater amount of time with their teachers (oftentimes the full instructional day) as compared to middle school grades where students rotate to many teachers. Alternatively, we may be seeing stronger effects in elementary grades due to the developmental age at which the children are experiencing the race-match. Younger students may be more influenced by a race-congruent teacher, who may act in the position of a second parent or key role model.
Examining heterogeneity by race yielded a significant effect size for Black students in elementary reading and in math, with a stronger effect size observed in math. The effect of race-matching for Black students in math may support the hypothesis that Black teachers are better able to employ CRT practices, eliminate barriers to access to math education, and support students in developing strong math content knowledge by better supporting their Black students’ learning. The overall race-match effect, and in particular the effect for Black students in elementary school, is larger than that obtained by Egalite et al (2015). Given that there is substantial difference in the racial and ethnic diversity present in Florida and Tennessee, there are likely deeper contextual differences between the environments of these two states that is leading to the observed difference in effect sizes. Nevertheless, that findings are similar across states underscores the idea that race-match effects positively serve students in a variety of instructional and geographic settings.
Finally, our examination of heterogeneity by teacher quality provides evidence in support of passive teacher effects as a key mechanism in student-teacher race-matching. Students paired with race-congruent but midperforming teachers experienced a benefit to their test scores, but students matched with higher or lower quality race-congruent teachers did not. This suggests that even when teachers are in the middle range of pedagogical performance, the benefit students experience may come from the teachers serving as a role model for students or creating a safer classroom environment. High-performing teachers may be better equipped at reaching students of all backgrounds, so students matched with a race-congruent yet highly qualified teacher do not receive any bump in their test scores from the shared-race pairing.
There are limitations to this study. First, we may not have accounted for all time-variant characteristics of students that affect test scores in our main models. Though we control for teacher quality and average peer achievement, there may still be additional factors impacting test scores that may be biasing our estimates such as student attendance and disciplinary record, family and environmental characteristics, or a student’s neighborhood of residence. Our examination of the two-way fixed effects models, which result in the significance of estimates changing from elementary to middle school, highlight the sensitivity of estimates to model specification. In short—the student fixed effects model may not be getting at the full story here.
Second, while we observe some of our effects appear different than those observed in Florida, it is unclear the source of these differences. One explanation for the differences in our estimates from those in the Egalite et al. (2015) paper maybe be due to differences in student characteristics and local contexts. However, discerning what these differences are is beyond the scope of the available data. Another possibility could be differences in data availability in Tennessee. While we estimate point estimates of the same, if not larger, magnitude to those obtained by Egalite et al., we do not find that these estimates are consistently significant. This is likely due to student and teacher populations in Florida being considerably more diverse than in Tennessee, resulting in more non-White, race-matched students, and accordingly, more precision with which to estimate the effects of race-matches.
A third limitation is we are unable to empirically test the channels and mechanisms through which race-matching affects student test scores. This exploration would help explain some of the nuances in the results, such as why we see an effect of race-matching in math when assigned to a high-quality teacher but not reading.
Further research is needed to test the active and passive mechanisms that may be driving the positive effects captured in this and other race-match work. Prior literature has hypothesized that having a race-congruent teacher may decrease stereotype threat faced by students of color. A race-congruent teacher may also serve as an academic role model for students. Hence, it may be the case that the more immediate effect on students, particularly at the middle and secondary levels of schooling, would be in improving attendance and discipline rates to the extent that the classroom becomes a less threatening, more supportive environment. Additionally, future research needs to continue to explore the relationship between race-match and nonacademic student outcomes such as attendance and discipline rates (e.g., Holt & Gershenson, 2017; Lindsay & Hart, 2017).
Our findings support policy efforts to diversify the educator labor force and retain teachers of color. Tennessee has taken a step in the right direction to spur innovation in increasing educator diversity by awarding planning grants to several higher education institutions in the state. This is particularly important given that the most important driver of mismatch between the racial composition of students and teachers is differences in college completion. At the same time, as the education system continues to recruit, develop, and retain minority teachers to work with the ever-increasing proportion of minority students in our country, it is crucial to better understand the role of student-teacher race-matching as it affects students and how mechanisms such as CRT practices can mimic these effects in an effort to provide a more adequate educational opportunity to all students.
Footnotes
Appendix
Effects of Race-Match on Test Scores by Subject and Student/Teacher Race (All Race/Ethnicities)

| Full | Elementary | Middle | |
|---|---|---|---|
| Panel A: Dependent variable = reading | |||
| Student-teacher race-match by race/ethnicity | |||
| White student/White teacher | 0.003 (0.012) |
−0.023 (0.026) |
0.006 (0.018) |
| Black student/Black teacher | 0.008 (0.011) |
0.042*
(0.025) |
0.006 (0.016) |
| Hispanic student/Hispanic teacher | −0.058 (0.248) |
0.524**
(0.241) |
|
| Asian student/Asian teacher | −0.047 |
−0.157 |
0.117*
|
| Adjusted R2 | 0.801 | 0.802 | 0.82 |
| Observations | 412,785 | 139,428 | 174,661 |
| Panel B: Dependent variable = mathematics | |||
| Student-teacher race-match by race/ethnicity | |||
| White student/White teacher | 0.013 |
−0.003 |
0.034 |
| Black student/Black teacher | −0.003 |
0.075**
|
−0.042 |
| Hispanic student/Hispanic teacher | 0.166 |
−0.127 |
0.203 |
| Asian student/Asian teacher | 0.159 |
0.222 |
0.155 |
| Adjusted R2 | 0.737 | 0.739 | 0.757 |
| Observations | 675,184 | 194,873 | 334,328 |
Note. All models use student fixed effects and include student-, teacher-, and school-level covariates, including all controls for teacher quality. Models estimated using Stata’s reghdfe command. Singleton observations have been removed. Standard errors, in parentheses, are clustered at school level. Due to an insufficiently large sample of Hispanic and Asian teachers and students in the Tennessee data, the estimated effects for Hispanic and Asian students were not interpreted. The Asian category includes teachers and students who identify as Asian American, Pacific Islander, or other racial subgroup.
p < .10. **p < .05
1.
We use the terms race-match and race-congruent interchangeably.
2.
Appendix ![]() reports the number of unique student observations by school year and subject for the full sample. The noticeably larger number of math test score observations is due to the fact that more students are partially claimed in reading than they are in math. Since we exclude students who spent less than 100% of their time with a core-subject teacher, we lose approximately one-third more observations in reading.
reports the number of unique student observations by school year and subject for the full sample. The noticeably larger number of math test score observations is due to the fact that more students are partially claimed in reading than they are in math. Since we exclude students who spent less than 100% of their time with a core-subject teacher, we lose approximately one-third more observations in reading.
3.
Due to small sample samples for Asian students, Pacific Islander students, and students of other racial subgroups, as well as small samples of teachers in these groups, participants falling into these categories were grouped under the indicator “Asian.”
4.
As seen in Appendix Table A2, an examination of the standardized differences between the complete Tennessee Education Research Alliance (TERA) data set, totaling 7,572,927 observations, and our analytic sample of 1,088,166 observations revealed no significant differences across the majority of the covariates used in the analysis. The standardized difference is calculated as the absolute difference in full and analytic sample means divided by the estimated pooled SD of a given variable as discussed in Stuart (2010) and ![]() . A difference greater than or equal to 0.25 between the two standardized means is considered large. There is a significant difference in the proportion of student-level observations in the full and analytic data set who fell into the four quartiles of math and reading achievement, with a greater proportion of student observations in the analytic data set falling into quartile categories. This is expected as the analytic sample removes students for whom we are missing prior year test score data and other key information.
. A difference greater than or equal to 0.25 between the two standardized means is considered large. There is a significant difference in the proportion of student-level observations in the full and analytic data set who fell into the four quartiles of math and reading achievement, with a greater proportion of student observations in the analytic data set falling into quartile categories. This is expected as the analytic sample removes students for whom we are missing prior year test score data and other key information.
5.
We do not draw identifying variation from same-year, across-class differences in student-teacher race congruence since we (a) restrict our identifying sample to students who are claimed by only one teacher in a given subject-year and (b) estimate all models separately by subject. Therefore, in each subject-specific model, a student is linked to only one teacher in a given year, restricting identifying variation to within-student changes in teacher race across time.
6.
We omit prior year test scores in models using student, teacher, and classroom fixed effects.
7.
8.
It is noted that due to the small numbers of other-minority teachers in the Tennessee labor force, many of these sample sizes are quite small, and it is possible that a larger sample of minority teachers would improve power in detecting an effect from having a differently-matched teacher.
Authors
ELA JOSHI is a doctoral student in the Department of Leadership, Policy, and Organizations in Vanderbilt University’s Peabody College of Education. Her research interests include supports for historically marginalized student populations, school leadership, and organizational dynamics in schools.
SY DOAN is a graduate student at Vanderbilt University’s Peabody College of Education and Human Development. His research interests are educational measurement and teacher effectiveness.
MATTHEW G. SPRINGER is the Robena and Walter Hussman, Jr. Distinguished Professor of Education Reform at The University of North Carolina at Chapel Hill. His research interests are incentives, accountability, and compensation.