
Abstract
The effect of the 2008 Recession has reverberated throughout public education in the United States. This paper examines how the gifted education funding in the state of Texas changed following the Great Recession. The framework of a generalized longitudinal mixed effect model was used to explore this topic. Data acquired from the Texas Education Association included financial and demographic information on Texas School districts (n = 1,025) between the 1999–2000 and 2014–2015 academic school years. The primary finding was that the Great Recession adversely affected suburban school districts. These districts saw a greater percentage point reduction of budget allocated toward gifted programming (–.24) than rural (–.08), town (–.05), or urban (–.08) school districts (t = 2.72, p < .01).
The financial crisis of 2008, nicknamed the Great Recession, happened when the U.S. stock market peaked in October 2007 (at over 14,000) and reached its low point in March 2009 (under 7,000), losing half its value in less than two years. Scholars placed blame on predatory lenders, exotic financial instruments, and lack of regulation as the cause for the collapse of banks and mass foreclosure of houses (Elsby, Hobijn, & Sahin, 2010). States, faced with tough budget decisions due to sharp declines in tax revenue, were made to choose where spending cuts would be targeted. Education was an easy target for legislators looking to cut perceived budgetary bloat (Barr & Turner, 2013). In addition, when legislators cut school budgets, it was the job of central office staff to rewrite budgets and find their own cuts at the district level to adjust to the new financial reality following the Great Recession. Salaries must be paid, buildings must be lit and maintained, and busses must run to pick up students. With so many necessities that had to be accounted for, administrators had to decide what their school could afford to lose.
This research aims to assess the effect of the financial crisis and subsequent Great Recession on spending for gifted education in Texas public school districts. Gifted education in particular is a useful metric as it lacks the federal mandates and protections of other special populations. The consequences for redistribution of resources away from gifted education have been explored by researchers (Plucker & Peters, 2018). In particular, traditionally underrepresented students (Black, Hispanic, and Native American) can need additional resources for identification (Card & Guiliano, 2016; Hodges, Tay, Maeda, & Gentry, 2018) and appropriate instruction to meet their educational potential (Card & Guiliano, 2016; Peters & Engerrand, 2016). Card and Guiliano (2016) examined the effect of reducing identification procedures in a large Florida school corporation due to budgetary cuts after the Great Recession. The authors found that the addition of additional screening procedures increased the representation of Black and Hispanic students in gifted programs. Following the screening procedures removal, the representation rate returned to where it had been before (2016). In other words, cutting funds for gifted education (which includes advanced placement and dual credit courses and other college preparation curricula) risks furthering the achievement gap between Black, Hispanic, and Native American students and their Asian and White peers (Plucker, Hardesty, & Burroughs, 2013).
A quantitative framework using a linear mixed effects model was used to examine a data set that encompasses 16 years of enrollment and financial information for Texas public schools. This research provides insight into what factors affect district financial decision making when difficult choices are presented. Further, this research illuminates and provides awareness to the current educational environment for students identified as gifted.
Literature Review
Texas mandates that school districts identify gifted students. Further, the state provides guidance to school districts for their gifted programs. Most importantly, the state provides funding for gifted services (Texas Education Agency [TEA], 2013). The funding plan for gifted education has been in place since 1995 (74th Texas Legislature, 1995). Texas school districts receive guaranteed funding for gifted programs on a per student basis up to 5% of their student population. The important caveats to this are that 40% of the funding for gifted education is mandated to be spent directly on gifted education programs, and the remaining 60% can be used at the district’s discretion on budget items ranging from building electricity bills to new classroom equipment (TEA, 2013). Further, the state financial plan creates an even financial field through its recapture and redistribute program where districts over a threshold of property wealth per student have that excess taken by the state and redistributed to poorer school districts. In short, you have an economic environment in which the state provides an incentive for a behavior (identification of gifted students) in an environment where economic differences between school districts have been at least partially controlled.
Furthermore, Texas public schools were not left unscathed by the Great Recession. Leachman and Mai (2014) reported that Texas schools are still funded at 10% lower levels from before the Great Recession as of 2014 after adjusting for inflation. From the 2004–2005 to the 2014–2015 school years, enrollment in Texas public schools increased by 831,421 students, to a total of 5,232,065 (U.S. Office for Civil Rights, 2016). In the 2014–2015 school year, Texas identified 397,209 students for gifted services. This equates to 7.59% of its student population. In the 2013–2014 school year, the U.S. Office of Civil Rights (2016) reported that 3,329,544 students were identified as gifted in the United States. Of those, 11.77% were located in Texas public schools. In short, this means that when Texas makes a policy decision affecting gifted education, it will influence the educational experiences of over 10% of the gifted students in the United States.
Funding Strategies in Texas
The state of Texas funds educational programs through a weighted funding system (Baker & McIntire, 2003; Verstegen, 2011), using money from three main sources: (a) local school district property taxes, which is made up of maintenance and operations (M&O) tax and, if applicable, an interest and sinking (I&S) tax, (b) state funds, and (c) federal funds (TEA, 2013). The Foundation School Program (FSP), administered by the TEA, is the source of state funding for all Texas school districts (TEA, 2013). The role of FSP is to ensure that all school districts, regardless of property wealth, receive “substantially equal access to similar revenue per student at similar tax effort, considering all state and local tax revenues of districts after acknowledging all legitimate student and district cost differences” (TEA, 2013, p. 7). Texas uses a two-tiered system, where the first tier provides a basic level of funding per student and a series of weighted adjustments to account for individual and district differences, such as the amount of gifted and talented students or English language learners (Roll & Jimenez-Castellanos, 2014; TEA, 2013). The second tier is supplemental to the first tier of basic funding and is known as enrichment. School districts are allowed to tax above a district’s compressed rate for enrichment, leading to additional funding based on tax revenue (TEA, 2013).
Texas’s Recapture System
The importance of Tier I and Tier II allotments are due to the school finance structure in the state. Texas employs a recapture and redistribute program that has been called the Robin Hood Plan (Hoxby & Kuziemko, 2004). The purpose of this plan, as envisioned by legislators, was to equalize funding on a per student basis across the state. Austin ISD was designated as the benchmark for the rest of the state. School districts that were property-rich had money taken and redistributed to property-poor districts. The determination of whether a district was property-rich was based on its weighted average daily attendance.
Further, efforts by property-rich districts to reduce recapture payments to the state by lowering M&O tax rates (property taxes) to avoid partial recapture is impeded by state laws. Texas requires a district vote to lower tax rates and then another vote to raise them back to the previous tax rate (TEA, 2013). This disincentivizes lowering tax rates to avoid recapture since there is no guarantee that taxpayers will vote to return tax rates to previous years during periods of budgetary shortfalls.
Great Recession’s Influence on School District Budgets
Between December 2007 and June 2009, the United States went through its longest economic recession since the Great Depression in the 1930s. An important factor in causing this recession was the crash of the housing market in 2007, when the credit bubble burst. This caused a rapid decline in property value in 2008 and seemingly started a chain reaction that turned into a global economic crisis. Following this bubble burst, several large U.S. companies in a variety of sectors filed for bankruptcy, causing the stock market to crash, and by 2009, the U.S. GDP had dropped dramatically. Following this downfall, the U.S. government created and implemented the Recovery and Reinvestment Act. About 12% of the funds made available through this Act were assigned to education (U.S. Department of Education, 2009). Under this Act, the U.S. government required all states to keep funding for K–12 education for fiscal years 2009 to 2011 at levels greater or equal to the level of funding provided before the recession (i.e., in fiscal year 2006; Conant, 2010).
In the same period, mandates from No Child Left Behind (NCLB) dictated a shift of focus onto performance goals for public schools (Bush, 2001) and increased attention on closing the achievement gaps among students of different ethnicities (Olszewski-Kubilius & Thomson, 2010). This resulted in districts having to seek alternative funding for their gifted programs or abolishing their gifted services altogether (VanTassel-Baska, 2010).
Freelon, Bertrand, and Rogers (2012) examined the effect of the recession in California public schools and noted that there was a disparity in how affluent suburban districts financially adjusted in comparison to poorer school districts. In affluent districts, the district could raise property taxes in response to a decrease in state funding. In contrast, districts with high rates of students receiving free or reduced lunch could not raise funds through property taxes. These districts in turn had to cut services that they had offered to their student population. Freelon et al. concluded that this reduction in services in poorer districts while affluent districts maintained services led to higher rates of inequality.
In an analysis presented to the Federal Reserve Bank of New York, Chakrabarti and Setren (2011) examined the effect of the Great Recession on New York State public schools. In contrast to the finding by Freelon et al. (2012), Chakrabarti and Setren found that more affluent schools were affected by the recession to a greater extent than their less affluent peer districts. Affluent districts lost a greater percentage of revenue from local sources (e.g., property taxes) than other districts. This translated to a 5.4% reduction in suburban districts compared to a 1.8% reduction in other districts. In addition, the New York State legislature had also allotted a higher portion of available funds toward districts with higher rates of poverty than more affluent districts. In the same study, Chakrabarti and Setren found that the largest reduction in expenses on student services did not immediately follow the Great Recession but took place in the following years. The authors also found that both types of districts experienced declines in student services (2% decline for affluent district vs. 4% decline for nonaffluent). However, in examining the effect of locale, the authors found that suburban schools experienced a reduction in student services while school districts in urban and rural locales could maintain their level of student services. Suburban districts experienced a 5% decrease in student services while urban and rural districts had 1% increases in student services.
Consequently, the U.S. federal government provided states with federal funding for education in the form of the State Fiscal Stabilization Fund (U.S. Department of Education, 2009). In a report to the Federal Reserve Bank of St. Louis, Dupor and Mehkari (2015) noted that schools predominately used the stimulus money they received from states on capital outlays such as building renovations. The authors demonstrated that school districts’ budgets saw increases in capital overlays while maintaining personnel and decreasing services.
Great Recession’s Influence on Texas’s Education Budget
The main sources of funding for Texas public schools are local school district property taxes, state funds, and federal funds (TEA, 2013). Thus, Texas was severely affected by the housing market crash in 2007. In response to the fiscal crisis, Texas received funding from the federal government to address budgetary shortfalls in education (U.S. Department of Education, 2009). Despite the added stimulus from federal sources, funding per identified gifted student decreased by between 8% and 10% since 2008 (Leachman, 2016; Leachman & Mai, 2014), making Texas one of the five states with the deepest cuts in education funding in the post-recession era (Leachman, 2016). As a result, Texas put in place two different strategies to supplement its education funding: (a) increase their M&O taxes to raise revenue and (b) mandate the regular program adjustment factor (RPAF) between 2011 and 2015. The RPAF reduced the school districts’ Tier I allotment.
Locale’s Influence on School District Budgets
A characteristic affecting the funding for education is the location of schools. Rumberger and Thomas (2000) described school location in three main categories, urban, suburban, and rural. In educational research, the classification of urban, suburban, and rural areas is an important variable as the location of a school has a significant effect on funding and expenditures. Meyer, Scott and Strang (1987) investigated federal, state, and local funding and found that teaching expenditures were higher in urban and suburban areas. Kettler, Russell, and Puryear (2015) examined the funding designation in Texas during the 2010–2011 academic year. They found that Texas rural schools allocated significantly less funding and fewer staff members to gifted programming than schools in urban and suburban areas.
Although most researchers agree that school locale influences the funds and services available, there is no agreement about the influence of locale, funding, and resources on students’ performance. For example, Hanushek (1997) conducted a meta-analysis study with 377 studies from 90 individual publications to investigate the relationship between student performance and school resources. Hanushek found no significant relationship between school resources and student achievement. Interestingly, one of the important results from Hanushek’s study was that local districts use more effective and smarter strategies when managing school funding as opposed to dollars allocated at the county or state level.
The influence of locale is not limited to funding for gifted education. Funding for general education also differs based on the socioeconomic status of the residents within the school districts. Hochschild (2003) investigated the differences between urban and suburban schools in the United States and found that there were significant differences in urban and suburban schools regarding per student spending, number of classes, poverty, teacher certification, and available technology. Rubenstein, Schwartz, Stiefel, and Amor (2007) compared the distribution of resources between urban schools in New York City and Cleveland and Columbus, Ohio. The researchers found that schools with high populations of students from low socioeconomic families received more money and had a smaller teacher/student ratio. Similarly, Wright (2012) pointed out that the U.S. education system has a big gap in urban and suburban areas in terms of resources, parental support, and attrition of teachers and top schools, with having bigger shares of funding causing unfairness. Baker and Friedman-Nimz (2004) examined the Common Core of Data 1993–1994 to examine funding disparities. The authors found that more affluent suburban districts provided higher level of services for gifted funding, but districts with large portions of their student body receiving free and reduced lunch had lower levels of provided services yet received more state funding. Regardless, education funding is critically important and not immune to the influence of outside factors.
Purpose
Though scholars have examined the macro effects of the recession on school districts (Chakrabarti & Setren, 2011; Dupor & Mehkari, 2015; Leachman & Mai, 2014), few scholars in gifted education have examined the numerous specifics of how those effects manifested in district-level funding choices. The purpose of this study was to examine the effect of the financial crisis on the budget for gifted education in Texas public school districts. Kettler et al. (2015) provided evidence that the locale of a district influences how it allocates resources in Texas. Freelon et al. (2012) and Chakrabarti and Setren (2011) came to opposing conclusions in their examination of the influence of the Great Recession on different locales. The purpose of this paper is to extend the findings of Kettler et al. (2015) and provide further evidence to understand the opposing findings of Freelon et al. and Chakrabarti and Setren.
This research provides insight into the factors affecting school districts’ financial planning under recession conditions coupled with a push for greater accountability through NCLB. It will also fill the gap in the literature regarding funding for gifted education. Plucker, Makel, Matthews, Peters, and Rambo-Hernandez (2018) called on researchers to examine gifted education policy. This paper fulfills this call by examining how funding is influenced by budgetary shortfalls caused by the Great Recession.
Examining budgetary allocations provides the crucial link in understanding programmatic outcomes for gifted students. Scholars know that Texas cut its budget following the Great Recession (Leachman & Mai, 2014). This research seeks to address whether those cuts manifested in districts allocated money away from gifted education programs. If this is the case, then a crucial link can be established in understanding the relationship between funding and programmatic outcomes. Plucker et al. (2013) noted the excellence gap between Black, Hispanic, and Native American students and their Asian and White peers. Card and Guiliano (2016) provide a bleak picture of what happens when additional funding is removed from gifted education programs. Asian and White students’ outcomes are maintained while Black, Hispanic, and Native American students fall. In short, there is the real possibility that budgetary cuts disproportionately affect gifted Black, Hispanic, and Native American students. In other words, the Great Recession could influence the excellence gap between Black, Hispanic, and Native American students and their Asian and White peers. Before that can be established or examined with fidelity, what must first be understood is if there were reductions in programmatic offerings for gifted education.
Research Questions
Research Question 1: To what extent and at what rate did the 2008 Great Recession affect budgetary spending for gifted programming in the state of Texas?
Research Question 2: To what extent did the 2008 Great Recession affect budgetary spending for gifted programming in the state of Texas and differ by school locale?
Method
Data Sources
The data set used in this study was acquired from the Public Education Information Management System (PEIMS). This is the publicly available data warehouse system that is managed by the TEA. The Texas Public Information Act (1993) mandates that schools make certain information open to the public. That information is made available for download on the TEA website and via request. The data used in this analysis were from a combination of data that was downloaded from the TEA and a requested data set.
The data set includes information on all public and charter school districts in the state of Texas between the 1999–2000 and 2014–2015 academic years. Seven hundred and twelve observations were removed from the data set using listwise deletion, representing 3.61% of the sample observations. These observations either contained no financial data or no enrollment data. Considering that the districts with missing data were distributed at random across locales and represented less than 5% of the total sample, more statistically rigorous methods for handling missing data were not appropriate (Little, Jorgensen, Lang, & Moore, 2013). The final data set comprised 18,843 observations. Descriptive statistics for the final data set are presented in Table 1.
Descriptive Statistics of School Districts of Texas (N = 1,025)
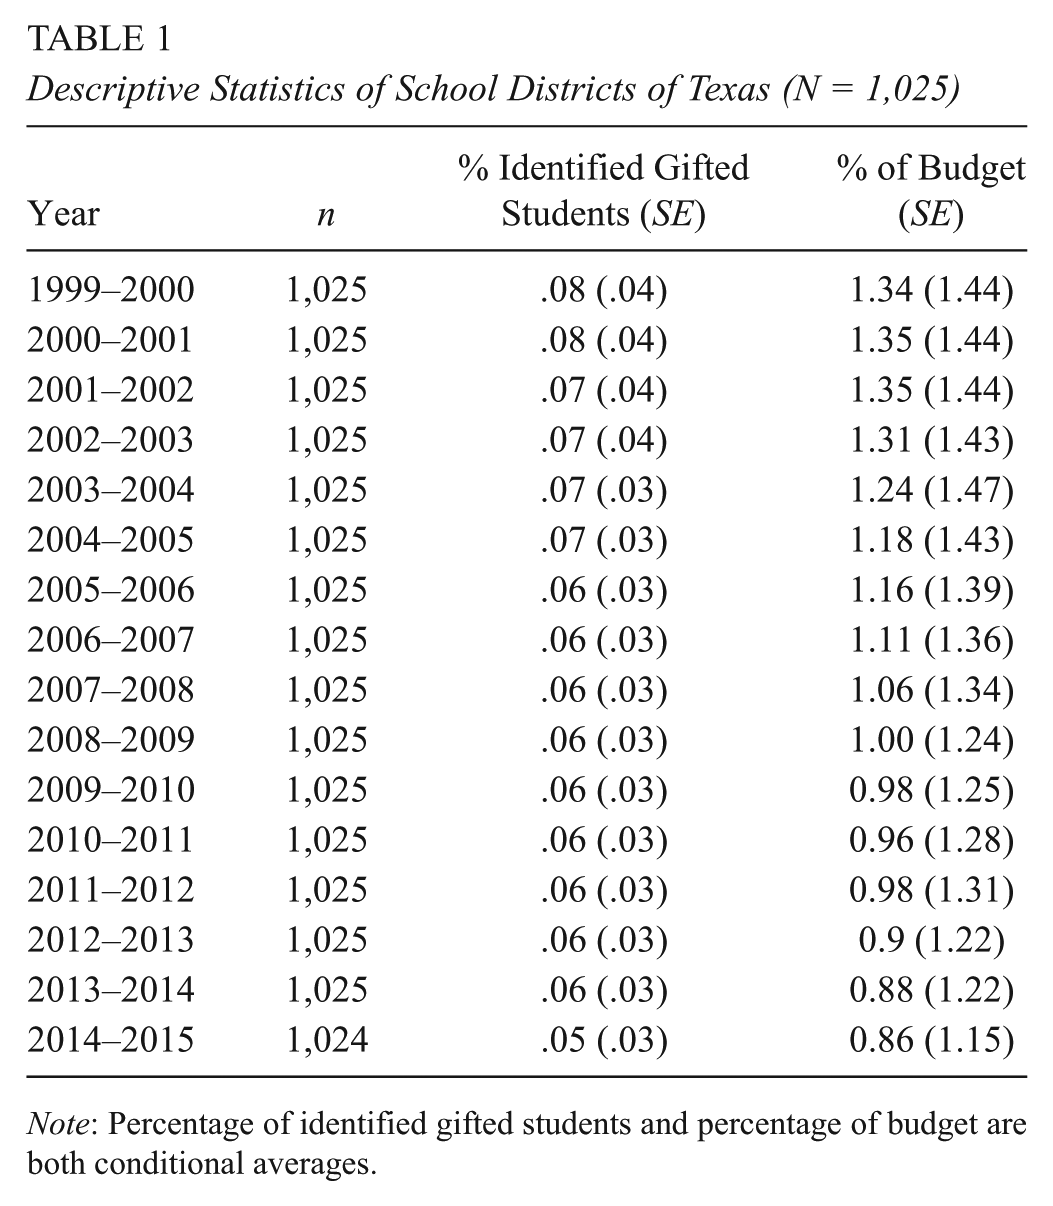
Note: Percentage of identified gifted students and percentage of budget are both conditional averages.
Dependent variable
Percentage of budget allocated toward gifted education was the dependent variable chosen for analysis. This variable was preferable to other possible financial variables due to three properties. The first reason is that percentage of budget allocated toward gifted funding is normally distributed. Though percentages can fall into a sigmoidal curve distribution, since the data are clustered around a central point (1.5%), a normal distribution can be used to analyze it (Harding, 1949). Although log transforming the dependent variable was not out of question, some districts had no budget allocated toward gifted education, thus any log transformation would lead to information lost in the analysis regarding these districts. A reader should note these schools are either juvenile detentions or small public charters (student population less than 50) serving special populations. Another important characteristic is that percentage of budget is robust to the relative district size. For example, urban school districts in Texas can have budgets in excess of $1,000,000,000 (e.g., Houston ISD); in comparison, rural school districts in the pan handle region might have budgets less than $1,000,000. Even adjusting for inflation, trying to compare school districts of such differing scales is infeasible.
Geographic variables
The National Center for Education Statistics (NCES) locale codes for school districts in the United States were used in the analyses. Schools were assigned as either urban (NCES Code 11, 12, 13), suburban (NCES Code 21, 22, 23), town (NCES Code 31, 32, 33), or rural (NCES Code 41, 42, 43). Though these variables were coded as categorical, R 3.3.1 (R Core Team, 2017) creates a dummy variable matrix of binary variables during regression analysis. It should be noted that schools coded as town served as the baseline during analysis.
Covariates
Financial variable
A standardized financial variable was created as a covariate to control for the variance between district budgets. A z score was calculated by standardizing total district revenue in a given year across all school districts. In other words, first, the mean district revenue for a given year was subtracted from the individual school district revenues and then divided by the standard deviation of school district revenues in a given year (Faraway, 2014). This is a time-varying covariate.
Ethnicity
Student count data were included in the model. Proportional enrollment was calculated for Asian, Black, Hispanic, Native American, and White students by dividing the students of a given ethnicity by the total students in the district. Note that the proportion for White students was used as baseline. Though Texas currently includes enrollment numbers on students identified as mixed race, this variable is not present across all timepoints between the 2000–2001 academic school year and the 2014–2015 academic school year. Due to this, it is not included in the model. This is a time-varying covariate.
Percentage of students identified as gifted
This variable describes the proportion of students identified as gifted in a school district in a given year. To provide greater clarity for interpretation, this variable was centered on .05 as Texas only funds up to 5% of an identified population. This is a time-varying covariate.
Percentage of students identified as at risk
This variable describes the proportion of students identified as at risk in a school district in a given year. Though a school district in Texas might contain schools labeled as Title I and others who are not, the percentage of students identified as at risk serves as a strong proxy for the overall socioeconomic status of a school district. This is a time-varying covariate.
School district
Observations are all timepoints nested under their corresponding district. To correct for this lack of independence, a random effect denoting the school district is required. In other words, this effect will allow the intercept to vary by school districts.
Time variable
An initial examination of the means plot guided researchers in specifying the initial time series model. Years were coded as waves, with the academic school year 1999–2000 being coded as 0, 2000–2001 as 1, 2001–2002 as 2, and so on.
A dummy variable (recession) was created to indicate the beginning of the effect of the Great Recession on the dependent financial variables. All years following but not including the academic year 2008–2009 were coded 1 and all previous years 0. A second wave variable, post recession, was coded starting in the academic school year of 2009–2010 such that 2009–2010 was coded as 1, 2010–2011 as 2, and so on with all previous years to the 2009–2010 academic school year, coded as 0.
Analysis
Regression equation
Given that each observation in the data set was not independent, a mixed effects regression model accounting for the nested structure of the data was appropriate for analysis. The following model was used to test each of the three outcome variables:
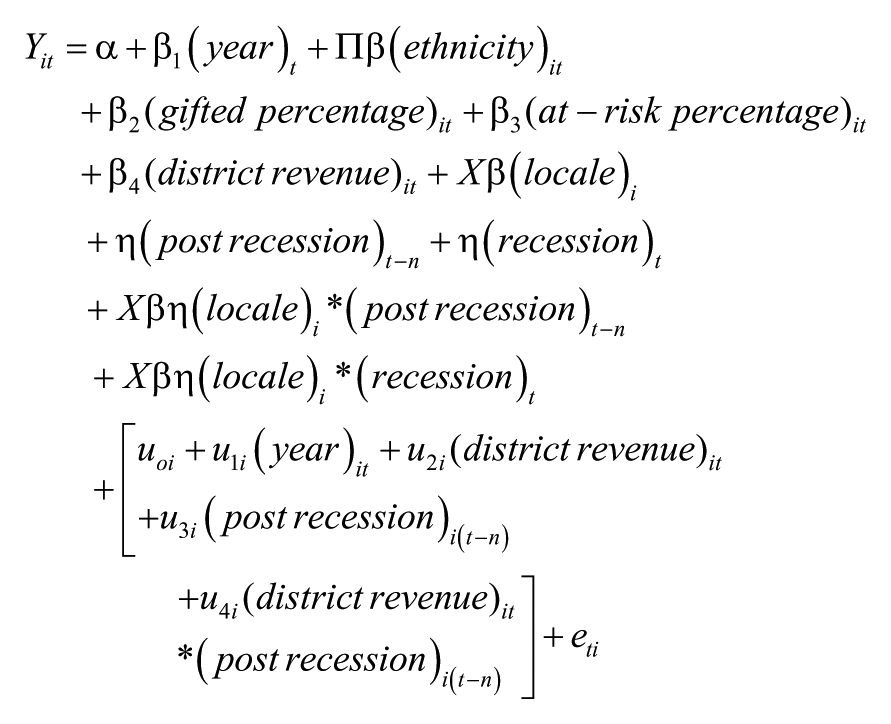
This equation states that the percentage of budget allocated for gifted services in the ith school district for year t is equal to: the year,
The purpose for constructing the model in this way is to examine whether there was a difference in percentage of budget allocated to gifted education by locale. This is done while also controlling for overall differences in district demographics: ethnic composition, percentage identified as gifted, and percentage identified as at risk. Controlling for these variables allows for an examination of locale and the recession while removing differences that could mask the effect of the Great Recession.
Using the framework of a linear mixed model allows for a better modeling of the relationship between the dependent and independent variable than a simple linear regression. From a pure statistical standpoint, without the incorporation of a mixed model, there will be a violation of independence (Faraway, 2014). From a conceptual standpoint, there are likely within-district influences that should be accounted for. There is an overall across-Texas trend by locale, but allowing these slopes to vary by district provides increased nuance to the analysis. For example, school district changes in revenue and how it relates to the dependent variable can be examined longitudinally by how much revenue the district initially has. More affluent districts might have a different response to changes in revenue and the dependent variable than less affluent districts. The inclusion of random effects allows for this type of analysis.
When a linear model contains both fixed and random effects, the appropriate test statistic must be used (Faraway, 2014). Faraway (2014) suggested for researchers to use the Wald t when conducting hypothesis testing on linear mixed effects models. Further, the authors advised the use of a Satterthwaite approximation (Satterthwaite, 1946) to estimate degrees of freedom in significance testing. Further, Xu (2003) demonstrated that R2 can incorrectly specify model effect size. The author suggested for researchers to instead use a generalized form of R2 as the coefficient of determination when determining model effect size for linear mixed effects models. Model effect size was calculated using the suggested generalized form of R2 (Xu, 2003), Ω
The Bayesian Information Criterion (BIC) was used to assess model fit. Since the purpose of model fitting was to test a model rather than ascertain the true model from a set of covariates, BIC is a more appropriate fit index than the alternative fit index, the Akaike Information Criterion (Burnham & Anderson, 2004). Finally, model analysis was done using R 3.3.1 (R Core Team, 2017) and the lme4 package (Bates, Maechler, Bolker, & Walker, 2014).
Results
Descriptive Statistics
An analysis of the descriptive statistics provided evidence toward a general reduction in the percentage of funding allocated to gifted education programs. The means plot provided further evidence to the reduction in funding (see Figure 1). Descriptive results describing the percentage of student identified as gifted and percentage of budget allocated toward gifted programs in Texas can be seen in Table 1.
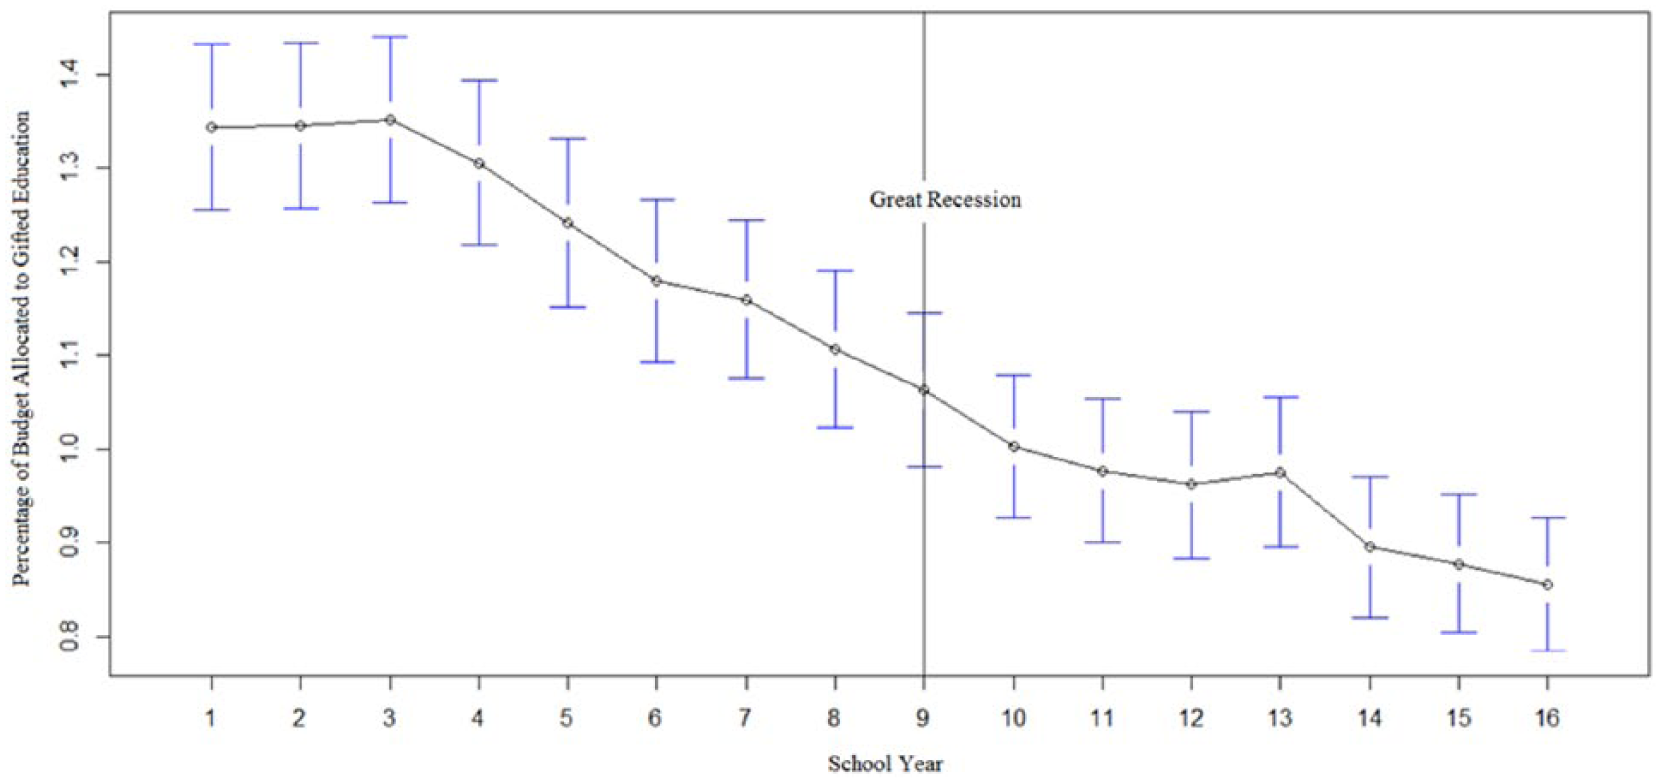
The percentage of budget allocated to gifted education services in the state of Texas between 1999–2000 and 2014–2015 academic school years.
Model Assumptions and Fit
An analysis of the residual plot suggested homogeneity of error terms. Linear mixed effects models assume normal distribution of fixed and random effects. QQ-plots were analyzed to assess for normality. An analysis of the plots showed a roughly normal distribution for both fixed and random effects.
For model fit, the null model contained only the dependent variable and year. The BIC for this model was 60,951.93. With the inclusion of random effects and time series, final model fit was
Model Analysis
Full model results can be seen in Table 2 for all main effects, including covariates and interaction terms.
Summary of Regression Analysis Results for Predicting Recession (N = 1,025)

p < .01.
Throughout the time between the 1999–2000 and 2014–2015 academic school years, there was a statistically significant decrease in the percentage of school budgets allocated toward funding for gifted programs (β = −0.03, t = 7.84, p < .01). The downward trend in funding did not change following the Great Recession (β = 0.01, t = 1.523, p = .13). There was not a general decrease in funding across all districts in the state of Texas following the recession (β = −0.04, t =0 .85, p = .39).
The type of locale was also a significant predictor of the percentage of budget allocated to gifted funding. Suburban school districts allocated larger percentage (β = 0.27, t = 2.65, p < .01) of school budgets toward gifted education during the time frame of the analysis. Conversely, rural districts allocated significantly less (β = −0.44, t = 5.42, p < .01) in terms of percentage of budget allocated toward gifted funding. A reader should be aware that the baseline was the town designation.
The recession significantly affected suburban school districts, which experienced a statistically significant drop (β = −0.19, t = 2.75, p < .01) in percentage of budget allocated toward gifted funding following the recession. The rate of funding change following the recession did not vary among locales.
In terms of the included random effects, the intercept (school district) had a variance component of 2.14 (SD = 1.46). The random slope for year had a variance component of 0.01 (SD = 0.10) and a correlation with the intercept of −0.53. The variable indicating the years following the recession comprised of a variance component of 0.46 (SD = 0.68) and had a correlation with the intercept of −0.29. The variance component of the random slope effect of standardized financial variable was 5.83 (SD = 2.42) with a correlation to the intercept of 0.47. Finally, the variance component for the random slope effect of the interaction between the standardized financial variable and the variable indicating the years following the recession was 1.02 (SD = 1.01) of total variation and had a correlation with the intercept of −0.44.
Robustness Check
A robustness check was performed to ascertain the stability of the primary explanatory variables (locale). Lu and White (2014) noted that robustness checks should be done purposefully in order to not lead to a possible misspecification of the model. Five alternative regression models were run to assess the robustness of the primary finding regarding suburban locales: (a) a regression model without ethnicity controlled for to assess the influence of race on gifted education observed by Card and Guiliano (2016), (b) a regression model without percentage of students identified as gifted or at risk controlled for to assess if high at-risk populations influence budgetary decisions, (c) a model with the students identified as gifted centered on 5% to control for Texas’s cap on funding on gifted education allotment, (d) a model with an additional spline representing the years before NCLB to control for the secular effect on the time series by NCLB, and finally, (e) a truncated regression model only including three years prior to the Great Recession to isolate the influence of the Great Recession. Results for the different models are shown in Table 3. Results indicated that the beta coefficients observed for locale were stable in direction and magnitude.
Examining the Stability of the Locale Coefficients (Rural, Suburban, Urban)

The American Recovery and Reinvestment Act of 2009.
Discussion
As Leachman and Mai (2014) noted, Texas has reduced its spending on education because of the Great Recession. The results from the current study provide context and an extension to Leachman and Mai’s work by examining gifted education funding. An important finding of the current study is that the Great Recession did not affect the overall trend of shrinking budgets allocated toward gifted education. A further critical finding is that suburban districts were affected to a greater degree than other locales in the state of Texas. These findings provide researchers with a greater understanding of how unexpected economic events affect spending.
To What Extent and at What Rate Did the 2008 Great Recession Affect Budgetary Spending for Gifted Programming in the State of Texas?
Texas received funding from the U.S. federal government following the Great Recession. The reality is that those emergency funds did not likely go toward gifted programs and instead went to overlays and funding personnel (Chakrabarti & Setren, 2011). As a result, in spite of the Great Recession, the general trend of decreased funding for gifted education following the inception of No Child Left Behind has continued unabated (Hodges, in press). An examination of the means plot (see Figure 1) suggested that a slowdown toward budgetary reductions was possible, but this likely was due to the limit on how much of the budget can be cut. In general, once the percentage of budget allocated toward gifted education is at the mandatory minimum, then nothing more can be cut.
To What Extent Did the 2008 Great Recession Affect Budgetary Spending for Gifted Programming in the State of Texas Differ by Locale?
Texas’s suburban districts experienced the greatest reduction in how much of a school budget is allocated toward gifted education. The initial result of the model is that suburban districts allotted a greater portion of their budgets toward gifted education. This finding aligns with the work of Hochschild (2003), who found that suburban districts, which are not faced with high rates of poverty within their enrolled student body, are able to allocate greater resources to student programs. Given Rogers et al.’s (2012) work, a reader would expect urban or rural districts to reduce budget allocation toward gifted funding more significantly than suburban districts.
However, Chakrabarti and Setren (2011) found that the Great Recession affected affluent districts more adversely. Results from the current study seem to provide evidence to the observation of Chakrabarti and Setren over those of Rogers et al. (2012). Thus, our results indicate that when facing large budgetary shortfalls, administrators of suburban districts are likely to see gifted education programming as an expedient area for budgetary cuts.
There is one important caveat in understanding how the results in Rogers et al. (2012) align with our findings. In California, districts are able to raise property taxes in times of economic crisis. Due to this, the suburban districts, those with greater property wealth, were able to mitigate the influence of the Great Recession more so than poorer districts. In Texas, this is not the case. The so-called Robin Hood Law means that any additional tax revenue generated by an increase in property taxes (beyond the $1.06 threshold) would be reappropriated by the state. Given this, there is a strong possibility that suburban districts in Texas were unable to maintain services due to the effects of the Robin Hood law. In essence, due to reappropriations enacted by the Robin Hood Law, Texan suburban districts were unable to utilize the strategies employed by California districts even if district administrators had desired.
Limitations
One limitation to drawing inference on this study is that it only encompasses one state. Though the state of Texas has one of the largest identified gifted populations in the United States and so its decision making affects a large number of identified students, its policies and practices are only relevant to its own borders. A second limitation is the limited timeframe after the Great Recession. The data set used in the analysis only encompasses seven years after the Great Recession. Although this would seem to be an adequate amount of time to fit a model statistically, from a practical standpoint, seven years is unlikely to be adequate.
Future Research
Now that there is evidence that funding cuts were made, the programmatic outcomes need to be assessed. Texas administrators shifted state funds away from gifted education following the Great Recession. Additional research can assess whether the reallocation of resources exacerbated the gap in excellence noted by Plucker et al. (2013) within Texas.
Conclusion
Texas schools have reduced budgetary allocation by nearly 40% since the turn of the century. If there is positive news to be gained from this study, it is that the Great Recession has not accelerated the reduction of funding provided to gifted education programs. Unfortunately, the Great Recession did cause suburban schools, which had been resistant to the pressures of NCLB, to conform to the trends seen in other districts across the state of Texas. The effect that this has on gifted students throughout the state will likely be realized in the coming decades. How a school district allocates its funding is likely a better determinant of what that district values than any other indicator. There is a colloquial phrase that embodies this sentiment: “Money talks.” In the case of Texas, what has been said is that gifted education programs are not necessarily as valued as they once were.
Supplemental Material
DS_10.1177_2332858418786224 – Supplemental material for The Effect of the 2008 Recession on Gifted Education Funding Across the State of Texas
Supplemental material, DS_10.1177_2332858418786224 for The Effect of the 2008 Recession on Gifted Education Funding Across the State of Texas by Jaret Hodges, Juliana Tay, Ophélie Desmet, Emine Ozturk and Nielsen Pereira in AERA Open
Footnotes
Authors
JARET HODGES is a research associate at the Talent Identification Program at Duke University. His research interests are in underserved populations in education.
JULIANA TAY is a doctoral candidate at Purdue University. Her research interests are in art education and identification of gifted artists.
OPHÉLIE DESMET is a doctoral fellow at Purdue University. Her research interests include underachievement, twice exceptionality, creativity, and underrepresentation.
EMINE OZTURK is a doctoral fellow at Purdue University. Her research interests include STEM education for gifted students.
NIELSEN PEREIRA is an assistant professor of gifted, creative, and talented studies at Purdue University. His research interests include conceptual, contextual, and measurement issues in the identification of gifted and talented populations; design and assessment of learning in varied gifted and talented education contexts; and understanding gifted and talented student experiences in talent development programs in and out of school.
References
Supplementary Material
Please find the following supplemental material available below.
For Open Access articles published under a Creative Commons License, all supplemental material carries the same license as the article it is associated with.
For non-Open Access articles published, all supplemental material carries a non-exclusive license, and permission requests for re-use of supplemental material or any part of supplemental material shall be sent directly to the copyright owner as specified in the copyright notice associated with the article.