
Abstract
The purpose of this study was to assess the effect of flipping the classroom on final exam scores in a terminal general education college mathematics course for a diverse student population. We employed a quasiexperimental design. Seven instructors collectively taught 13 sections of each pedagogy (flipped/traditional). Six hundred thirty-two students participated. Common final exams were graded concurrently. Mixed-model analyses were performed. Students in flipped sections scored 5.1 percentage points higher on average than those in traditional sections (p = .02) when controlling for math SAT and financial aid status, an improvement of 7.8 points among Black students (p < .01) and 1.0 points among Whites (p = .67). The estimated average difference between White and Black students, conditional on covariates, was 5.2 percentage points in traditional sections (p < .01) and –1.6 in flipped sections (p = .39). The 6.8-point difference in achievement gap between pedagogies was statistically significant (p < .01). Flipping the classroom was associated with improved student performance, particularly among Black students.
Keywords
a pedagogical approach in which direct instruction moves from the group learning space to the individual learning space, and the resulting group space is transformed into a dynamic, interactive learning environment where the educator guides students as they apply concepts and engage creatively in the subject matter. (Flipped Learning Network, 2014)
As in this study, lectures for the flipped classroom are often delivered by online videos developed specifically for the content of the course being taught. Seating is rearranged in the classroom to allow students a comfortable space in which to engage in collaborative learning. Instructors take on a new role in the classroom, becoming mentors who guide small groups of students in problem solving. In the flipped classroom, teachers can give relevant feedback to students about their work in that moment, and in doing so, they gain insight into their students’ misconceptions. The instructor becomes a more important stimulus for learning than in the traditional, lecture-based classroom because he or she directly engages with students in their thought processes.
Bishop and Verleger (2013) in their comprehensive review of the literature on the flipped classroom report only one semester-long study in higher education that compared learning outcomes of a control group (traditional lecture pedagogy) and a treatment group (flipped pedagogy) as measured by an objective posttest. Day and Foley (2006) conducted that study in a senior-level computer interaction course at Georgia Tech. It was a quasiexperimental study controlling for many potential confounding variables, including instructor. Students in the flipped class scored significantly higher at the .05 level of significance on homework assignments, projects, and tests combined (88.23% vs. 79.95%) and higher at the .10 level on both the midterm (86% vs. 82.44%) and final exams (87.53% vs. 83.60%). This being the only quasiexperimental study comparing learning outcomes measured by exam scores, Bishop and Verleger recommended that additional controlled experimental or quasiexperimental studies be done to better understand the potential of the flipped pedagogy. Since their literature review, there have been few studies that compare learning outcomes in flipped versus traditional college-level mathematics courses.
A study done at the University of Nebraska, Omaha, compared outcomes on three midterm exams and a final exam in an applied linear algebra course offered to sophomore science, technology, engineering, and mathematics (STEM) students (Love, Hodge, Grandgenett, & Swift, 2014). There was a significant difference in gains on exam scores favoring the flipped classroom. Nevertheless, the authors concluded that more research is needed to determine the effect of the flipped classroom, particularly in multiple-section introductory courses.
Overmeyer (2014) compared the final exam scores of five flipped sections with those of six traditional sections of a college algebra course at Colorado State University. Although there was a 2-point difference between the final exam mean scores in favor of the flipped classroom, which was statistically significant at the .10 level (p = .057), different instructors taught flipped and traditional versions of the course, and teacher effect was not controlled. Also, the study intervention was not standardized across instructors: Some included collaborative group work and some did not.
Wilson (2013) flipped the classroom of an introductory statistics course for social science majors at Capital University. Two sections of the course were flipped and two were not. The study’s principal investigator (PI) taught all four of these sections. There was no significant difference in pretest scores, whereas students in the flipped sections scored higher on the posttest than those in the traditional sections (p = .03).
Researchers at Harvey Mudd College (HMC) recently completed a 4-year study of the flipped-classroom pedagogy. Professors of chemistry, engineering, and mathematics taught both traditional and flipped versions of their courses (Lape et al., 2014). No significant differences in learning outcomes were reported. The authors suggested two potential explanations for this non-effect: (a) the pedagogies were not sufficiently distinct because traditional-section students had access to all inverted section materials, and (b) there was likely a ceiling effect because students at HMC are generally very high achievers. In fact, HMC offers its students a highly collaborative environment and is one of the most selective engineering colleges in the country. The interquartile range of math SAT scores at HMC in 2015 was 730 to 800 (Princeton Review, 2016a). The student body (829 students) comprised 35.6% White, 3.0% Black, 15.8% Hispanic, 19.4% Asian, 9.8% Other, 11.0% International, and 4.8% Unknown students (Princeton Review, 2016a). The authors suggested that more research is needed to identify contexts in which the flipped model is effective.
It is not clear from the above review of the existing literature whether flipping the classroom does or does not improve student performance in math courses. It appears that this pedagogy has a positive effect, but methodological and contextual variations blur the picture (Lape et al., 2014; Yong, Levy, & Lape, 2015).
The context of our study is an introductory terminal general education mathematics course (MAT103) at Buffalo State College (BSC), a State University of New York urban college serving approximately 9,000 undergraduates, three fourths of whom are commuters. The MAT103 environment presents special and important challenges. Students typically are not well prepared for college mathematics, a problem common to many American colleges and universities. The interquartile range of math SAT scores is 400 to 490. The course serves a highly diverse population. (See Student & Faculty Participants section below.)
In the face of these challenges, an introductory course that was lacking in college-level mathematical content had been offered at BSC. In 2006, MAT103 was redesigned to emphasize logical thinking, quantitative reasoning, and an introduction to mathematical proofs. (See online Appendix 1.) This course provides college-level content, but teachers have reported that it is difficult to fill in gaps in students’ mathematical background, present the new and often abstract content of the course, and interact sufficiently with students, all in the traditional classroom setting.
The fact that adjunct faculty who typically teach this course have varying professional backgrounds presents an additional unmet challenge. Although there are several published resources for teachers, the course inevitably will be taught at different levels and with differing expectations for students. This and the unique nature of the course content constitute a setting for potential benefits from standardization of course presentation via online video lectures.
The first author of the current paper conducted a pilot study, in which she recorded 26 Khan Academy–style video lectures and used them to flip four sections of MAT103. The results showed potential of the pedagogy to successfully address the above challenges. (See online Appendix 2.) This pilot involved flipped-classroom intervention and traditional, lecture-based control groups. The intervention consisted of three components: (a) the activity of watching the videos and taking notes at home, (b) graded quizzes over the content of each video in the class following the video assignment, and (c) collaborative peer-to-peer learning centered on group problem solving with instructor guidance in class.
Kay and Kletskin (2012) reviewed the literature on the benefits of video podcasts. The research suggested that video podcasts have a positive impact on student attitudes, behavior, and learning performance. The majority of papers reviewed studied the effects of videos that were made for nonmath and nonscience courses. Their own research on the effects of video podcasts that were designed to prepare students for a college calculus course found the videos to be useful remediating tools. An additional potential benefit of video lectures in multisection courses is the standardization of content presentation, which helps ensure high standards and expectations.
Abundant evidence also exists in the literature that collaborative learning strategies, all of which stimulate active learning on the part of collaborators, have a positive influence on test score outcomes (see, for example, Springer, Stanne, & Donovan, 1999; Swan, 2006; Swain & Swan, 2007). Springer et al. (1999) performed a meta-analysis of collaborative learning in STEM courses. They concluded that the effects of small-group collaborative learning exceed those of most previous educational innovations and support broader use of the method in practice. In a later meta-analysis of 225 studies that compared student performance in STEM courses under traditional lecturing versus active learning, Freeman et al. (2014) showed that active learning increased scores on concept inventories and course examinations. The effect was significant across all class sizes but more so in small classes, and mastery of higher-level cognitive skills increased more than that of lower-level skills. They concluded that active learning is a more effective strategy than traditional lecturing and that future research should test out-of-class interventions that, combined with in-class active learning, will produce additional gains.
Success of the flipped classroom hinges on its ability to motivate students to take on a substantial amount of out-of-class work independently and to contribute meaningfully to small-group discussions during class. The self-determination theory (SDT) of motivation (Deci & Ryan, 2000) is based on the tenet that all humans have three innate cognitive needs: autonomy, competence, and relatedness. Its application to flipped-class pedagogies by Abeysekera and Dawson (2015) lead to a theoretically supported expectation that judiciously designed flipped-class interventions will produce improved learning compared with traditional, lecture-based pedagogies. As stated by Abeysekera and Dawson (2015),
The flipped classroom approach is designed to utilise in-class time to encourage students to be active participants, hence, may be more likely to facilitate student needs for autonomy and competence. Furthermore, by being active participants, students are more likely to experience greater levels of relatedness between them and the instructor as well as between themselves. Therefore, given its ability to create learning environments that allow for the satisfaction of student needs for autonomy, competence, and relatedness, the flipped classroom approach is likely to facilitate and generate intrinsic motivation in students. (p. 10)
The purpose of the current study was to determine whether the encouraging results of our preliminary study could be reproduced by other instructors using the pilot-study videos to standardize content presentation and to allow time for in-class collaboration and quizzes. We hypothesized that a flipped classroom utilizing online videos that incorporate an appropriate level of remediation, with motivation provided by regular in-class quizzes, and in-class collaborative problem solving would improve learning as measured by final exam scores, compared with traditional, lecture-based instruction.
Method
Study Design and Procedures
This study employed a quasiexperimental self-controlled (with regard to teachers) design to test the effect of the flipped-classroom intervention on final exam score in MAT103. The intervention was the same as that of the pilot study. (See online Appendix 2.) In spring semester 2015 (control semester), instructors taught one or more sections of the course using the traditional lecture/homework pedagogy. The same instructors taught one or more sections using the flipped pedagogy in fall 2015. Seven instructors participated, collectively teaching 13 sections using each pedagogy. Teacher training workshops were conducted each semester to ensure compliance with study protocol and to standardize course content.
The full-day workshop prior to fall semester trained instructors to implement the practices and philosophy of the flipped pedagogy. It included instruction in best practices of teaching in a cooperative learning environment. Instructors were trained to use Blackboard, which provided student access to videos and text. Study materials distributed to instructors at the workshop included hard copies and editable digital copies of quizzes related to each video and problem sets developed from the pool of problems that had been used as homework in traditional sections. Instructors were told to give prompt feedback on quizzes and problem sets and to instruct students to self-pace and take thorough notes when watching the videos.
Preapproval to conduct this study was obtained from the BSC Institutional Review Board. Instructor names were removed from the registrar’s website prior to each semester to achieve blinding of students to instructors during registration. During the 1st week of each semester, instructors handed out consent forms, read the form with the students, and obtained signatures from those who agreed to participate.
During the control semester, instructors taught the course as they had done for several previous semesters, lecturing in class and assigning suggested problems as homework. Students had the option to purchase a new, used, or online version of the textbook, The Heart of Mathematics: An Invitation to Effective Thinking (HOM; Burger & Starbird, 2008). New and online versions came with access to the WileyPlus website with supplementary learning materials for students. Common topics were covered, and a list of homework problems was provided by the course coordinator and was commonly used by instructors. The MAT103 videos were not available to students during spring semester. Instructors had access to Wiley’s digital text and its integrated teaching and learning materials. It is unknown to what extent instructors or students availed themselves of these resources.
For the flipped semester, Wiley created a customized digital learning resource for students and instructors that integrated the videos with identical content covered from the HOM textbook in the control semester and in numerous previous semesters. Students accessed these materials via BSC’s Blackboard learning management system. Assistance with navigating the Wiley site was available to students during the first 2 weeks of class. Videos developed for the pilot study replaced lectures and were assigned as homework. Each video was approximately 20 min long and was enhanced with remedial material to address common computational and algebraic weaknesses of BSC students. (See example video “Listing the Rational Numbers” at https://www.youtube.com/watch?v=6Bm9Bo2TdXQ&t=397s.) At the beginning of the class following each video assignment, a short quiz was given. During class, instructors guided small groups in collaborative efforts to solve problem sets that were designed to foster higher-order thinking skills. The quiz and in-class problem set related to the sample video above are presented in online Appendices 8 and 9, respectively. Instructors provided feedback to their students by returning graded quizzes and graded group problem sets promptly.
A common final exam was given to all students each semester at times blocked for MAT103. The final was written by the PI and modified and approved by the instructors prior to the study. (See online Appendix 6.) Questions were free response, requiring knowledge of definitions, theorems, and concepts and the ability to apply them to solve new problems. Immediately following the exam each semester, the completed exams were photocopied and submitted to the PI in envelopes marked by section number. Original copies were given back to the instructors to grade as usual. Instructor-graded exams were not returned to students in either semester. The copied exams of consented students were separated and saved for independent grading at the end of the study. Before grading, the exams were deidentified and study IDs were generated.
Photocopied exams from both semesters were graded concurrently in the same room by a team of six graders: two advanced undergraduate math majors, two nonparticipating faculty, and two participating instructors. To standardize grading and enhance reliability, a grading rubric was developed (see online Appendix 7). Graders were instructed on how to use the rubric and were assigned a subset of problems to grade on all exams. A score of 5 was given only if “the answer was well organized, well written and correct.” A score of 0 was given only if there was “no work done on the problem.” Graders were blinded to student, teacher, and pedagogy.
Student and Faculty Participants
Of the students who enrolled in the 26 sections of the study, 91.1% and 92.7% of those in the control and flipped semesters, respectively, consented to participate in the study—a total of 632 students. Of these, 41% were White, 44% African American, 11% Hispanic, and 4% Other. Seventy-nine percent were receiving need-based financial aid. Sixty-two percent were female. Sixty-five percent were freshmen, and 22%, sophomores. The average math SAT score (519 students) was 440/800. More detailed descriptions of the sample of consented students are given in online Supplementary Tables S1 and S2. All students who take MAT103 do so to satisfy a general education requirement and have no other math requirements for their majors.
Six of the seven instructors who participated in this study were long-standing adjunct faculty. The other was a tenured professor of mathematics. Each had several semesters of previous experience teaching MAT103 from HOM under the study PI as course coordinator, using traditional pedagogy and giving common final exams like the one in the current study.
Statistical Analyses
Variables Studied
The outcome variable studied was final exam score (exam score). Intervention and control variables studied were pedagogy (flipped, traditional), instructor, and the following student variables: race-ethnicity (Black, Hispanic, Other, White), class (freshman, sophomore, junior, senior), financial aid (yes, no), gender (female, male), transfer (yes, no), math SAT, and grade point average (GPA). A detailed definition of exam score is given in online Appendix 4. Scores on the 12 items involved in the definition of exam score from 579 students who took the exam were analyzed to calculate the raw version of Cronbach’s alpha measure of reliability/internal consistency; Cronbach’s alpha = .78.
The results in online Supplementary Tables S1 and S2 show imbalance between pedagogies with respect to race-ethnicity, math SAT, class, and transfer. Notably, there were higher math SAT scores, a higher percentage of White students and of freshmen, and a lower percentage of transfer students in the traditional group. Thus, these variables are potential confounders of the pedagogy effect and were included in models as control variables. Financial aid was also included because of a special interest in potential socioeconomic variable interactions with pedagogy based on the results of Haak, Hille Ris Lambers, Pitre, and Freeman (2011). The pedagogy groups were essentially the same regarding gender and GPA. Therefore, these variables were not included in modeling analyses.
Samples Analyzed
Exam score was analyzed by estimating the parameters of linear mixed models from two samples of students: (a) the complete case sample, Sample 1 (i.e., all study participants with nonmissing exam score and nonmissing math SAT who were of known race-ethnicity, gender, class in school, transfer status, and financial aid status) and (b) the sample of all participating students with nonmissing exam score, Sample 2. These samples were chosen for reasons explained in online Appendix 4. We present results from analyses of Sample 1 (n = 480) and include results from Sample 2 (n = 579) in a follow-up analysis.
Assumptions About Missing Exam Scores
It should be noted that when there are no missing predictor-variable values, the validity of a linear mixed-model analysis depends only on an assumption that the outcome variable is missing at random (MAR). That is, conditional on predictor variables, missingness of the outcome is unrelated to the value of the outcome that was or would have been observed. As discussed in online Appendix 4, this assumption may not be valid among failing students, who may have been more likely to skip the final exam because they were failing, or among students who withdrew, who may have withdrawn after “seeing the handwriting on the wall.” The MAR assumption is reasonable among students who passed the course and those who received a grade of incomplete, 89.4% of students. Incomplete grades are given only for reasons unrelated to performance in the course, and the known and suspected causes of missing scores among those who passed the course (e.g., clerical errors when photocopying, instructor permission to take the exam late, other reasons necessitating a makeup exam) also were likely to be unrelated to unobserved score. Furthermore, not all the remaining 10.6% would have contributed to a violation of the MAR assumption. The potential violations, even among this small percentage of participants, however, must be mentioned as a potential biasing factor, although presumably limited.
Another potential concern is exam scores missing due to nonconsent. Given the very limited information available to assess whether nonconsent may have biased results, however, there is no evidence that this is an issue. (See online Appendix 4.)
Hypotheses Tested
Six hypotheses were tested. One was specified a priori based on the results of our pilot study, which showed a significant improvement in grades in flipped classes (see online Appendix 2):
Hypothesis 1: The flipped-classroom pedagogy produces higher final exam scores than traditional, lecture-based instruction.
Four additional hypotheses were specified with the intent to address questions that arise from the results of Weinstein (see Bidwell, 2014), Haak et al. (2011), and Eddy and Hogan (2014) concerning differential effects of similar pedagogies on lower-achieving students, on Equal Opportunity Program (EOP) students, and on Black students, respectively. These hypotheses, while justified by the results in these papers, were not specified a priori. Therefore, we tested them as secondary hypotheses. Weinstein reported evidence of greater benefits of a flipped pedagogy among weaker students (see Bidwell, 2014). In their study of an active learning intervention with important similarities to ours, Haak et al. observed a greater benefit of the intervention among EOP students. Eddy and Hogan more specifically identified Black students as the primary beneficiaries of an active learning intervention. These results demonstrate the need to disaggregate the Math SAT × Pedagogy, Race-Ethnicity × Pedagogy, and Financial Aid × Pedagogy interaction effects on performance, which led us to test the following hypotheses:
Hypothesis 2: The flipped-classroom pedagogy disproportionately benefits students with lower math SAT scores.
Hypothesis 3: The flipped-classroom pedagogy disproportionately benefits student populations that are overrepresented in low-socioeconomic-status (low-SES) groups.
Hypothesis 4: The flipped-classroom pedagogy benefits Black students more than White students.
Hypothesis 5: The flipped-classroom pedagogy benefits students on financial aid more than those who are not on financial aid.
A sixth hypothesis was tested in follow-up to the result for Hypothesis 4, an observed association of the flipped-classroom pedagogy with a significant reduction in the Black–White achievement gap when controlling for math SAT. The follow-up test of this additional hypothesis is exploratory in nature:
Hypothesis 6: The flipped-classroom pedagogy reduces the Black–White achievement gap unadjusted for potential mediators of differences in expected exam scores by race, such as financial aid, math SAT, and transfer status.
Testing this hypothesis allows an assessment of the impact of the flipped-classroom pedagogy on the total achievement gap (i.e., the gap due to all causes, including differences in economic status, preparedness for MAT103, and other factors associated with Black race).
Model Specifications
Four general linear mixed models were specified to test these hypotheses.
Model 1 was specified to test our primary hypothesis (Hypothesis 1), controlling for apparent confounding variables (race-ethnicity, class, transfer, financial aid, math SAT) and to estimate the effect of pedagogy over all race-ethnicity groups.
Model 2 is Model 1 with Pedagogy × Math SAT interaction added. This model was fit to test the secondary hypothesis that the flipped-classroom pedagogy disproportionately benefits lower-achieving students (Hypothesis 2).
Model 3 is Model 1 with Pedagogy × SES correlate interactions (i.e., Pedagogy × Race-Ethnicity and Pedagogy × Financial Aid) added. This model was fit to test Hypotheses 3, 4, and 5.
Model 4 is Model 3 excluding terms that involve factors that potentially mediate race-ethnicity effects on exam score (math SAT, transfer, financial aid, and Pedagogy × Financial Aid). We refer to Model 4 as the partially adjusted model (PAM). It was fitted to test for a significant reduction in Black–White performance gap unadjusted for the potential mediating factors (Hypothesis 6).
Explicit full-rank specifications of these four models are presented in online Appendix 4. In all of these models, random effects for instructor and Instructor × Pedagogy were specified. Random effects were assumed to be independently normally distributed. These specifications follow conventional practice in split plot–type models for analyzing data that arise from two-level nested sampling when first-level units (instructors) form blocks within which treatments (pedagogies) are applied and covariates (race-ethnicity, math SAT, etc.) are observed on second-level units (students).
The beta coefficients in each model are mean-function parameters to be estimated. (See online Appendix 4 for interpretations of these parameters.) Note that the coefficient on the Pedagogy × Black race variable of Model 3 (β81) is interpreted alternatively as ΔScoret – ΔScoref, where ΔScoret is the difference in expected exam scores between White and Black students in traditional sections and ΔScoref is the difference in flipped sections. This parameter, therefore, is the fully adjusted reduction in Black–White achievement gap associated with the flipped-classroom pedagogy. Similarly, this coefficient in Model 4 is interpreted as the partially adjusted reduction in Black–White achievement gap.
The six hypotheses tested are presented in terms of model parameters in online Appendix 4. We note that Hypothesis 6 can be restated as follows:
Hypothesis 6: Partially adjusted reduction in Black–White achievement gap > 0.
Model Fitting and Follow-Up Analyses
The details of model fitting, hypothesis testing, and follow-up analyses are presented in online Appendix 4. A summary is presented below.
The parameters of each model, including random-effects variance parameters, were estimated using the maximum likelihood estimation (MLE) method. Computations were performed using PROC MIXED of SAS software (SAS Institute, 2009). Models 1 through 3 were fitted to complete case data (Sample 1), and Model 4, which does not include math SAT, was fitted to Sample 2.
Throughout the remainder of this article, we will refer to model-based estimates of conditional population means and their differences, conditional on pedagogy and control variables in the model, as expected scores and expected differences, respectively. This distinguishes them from estimates of unconditional means and differences (a.k.a., marginal population means and their differences), which are estimated by raw sample means and differences.
To describe the overall pedagogy effect, we calculated expected exam scores and their difference by pedagogy from Model 1 results. This difference is the estimated coefficient on the pedagogy variable in Model 1 (β1). Hypothesis 1 was tested using the Wald test of H01: β1 = 0, the null form of this hypothesis. This test answers the primary question of our study: “Is the flipped-classroom pedagogy associated with improved performance in MAT103?”
Hypotheses 2 through 5 were tested using Wald tests with one exception. A likelihood ratio (LR) test of Hypothesis 3 was performed. Specifics are provided in online Appendix 4. These tests led to our primary focus on Model 3 and follow-up descriptions. Additional follow-up analyses were a Wald test of Hypothesis 6 based on Model 4 and follow-up descriptions of the result.
The follow-up description of the Pedagogy × Race-Ethnicity effect in Model 3 was obtained by calculating the expected exam score for each Pedagogy × Race-Ethnicity group from the estimated coefficients of Model 3, fixing math SAT at 430 and values of classification variables at levels associated with the largest subgroup of consented students. The largest subgroup was freshmen who had not transferred to BSC and were on financial aid, 60% of the complete case sample. Race-ethnicity-specific differences between flipped and traditional expected scores, given the associated fixed values of covariates, estimate the “effects” of flipping the classroom.
Follow-up analyses of the Pedagogy × Race-Ethnicity interaction in Model 4 were performed similarly. The estimated partially adjusted reduction in Black–White achievement gap was the estimate of β81 in Model 4.
For both adjusted (Model 3) and partially adjusted (Model 4) effects, Cohen’s d–type effect sizes (Cohen, 1969) were calculated as the expected difference score (Flipped – Traditional) divided by the square root of the total variance, where the total variance was estimated as the sum of variance component estimates for random effects in the model. The related common language effect sizes (CLES) of McGraw and Wong (1992) also were calculated. See online Appendix 4 for the proper interpretation of CLES and its relationship with Cohen’s d.
Results
There were 632 students who consented to participate in this study, 315 in traditional sections and 317 in flipped. This sample is described in online Supplementary Tables S1 and S2 of Appendix 5. Twenty students in traditional sections (6.3%) and 33 in flipped sections (10.4%) had missing final exam scores. The remaining 579 students with nonmissing exam scores (Sample 2) and the 480 of those with observations of all variables to be analyzed (Sample 1) are described in Tables 1 and 2. Additionally, significant discrepancies in preparedness between races were observed, e.g., raw math SAT means for Black, Hispanic, Other, and White students were 415 (n = 204; SEM = 4.59), 438 (n = 58; SEM = 8.27), 430 (n = 19; SEM = 26.75), and 470 (n = 199; SEM = 4.37), respectively, in Sample 1. Also, the reliability/internal consistency of exam score calculated from Sample 2 was 0.78.
Description of Study Sample Means and Standard Deviations of Continuous Variables by Pedagogy

Note. Differences between flipped and traditional raw mean scores were not statistically significant except for exam score (α = .05, two-tailed t test).
GPA = grade point average.
Description of Analyzed Samples: Means and Standard Deviations of Exam Score by Pedagogy and Levels of Each Categorical Control Variable

The results of fitting Models 1 through 4 are summarized in Table 3. Estimated parameters of these fitted models are presented with standard errors and indicators of significance of associated single-parameter Wald tests. The results of Type 3 (Wald) tests of factors, involving either single or multiple parameters, are also presented for each model in the column labeled p. The complete case analyses of Models 1, 2, and 3 allowed fair assessments of the associations of Pedagogy × Math SAT and Pedagogy × SES variable interactions with final exam score, respectively, by controlling for math SAT and other potential confounders. Model 4 analysis was a follow-up to further investigate the reduction in Black–White achievement gap when not controlling for math SAT, transfer, financial aid, and Pedagogy × Financial Aid.
Parameter Estimates (Est) and Standard Errors of Relevant Models a Fitted to Complete Case Data (N = 480) or to Nonmissing Test Score Data (N = 579)
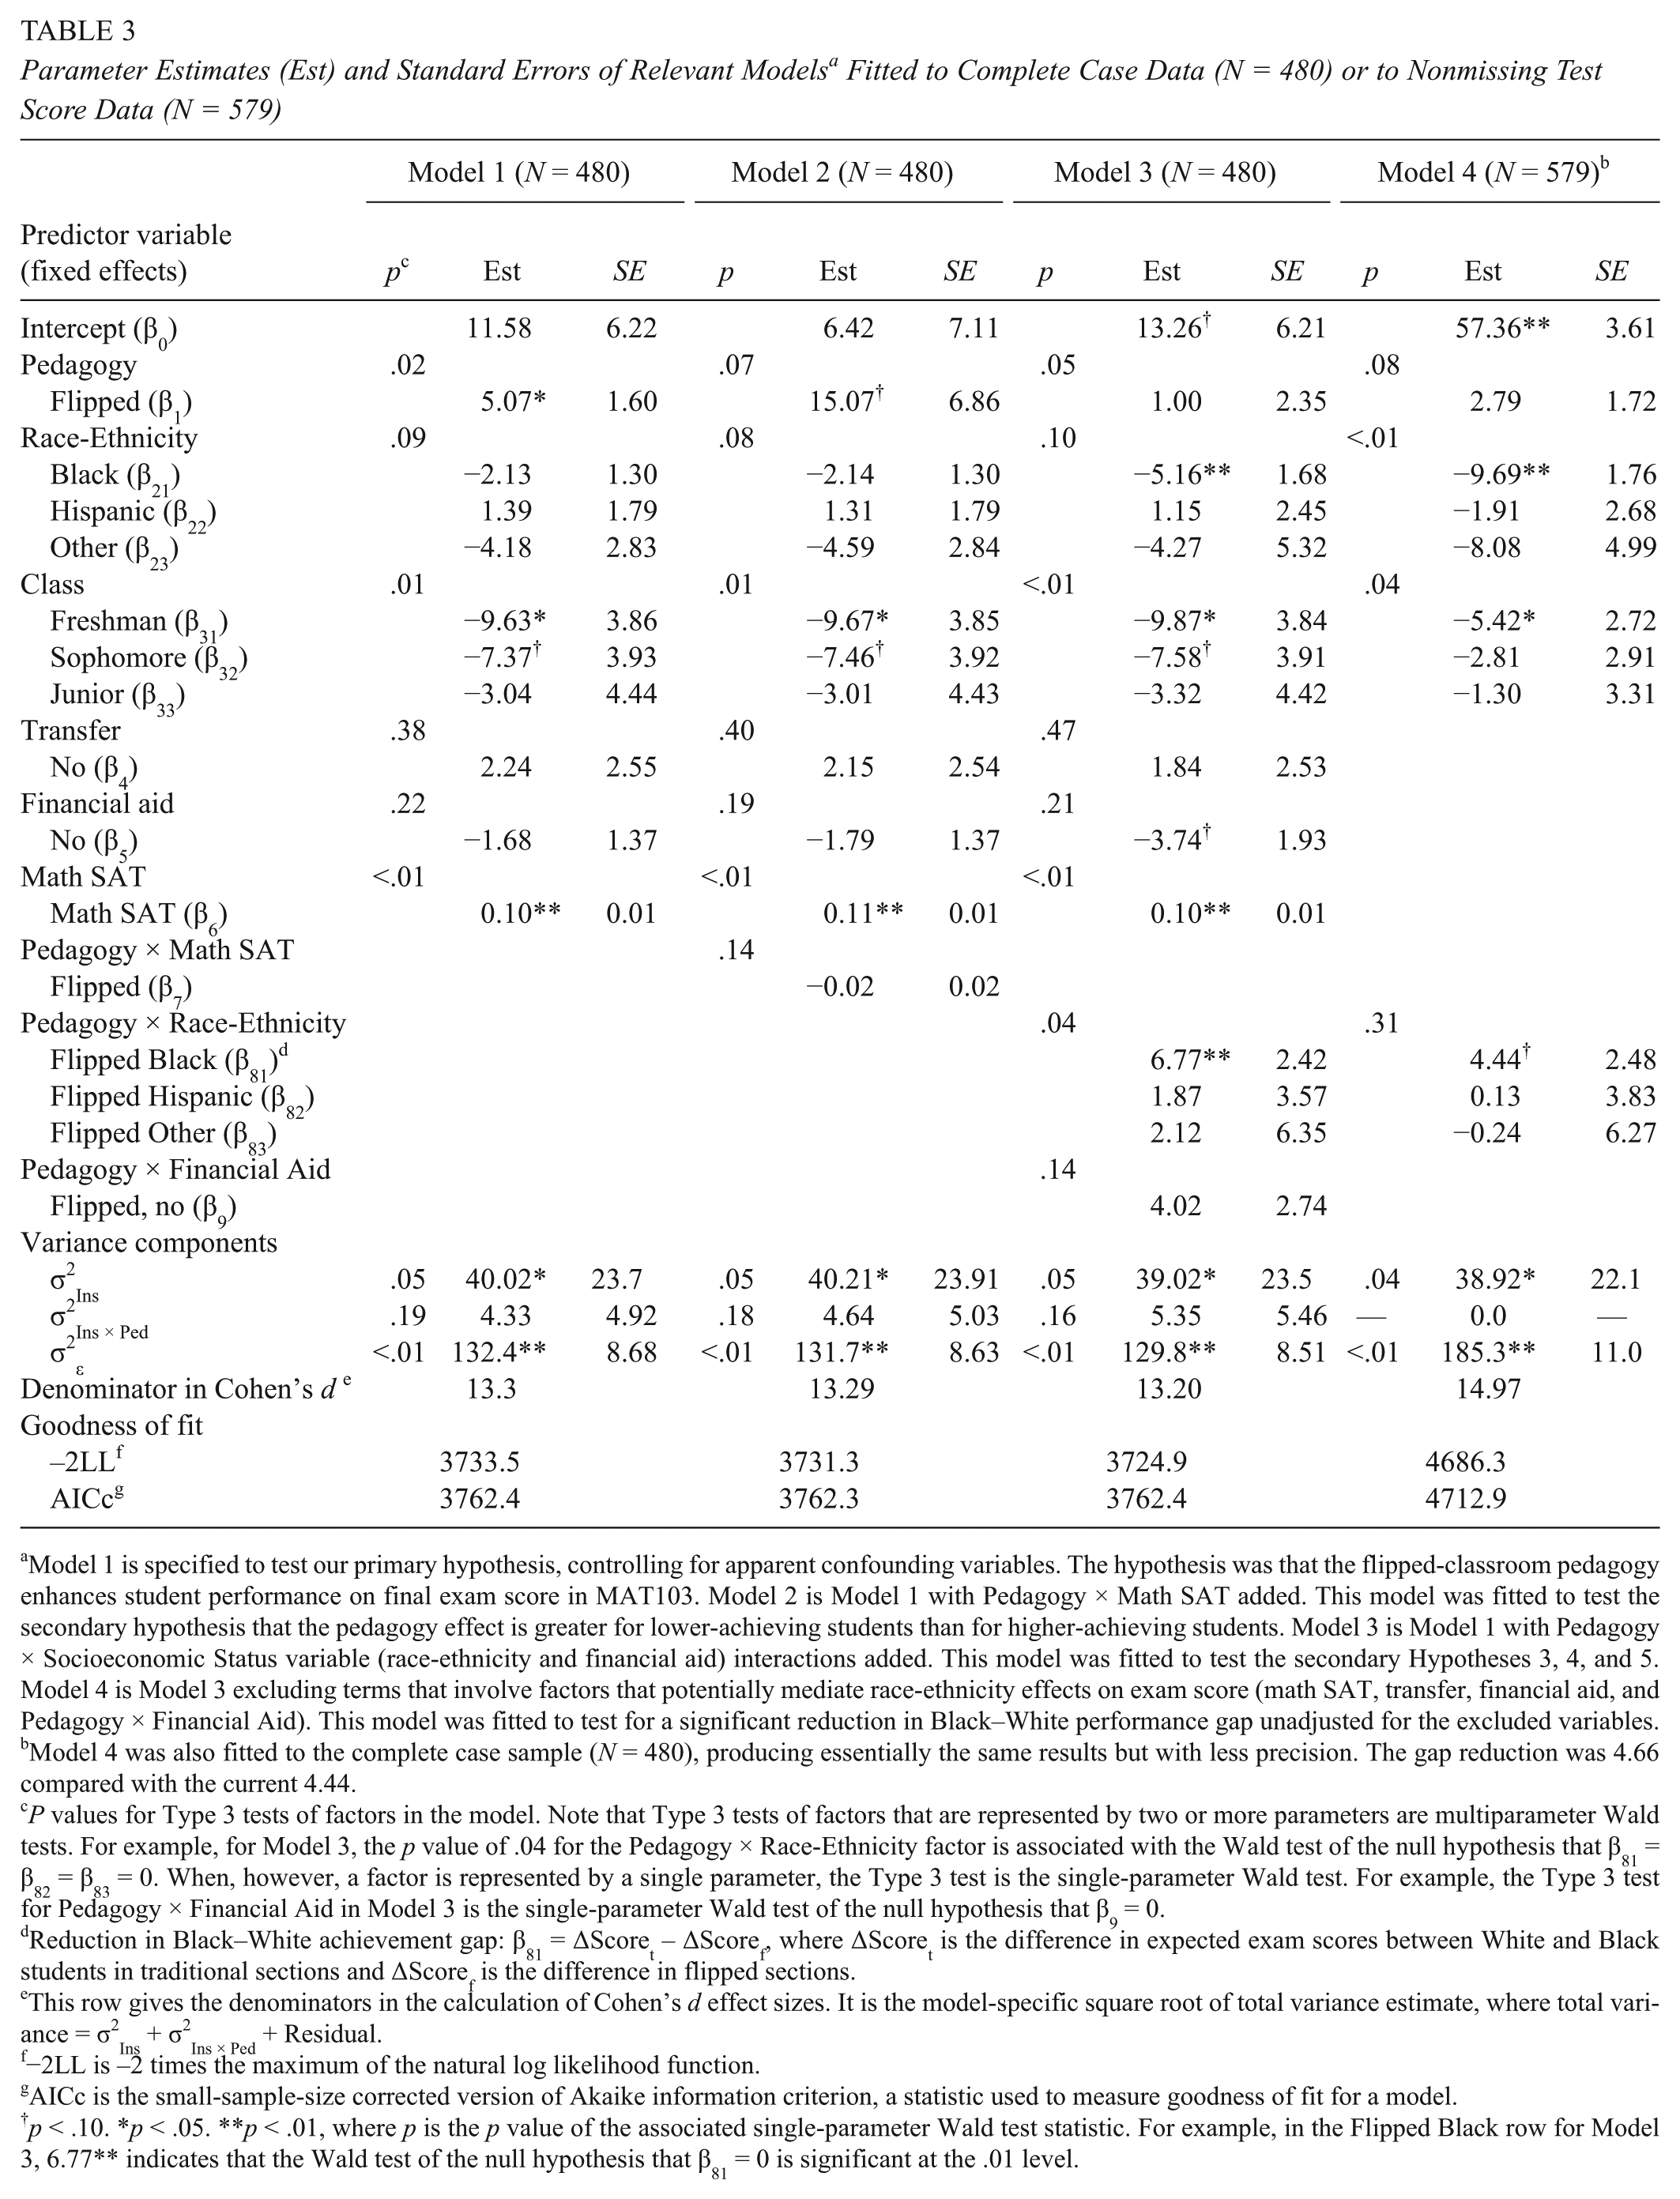
Model 1 is specified to test our primary hypothesis, controlling for apparent confounding variables. The hypothesis was that the flipped-classroom pedagogy enhances student performance on final exam score in MAT103. Model 2 is Model 1 with Pedagogy × Math SAT added. This model was fitted to test the secondary hypothesis that the pedagogy effect is greater for lower-achieving students than for higher-achieving students. Model 3 is Model 1 with Pedagogy × Socioeconomic Status variable (race-ethnicity and financial aid) interactions added. This model was fitted to test the secondary Hypotheses 3, 4, and 5. Model 4 is Model 3 excluding terms that involve factors that potentially mediate race-ethnicity effects on exam score (math SAT, transfer, financial aid, and Pedagogy × Financial Aid). This model was fitted to test for a significant reduction in Black–White performance gap unadjusted for the excluded variables.
Model 4 was also fitted to the complete case sample (N = 480), producing essentially the same results but with less precision. The gap reduction was 4.66 compared with the current 4.44.
P values for Type 3 tests of factors in the model. Note that Type 3 tests of factors that are represented by two or more parameters are multiparameter Wald tests. For example, for Model 3, the p value of .04 for the Pedagogy × Race-Ethnicity factor is associated with the Wald test of the null hypothesis that β81 = β82 = β83 = 0. When, however, a factor is represented by a single parameter, the Type 3 test is the single-parameter Wald test. For example, the Type 3 test for Pedagogy × Financial Aid in Model 3 is the single-parameter Wald test of the null hypothesis that β9 = 0.
Reduction in Black–White achievement gap: β81 = ΔScoret – ΔScoref, where ΔScoret is the difference in expected exam scores between White and Black students in traditional sections and ΔScoref is the difference in flipped sections.
This row gives the denominators in the calculation of Cohen’s d effect sizes. It is the model-specific square root of total variance estimate, where total variance = σ2Ins + σ2Ins × Ped + Residual.
−2LL is –2 times the maximum of the natural log likelihood function.
AICc is the small-sample-size corrected version of Akaike information criterion, a statistic used to measure goodness of fit for a model.
p < .10. *p < .05. **p < .01, where p is the p value of the associated single-parameter Wald test statistic. For example, in the Flipped Black row for Model 3, 6.77** indicates that the Wald test of the null hypothesis that β81 = 0 is significant at the .01 level.
There was significant evidence from the fit of Model 1 supporting our a priori hypothesis (Hypothesis 1) that the flipped-classroom pedagogy is associated with improved scores (p = .02). The Pedagogy × Math SAT effect in Model 2 was not significant (p = .14). Thus, we found no significant evidence for Hypothesis 2 and did not confirm Weinstein’s suggestion that the pedagogy helps weaker more than stronger students. The Pedagogy × SES-related interactions in Model 3 (i.e., Pedagogy × Race-Ethnicity and Pedagogy × Financial Aid) together were significant at the .10 level (p = .07), providing some support for Hypothesis 3. Furthermore, the Pedagogy × Race-Ethnicity interaction was significant (p = .04 in Model 3). More specifically, this interaction was due mostly to a Pedagogy × Black Race effect (p < .01 in Model 3), thus supporting Hypothesis 4, that the flipped-classroom pedagogy benefits Black students more than White students. Hypothesis 5, that students on financial aid benefited disproportionately from the flipped-classroom pedagogy, was not supported by Model 3 results when testing at the .10 level of significance (p = .14). Thus, the results of Model 3 support only Hypothesis 4, that the flipped-classroom pedagogy benefits Black students more than White students. The Pedagogy × Black Race effect in Model 4 was significant (one-tailed p < .05), in support of Hypothesis 6, that the flipped-classroom pedagogy was associated with a reduction in overall Black–White achievement gap. These results led to the decision to focus subsequently on follow-up analyses of Model 3 and 4 results.
Table 4 presents expected scores and their differences between pedagogies by Race-Ethnicity, calculated from Model 3 results, and these quantities over all races from Model 1. Table 5 presents expected scores and differences by Race-Ethnicity only, calculated from Model 4. The coefficients in Table 3 and differences in Tables 4 and 5 are commonly referred to as “effects” even though they may represent only associations and not causal effects. The Cohen’s d and CLES effect sizes are also presented in Tables 4 and 5 with denominators for the Cohen’s d calculation provided in Table 3.
Pedagogy Main Effect and Race-Specific Effects Calculated From Models 1 and 3, Respectively (N = 480)

Note. CLES = common language effect size (McGraw & Wong, 1992).
In the first line of the table, the expected difference (5.07) is the main effect of pedagogy from Model 1 (β1). Other expected differences are race-specific pedagogy effects from Model 3.
The CLES is interpreted as the probability that a randomly selected student from a flipped section scores higher than a randomly selected student with the same covariates from a traditional section taught by the same instructor. The relationship between Cohen’s d and CLES is given in online Appendix 4.
Expected scores were calculated for a typical student in this sample with a math SAT score of 430. A typical student was a freshman on financial aid and not a transfer student (60% of the analyzed sample).
Expected Scores a and Pedagogy Effects by Race Calculated From Model 4 (N = 579)

Note. CLES = common language effect size (McGraw & Wong, 1992).
Expected scores were calculated for a typical student in this sample (i.e., a freshman on financial aid and not a transfer student).
Although the expected scores were calculated for a typical student, the race-specific differences calculated from Model 4 are the same for all other subgroups.
The CLES is interpreted as the probability that a randomly selected student from a flipped section scores higher than a randomly selected student with the same covariates from a traditional section taught by the same instructor. The relationship between Cohen’s d and CLES is given in online Appendix 4.
We first give the follow-up results in Table 4. The effect of flipped-classroom pedagogy over all race-ethnicity groups was estimated to be 5.07 percentage points (p = .02). This means that a student in the flipped classroom is expected to score 5.07 percentage points higher than a second student with the same values of control variables who is taught in the traditional classroom by the same instructor. The corresponding Cohen’s d effect size was 0.38, which is a sizable effect size relative to empirical benchmarks in educational intervention studies (see Table 5 of Hill, Bloom, Black, & Lipsey, 2007).
The expected exam score differences between flipped and traditional classes were 7.77 for Blacks, 2.87 for Hispanics, 3.12 points for Others, and 1.00 for Whites (Table 4). Only the effect among Black students was significant (p < .01). The effect size for Blacks was 0.59. The difference between expected gain in scores for Blacks and Whites was calculated from Table 4 to be 6.77 (estimate of β81 in Model 3 of Table 3, p < .01). This reduction in achievement gap was greater than the expected difference between Black and White students in the traditional classroom, –5.16 (estimate of β21 in Model 3 of Table 3, p < .01). An illustration of the Black–White achievement gap closure associated with the flipped pedagogy is given in Figure 1.

Illustration of the Black–White achievement gap closure associated with the flipped pedagogy. This graph plots expected exam scores, by pedagogy and race, calculated from the fitted Model 3 in Table 3 with covariates set at class = freshman, transfer = no, financial aid = yes, and math SAT = 430.
In contrast, the partially adjusted pedagogy effects by race-ethnicity in Table 5 were 7.23 for Blacks (p < .01) and 2.79 for Whites (p = .11). The partially adjusted Black–White achievement differences were –9.69 (estimate of β21 in Model 4 of Table 3, p < .01) and –5.25 in traditional and flipped sections, respectively. This represents a 4.44-point reduction in achievement gap (estimate of β81 in Model 4 of Table 3, one-tailed p = .035), a 46% reduction.
Discussion
We emphasize that Models 1 through 3 controlled for varying math SAT scores between subpopulations. This is particularly important to keep in mind when interpreting the pedagogy, race-ethnicity and Pedagogy × Race-Ethnicity results discussed below.
Overall Pedagogy Effect
Despite challenges posed by the targeted population, we observed a statistically significant beneficial effect of flipping the classroom (5.07 points in Table 4), confirming Hypothesis 1. This effect is presented in terms of the change in student grade distribution that would ensue using the PI’s historical MAT103 grading scale in online Supplementary Table S3. The weighted averages of exam grade points calculated from these distributions were 2.14 and 2.47, corresponding to letter grades C and C+ on the exam for traditional and flipped classes, respectively (see online Appendix 4).
The estimated effect size over all race-ethnicity groups was 0.38 (Table 5). Freeman et al. (2014) reported a weighted average of effect sizes for exam scores and concept inventory scores of 0.47 from a meta-analysis of active learning studies in STEM courses. They associated this effect size with a 6-percentage-point increase in test scores and translated the effect to a 0.3-point increase in average final grade in the course. This closely matches our 5.07-percentage-point effect on exam score and its translation to final exam grade distribution and the associated difference in final exam grade point average of 0.33 (see online Appendix 4).
Differences in Pedagogical Effects by Race
The main effect result above was primarily due to a significant effect among Black students (7.77 points) compared with smaller and nonsignificant effects among White, Hispanic, or Other students (1.00, 2.87, and 3.12 points, respectively). This 7.77-point improvement among Black students would result in the shift in grade distribution presented in online Supplementary Table S4 of Appendix 5. The class GPA on the exam for Black students in traditional sections was 1.94, whereas that in the flipped sections was 2.47. This represents an improvement in class letter grade on the exam from C- to C+. (See online Appendix 4.)
The significant Black Race × Pedagogy interaction was found in both Models 3 and 4. These results are not inconsistent with those of Haak et al. (2011), who showed an increase in overall performance with a disproportionate benefit to students in the EOP in an introductory biology class when controlling for a combination of verbal SAT and GPA. Their high-structure intervention had similarities with our flipped-classroom pedagogy. In-class lectures were replaced by active learning exercises. At-home reading was assigned for content intake, and preclass quizzes were given over reading content. Students benefited significantly in both the EOP and non-EOP groups, but EOP students experienced disproportionate gains. An achievement gap was reduced by 45%. Because active learning affects higher-order more than lower-order cognitive skills (Cordray, Harris, & Klein, 2009; Haukoos & Penick, 1983; Martin, Rivale, & Diller, 2007), Haak et al. proposed that this reduction was due to a greater improvement among students with limited exposure to Bloom’s Level 3 or higher-order skills (Bloom, Krathwohl, & Masia, 1956).
The significant difference between pedagogical effects by race observed from our Model 3 and Model 4 analyses were described in the Results section in terms of the Black–White achievement gaps by pedagogy. A gap was not observed in flipped sections when controlling for math SAT and other factors in Model 3. Eddy and Hogan (2014), in a study of an intervention with 34.5% in-class active learning time, showed a statistically significant 50% reduction of the Black–White achievement gap in total exam score when controlling math and verbal SAT. The greater reduction of the gap in the current study may be because the percentage of class time devoted to active learning in our flipped course was roughly 75% compared with their 34.5%. Furthermore, Eddy and Hogan performed their study in large classes (393 students on average, per class), limiting opportunity for teacher–student interaction. In contrast, our classes were capped at 28 students, allowing extensive instructor input into small group discussions among three or four students.
Eddy and Hogan (2014) suggested that their Black–White performance gap reduction was associated with three factors, two of which are highly relevant to the current discussion: (a) a greater increase in class participation among Black students and (b) a larger benefit among Blacks from the intervention’s guidance in performing higher-order thinking skills. The former was supported empirically by the fact that Black students reported a greater difference in “speaking in class” between the active learning and comparison groups than did students of other races.
Our statements concerning the potential causes of our study results are speculative, as we had no follow-up data available to investigate causes of the difference between pedagogical effects on Black versus White students and the associated reduction in achievement gap. Related to Eddy and Hogan’s (2014) first explanation, we note that participation in flipped classes is unavoidable. Although participation is encouraged in the traditional classroom, most students are lacking in mathematical confidence and avoid being singled out by the instructor. Students in the flipped classes were all active participants, interacting directly with one another and with the instructor. It is possible that the collaborative learning format and increased interactions with teachers in the flipped class break down barriers related to a phenomenon known as stereotype threat (Steele, 1997; Steele & Aaronson, 1995). Steele (1997) argued that people in general avoid situations where they expect to be seen in terms of negative stereotypes. He suggested that Black students tend to “disidentify” with school to avoid dealing with such stereotypes. Since the Steele and Aronson (1995) article, there have been over 300 experimental studies of stereotype threat published (Nguyen & Ryan, 2008; Walton & Cohen, 2003), generally supporting the theory. Because of this phenomenon, Black students suffer from an extra layer of intimidation that may at least partially explain their generally lower test scores, even when equally prepared.
Another manifestation of the stereotype threat may be lack of confidence fueled by low expectations of some former teachers. Jencks and Phillips (2011) stated that “Blacks are more affected by teacher perception than Whites and are more represented among students of whom teachers expect less” (p. 342) and that “resources, such as small classes and teachers with high expectations, may help Blacks more than Whites” (p. 12). Given these extra inhibitors, performance among Black students may be less commensurate with inherent capacity than among White students with the same SAT score. Therefore, it is reasonable to expect a larger difference between actual performance and potential performance. This speculation is supported by Logel, Walton, Spencer, Peach, and Mark (2012), who concluded that latent ability is achieved when stereotype threat is eliminated. That is, given the same preparedness for college mathematics, there would be more gains to be achieved among Black students by an intervention that effectively ameliorates stereotype threat. Our results are consistent with this theory if the flipped-classroom pedagogy breaks down stereotype-related barriers. This is supported by Eddy and Hogan’s (2014) observation of a significant increase in “speaking in class” among Blacks in the active learning arm of their study that was not seen in other races and is a plausible explanation of our observed difference between pedagogical effects on Black versus White students. In short, it is possible is that the effect of the flipped classroom on Black but not White students occurs, at least partially, because the pedagogy makes room for collaborative/active learning during class, which may benefit Blacks more than Whites by breaking down stereotype-related barriers.
Concerning Eddy and Hogan’s (2014) second explanation of their results, the in-class problem sets developed for the flipped-classroom pedagogy in our study were designed to facilitate development of critical thinking skills. The at-home assignments presented a manageable cognitive load in the form of videos with integrated remediation and were accompanied by instructor guidance on note taking and self-pacing, which might have allowed students less experienced with higher-order thinking skills to catch up. The flipped-classroom pedagogy gave students time and resources needed to do so, which may have contributed to our observed pedagogy effects. (See online Appendix 9 for an example problem set and corresponding video.)
Study Limitations
Our study design does not control for potential differences in performance between fall and spring semester and therefore could be subject to semester-related bias. For example, there may be a “first semester effect,” whereby freshmen (72% of our flipped sample) perform worse in their first semester of college. To test for a semester effect, we analyzed historical final exam scores from classes taught by the PI in the traditional classroom setting (68 students in the spring semesters of 2011 and 2013 and 61 students in the fall semesters of these years). Final exams were identical within each year. Grading procedure was the same in all classes. An independent-sample t test showed no significant difference in raw mean exam scores between spring (M = 68.84) and fall (M = 66.62) semesters. Thus, semester effects were unlikely to have biased our results. Nevertheless, these results reflect only one instructor’s pattern. This issue is a limitation that would be resolved by a spring/spring or fall/fall design.
This study was originally designed to collect data on changes in student attitudes toward math during each semester, in addition to test scores. A precourse questionnaire was posted online in the spring semester. Unfortunately, instructors did not strongly emphasize to students the need to fill out the questionnaire, and student response rate was very poor, guaranteeing that change could not be assessed in a sufficient number of students to make continuation of this effort worthwhile. The plan to collect such data then was abandoned, thus limiting our ability to provide explanations for why the flipped classroom was successful beyond theoretically based conjecture. In light of the observed difference between pedagogical effects on Black and White student test scores and our speculation that it may be related to stereotype threat or perhaps differential prior development of higher forms of thinking, future studies should include collection of follow-up data to obtain evidence for or against each of these potential explanations.
All but one of the regular teachers of MAT103 agreed to participate. The research funding allowed a small extra stipend for doing so. Three instructors were excited to try the pedagogy, and possibly their eagerness could have produced a “novelty effect” that motivated students in their first experience with a flipped class. The other four instructors were willing to take on the extra work to support the effort but were wary of giving up their autonomy in the classroom. Instructors’ attitudes could have produced bias either toward or against the flipped-classroom pedagogy.
The generalizability of this study may be threatened by the fact that the study PI openly shared her previous successes with the flipped-classroom pedagogy with instructors prior to this study. Although instructors worked independent of the PI during the study, apart from the workshops, their performance may have been influenced by these prestudy communications. As course coordinator, the PI had long-standing close working relationships with the instructors. This may or may not have contributed to a possible novelty effect. It almost certainly did contribute to the instructors’ willingness to flip their classrooms for the study, however, as did availability of the study videos. It is unclear whether this willingness would extend to other instructors in other settings and calls to question the transferability of the flipped-classroom pedagogy to practice on a large scale.
Finally, institutional review board approval should have been pursued to use administrative and exam score data from nonconsenting students to better assess whether the consented sample is representative of the entire population of MAT103 enrollees.
Conclusions
The design and methodologic strengths of the current study produced results that provide a clearer answer to the question, “Does flipping the classroom enhance learning among students in introductory math courses for liberal arts majors?” and contribute toward resolution of uncertainties that exist due to mixed results of previous studies. The generalizability of our affirmative answer to this question awaits the accumulation of additional evidence from future research.
Flipping the classroom in environments like BSC has potential to produce better outcomes. Well-developed course videos may be an effective resource for learning and, when combined with collaborative learning strategies in the classroom and regular quizzes that provide necessary motivation, were associated with improved outcomes. The facilitating features of the pedagogy appear to allow students in flipped courses to achieve better results than can students in traditional courses.
Finally, the flipped-classroom pedagogy may have the potential to significantly reduce the gap in test scores between Black and White students. This speculation must be confirmed in future studies that hypothesize differential beneficial effects. We hope to see such studies investigate the possible association between this racial gap and perceived stereotype threat.
Footnotes
Acknowledgements
This research could not have been done without the participation of the seven instructors who taught the control and intervention sections of MAT103. Special thanks to these dedicated instructors: Kathleen Falconer, Gary Kelley, Rafael Mercado, Ray Missert, Leonard Neureuther, Suzanne Richbart, and Robin Sanders. We wish to gratefully acknowledge associate editor Dr. Andrew Ho and three anonymous reviewers who provided invaluable and insightful comments that led to significant improvements to the manuscript.
Funding
This work was supported by the Educational Advancement Foundation (Award No. 69812, 2015) and a Scholarship of Teaching and Learning Fellowship, Buffalo State College (205).
Authors
CHRISTINA L. CARTER graduated with an MS in mathematics from California State University at San Diego in 1972 and since that time has done graduate work and/or taught as full-time faculty at the University of Florida, University of Hiroshima, University at Buffalo, and Buffalo State College (2005 to 2017) and as a Fulbright Scholar (2016) at the University of Hyderabad in India. Her interests, recently centered on flipping the classroom, have always been focused on the challenges of teaching students to think abstractly and appreciate the beauty of mathematics. Ms Carter’s contact information remains as above, or
RANDOLPH L. CARTER received his PhD in statistics from Iowa State University in 1976 and subsequently served on the Faculty of Statistics at the University of Florida and Biostatistics at the University at Buffalo. His research interests include statistical methodology and applications and transdisciplinary work in maternal and child health and education, radiation effects, and neuroscience.
ALEXANDER H. FOSS recently earned his PhD in biostatistics at the University at Buffalo and is now a senior statistician at Sandia National Laboratories. His research interests include psychology, neuroscience, and statistical methodology.
References
Supplementary Material
Please find the following supplemental material available below.
For Open Access articles published under a Creative Commons License, all supplemental material carries the same license as the article it is associated with.
For non-Open Access articles published, all supplemental material carries a non-exclusive license, and permission requests for re-use of supplemental material or any part of supplemental material shall be sent directly to the copyright owner as specified in the copyright notice associated with the article.