
Abstract
In this study, we investigated the factor structure underlying the TAP System for Teacher and Student Advancement using confirmatory and exploratory factor–analytic methods and under conditions of multilevel (nested) data structures and ordinal measurement scales. We found evidence of generally poor fit with the system’s posited first-order, three-factor structure with relatively large correlations among measured dimensions. Exploratory analysis suggests one to two interpretable factors, one of which accounts for the majority of explained variance (i.e., a general or common underlying factor). Higher-order modeling confirms the presence of a bifactor structure composed of a single general trait supported by one or two subscales. We use this evidence to question the validity of the inferences drawn from TAP subscale scores. We accordingly discuss implications for low- and high-stakes applications of TAP output, especially when consequential decisions are attached to subscale-level estimates (i.e., teacher compensation based on latent performance as rated through weighted subscales).
Keywords
Over the past four decades, U.S. educational policy makers have enacted multiple legislative reform initiatives in support of student- and teacher-level accountability. This movement began during the minimum competency era in the 1970s (Bracey, 1995), and it picked up pace in 1983 after the release of A Nation at Risk (U.S. Department of Education, 1983). Although it appeared to reach its peak after the passage of No Child Left Behind (2002), subsequent federal legislative acts—such as Race to the Top (2011), the No Child Left Behind waivers awarded to states that adopted stronger teacher accountability systems (Duncan, 2009, 2011), and the Teacher Incentive Fund grant competition (U.S. Department of Education, 2012)—have helped to continue the push for stronger accountability in support of educational reform.
During this period, the evolution of policy-based school and teacher accountability reforms has involved two important transitions: first, the transformation of teacher observation systems from a personally reflective mentoring and capacity building activity to that of a metric-driven assessment process; second, the addition of and emphasis on growth in student academic performance (i.e., value-added or growth) as a core measure of instructional quality.
To date, a great deal has been consequently published on the various technical aspects of value-added models, student growth percentiles, and other measures of academic progress (Amrein-Beardsley, 2014; Au, 2010; Betebenner, 2011; Blank, 2010; Chetty, Friedman, & Rockoff, 2014a, 2014b; Hanushek, 2011; Hanushek & Raymond, 2005; McCaffrey, Lockwood, Koretz, & Hamilton, 2003). Notwithstanding, there remains much controversy over the appropriateness of these test-base metrics as valid representations of teachers’ instructional competencies and effects, especially when consequential decisions (e.g., teacher merit pay, tenure, termination) are to be attached to such measures (Baker et al., 2010; Berliner, 2005; Cohen & Goldberger, 2016; Darling-Hammond, Amrein-Beardsley, Haertel, & Rothstein, 2012; Papay, 2011).
In contrast, technical review of metric-based teacher observation systems has received far less scrutiny. Traditionally, school practitioners have enjoyed widespread use of observation-based evaluation systems to examine teachers’ instructional practice (Blank, 2010; Cohen & Goldberger, 2016; T. J. Kane, Kerr, & Pianta, 2014; Steinberg & Garrett, 2016). However, the intent has historically been formative, providing teachers with targeted feedback to improve pedagogical competency (Cohen & Goldberger, 2016; Danielson, 2010, 2011; Steinberg & Garrett, 2016). Not until recently has this focus evolved in response to the same high-stakes policy-based accountability reforms. Accordingly, these reforms substantively incentivized states to require the use of quantitative metrics based on standardized observational frameworks to evaluate teachers (U.S. Department of Education, 2015). Some of the most widely used frameworks include Charlotte Danielson’s framework for teaching (Danielson Group, n.d.), the Classroom Assessment Scoring System (Teachstone, n.d.), Robert Marzano’s (n.d.) causal teacher evaluation model, California’s Performance Assessment for California Teachers (n.d.), and, of interest in this study, the National Institute for Excellence in Teaching’s (NIET’s) TAP System for Teacher and Student Advancement (formerly known as the Teacher Advancement Program and hereafter referred to as the TAP System; see NIET, n.d.-a, n.d.-b, n.d.-c, n.d.-d, n.d.-e).
Notably, such measurement systems, especially when they are used for consequential decision-making purposes, require close examination of the psychometric properties that support their inferential warrant (American Educational Research Association [AERA], American Psychological Association, & National Council on Measurement in Education, 2014). While the application of growth and value-added models in evaluation frameworks continue to be rigorously vetted in the published literature (see also AERA, 2015; American Statistical Association, 2014; Baker et al., 2010; Harris & Herrington, 2015), observation-based evaluation systems have received much less attention (see, e.g., Amrein-Beardsley, Holloway-Libell, Montana Cirell, Hays, & Chapman, 2015; Goldring et al., 2015; Lash, Tran & Huang, 2016; Polikoff & Porter, 2014; Weisberg, Sexton, Mulhern, & Keeling, 2009).
Indeed, most published validation studies of teacher evaluation frameworks have focused on criterion approaches contrasting summated evaluator ratings with student achievement (e.g., value added or growth) outcomes (Cohen & Goldhaber, 2016; T. J. Kane et al., 2014; Kimball & Milanowski, 2009; Martínez, Schweig, & Goldschmidt, 2016; Milanowski, 2004, 2011; Milanowski & Kimball, 2005). Yet little attention has been paid to the observational measurement instruments themselves. By default, these types of criterion studies implicitly assume that the validity of the observation systems has been established.
For example, in a chapter titled “How the Framework for Teaching and Tripod 7 Cs Evidence Distinguish Key Components of Effective Teaching,” Danielson writes that her system (framework for teaching) is “research-based and [has] been refined over more than a decade based on analysis of prior results and feedback from elementary and secondary practitioners” (Ferguson & Danielson, 2014, p. 99). However, no reference is made to the technical and psychometric characteristics of the system that might serve as evidence of such a claim. Hence, just because it might be “research based” does not mean that its technical and psychometric properties are “research evidenced” or their system uses “research warranted.”
Accordingly, we argue that a similar analytic void exists for many, if not most, well-known instructional observation systems currently utilized within policy-prescribed consequential accountability systems (Bill & Melinda Gates Foundation, 2013; T. J. Kane & Staiger, 2012; National Council on Teacher Quality, 2015). We also suggest that use of such systems in high-stakes environments, without supporting scale validation evidence, conflicts with the measurement principles outlined in the Standards for Educational and Psychological Testing (AERA et al., 2014). This type of research evidence is needed to warrant the use of such systems, both in practice and as the basis of such accountability policies.
We also note that the existing literature base concerning observational rating systems fails to explicitly address substantive methodological and estimation issues characteristic of education-based K–12 observational rating data (Amrein-Beardsley et al., 2015; Cohen & Goldhaber, 2016; Lash et al., 2016). Specifically, in multischool agencies, evaluation data become hierarchically structured, with teachers nested into schools, grades, departments, and so on. When local administrators (i.e., principals and assistant principals) serve as primary evaluators, ratings become interdependent. The nested nature of these data present substantive issues for empirical analysis, affecting results and associated policy inferences (Heck & Thomas, 2015; Luke, 2004; Muthén, 1991, 1994; Raudenbush & Bryk, 2002).
Purpose of the Study
For these reasons, we focus on examining the factor structure posited by one of the most widely used observational evaluation frameworks: NIET’s TAP System (see http://www.niet.org; see also, Barnett, Rinthapol, & Hudgens, 2014). Specifically, we investigate whether the TAP System’s factor structure is supported by empirical measures of teacher instructional practice, as oft utilized in consequential evaluation settings. Importantly, a search of the literature reveals a dearth of published research regarding this system’s measurement attributes. This is worrisome given the extent to which actions are often attached to TAP outcomes, especially subscale-level estimates (i.e., teacher compensation based on performance rated with weighted subscale scores; see NIET, n.d.-d).
However, in our analysis, we do not attempt to reinterpret, redefine, or reformulate the TAP System’s structural framework. Rather, we examine the degree to which the current framework is found tenable under an applied empirical context. To our knowledge, this type of foundational analysis has yet to be published internally (e.g., available technical reports) or externally (e.g., peer-reviewed literature). Thus, we believe that this study serves as a critical starting point from which to document some of the technical characteristics of this system and to provide an empirical foundation from which to further examine, modify, or improve the framework as a consequential teacher assessment tool.
Accordingly, we examine whether the TAP’s posited latent factor structure is supported by empirical evidence. We focus on the discriminant validity of the system’s subconstructs and the implications that our findings have on the application of the TAP metrics within consequence-based evaluation policies and practices.
TAP System
The Milken Family Foundation developed the TAP System to provide states, districts, and schools “a comprehensive educator effectiveness model” for teacher evaluation purposes (NIET, n.d.-b). The system has two primary purposes: as a summative measure of teacher performance and as a formative tool to help improve teachers’ skills through individualized and concentrated professional support (Barnett et al., 2014; Culbertson, 2012; Daly & Kim, 2010). Specifically, the TAP System is intended to provide benchmark and progress measures necessary for teachers to adapt and improve their instructional practice. In addition, yearly improvements in performance are to be aligned with monetary bonuses. Users (e.g., school districts) determine these bonuses based on a weighted combination of teachers’ value-added (student growth) measures and classroom observation scores derived from the weighted subscales built into the TAP System (see NIET, n.d.-d).
NIET is the nonprofit organization that oversees and promotes the TAP System, upholding it as a comprehensive model that provides “powerful opportunities for career advancement, professional growth, instructionally focused accountability and competitive compensation for educators” (NIET, n.d.-b). This is facilitated by providing “district and school leadership teams with real-time data to inform decisions,” as well as a set of accompanying “best practices” (NIET, n.d.-a). Likewise, the NIET organization states that its initiatives are “impacting over 200,000 educators and 2.5 million students,” with “over 90 percent of participating TAP schools [serving] high-need and diverse areas,” most notably in Arizona, Arkansas, Indiana, Iowa, Louisiana, Minnesota, Tennessee, and Texas (NIET, n.d.-c). In addition, teacher education programs are increasingly adopting TAP for similar reform purposes (e.g., evaluating student teachers and holding them accountable; see, e.g., Strauss, 2015; Toth, 2015).
However, most published research on the TAP System has focused on whether TAP use increases student achievement (Glazerman & Seifullah, 2012; Mann, Leutscher, & Reardon, 2013; Springer, Ballou, & Peng, 2014), to what extent TAP scores correlate with growth or value-added measures of student achievement (Loeb & Candelaria, 2012; Sartain, Stoelinga, & Brown, 2011), and whether TAP use improves teachers’ instructional quality (Armstrong, 2011; Eckert, 2010; Jerald & Van Hook, 2011; Mann et al., 2013). These studies report mixed results regarding TAP’s impact on academic outcomes, TAP’s low to moderate correlations with growth or value-added measures, and TAP’s impact on professional practice within the context of additional professional development and training. Again, these literatures are lacking substantive examinations of the underlying psychometric characteristics of the TAP framework, including verification of the posited latent constructs used to evaluate teacher instructional competency in consequential ways.
Instrument Specifics
In terms of the actual instrument, the TAP rubric is composed of 19 performance indicators situated within three subscales (performance indicators per subscale are noted in parentheses): Instruction (n = 12 indicators), Designing and Planning Instruction (n = 3 indicators), and the Learning Environment (n = 4 indicators). A breakdown of the performance components aligned within each subscale is provided in Table 1.
TAP System Subscales and Components

During the school year, teachers are evaluated by certified evaluators on at least three occasions. Certified evaluators include mentor teachers, master teachers, and school administrators, each of which is local to the teacher’s campus. All evaluators are precertified under the TAP protocols based on their rating consistency as compared with national scoring standards. TAP evaluators receive training in application and interpretation of the scoring rubrics with certification based on one’s ability to score videotaped anchor lessons “within one point on each indicator and within no more than two points from the national rating on three indicators” (Daly & Kim, 2010, p. 12). TAP certification lasts 1 year, after which an observer must demonstrate interrater consistency per TAP’s certification standards to be recertified.
The three classroom observations are independent and occur at different times throughout the school year by different evaluators; hence, multiple rater scores for any single classroom observation are not available (see also McCaffrey, Yuan, Savitsky, Lockwood, & Edelen, 2015). Following each observation/evaluation, a postconference session is convened between the teacher and the observer to review each teacher’s evaluation scores and to identify and discuss instructional strengths and weaknesses. The intent is for teachers to use this information to focus on and improve specific attributes of their professional practice. This process also aligns with the TAP System’s intent to provide formative and informative feedback to increase instructional capacity.
Under the TAP System, some observations are unannounced, while others are scheduled to provide teachers with opportunities to demonstrate proficiency on the assessed performance indicators. During an observation session, rating scores are assigned to each of the 19 TAP performance indicators (see Table 1). For each performance indicator, observers rate teachers on a scale of 1 to 5 (ordinal), with 1 representing unsatisfactory performance, 3 proficiency, and 5 exemplary. In their TAP qualification training, observers are instructed to use ratings of 5 only for teachers who demonstrate “true excellence above and beyond what is expected of a proficient teacher on a certain standard” (Daly & Kim, 2010, p. 11).
At the close of the school year, a teacher’s final (i.e., summative) observation score is constructed as a weighted composite of ratings from a mentor teacher, master teacher, and school administrator (see NIET, n.d.-d). Finally, the weighted average observation scores are combined with student academic (i.e., value added or growth) performance measures to derive an overall performance rating for each teacher.
Importantly, the computational methods for aggregating and combining classroom observation scores with student academic growth measures are policy-derived decisions developed by the NIET to compute global performance metrics of instructional quality. Again, these policy-based computations assume that the underlying observational metrics are sound and align with the posited measurement framework.
Methods
In this regard, we focus our study on examining the foundational latent structure of the TAP System’s observational instrument. To do so, we utilize a single set of unweighted observational ratings to anchor the analysis to our primary research question: to investigate whether the TAP System’s posited factor structure is supported by empirical evidence. Specifically, we focus on examining the factor structure of the second set of unweighted midyear classroom observation scores and its coherence with the stated TAP System framework. The rational for this decision is that assessing structural characteristics based on weighted composite ratings inserts unnecessary policy-imposed noise into the information; that is, this study is not intended as an analysis of the policy environment but, rather, the measurement instrument’s psychometric and technical properties.
In addition, the longitudinal progression of the observation schedules suggests that the first formative evaluation scores (early in the school year) may reflect construct-irrelevant variance due to teachers’ relative lack of familiarity with the evaluation’s component framework and process. 1 This becomes less problematic after the first postconference review, in which all participating teachers have become familiar with the system’s process, procedures, and goals. Similarly, the third summative observation ratings (end of the school year) may reflect less variance due to sustained focus on improving component performance from prior evaluation results. Thus, in our opinion, the second observational rating provided the best opportunity to assess the foundational characteristics of the latent factor structure of the posited TAP framework by reducing exposure, training, and policy artifacts.
Study Sample
For this study, we examined teacher observation data collected from a set of 14 school districts in one state. These districts represented a total of 54 schools, including 39 elementary schools (72%), nine middle schools (17%), and six high schools (11%) enrolling a combined 34,055 K–12 students (>3% of the state’s total K–12 school enrollment).
TAP observational rating information were available for 1,497 classroom teachers. Almost three quarters (72%) of the teachers were elementary school teachers (n = 1,078), while the remaining 21% were middle school teachers (n = 314) and 7% high school teachers (n = 105). At the time of data collection, 43 schools (80%) had implemented the TAP System for 1 year.
The racial/ethnic makeup of the student population taught by TAP teachers in the sample (approximately) was 18% White, 55% Hispanic, and 27% other, as compared with 42%, 43%, and 15%, respectively, at the state level. We conducted a chi-square test of independence comparing the racial/ethnic compositions of the sample versus the state overall. Results were significant (p < .05; χ2 = 8,866.433, df = 2, p < .001), albeit with a small effects size (V = .89; Cohen, 1988). This is likely due to the NIET’s focus on serving teachers and students from lower-income communities/schools.
Related, because school participation in the TAP System was voluntary, as based on a majority vote of the school’s instructional staff, it should be noted that schools included in this sample likely differ from those not participating in the TAP System. Hence, the sample in this study does not necessarily represent other schools within the district or across the state. This also implies that participants are generally accepting and engaged in the TAP System’s evaluation processes and procedures.
Procedures
To investigate whether the TAP System’s posited factor structure is supported by empirical evidence, we first applied confirmatory factor analysis (CFA) to evaluate the tenability of the proposition. We followed this with an exploratory factor analysis (EFA) to more explicitly examine attributes of the latent structures inherent in the empirical data. Given the findings, we estimated higher-order CFA models incorporating a general (i.e., common) factor dimension. Each approach provides useful information for understanding the alignment between the hypothesized TAP framework and attributes of the measures from which inferential judgments are derived. We estimated all models using Mplus 7.4 with Multilevel Add-On (released November 2015).
As mentioned, the original data set included evaluation scores for a total of 1,497 teachers distributed among 14 school districts and 54 elementary, middle, and high school campuses. However, the fidelity to the TAP evaluation protocol requires that every teacher be evaluated at least three times per year by a campus-assigned mentor teacher, master teacher, and school administrator. Information for a total of 1,313 teachers satisfied this observational criterion. In addition, estimating two-level factor-analytic models requires a grouping (cluster) variable. Review of the sample data revealed that 232 teacher records contained no school building identification or registered incorrect identification numbers necessary to match against position assignments. This reduced the usable record count to 1,081 teachers (72% of the original data set). Finally, TAP program participation is determined on a site-by-site basis, not at the district level. In each case, the majority of teachers must agree to participate. For this reason, we initially modeled the multilevel structure as teachers nested within schools.
Because the observation rating information nests teachers within schools, we estimated multilevel CFA models to account for the lack of error independence (Bryne, 2012; Heck & Thomas, 2015; Muthén, 1991, 1994; Raudenbush & Bryk, 2002). We recognized that estimating single-level models in the presence of nested data may generate underestimated variances and standard errors and lead to improper inferences based on biased parameter estimates and associated test statistics. To control for this, we used multilevel approaches to partition total variance into components at the individual level (within school) and the group level (between school). Doing so permits modeling group-level latent structures independent of the individual level to obtain unbiased estimates. Accordingly, we used a two-level modeling approach specifying teachers nested within schools. We identified a total of 38 school locations (clusters) with an average cluster size of 28.50 teachers per campus (SD = 7.56; min = 12, max = 41).
In addition to the nested nature of the data set, we recognized that the observation ratings recorded under the TAP System were based on a five-option (ordinal) Likert-type scale. This lack of a continuous measurement scale poses substantive estimation issues in latent variable modeling (Brown, 2015; Byrne, 2012; Heck & Thomas, 2015; Muthén & Muthén, 2008–2012), including attenuated indicator correlations, possible emergence of “pseudofactors,” and biased standard errors (Brown, 2015). Thus, ignoring the existence of noncontinuous measures may lead to incorrect inferences based on model output. To mediate the impact of ordinal measures, we invoked the Mplus WLSMV estimator (weighted least squares with mean- and variance-adjusted chi-square test) for all factor-analytic models (Muthén & Muthén, 2008-2012). Here, Brown (2015) noted that “WLSMV procedures produce accurate test statistics, parameter estimates, and standard errors of CFA models under a variety of conditions,” including conditions of “non-normality and model complexity” (p. 355).
Table 2 provides summary distribution statistics for the TAP evaluation components. The information is organized by the three TAP behavioral domains and their measured components: Designing and Planning Instruction (D1–D3), Learning Environment (L1–L4), and Instruction (I1–I12).
TAP System Evaluation Components Descriptive Statistics

Note. For all components, valid N = 1,311; missing values = 0, minimum = 1, maximum = 5.
As shown, the data contain no missing values, and all variables represent the full range of possible values (1 to 5). Skew and kurtosis statistics suggest generally well-behaved “close-normal” variability. The median for all measured variables is 3, while the means range from 2.86 (I11–Thinking and I12–Problem Solving) to 3.67 (L3–Environment and L4–Respectful Culture). While the five-item Likert-type scale displays relatively normal distributions, we decided to conservatively treat the measured data as categorical for model estimation, especially since Mplus provides a robust estimator (WLSMV) sensitive to distributional assumptions. The TAP-component polychoric correlation matrix generated by Mplus is provided in Table 3. By default, Mplus computes polychoric correlations when ordered categorical data and WLSMV estimators are declared (Muthén & Muthén, 2008–2012).
TAP System Sample Data Component Polychoric Correlation Matrix (Mplus)

Note. See Table 1 for indicator codes.
The mean intercomponent correlation of the sample data is .612, ranging between a minimum of .476 to a maximum of .861. In addition, scale (Cronbach alpha) reliability indices report α = .960 for all 19 TAP items, α = .848 for Designing and Planning Instruction (D1–D3), α = .896 for Learning Environment (L1–L4), and α = .938 for Instruction (I1–I12). No items were flagged for removal based on potential negative impacts to scale reliabilities.
Acknowledging the nested nature of the data set, we computed intraclass correlation coefficients (ICCs) using Mplus 7.4 to assess the degree of variability in the measures attributable to the clustering of teachers within schools (i.e., variability in the teacher ratings explained by school assignment). In general, ICC values in excess of .05 (or 5%) warrant application of multilevel modeling methods (Brown, 2015; Byrne, 2012). For the sample data, we found the mean ICC to be above this threshold (M = .122; min = .066, max = .273). Indeed, 12 of the 19 indicators (63%) report ICC values >.10, suggesting that multilevel modeling approaches be utilized to obtain unbiased parameter estimates and model fit statistics.
For each of the CFA models, we relied on the following model fit statistics to guide our analysis: chi-square (χ2), comparative fit index (CFI), Tucker-Lewis index (TLI), root mean square error of approximation (RMSEA), and standardized root mean square residual (SRMR; Brown, 2015; Bryne, 2012, Heck & Thomas, 2015; McCaffery et al., 2015). 2 We adopted general fit criterion thresholds as follows: chi-square, p < .05; CFI/TLI ≥ .95; SRMR ≤ .08; RMSEA ≤ .06 (Hu & Bentler, 1999). We directed Mplus to report modification indices (MIs) >3.84 to assist in identifying areas of problematic fit (Brown, 2015).
When generating EFA models, we again recognized the categorical nature of the measured variables (allowing Mplus to invoke the WLSMV estimator) and the nested structure of the data set. For the latter attribute, we estimated two-level EFA models specifying ordered extraction of one to four latent factors at the within-school level (individual) while leaving the between-school level (group) unrestricted. For all EFA rotations, we utilized the Oblimin (oblique) procedure. We based our warranted factor extractions for the EFA models on review of scree plots, Kaiser criterion (eigenvalues >1.00), size of rotated factor loadings, and factor interpretability. As an extraction procedure, parallel analysis was not available in Mplus for categorically measured variables with the WLSMV estimator. In addition, this option is not available as an extraction method for two-level EFA models. For these reasons, we conducted a parallel analysis based on a single-level EFA model applying an maximum likelihood (ML) estimator.
Based on results obtained from the EFA analysis, inclusion and examination of a primary common factor seemed warranted. In this regard, we reformulated four additional CFA models to evaluate the appropriateness of second-order and bifactor solutions, including a single common-factor model.
Results
Confirmatory Factor Analysis
As discussed, the posited factor structure of the TAP observational framework identifies three subscales (see Table 1). It is assumed that these three domains covary to some degree. However, it is also presumed that each construct independently measures unique attributes of instructional practice sufficient to permit inferential analysis of the subscales and the aligned indicators. That is, the intent of the evaluation framework is to compare component and subscale scores for the purpose of identifying areas of instructional strength/weakness, to direct targeted interventions, to promote improvement in professional practice, and to assign weights for merit pay purposes. To do so requires that correlations among latent factors remain relatively low and display substantive and statistically significant component loadings that are interpretable.
To evaluate the tenability of the posited TAP factor structure, we performed three initial CFA analyses. Each specified a correlated three-factor model with no cross loadings between measured variables. We estimated CFA 1 as a standard single-level model (nonnested). We estimated CFA 2 using the Mplus TYPE = COMPLEX procedure, which adjusts model fit statistics and parameter estimates for error dependencies due to the nested structure of the data (Brown, 2015). Here, CLUSTER = SCHOOL identified the grouping level. We estimated CFA 3 by explicitly modeling identical within-school (individual) and between-school (group) three-factor frameworks. We used the Mplus TYPE = TWOLEVEL procedure for this model. For all models, we used a WLSMV estimator. To establish the latent measurement scales for CFA 1 and 2, each factor’s first measured indicator served as a marker variable—the default setting in Mplus. For CFA 3, we established scaling by fixing the variances of each latent factor to 1 while leaving all variable loadings unrestricted. 3 Table 4 reports the fit statistics for each estimated CFA model.
CFA/EFA Model Fit Statistics
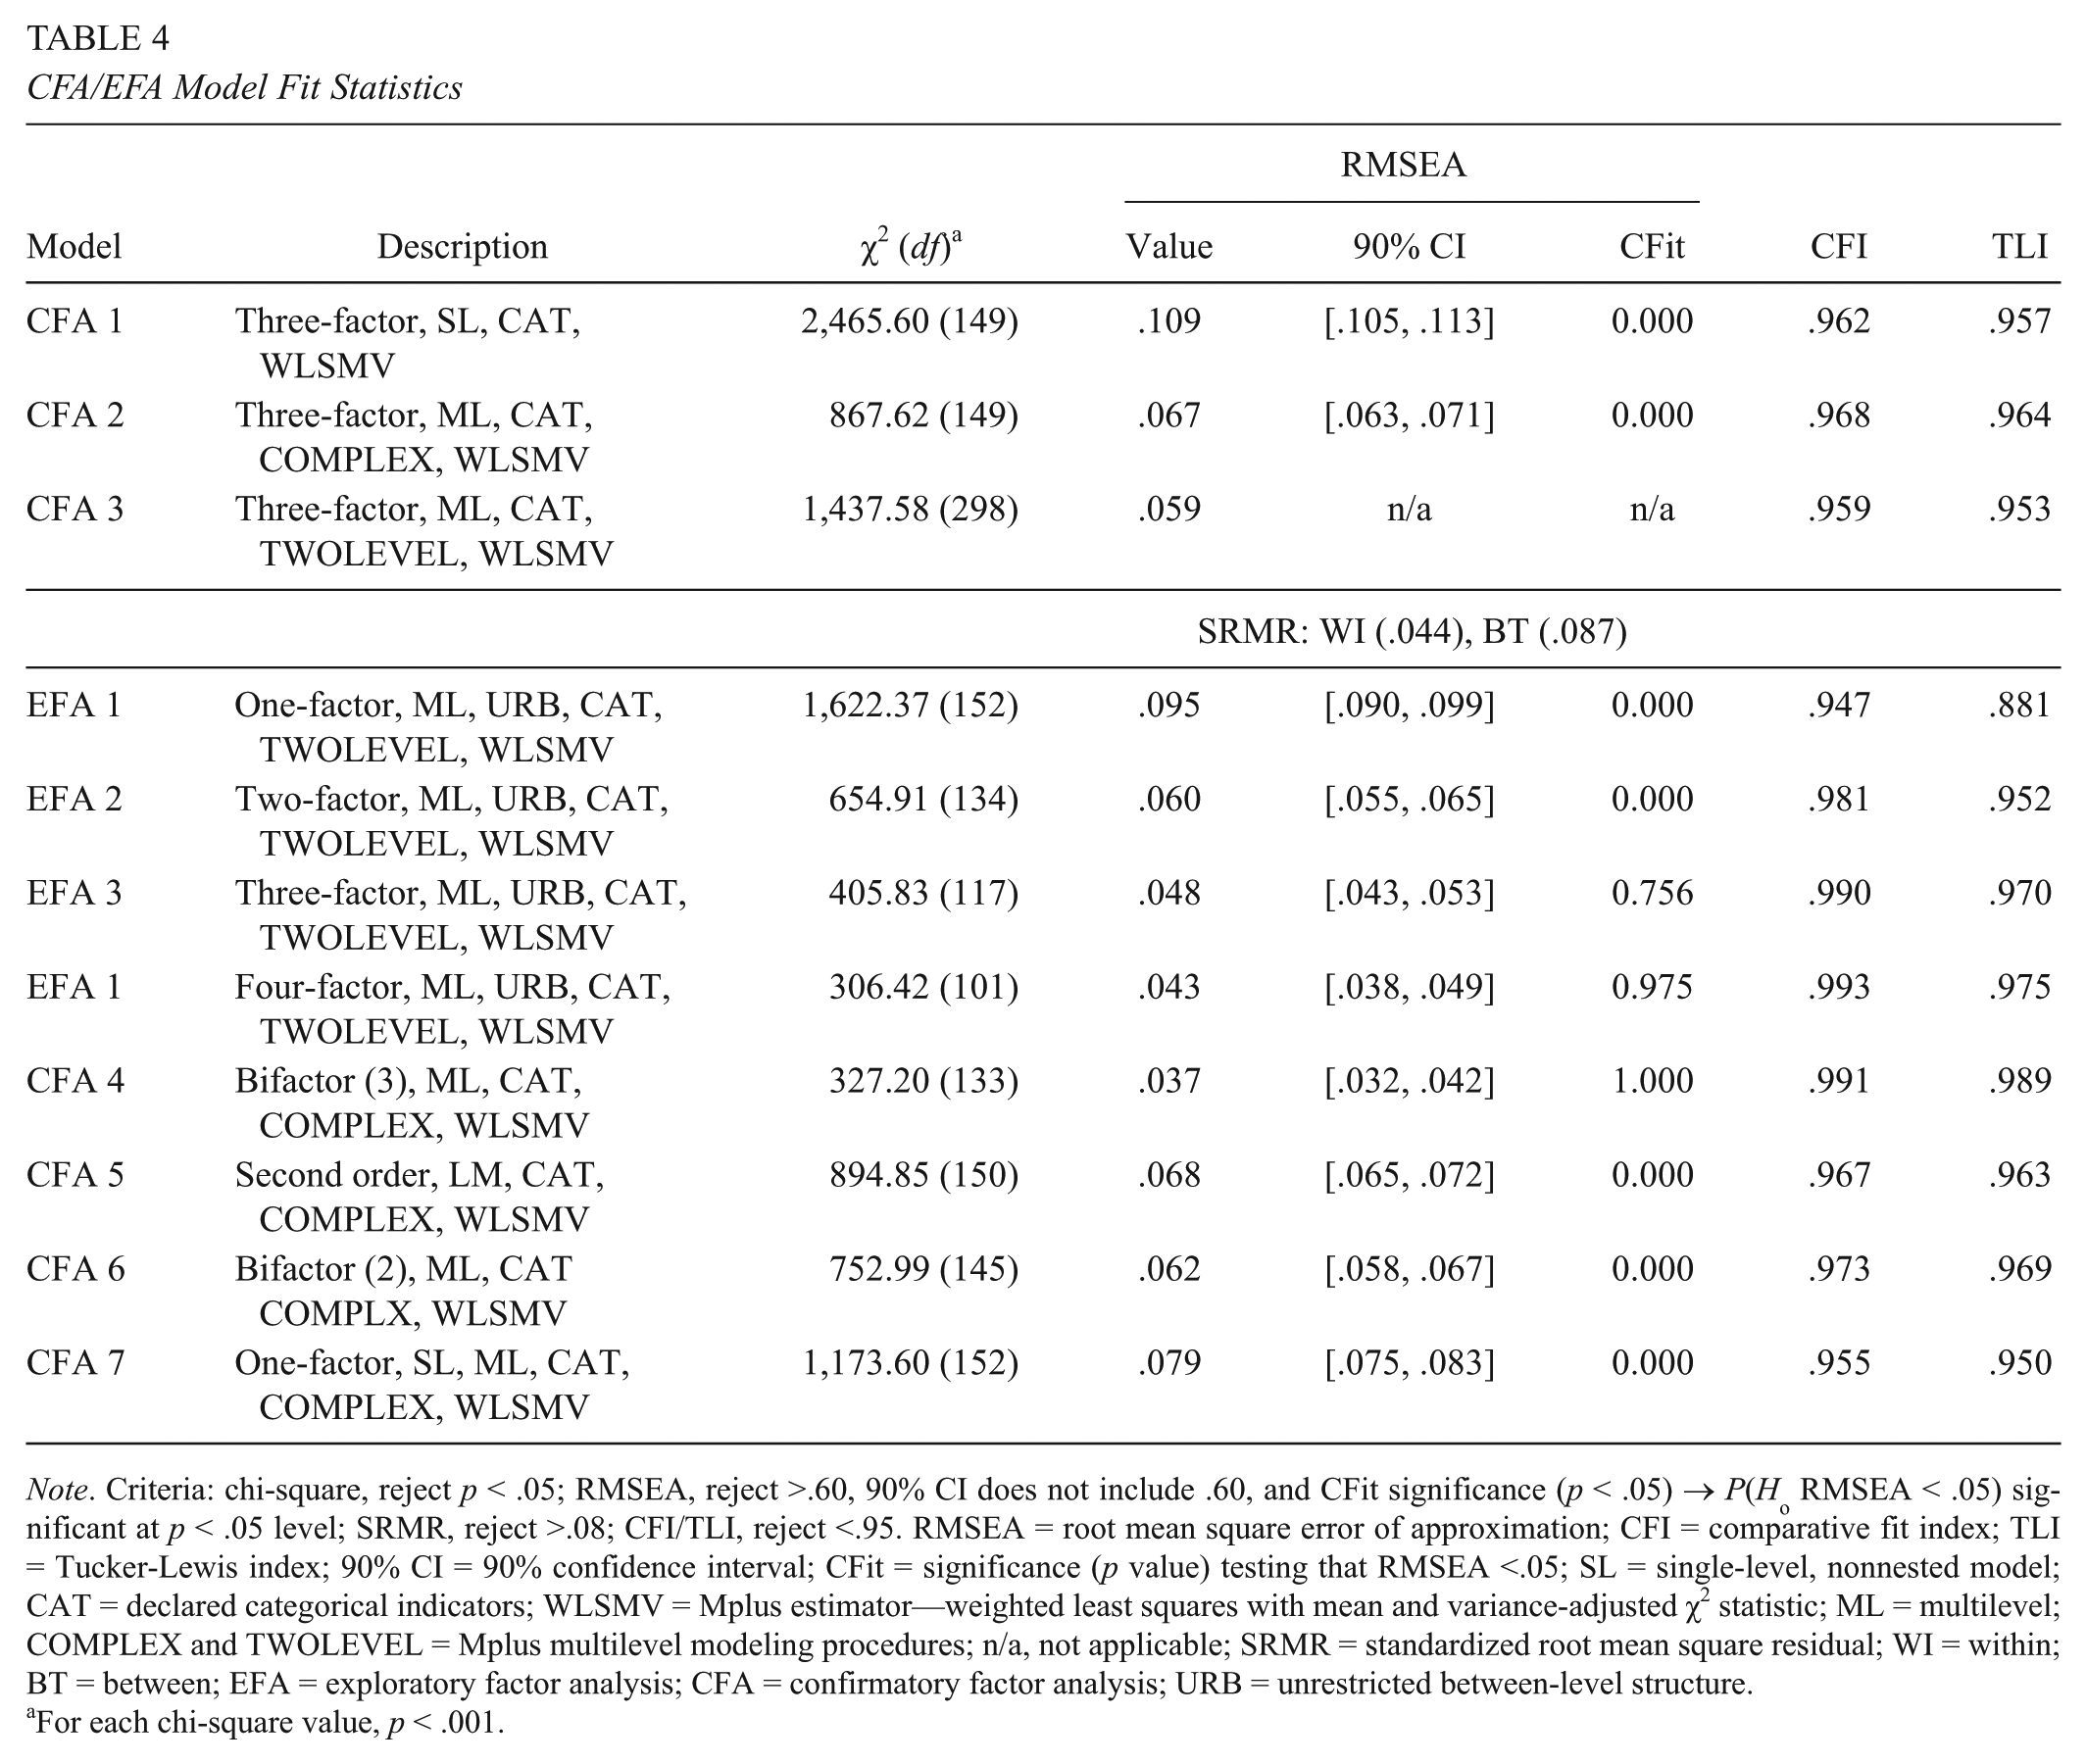
Note. Criteria: chi-square, reject p < .05; RMSEA, reject >.60, 90% CI does not include .60, and CFit significance (p < .05) → P(Ho RMSEA < .05) significant at p < .05 level; SRMR, reject >.08; CFI/TLI, reject <.95. RMSEA = root mean square error of approximation; CFI = comparative fit index; TLI = Tucker-Lewis index; 90% CI = 90% confidence interval; CFit = significance (p value) testing that RMSEA <.05; SL = single-level, nonnested model; CAT = declared categorical indicators; WLSMV = Mplus estimator—weighted least squares with mean and variance-adjusted χ2 statistic; ML = multilevel; COMPLEX and TWOLEVEL = Mplus multilevel modeling procedures; n/a, not applicable; SRMR = standardized root mean square residual; WI = within; BT = between; EFA = exploratory factor analysis; CFA = confirmatory factor analysis; URB = unrestricted between-level structure.
For each chi-square value, p < .001.
Models CFA 1–3
The standard CFI/TLI model fit statistics for the three initial models (CFA 1–3) marginally fell within acceptable range (>.95). In contrast, the RMSEA index fell outside acceptable levels for CFA 1 (single-level model) and CFA 2 (nested model with unrestricted between-school-level structure) at .109 and .067, respectively. This improved for CFA 3 (the fully specified multilevel model), with the RMSEA dropping to .059 but nevertheless remaining on the edge of the threshold criterion. The SRMR index for the full multilevel framework (CFA 3) indicated good fit at the individual level (within school) but poor fit at the group level (between school). This suggests that the factor structure at the cluster level may be different from that of the individual. Overall, this mix of information did not present a consistent interpretation of acceptable model fit.
Review of the individual factor loadings for CFA 1–3 revealed substantive and statistically significant (p < .05) values. Table 5 reports the standardized loadings for the three models. The factor loadings for CFA 1–3 (within school) are similar. In addition, the CFA 3 between-school-level loadings are generally larger than those found at the within-school level. It is not unusual to find different magnitudes within- and between-school-level structures are compared in that the parameter estimates are derived independently.
CFA Model Factor-Indicator Standardized Loadings
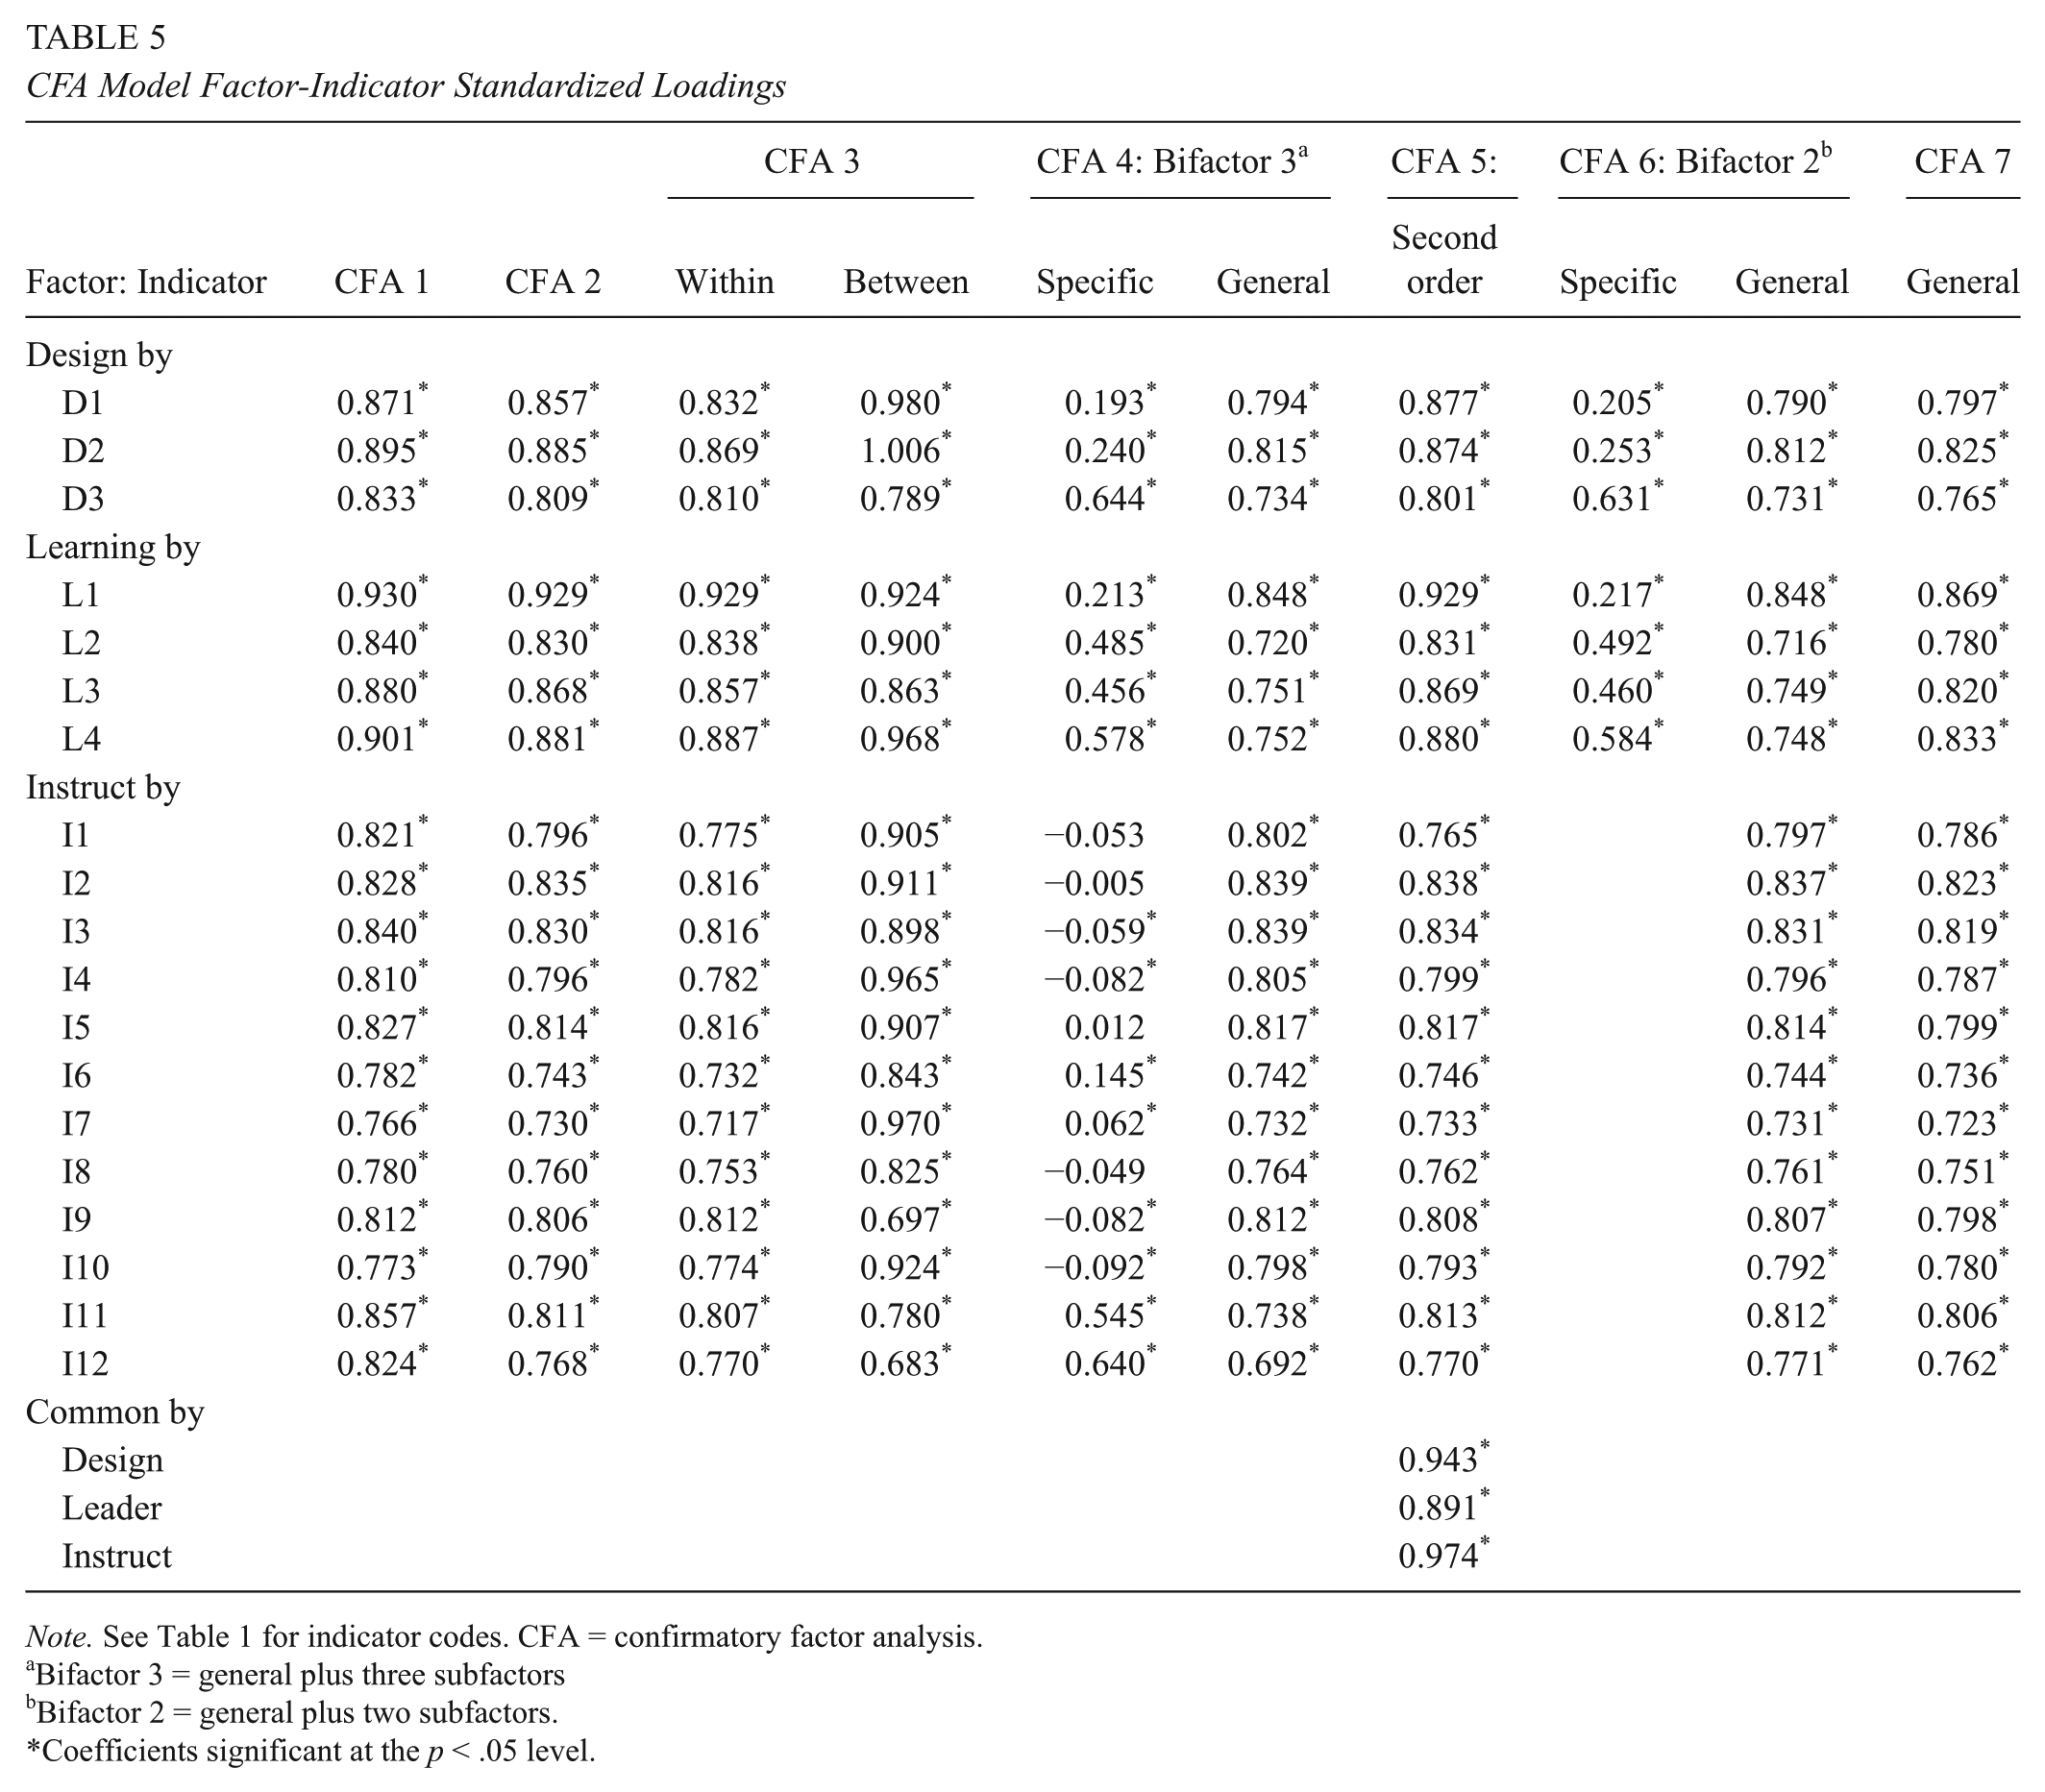
Note. See Table 1 for indicator codes. CFA = confirmatory factor analysis.
Bifactor 3 = general plus three subfactors
Bifactor 2 = general plus two subfactors.
Coefficients significant at the p < .05 level.
Across Models 1–3, the latent factor correlations were substantively large (M = .867, range = .774–.940), suggesting poor discriminant inference across the subscale scores; that is, scores in one domain are good predictors of scores in the other domains, making it unclear what specific trait is being captured by the data. Low discrimination might suggest the presence of a general common factor that could be modeled with alternative factor frameworks, such as second-order or bifactor models.
MIs also provide useful information for evaluating model fit. The size of an MI reflects the approximate amount that the model’s chi-square value would decrease if the particular parameter was freely estimated. Generally, well-fitting models produce MIs that are small. MIs >3.84 are considered substantive (Brown, 2015), but our focus is on values that suggest a sizable effect. For poor or marginally fitting models, review of large MIs may suggest a need for structural adjustments. In addition, presence of numerous large MIs may indict the fidelity of the theoretical framework being tested. Importantly, adjusting model specifications should be based on theoretical grounds and not simply driven by sample-based information.
Hence, we requested MIs for CFA 1 (single level) and 2 (multilevel, COMPLEX). 4 However, MIs are not available from Mplus when TYPE = TWOLEVEL procedures are utilized (CFA 3). For CFA 1 and 2, the magnitude of the L1 indicator distinguished itself (L1 is the first measured variable in the Learning Environment domain, concerning a teacher’s ability to establish learning expectations). That is, the mean MI in the CFA 1 and 2 models excluding L1 was approximately 33 and 11, respectively. In contrast, the MIs for Design by L1 were 184 in CFA 1 and 88 in CFA 2, while those for Instruct by L1 were 213 (CFA 1) and 105 (CFA 2).
Given that the chi-square values for CFA 1 and CFA 2 were 2,466 and 868, respectively, permitting L1 to freely load onto these domains would improve the model’s chi-square between 8% and 12%. However, making these adjustments is not supported by theory, since the L1 component was established to measure aspects of the Learning Environment and not attributes of Designing and Planning Instruction or Instruction. Finally, review of the remaining MIs (26 in CFA 1 and 21 in CFA 2) revealed that each potential adjustment would necessitate aligning measured components to latent dimensions that they were not intended to measure.
Exploratory Factor Analysis
We used EFA to further explore dimensions of the sample data in the context of the posited TAP structure. As with CFA, we conducted all EFA procedures using Mplus 7.4 with Multilevel Add-On. For the main EFA analysis, we invoked the WLSMV estimator, categorical measured variables, and a two-level nested structure, and we directed Mplus to sequentially estimate one- to four-factor extractions at the within-school level (individual) while leaving the structure at the between-school level (group) unrestricted. Because the latent factors are permitted to correlate, we utilized Oblimin (oblique) rotation. Model fit reflections are based on chi-square, scree plot, Kaiser criterion (eigenvalues >1.00),factor loadings, and factor interpretability. As mentioned, Mplus does not provide parallel analysis for TYPE = TWOLEVEL or use of WLSMV estimators. For this reason, we estimated a single-level EFA model employing ML estimators to generate parallel extraction information.
Model fit statistics
Model fit statistics for a one- through four-factor extraction procedure are presented in Table 4 (EFA 1–4). For all models, chi-square indices suggest poor ability of the estimated factor loadings to reproduce the sample component correlations. However, the indices drop substantively when moving from a one- to two-factor extraction solution and then decline less when moving to three- and four-factor extraction models. In addition, RMSEA indices suggest that three- and four-factor extraction models are adequate. CFI/TLI figures support two-, three-, or four-factor solutions, and the SRMR within-school indices support all four factor options.
Factor identification
Based on Kaiser criterion (eigenvalues >1.00), review of eigenvalues for the within-school level of the EFA model reveal two factors with values >1.00 (F1 = 11.804, F2 = 1.112). Similarly, eigenvalues for the between-school level also suggest the presence of two factors (F1 = 14.511, F2 = 1.645). Scree plots for the within- and between-school level EFA information are presented in Figures 1 and 2, respectively. Each suggests the presence of one or two factors.

Exploratory factor analysis: two-level scree plot—between school.

Exploratory factor analysis: two-level scree plot—within school.
We also examined the Oblimin (oblique) rotated factor loadings (i.e., pattern matrix, within-school level) to provide insight on the dimensions present in the data. These loadings are displayed in Table 6. The data suggest that a two-factor solution may be most tenable in that the three- and four-factor extraction models do not provide sufficient interpretable loading patterns beyond two dimensions. We conducted the same analysis on the factor structure matrixes and observed similar loading patterns. Finally, the consistently high loadings reported for the one-factor model also suggest the presence of a common overarching dimension. The pattern of loadings suggests that one dimension may be defined by the Learning domain (L2–L4) and a second by a combination of all three Design components (D1–D3) and a mix of the Instruction indicators.
EFA Rotated (Oblimin Pattern Matrix) Loadings for Factor Extraction Models (Within-School Level)

Note. See Table 1 for indicator codes. Oblique (Oblimin) pattern matrix loadings represent unbounded regression coefficients. EFA = exploratory factor analysis.
p < .05.
EFA factor correlations
As with the CFA analysis, an important tenet of the TAP System is that the three posited dimensions are each identifiable and sufficiently independent to afford meaningful inference on the subscale scores. Examining the EFA factor correlations helps examine this presumption. Importantly, only F1 and F2 revealed interpretable dimensions (albeit, the factor interpretations may differ among models). Review of the information indicated that the correlation between F1 and F2 is .67 under the two-factor model and .72 under the three- and four-factor EFA models. In addition, F3 reports similarly sized association with F1 (r = .73 for three-factor model, r = .77 for four-factor model) but substantively lower correlations with F2 and F4. F4 also reports generally lower correlations with the other factors (r = .42–.54).
Parallel analysis
Mplus does not provide parallel analysis for TYPE = TWOLEVEL EFA models or models declaring categorical data employing WLSMV estimators. However, the TAP rating information did not display substantive signs of nonnormality and were based on a five-item ordinal scale. Because of this, we felt it appropriate to estimate a standard single-level EFA model based on maximum likelihood methods and generate a parallel analysis to further identify substantive latent factors in the data (Ledesma & Valero-Mora, 2007).
Figure 3 provides the scree plot of the model with the eigenvalues for the randomized (n = 1,000) parallel analysis overlaid. The information suggests that the TAP information contains a single latent factor. While a second factor might be suggested based on Kaiser criterion (eigenvalues >1.00) and other criteria, the parallel analysis suggests that this value is no larger than would be expected by random chance.

Exploratory factor analysis plot of eigenvalues with overlay of parallel-analysis values. Parallel-analysis eigenvalues generated from 1,000 randomized samples.
EFA calibration samples
To explore the stability of a possible two-factor solution, we randomly divided the original data (n = 1081) set into two subsamples (n1 = 543 and n2 = 538; Izquierdo, Olea, & Abad, 2014) and estimated a new set of EFA models on each subsample and compared the various model output with the full-data EFAs to assess parameter stability and extraction decisions (i.e., each specified in Mplus as TYPE = TWOLEVEL with categorical measures employing WLSMV estimators specifying sequential extractions from one to four at the within-school level with unrestricted covariances at the between-school level). For both subsamples, Kaiser criterion (eigenvalues >1.00) at the within-school level suggested presence of one primary dimension with a less impactful secondary factor. Chi-square model fit statistics remained significant but declined in magnitude similar to the full data set. The remaining model fit indices matched the full data set closely. Review of rotated factor loadings yielded similar perspectives and component clustering as found in the full model, suggesting that a two-factor solution was tenable.
The biggest difference occurred at the between-school level for Subsample 1. Here the two-factor extraction model failed to provide an interpretable second factor, unlike that found in Subsample 2 and the full data set. However, the three- and four-factor extraction frameworks for Subsample 1 retained the component clustering/ordering, supporting two interpretable dimensions. In addition, eigenvalues for the between-school-level Subsample 1 identified four possible dimensions instead of the two.
Finally, CFA models based on the calibration samples were not estimated, because the purpose of our analysis was not to respecify the TAP framework nor fully reinterpret factor meaning. Rather, the CFA and EFA analyses were intended to examine suitability of the posited factor structure advanced by the TAP System as used in this study setting. That said, there is some indication from the EFA analysis that two dimensions represent a plausible within-school-level structure for the sampled data set.
Higher-order CFA
Review of the initial CFA (1–3) and EFA (1–4) models suggests the presence of a general (common) dimension influencing variation in the measured variables. This is apparent from the magnitude of the CFA factor correlations, the aggregated impact of cross-factor influences (as evidenced by MIs), the factor extraction analysis, and the interpretation of factor loadings. In addition, application of the TAP framework is intended to assess overall instructional competence, which then serves as the basis for establishing merit-based rewards (NIET, n.d.-d).
To this end, we specified three additional CFA modeling frameworks (CFA 4–6) that attempt to evaluate the contribution of a general factor. The first (CFA 4) is a bifactor model, followed by a second-order model (CFA 5). Each incorporates a general factor to account for variation in the measured variables (Chen, West, & Sousa, 2006). Finally, we specified a single general-factor model (CFA 6) to evaluate and compare model fit and factor loading information.
Bifactor models presume the existence of a general (common) factor that accounts for a substantive proportion of variance in all observed measures. However, bifactor specifications also assume that multiple domain-specific factors account for additional unique variance beyond that of the general factor. Here, bifactor models specify direct effects of the general factor on each measured variable independent of the variance accounted for by the domain-specific factors. Brown (2015) notes that bifactor models are most appropriate where a substantive unidimensional factor is posited with numerous but less substantive subdomains.
Second-order models also assume the presence of a general factor but specify its effect in a different manner. Here, the general factor is accounting for the covariance between the related latent factors and not variation in the observed variables. Second-order models presume that each latent factor is influenced by a higher dimension.
We estimated the general factor CFA models as multilevel frameworks using the TYPE = COMPLEX procedure in Mplus with declared categorical measures employing the WLSMV estimator. We left latent factor scaling at the default setting in Mplus except for the first measured variable (I1) in the Instruction domain under the bifactor framework. Here, we unrestricted the indictor and set the factor variance to 1.0 to establish the measurement scale. This adjustment enabled the model to estimate properly with no warnings or errors. For the second-order model, we fixed the Instruction loading parameter on the Common factor (Common by Instruct) at .90 to resolve estimation issues. 5 Table 4 reports the fit statistics for each of the higher-order factor (CFA 4 and CFA 5) and single general-factor (CFA 6) models.
Models CFA 4 and 5
For the bifactor (CFA 4) and second-order (CFA 5) models, the chi-square values remain significant, consistent with the previously estimated CFA models. Here, the chi-square for the second-ordered model (CFA 5; χ2 = 895, df = 150, p < .001) was slightly higher than the first-order model (CFA 4; χ2 = 868, df = 149, p < .001) previously discussed. The RMSEA suggests good fit for the bifactor specification (CFA 4; RMSEA = .037) and poor fit for the second-order framework (CFA 5; RMSEA = .068). CLI/TLI indices suggest good model fit for both specifications; however, the values for the second-order model are below those of the bifactor estimates.
Bifactor models permit a common (general) factor to account for the direct effects of all measured variables. In addition, subdomains are specified to account for direct effects on a subset of indicators. In this configuration, it is possible that one or more subfactors may be rendered irrelevant (Brown, 2015; Chen et al., 2006). That is, the subdomain factor loadings may become low or insignificant because most of the measured variance is accounted for by the general factor. Indeed, review of the factor loadings for the estimated bifactor model (CFA 4) suggests that this is occurring for the Instruction subdomain. Table 5 reports the standardized factor loadings for the bifactor (CFA 4) and second-order (CFA 5) models.
For the bifactor model (CFA 4), loadings for seven of 12 Instruction indicators reported negative magnitudes. In addition, the magnitude on 10 indicators was relatively low, and four were not significant. In contrast, all the remaining subdomain loadings (Design, Leader, and Common) were substantive and significant. This suggests that the components of the Instruction subdomain were better accounted for by the general (i.e., common) factor. Six components reported substantive cross loadings between the specific and general factor: one in Design (D3: Assessment), three in Learning Environment (L2: Managing Student Behavior, L3: Environment, L4: Respectful Culture), and two in Instruction (I11: Thinking, I12: Problem Solving). Finally, all parameter estimates reported for the second-order model were well behaved. That is, all the standardized domain loadings were substantive in magnitude and significant (p < .05).
Because the bifactor (CFA 4) model identified the Instruction subdomain as being captured by the general factor, we estimated an adjusted bifactor model (CFA 6) eliminating the indicators for this dimension. The model fit statistics (Table 4) provided mixed results: χ2 = 752.99, df = 145, p < .001; RMSEA = .062, 90% CI [.058, .067], CFit = 0.00 (for definition, see Table 4); CFI = .973; TLI = .969. The chi-square value more than doubled that reported by the unadjusted bifactor (CFA 4) framework; the RSMEA moved from being acceptable to poor; and the CFI and TLI indices both declined. However, all the standardized factor loadings were substantive and significant (see Table 5 to review the factor loadings for the adjusted bifactor model, CFA 6). As with CFA 4, lower loading values on the Designing and Planning Instruction and Learning Environment domains are noted, as are similar cross loadings when compared with the general factor. This suggests, again, that the common factor is accounting for most of the variation in the measured variables.
Finally, we estimated a one-factor CFA model (CFA 7) based on the premise that a single dimension might be explaining the variation in the empirical data. The model fit statistics (Table 5, CFA 7) for this simplified framework reported generally poor results: χ2 = 1,173.60, df = 152, p < .001; RMSEA = .079, 90% CI [.075, .083], CFit = 0.00; CLI = .955; TLI = .950. The standardized factor loadings (Table 5) were large (.723–.869) and significant (p < .05). No MIs >3.84 were reported.
Summary of Findings
The principle research question that we investigated in this study concerned the tenability of the TAP System’s posited factor structure. To assess this question, we conducted multiple confirmatory and exploratory factor analyses to examine whether the proposed three-factor structure was supported by empirical data. Our additional interest focused on the discriminant validity afforded by the three TAP subconstructs (Designing and Planning Instruction, Instruction, and Learning Environment) and their ability to uniquely inform on targeted areas of professional practice. As our analysis evolved, we explored additional factor structures examining the presence of a single general dimension and its association with secondary factors. The data set originated from a large sample of elementary schools engaging in the TAP System.
Our findings suggest that the posited three-factor framework provides a poor to marginal fit with the empirical data. Exploratory examination of factor structures suggests that a two-factor solution may be more tenable. Subsequent bifactor and second-order CFA models seem to provide a better conceptualization of the TAP structure where a common (i.e., general) factor accounts for most of the variance in the measured variables. A bifactor structure where the general factor substantively aligns to all measured indicators performs best from a fit perspective, as compared with a second-order framework. Here, three of the four subcomponents of the Learning Environment domain seem to retain their posited meaning as a interpretable secondary (supporting) dimension. In addition, large factor correlations revealed throughout the modeling activities suggest that the discriminant validity among the posited latent constructs is low.
Put differently, results from bifactor specifications suggest the presence of a general latent construct supported by a subset of components from the Learning Environment domain. This is consistent with the exploratory factor information that does not distinguish Instruction as a fully independent dimension. The reason may be that the TAP framework itself is capturing predominantly instructional competency behaviors as the primary behavioral trait with components related to developing the Learning Environment in secondary (perhaps supporting) roles. Fittingly, this has implications for low- and high-stakes applications of TAP output.
Policy and Measurement Considerations
The TAP framework posits that instructional quality may be assessed across three distinct behavioral domains: Instruction, Learning Environment, and Designing and Planning Instruction. However, questionable model fit suggests that this proposition may not be tenable. Large latent factor correlations further indict the suitability of interpreting instructional performance at the subscale level due to poor discriminant validity. That is, unique interpretation of specific subscales is brought into question when indicators from other dimensions are highly correlated, which seems to be the case here.
The combination of poor model fit and substantive latent factor correlations subsequently suggests that consequential actions (e.g., interventions and/or professional status decisions) based on subscale scores may not be warranted (or, at best, should be done with caution), since explicit identification of the measured behavioral constructs remains unclear. Put differently, if the validity of the inferences to be drawn from TAP subscale scores does not hold as posited, especially when consequential decisions are attached to subscale-level estimates (i.e., teacher compensation based on latent performance as rated with weighted subscales), this may be problematic in policy and practice.
Correspondingly, when the independence (discriminant inference) across subscales is not empirically established, it may be more prudent to utilize the unweighted summated score to distribute individuals along the primary trait for which the instrument was originally designed. Indeed, the empirical implication may be to devalue consequential decisions based on subscale scores and rely more heavily on full-scale summated measures to identify and distinguish relative distributions of instructional competency.
Indeed, while the TAP instruments are posited to reflect the most important tasks, skills, knowledge, and abilities relevant for witnessing high-quality instructional practices, Haladyna (2013) noted that “the most important feature of a test is the validity of its test score interpretation and use” (p. 4; see also M. T. Kane, 2013; Messick, 1989, 1998). This implies that claims of validity require a range of supporting evidences, most certainly including the empirical assessment of the instrument’s measurement characteristics. As evidenced herein, again, some foundational examinations suggest that the measured constructs posited for the TAP instrument may not neatly align with the proposed constructs of interest. This raises questions concerning score interpretation and the proper use of scores for specific policy and pragmatic purposes.
Within a larger context, states and districts throughout the United States have increasingly adopted policy-driven educational reform initiatives based on student- and teacher-level accountability measures (e.g., standardized observational inventories such as the TAP System and growth- or value-added models). We believe that these policy initiatives have encouraged what might be considered to be hasty implementation of evaluation tools and instruments at the expense of affording sufficient attention to the technical aspects of the measures utilized. Again, while more attention has been paid to the technical attributes of using growth and/or value-added modeling to assess teachers’ impact on student learning, little empirical attention has been paid to the observational systems meant to be used alongside and theoretically complement these measures (see, e.g., Bill & Melinda Gates Foundation, 2013; Chester, 2003; Chin & Goldhaber, 2015; Martínez et al., 2016; National Council on Teacher Quality, 2015; U.S. Department of Education, 2015).
We assert that when the foundational psychometric properties and validity evidences of any instrument remain unexamined, it is difficult for policy leaders to warrant their use within multiple policy settings (AERA et al., 2014; Haladyna & Rodriguez, 2013; Linn, 1993; Messick, 1989, 1998). This is especially true when interpretation of evaluation measures potentially affect the personal and professional identities of those being evaluated (M. T. Kane, 2006, 2013; Messick, 1998; Sheppard, 1993, 1997; Slomp, Corrigan, & Sugimoto, 2014).
In this regard, the ubiquitous application of standardized observational frameworks used to evaluate teachers elevates the need for empirical evidence supporting their technical design and application (Amrein-Beardsley et al., 2015; Goldring et al., 2015; Polikoff & Porter, 2014; Weisburg et al., 2009; Lash et al., 2016). Without such evidence, the validity threats surrounding misapplication of these measures may be both profuse and profound. Our contention, therefore, is that the greater the consequence, the greater the need for extensive and exhaustive validity evidence (AERA et al., 2014; Lane 2014; see also M. T. Kane, 2013; Messick, 1989, 1998).
The findings presented herein underscore the need to rigorously examine the psychometric characteristics of all observational teacher evaluation frameworks inclusive of how such systems are currently being implemented and utilized. In turn, these evidences should be used to shape the extent to which consequential educational evaluation and accountability policies might also be implemented.
Limitations and Opportunities for Further Research
In this study, we did not attempt to address all of the varied types of validity evidences possible for evaluating the psychometric attributes of the TAP System’s evaluation instrument. Rather, we purposefully focused on an initial examination of the coherence between the framework’s posited three-factor structure and empirical measures. In addition, most of our analytic attention was directed at within-school scale characteristics, with little effort made toward examining structures at the group level (between school). However, we believe that is an important extension of our analyses.
In addition, most of the sample participants reported evaluation scores for three independent time points (start of year, midyear, and end of year). As discussed previously, we chose to focus on midyear evaluation ratings as a starting point for examining attributes of the TAP instrument. Replicating the analysis for these three periods and conducting temporal invariance testing would also represent an important extension to this study. In addition, within each of the three periods, teachers were evaluated by any one of three types of certified raters: mentor teachers, master teachers, and school administrators. Additional invariance studies across rater type and time should be conducted. Finally, parametric invariance test results might be examined between levels and across teacher characteristics (e.g., years of experience, grade level, instructed subject area), as this would likely be of added empirical value.
In this study, we also to utilize the full set of sample data to evaluate the alignment between the hypothesized factor structure and the empirical data. Here, we estimated numerous CFA models, followed by a variety of EFA procedures. An alternative way to utilize the sample data would have been to initially split (via stratified random sampling by school) the participants into two groups and conduct a variety of comparative analysis and invariance testing across subsamples.
Related, we initially focused on evaluating two-level nested models that grouped teachers within schools. This was initially decided per the volunteer basis by which schools choose to participate, as noted prior. Hence, extending the modeling to three levels (teachers within schools within districts) would add another perspective to the analysis and permit the analysis of comparative factor specifications at the school and district levels. In addition, because the sample schools represented a more diverse racial/ethnic student population than that found at the state level, this compromises more generalized inferences beyond the localized context, suggesting that replication with expanded samples is warranted.
While not strictly an analysis of the evaluation instrument itself, the TAP System imposes a number of policy restrictions regarding how evaluation scores are derived, aggregated, and combined to arrive at overall teacher performance. This includes weighted ratings based on rater type, methods for combining the three time-period scores, and procedures for deriving overall performance classifications based on integrating observational scores with value-added measures. Each of these reflects important policy dimensions inherent in the TAP evaluation system that should be examined within the context of program purpose and consequential outcomes.
Conclusions
Classroom observations serve as critical components of many federal and state educational reform initiatives because they appear to provide actionable formative and summative information to practitioners and policy makers. That is, it seems reasonable to expect that teachers use evaluation information in a formative manner to improve targeted areas of professional practice (Goldring et al., 2015) and that school and district leadership use evaluation information in a summative manner for policy-directive purposes (e.g., pay-for-performance incentives, retention/promotion, hiring, or other high-stakes policy decisions). Indeed, TAP System developers presume this type of causal pathway whereby formative and summative evaluation measures should lead to improved instructional competence, boost retention of highly effective teachers in high-needs schools, and ultimately incentivize and increase student academic performance over time (Jerald & Van Hook, 2011; see also NIET, n.d.-d).
However, fidelity to these types of outcomes requires pedagogically specific feedback aligned to component scores that uniquely assess discernable attributes of teachers’ instructional practice. Importantly, results from this study suggest that reliance on subdimension scores to identify targeted practices, initiate interventions, and consequentially infer attributes of instructional competency may be suspect. At the same time, while the three-factor structure of the current TAP System framework may not be conclusively supported, this does not mean that summative scales constructed from the individual indicators (i.e., representing the general or common factor) does not capture essential elements of quality instructional practices. However, warrant for this claim requires evidence not currently available in the technical literature. We believe that this needs to be part of the evolving evidence that may help warrant the use of this and similar observational systems for low- and high-stakes uses and decision-making purposes.
Footnotes
Acknowledgements
This research was made possible by a U.S. Department of Education Teacher Incentive Fund grant (S385A100163).
Notes
Authors
EDWARD SLOAT is a faculty associate at Arizona State University. His research focuses on value-added modeling, education accountability and evaluation systems, measurement and validity theory, assessment design, and applied statistical methods.
AUDREY AMREIN-BEARDSLEY is a professor at Arizona State University. Her research focuses on educational policy, educational measurement, quantitative research methods, and high-stakes tests and value-added methodologies and systems.
KENT E. SABO is an assistant principal in Las Vegas. His research focuses on educational research and measurement, the effectiveness and efficiency of teaching and learning interventions, and intelligent and adaptive learning systems.