
Abstract
Gaps in educational achievement between high- and low-income children are growing. Administrative data sets maintained by states and districts lack information about income but do indicate whether a student is eligible for subsidized school meals. We leverage the longitudinal structure of these data sets to develop a new measure of economic disadvantage. Half of eighth graders in Michigan are eligible for a subsidized meal, but just 14% have been eligible for subsidized meals in every grade since kindergarten. These children score 0.94 standard deviations below those who are never eligible for meal subsidies and 0.23 below those who are occasionally eligible. There is a negative, linear relationship between grades spent in economic disadvantage and eighth-grade test scores. This is not an exposure effect; the relationship is almost identical in third-grade, before children have been exposed to varying years of economic disadvantage. Survey data show that the number of years that a child will spend eligible for subsidized lunch is negatively correlated with her or his current household income. Years eligible for subsidized meals can therefore be used as a reasonable proxy for income. Our proposed measure can be used to estimate heterogeneous effects in program evaluations, to improve value-added calculations, and to better target resources.
G
A large literature studies the link between family resources in childhood and educational outcomes. 2 Studies that exploit longitudinal data show that deficits are particularly large for children who are persistently disadvantaged. 3 But the household surveys that these studies rely upon are infrequent and suffer from nonresponse and attrition. 4 The administrative data sets increasingly analyzed by education researchers (Dynarski & Berends, 2015) do not have these weaknesses but typically contain a single, crude proxy for income: an indicator of students’ eligibility for federally subsidized school meals.
Children in households with income below 185% of the federal poverty line are eligible for subsidized meals in school. Subsidized-meal eligibility is widely used by researchers as a proxy for poverty. But nearly half of students nationwide are eligible for subsidized meals, whereas only a quarter of U.S. children live in poverty. These two statistics make clear that eligibility for subsidized meals is a blunt measure of economic disadvantage. It is, for now, the only measure available to the many researchers and practitioners who work with administrative data to evaluate the effects of educational programs, measure gaps in student achievement, and steer resources toward the most needy children.
We use administrative data from Michigan to develop a more detailed measure of economic disadvantage. Our data contain information on the entire population of students in the Michigan public schools. We leverage the longitudinal nature of these data to document systematic variation in outcomes and disadvantage within the population of children who are eligible for subsidized meals. Children who spend all of their school years eligible for subsidized meals have the lowest scores, whereas those who are never eligible have the highest. In eighth grade, the score gap between these two groups is nearly a standard deviation. The scores of children who spend a few of their school years eligible for subsidized meals fall between these two extremes.
There is a negative, nearly linear relationship between the number of grades spent in economic disadvantage and eighth-grade test scores. This relationship holds after controlling for student demographics and school quality. The lower scores do not appear to be caused by more years in disadvantage; this linear relationship is similar in third grade, before children have been differentially exposed to 5 more years of economic disadvantage. Rather, we show that family income in a given year is negatively correlated with the number of years that a child will spend eligible for subsidized meals. 5
In addition to the number of years spent in disadvantage, the timing of when students are disadvantaged is also important. 6 Children who are disadvantaged at an early age may have worse outcomes in adulthood than children who were disadvantaged at a later age. We test this hypothesis as well, finding that disadvantage in kindergarten and in the years leading up to assessment (in this case, seventh and eighth grade) have the largest associations with the achievement gap in eighth grade.
Our results imply that the number of years that a child spends eligible for subsidized meals is a reasonable proxy for household income. Evidence from the Early Childhood Longitudinal Study–Kindergarten Class of 1998–1999 (ECLS-K) supports this claim. Although still crude, this proposed measure captures greater variation in economic resources and educational outcomes than does the variable currently used by researchers, which captures only a child’s current eligibility for subsidized meals. In Michigan, roughly half of eighth graders are eligible for a subsidized meal; they score about 0.69 standard deviations below those who are not eligible. But just 14% of eighth graders had been eligible for subsidized meals in every year since kindergarten, and these children score 0.94 standard deviations below those who were never eligible (and 0.23 standard deviations below those who were occasionally eligible). In future work, we will examine how well our new measure predicts educational attainment, including college attendance and graduation. We will also examine its performance in states other than Michigan.
Our proposed measure of economic disadvantage will improve estimates of the value added by teachers and schools. Two classrooms may have identical numbers of currently disadvantaged children but different numbers of persistently disadvantaged children. A value-added measure that does not account for these differences will be biased against teachers of persistently disadvantaged children. Our measure of persistence can also be used in evaluations in order to estimate heterogeneity in causal effects or as a control to reduce omitted-variables bias.
Finally, our proposed measure can be used to better target resources toward the most disadvantaged children. Many federal, state, and local programs distribute money based on the share of a school’s or district’s students eligible for subsidized meals. In Michigan, schools that have identical shares of students who are currently eligible for subsidized meals vary considerably in the share of students who are persistently eligible. By taking these differences into account, practitioners and policymakers can better target resources intended to support the most disadvantaged children and their schools.
Prior Literature: Family Resources and Child Outcomes
Most research examining the correlation between income and child outcomes relies on contemporaneous, rather than longitudinal, measures of income. Reardon (2011) uses multiple surveys to show that gaps between poor and richer children have grown over time. For recent years, he estimates that the math score gap between students with family incomes in the 90th and 10th percentiles is around one standard deviation.
An extensive literature documents the chronic nature of poverty in the United States. 7 It is plausible that children who are chronically poor face more severe challenges than children who experience poverty intermittently. Researchers who exploit longitudinal data show that racial and socioeconomic gaps emerge by the time children enter kindergarten and persist into adulthood. 8 Persistently disadvantaged children have worse test scores, more behavioral problems, and lower schooling and wages as adults. 9 There is also a large literature on how the timing of disadvantage is correlated with outcomes in adulthood. 10 Much of this research suggests that experiencing poverty at a young age is more detrimental for outcomes in adulthood than experiencing poverty in adolescence.
This research relies on surveys such as the Panel Study of Income Dynamics (PSID) and the National Longitudinal Survey of Youth (NLSY), which include longitudinal measures of income as well as detailed demographics. But these surveys suffer from response bias and sample attrition, which are plausibly correlated with depth of disadvantage. Recent work shows a decline in the quality of household survey data compared to administrative data (Meyer, Mok, & Sullivan, 2015; Meyer & Nittag, 2015).
A large and rapidly expanding literature makes use of administrative data held by states and school districts to conduct education research (Dynarski & Berends, 2015). These data sets lack the detailed data on income and demographics of the PSID and NLSY. But they are large, covering the universe of public school students, and contain comprehensive information on students’ test scores and educational attainment. These data sets track students longitudinally, with each child assigned a unique identifier that in many states (including Michigan) stays with a student through college.
In these administrative data, eligibility for subsidized school meals is the only measure of economic status. Local education agencies use this variable to allocate Title I funds, which subsidize the schooling of low-income children (U.S. Department of Education, 2012). This variable, discussed in detail below, is used widely by education researchers as a proxy for poverty (see, for example, papers in the volume edited by Dynarski and Berends, 2015, such as Papay, Murnane, and Willett 2015). To our knowledge, no study has leveraged the longitudinal nature of these data systems to construct measures of the persistence of economic disadvantage to examine the relationship between the duration of disadvantage and educational outcomes.
The National School Lunch Program (NSLP)
The NSLP is an $11 billion federal program, established by the 1946 National School Lunch Act. The NLSP provides subsidies that allow 31 million students to receive free or reduced-price lunch (U.S. Department of Agriculture [USDA], 2012). Schools receive federal reimbursement for each student eligible for subsidized lunches (USDA, 2015b).
In recent years, nearly half of all school children received subsidized meals (see Figure 1). The growth in the population of children receiving subsidized meals has outpaced the growth in children living below the poverty line (again, see Figure 1). This is in part due to the faster growth in the share of children living in households with income between the poverty line and 185% of the federal poverty line.
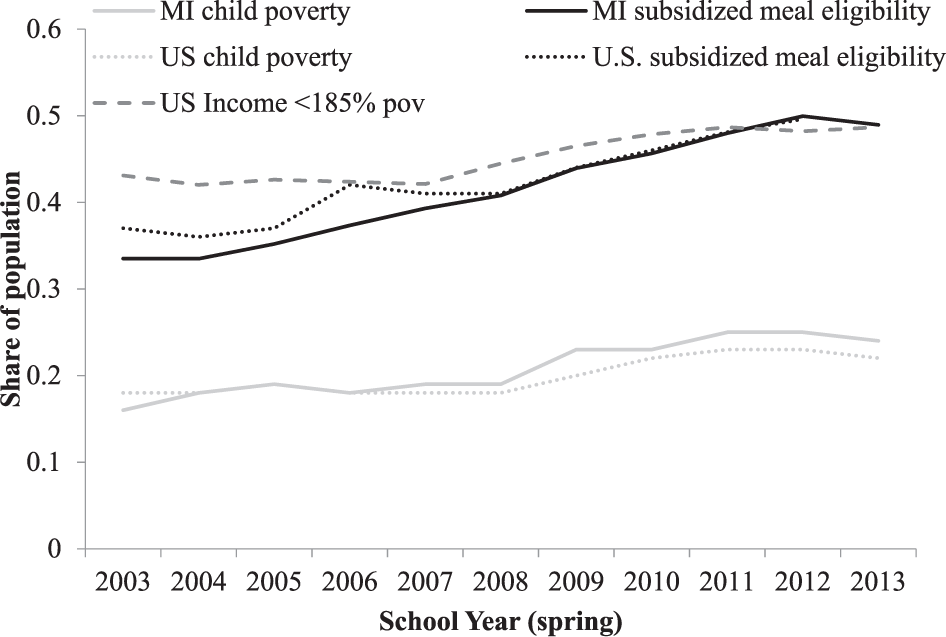
Share of kindergarten-through-12th-grade students experiencing economic disadvantage, by year.
A student can qualify for free or reduced-price meals in two ways: by providing paperwork to her or his school or through “direct certification,” which is triggered by a child’s receipt of other federal, means-tested benefits. Once a student has gained eligibility for NSLP through either method, she or he is eligible for the entire school year and up to 30 days of the next school year (USDA, 2015a).
Under the first method, families showing monthly household income below 185% of the federal poverty guideline gain eligibility for a reduced-price meal, and families below 130% receive a free meal. 11 As of 2015, a family of four must have annual earnings below $31,525 in order to qualify for free meals and below $44,863 to qualify for reduced-price meals. 12
Under the second method, children automatically gain eligibility if their families receive means-tested benefits —such as food stamps (Supplemental Nutrition Assistance Program); food subsidies for women, infants, and children (WIC); or welfare (Temporary Assistance for Needy Families [TANF]) — or have foster children. In these cases, families do not have to fill out paperwork; eligibility is proactively established (in Michigan’s case, by the state) using administrative data from these other programs. Students who are directly certified for subsidized meals tend to have lower incomes than those who become eligible by filling out an application, as the income cutoffs for many of these programs are below 185% of the poverty threshold. 13
Entire schools can now be deemed eligible for subsidized meals through the “community eligibility” provision. As of 2010, schools are allowed to provide free lunches to all students if at least 40% are directly certified. States and districts vary in the speed with which they have taken up this option. Some states have stopped collecting student-level income data in schools that are community eligible. Michigan has not, because the student-level information is used to distribute other state-controlled funds.
For backward-looking evaluations using administrative data, the subsidized-meals indicator is still the only available proxy for income. Our proposed measure, based on the persistence of eligibility for school meals, is therefore relevant for researchers using the many years of historical data that have been compiled by states and districts. Any researcher working with administrative education data from 2010 forward should ask the relevant agency when and how it made the shift toward community eligibility and whether individual student eligibility is still recorded. We discuss this point further in the Conclusion.
Data and Method
Our data are drawn from the Michigan Center for Educational Performance and Information (CEPI) and contain longitudinal information on all students in the Michigan public school systems since the 2002–2003 school year. We focus on students who were in eighth grade during the school years 2010–2011 through 2012–2013. We can track these cohorts from kindergarten through eighth grade and therefore observe their subsidized-meal eligibility throughout elementary school. 14
We restrict the sample to eighth graders who were in the Michigan public school system in seventh grade. This allows us to control for lagged achievement in some specifications. We make no further restrictions on how many years students must be present in the Michigan public school system. 15 Within our sample, 76% of eighth graders are in Michigan public schools for the full 9 years since kindergarten. In all analyses, we include an indicator for whether a student was missing in at least 1 year. 16
The outcome of interest is standardized test scores in math in eighth grade. 17 All eighth graders attending public schools in the state of Michigan take the same exam, and test scores are standardized by grade and year for all students in Michigan public schools. 18 Scores are therefore interpreted as standard deviations and capture a student’s performance relative to other students in Michigan public schools in that year and grade.
We create several measures of economic disadvantage using the longitudinal data. We define persistently disadvantaged children as those eligible for subsidized meals in every grade since kindergarten. 19 Those who were never eligible for subsidized meals during those grades are defined as never disadvantaged. The remaining children spent some years eligible for subsidized meals; we define them as transitorily disadvantaged. 20 We create these three categories to reflect our interest in identifying the most disadvantaged students (those always eligible for subsidized meals in grade school) and compare them to the least disadvantaged students (those who were never eligible for subsidized meals). We then relax these categories to identify the relationship between the total number of years spent in disadvantage and the achievement gap.
We use the term currently disadvantaged to refer to a child’s eligibility for subsidized meals in her or his tested grade (in our case, eighth grade). This is the variable that typically would be used by researchers calculating income-based gaps in achievement. 21
Sample Characteristics
Nearly 60% of Michigan eighth graders in the school years 2011 to 2013 were eligible for subsidized meals at least once between kindergarten and eighth grade (see Table 1). These children spend, on average, 6 years eligible for subsidies. Of this group, about a quarter (14% of the full sample) were persistently disadvantaged, in that they were eligible in every grade since kindergarten. Another 40% of children were never disadvantaged.
The Michigan Context: Characteristics of Eighth Graders by Economic Disadvantage, 2011–2013 Cohort

Source. Single Record Student Database/Michigan Student Data System and Assessment files from the Michigan Department of Education. Students who were in eighth grade between 2010–2011 and 2012–2013. Median household income from the American Community Survey 5-year averages 2010 to 2014.
Demographics differ starkly by these measures of economic disadvantage. Ninety percent of the never disadvantaged are White, compared to 60% of those who are ever disadvantaged. Students ever disadvantaged by eighth grade were 6 times more likely to be Black and 4 times more likely to be Hispanic, compared to those who were never disadvantaged. The persistently disadvantaged are more concentrated in urban areas, whereas the transitorily disadvantaged are more concentrated in suburban areas. The persistently disadvantaged attend schools with a higher concentration of students eligible for subsidized meals than those who are transitorily disadvantaged.
Our administrative data lack information on income, parental education, and family structure. We show median income from the American Community Survey in the zip code in which students live. Students who are never disadvantaged live in a zip code where the median household income is $63,000 (2014 dollars), whereas those who were ever disadvantaged live in neighborhoods with a median household income of about $46,000. For the persistently disadvantaged, neighborhood income is $41,000.
We turn to nationally representative survey data to shed more light on demographic differences between children who are persistently disadvantaged, transitorily disadvantaged, and never disadvantaged. The ECLS-K includes information on household income and subsidized-meal eligibility. One limitation of the ECLS-K is that it does not collect information every year but, rather, interviews households roughly every 2 years. Because of this limitation, we define persistent disadvantage in the ECLS-K by whether the student was eligible for subsidized meals in every wave of the study rather than every grade. Results should be interpreted with caution, as those who were considered persistently disadvantaged in the ECLS-K may not be directly comparable to the persistently disadvantaged students in the Michigan data, whom we can observe for all 9 years between kindergarten and eighth grade.
About half of eighth graders in 2006–2007 were ever eligible for subsidized meals (similar to Michigan), and about 10% were eligible in each survey wave of the ECLS-K (again, similar to Michigan; see Appendix Table A5). As in Michigan, persistently disadvantaged students in the ECLS-K are much more likely to be a racial or ethnic minority (73% compared to 46% among transitorily disadvantaged and 11% among the never disadvantaged). They were also much less likely to live with both parents at the start of the survey (51% compared to 65% among the transitorily disadvantaged and 91% among the never disadvantaged) and much less likely to have a parent with a college degree (2% compared to 24% among the transitorily disadvantaged and 57% among the never disadvantaged). Family income also varies substantially by the persistence of disadvantage; we discuss this in detail later in the paper.
As these statistics make clear, the persistently disadvantaged are a distinct minority within the larger population of students who are eligible for subsidized meals. They are poorer and more likely to live in single-parent families and to have parents with lower educational attainment. As we now show, these students have far lower test scores than their peers who are only temporarily (or never) eligible for subsidized school meals.
Achievement Gaps by Economic Disadvantage
We first estimate a conventional measure of the income gap in academic achievement, by comparing the math scores of children who are, at the time of testing, eligible and ineligible for subsidized meals. Measured this way, the gap in eighth-grade math score gap is 0.69 standard deviations (see Table 2).
Score Gaps Vary by Definition of Disadvantage, Michigan Eighth Graders in 2011 to 2013

Source. Single Record Student Database/Michigan Student Data System and Assessment files from the Michigan Department of Education.
Note. Math test scores standardized by grade and year.
If our goal is to capture the effect of persistent disadvantage, this measure is biased downward by classification error. This error goes both ways: Some of those currently eligible for subsidized meals were not eligible in previous years, and some of those currently ineligible were eligible at some point. Among Michigan students ineligible for subsidized meals in eighth grade, 22% were eligible in a previous grade (Table 1, final column). Those who were eligible for subsidized meals in eighth grade spent an average of 2.25 grades not eligible for the subsidies.
When we compare children who are persistently disadvantaged to those who are never disadvantaged, the achievement gap widens considerably. The score difference between the never disadvantaged and the persistently disadvantaged is nearly a standard deviation (0.94), 35% wider than the conventional measure (Table 2). Persistently disadvantaged students score a quarter of a standard deviation below transitorily disadvantaged students.
The standard indicator for economic disadvantage is often included as a control in a regression that includes other variables, such as race, ethnicity, sex, and school characteristics. For quantitative researchers, a key question is therefore whether these other observables “explain” the larger achievement deficit among persistently disadvantaged students. If observables explain the differences, then the analyst need include these observables in the regression only in order to eliminate biases that may otherwise be induced by unobserved heterogeneity within the population of currently disadvantaged students.
We explore this by estimating test score gaps that control for student characteristics, school quality, and neighborhood characteristics. Table 3 presents results. In Panel A, we measure disadvantage the conventional way, based on current eligibility for subsidized lunch. In Panel B, we use our measures of persistent disadvantage, differentiating between those who were never disadvantaged between kindergarten and eighth grade (the reference group), those who were transitorily disadvantaged, and those who were persistently disadvantaged. In all regressions, we cluster the standard errors at the school level to adjust for correlation in test scores among students who attend the same school.
Ordinary Least Squares Regressions of Score Gaps, Eighth Graders in 2011 to 2013

Source. Single Record Student Database/Michigan Student Data System and Assessment files from the Michigan Department of Education.
Note. Regressions of standardized eighth-grade math test scores on indicators for subsidized-meal eligibility. Each column in each panel represents a separate regression. Demographic controls consist of race and gender indicators, interactions of race and gender indicators, whether the student was an immigrant, whether the student was a Michigan native, and whether the student was missing at least 1 year of data between kindergarten and eighth grade. School fixed effects (FE) are for eighth-grade school. Zip code income is median household income in eighth-grade zip code from American Community Survey 5-year estimates, 2010 to 2014. Prior test scores measured in seventh grade. Standard errors clustered at the school level.
Each column/panel combination in Table 3 represents a separate regression. Column 1 includes only the measures of disadvantage, column 2 adds demographic characteristics, column 3 adds school fixed effects to control for differences in the quality of schools that disadvantaged and nondisadvantaged students may attend, column 4 adds controls for median household income in a household’s zip code, and column 5 includes controls for prior-year test scores.
With no controls in the model, we replicate the gaps shown in Table 2: a score gap of 0.69 standard deviations between those currently eligible for a subsidized meal and those not eligible, 0.70 standard deviations between the never disadvantaged and the transitorily disadvantaged, and 0.94 standard deviations between the persistently disadvantaged and the never disadvantaged.
We next add controls for race, ethnicity, and gender as well as their interactions. We also add a dummy that indicates a student is a Michigan native and one that indicates immigrant status. Controlling for these variables moderately reduces all of the test score gaps (column 2). But the gap between the never disadvantaged and the persistently disadvantaged (0.76 standard deviations) is still nearly 40% larger than the gap based on the conventional measure of contemporaneous eligibility (0.55 standard deviations).
Controlling for school fixed effects further reduces gaps (column 3). School fixed effects control for time-constant characteristics of schools that may partially explain why disadvantaged students perform worse than nondisadvantaged students on standardized tests. One explanation for why we find a larger test score gap using persistent disadvantage than when using contemporaneous disadvantage is that the persistently disadvantaged students attend lower-quality schools. Some schools may also do a better job of signing students up for subsidized meals than other schools, and this could also lead to bias in our estimates. Accounting for school fixed effects addresses these concerns by identifying the test score gap between disadvantaged and nondisadvantaged students attending the same school. After including school fixed effects, the within-school gap between the never disadvantaged and the persistently disadvantaged (0.55) remains 41% larger than the gap based on the standard measure of contemporaneous eligibility (0.39). 22 The difference between these estimates is statistically significant. This implies that the difference in the test score gaps using persistent versus contemporaneous disadvantage is not due to differences in the quality of schools that disadvantaged students attend.
These last results indicate that persistent disadvantage is not solely a geographic phenomenon. Even within schools, there is substantial variation in the performance of children who are persistently versus transitorily disadvantaged. This could be because schools draw on neighborhoods with widely varying household incomes and levels of persistent poverty. However, controlling for household income in the child’s home zip code (column 4) does very little to change these within-school results. 23
Researchers estimating causal effects of programs on achievement often include lagged test scores (e.g., Angrist, Cohodes, Dynarski, Pathak, & Walters, 2016). Does our proposed measure of persistent disadvantage explain additional variation in scores once lagged scores are included? In column 5 of Table 3, we add seventh-grade math scores to the regression. All of the gaps shrink considerably, but our measure of persistent disadvantage (Panel B) still generates a larger gap than the conventional measure (Panel A). The conventional gap, conditional on lagged test scores, is 0.095 standard deviations; the gap by persistent disadvantage is 0.132 standard deviations. The gap based on our persistent disadvantage is 40% larger than that based on the conventional measure of disadvantage, even after including demographics, school effects, and lagged test scores.
These results have implications for practitioners. Practitioners cannot identify the most disadvantaged students using only measures of current disadvantage, even if they also have access to information on prior test scores and neighborhood income.
The implication of these results for researchers depends upon the specific context. The bias induced by an omitted variable rises with the conditional correlations of the omitted variable (persistent disadvantage, in this case) with (a) the variable of interest (e.g., an indicator for a treatment) and (b) the outcome of interest (in this case, test scores). We have shown that the second condition for omitted-variables bias is met when the outcome of interest is test scores and persistent disadvantage is excluded from the regression. Whether this omission will bias coefficients on other variables of interest depends on how strongly correlated these variables are with persistent disadvantage.
Do Achievement Gaps Widen With Each Year of Disadvantage?
We have shown that children who are persistently disadvantaged perform worse than those who are disadvantaged in only some grades. We next examine how the size of this gap varies with the number of grades spent in disadvantage.
Figure 2 plots the score gap in eighth grade against the number of grades spent in economic disadvantage since kindergarten. The top line plots unconditional gaps. Note that no functional form is imposed upon this line; it connects unconditional score differences. We obtain these differences by regressing eighth-grade scores against a set of nine dummies that indicate the number of grades that a child has spent in economic disadvantage since kindergarten. The reference group is children who spent no grades in economic disadvantage. 24

How do test score gaps vary by number of years of disadvantage?
Children who spend 1 year in economic disadvantage score about a third of a standard deviation below children who are never disadvantaged. This gap widens by about 0.08 standard deviations for each additional year of disadvantage; the relationship is nearly linear after the 1st year of disadvantage. The intercept drops slightly, and the slope is reduced, when demographic controls are included in the regression (middle line). The relationship is further attenuated, but the overall pattern remains, when school fixed effects are added (bottom line). This analysis rules out two potential explanations for why the achievement gap widens with each year spent in economic disadvantage: that students who are disadvantaged for multiple years differ in their demographic characteristics and that they attend lower-quality schools than students who are not disadvantaged. The relationship between the number of years spent in subsidized-meal eligibility and the achievement gap persists after controlling for these factors.
Figure 2 reveals that the score gap widens steadily with each additional year of disadvantage. The obvious interpretation is that this is a dosage effect, with each year of disadvantage placing children yet further behind. But this interpretation is wrong, as we demonstrate with Figure 3. Here, we replicate the unconditional eighth-grade gaps of Figure 2 (top line). We add to the graph unconditional differences in scores in third grade. Although the intercept is lower, the slope is almost identical. Figure 4 shows the same plots for scores for Grades 3 through 8. The lines shift up monotonically with each grade, tracing out the growth during elementary school of the achievement gap. It is this upward drift in the gap that captures the widening of the achievement gap over a child’s lifetime.

Did the persistently disadvantaged have lower achievement in third grade than the transitorily disadvantaged? Third- and eighth-grade math test score gaps by number of ultimate years in disadvantage between kindergarten and eighth grade.

Did the persistently disadvantaged have lower achievement in previous grades than the transitorily disadvantaged? Third- through eighth-grade math test score gaps by number of ultimate years in disadvantage between kindergarten and eighth grade.
The slope of each line, by contrast, appears to capture fixed differences between children who spend more or fewer years in disadvantage. In third grade, children who will spend 9 years in economic disadvantage (and have already spent 4 years in disadvantage) during grade school score 0.84 standard deviations lower than children who will never be disadvantaged. By eighth grade, after they have spent nine grades in economic disadvantage, the gap is 0.94 standard deviations. Ninety percent of the gap is already in place as of third grade, when the linearity of the relationship between the gap and ultimate years spent in disadvantage is also already established.
These graphs clearly show that the linear relationship between years of disadvantage and test scores do not reflect a “dosage effect,” where dosage is measured by years spent in disadvantage. Rather, as we now show, years spent in disadvantage is correlated with the depth of a child’s economic disadvantage.
In kindergarten, children who will spend nine grades in economic disadvantage by eighth grade are already poorer than children who will spend just a few grades in economic disadvantage. We see this in the ECLS-K, where mean income falls with each additional year spent eligible for subsidized meals (see Figure 5). Among children who will never be eligible for subsidized meals, family income is an average of $112,000 in third grade (measured in real 2015 dollars). Among children who will be eligible for one grade, income is an average of about $64,000. Among children who will be eligible for five grades, income is an average of about $28,000. The relationship is nearly identical in eighth grade. 25

How does income vary over time by number of years eligible for subsidized meals?
These results indicate that the number of grades spent in economic disadvantage is a proxy for the level of income. This is consistent with family income moving in a random walk, drifting upward with each year. The poorest families have little chance of randomly moving above the cutoff for subsidized meals, so they will typically spend every grade eligible for subsidized meals. Families with slightly higher incomes might randomly move above the cutoff for one year. The closer a family’s permanent income is to the eligibility cutoff, the more likely it is to drift over in a given year.
Timing of Economic Disadvantage
We next determine whether there are differential associations between economic disadvantage and the achievement gap based on when a student was eligible for subsidized meals. For this analysis, we regress eighth-grade math standardized test scores on lagged indicators of disadvantage for each of the 9 years between kindergarten and eighth grade. Each indicator takes on the value of 1 if a student was eligible for subsidized meals in that grade and 0 otherwise. These categories are not mutually exclusive; a student who is always eligible for subsidized meals would have all nine indicators set to 1, whereas a student who is never eligible for subsidized meals would have all nine indicators set to 0. Results of this analysis are depicted in Appendix Figure A2, and the regression coefficients and standard errors are presented in Appendix Table A6.
We first regress test scores on the lagged indicators for subsidized-meal eligibility in each of the prior years unconditionally and then add controls for demographic characteristics and school fixed effects. In the uncontrolled model (top line), we find the largest correlates with the achievement gap are eligibility 9 years earlier (kindergarten) and the current year (eighth grade). After including controls for demographic characteristics, the association is attenuated, particularly for the indicator for eligibility in kindergarten, and school fixed effects further reduce the association between subsidized-meal eligibility and test scores. Once we control for school fixed effects, we still find that the strongest association between subsidized-meal eligibility and the size of the achievement gap is for students eligible for subsidized meals in eighth grade, followed by seventh grade.
We find a relatively flat association for eligibility prior to seventh grade, and the coefficient on eligibility in kindergarten drops considerably with the inclusion of school fixed effects. This implies that students who were eligible for subsidized meals in kindergarten attend lower-quality schools than students who were not eligible in kindergarten, and this partially explains the relationship between subsidized-meal eligibility in kindergarten and the achievement gap in eighth grade.
Changes in the Determination of Eligibility for Subsidized Meals
Eligibility standards for subsidized school meals are in motion. Federal community eligibility rules established in 2010 allow a school to provide free meals to all of its students if at least 40% are found to be individually eligible. 26 States and districts vary in the speed with which they have taken up this option. Some have stopped collecting information on student-level eligibility in schools that are community eligible (Michigan has not).
How does this affect the relevance of our analysis? For backward-looking evaluations using administrative data, the subsidized-meals indicator is still the only proxy for income. Our proposed measure is therefore relevant for researchers using such historical data. In any research that relies on data gathered since 2010, analysts should learn how eligibility for subsidized meals is determined in their sample schools and how the student-level variable for eligibility in their data is coded.
Going forward, states will increasingly use eligibility for federal means-tested programs (TANF, WIC, and food stamps) to automatically qualify students for subsidized meals. Adding indicators for eligibility for these programs to administrative data sets will keep these data sets relevant. Without student-level proxies for family income, researchers cannot calculate gaps in student outcomes, understand how program impacts differ by income, or reliably calculate value-added measures of teacher and school quality.
Once states and districts shift toward this new indicator of economic disadvantage, the insights of this paper will still be relevant. Educational outcomes will certainly be correlated with persistence in receipt of TANF, WIC, and food stamps, just as they are correlated with persistence in eligibility for subsidized meals. In future work, we will examine these correlations.
Discussion and Conclusion
Our findings have implications for researchers, policymakers, and practitioners. We have uncovered considerable heterogeneity within the population of children eligible for subsidized meals. Sixty percent of Michigan’s eighth graders were eligible for subsidized lunch at least once during their time in the public schools. But just a quarter of these children (14% of all eighth graders) were economically disadvantaged in every year between kindergarten and eighth grade.
These persistently disadvantaged children score nearly one standard deviation below students who were never disadvantaged. The conventional method of estimating this gap, which relies only on current eligibility for subsidized meals, yields a gap of 0.69 standard deviations.
The gap as defined by persistent disadvantage is comparable to that between children in the 90th and 10th percentiles of the family income distribution (Reardon, 2011). The gap as defined conventionally is comparable to that between children at the midpoint and top (or bottom) of the family income distribution (Reardon, 2011).
We find a negative, nearly linear relationship between scores and the number of grades spent in economic disadvantage. This relationship holds even after controlling for student demographics and school quality. The lower scores do not appear to be caused by more years spent in disadvantage; this relationship is almost identical in third grade, before children have been differentially exposed to five more years of economic disadvantage. Rather, as we show in a supplementary analysis with survey data, family income in a given year is negatively correlated with the number of years that a child will spend eligible for subsidized meals (see Figure 5).
While our results suggest that a child’s permanent family income may explain why children who were always eligible for subsidized meals perform worse on standardized tests than their peers who were never eligible, we cannot rule out other explanations. We are unable to observe potentially important family background characteristics in our administrative data. Survey data from the ECLS-K reveal that persistently disadvantaged children are more likely to live with a single parent, have more siblings residing in the household, and have lower-educated parents compared to never-disadvantaged children (see appendix table 5).
These factors may also explain some of the achievement gap between the persistently disadvantaged and the never disadvantaged. Children who live with single parents tend to have fewer economic resources than children living with both biological parents. They also experience more family transitions (e.g., parental divorce, repartnering, and remarriage) over their childhood than children living with both biological parents (Cherlin, 2010). Family transitions are correlated with lower child well-being, increased behavioral problems in adolescence, and increased likelihood of dropping out of school (Fomby & Cherlin, 2007; Goodnight et al., 2013; Pong & Ju, 2000). Differences in parental education may also explain the achievement gaps we find. Lower-educated parents are more likely to be unemployed, experience more job layoffs, and are more likely to work nonstandard hours (e.g., night shifts) than highly educated parents. These factors are negatively associated with child outcomes as well (Dunifon, Kalil, Crosby, & Su, 2013; Johnson, Kalil, & Dunifon, 2012; Kalil & Ziol-Guest, 2008).
Although we are unable to pinpoint specific mechanisms that explain why the always disadvantaged perform worse than the never disadvantaged, we can rule out some explanations. Our analysis reveals persistent differences in achievement after controlling for demographic characteristics of students, the schools they attend, and their prior achievement. These findings suggest that achievement differences between the persistently disadvantaged and the never disadvantaged are not entirely explained by racial and ethnic background or differences in school quality. In comparing achievement levels in third grade and eighth grade, we also determined that results are not driven by a “dosage” effect, where the time spent on subsidized lunch leads to a wider achievement gap. Ninety percent of the test score gap we observe in eighth grade between the persistently disadvantaged and the never disadvantaged is present by third grade. This suggests that there are unobservable differences between students who will receive subsidized meals for 9 years compared to students who receive subsidized meals for fewer years, and these differences are present by third grade. Whether these unobserved differences are due to permanent family income, family structure, parental education, or other factors is a fruitful area for future research.
Researchers can use our proposed measure to better estimate value added and to estimate causal effects. A value-added measure that does not account for differences between current disadvantage and persistent disadvantage will be systematically biased against the teachers and schools of persistently disadvantaged children. In calculating measures of teacher and school effectiveness, controlling for persistent disadvantage will better capture variation in students’ baseline characteristics.
Policymakers and practitioners can use our proposed measure to better target resources intended to support the most disadvantaged children. Schools with identical shares of currently disadvantaged children may have widely differing shares of persistently disadvantaged children. In Michigan, as in many states, there are many schools in which all children are eligible for subsidized meals. In Michigan schools where 100% of eighth graders are currently disadvantaged, the concentration of persistent disadvantage varies from 18% to 86% (see Figure 6). The conventional measure of economic disadvantage (current eligibility for subsidized meals) provides no traction in differentiating between these schools or between classrooms within these schools. Our proposed measure of persistent disadvantage allows for finer distinctions between schools and classrooms, allowing for better targeting of scarce resources.
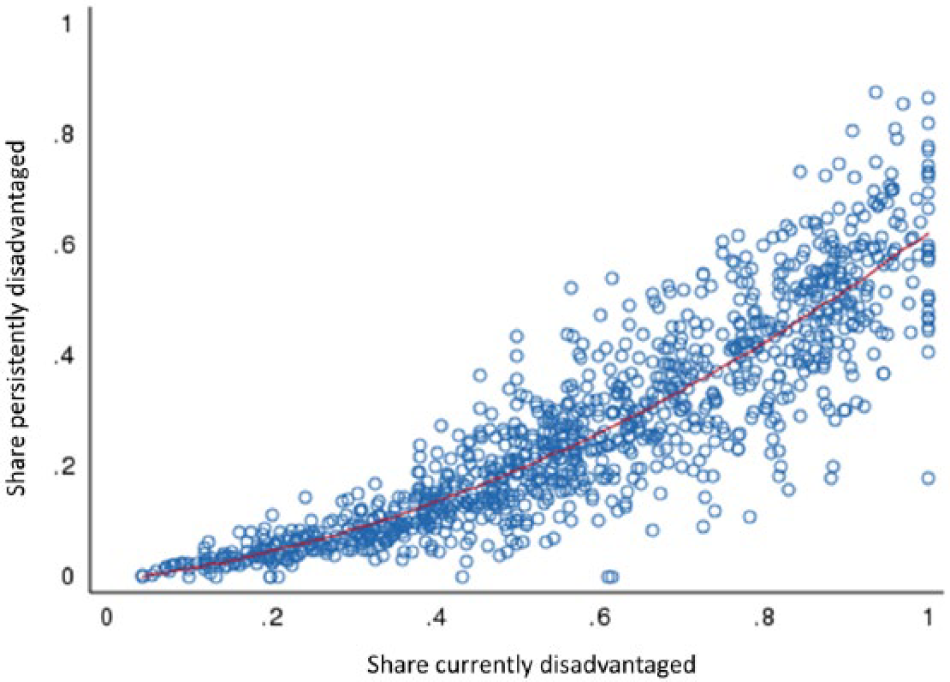
School-level share of eighth graders currently disadvantaged versus share persistently disadvantaged.
Footnotes
Data Appendix
This research uses data structured and maintained by the Michigan Consortium for Educational Research (MCER). MCER data are modified for analysis using rules governed by MCER and are not identical to data collected and maintained by the Michigan Department of Education (MDE) and the Michigan Center for Educational Performance and Information (CEPI). Results, information and opinions are the authors’ and do not reflect the views or positions of MDE or CEPI.
Data are drawn from the Single Record Student Database (SRSD); the Michigan Student Data System (MSDS), which replaced the SRSD in 2010; and the Michigan Educational Assessment Program (MEAP) database. The SRSD and MSDS provide annual information on student demographics, such as race, gender, subsidized-meal eligibility, special education status, limited-English-proficiency status, and migrant status. It also contains information on the grade level and schools a student attended each year since the 2002–2003 school year. The MEAP provides information on standardized test scores in a variety of subject-grade combinations. Students in Michigan are tested in third through eighth grades and again in 11th grade.
We limit the sample to students who were in eighth grade between the 2010–2011 and 2012–2013 school years and had valid eighth-grade math test scores (341,133 observations). We do not restrict the sample to first-time eighth graders, so some students may have repeated a grade in a prior year. We exclude students who did not have a seventh-grade math test score (12,974 observations), which we use to control for prior achievement in some analyses. We also exclude students without a valid school identifier in eighth grade (9,537 observations). To maximize our sample size, we make no further restrictions on whether the student was present in the Michigan public school system for the 9 years between kindergarten and eighth grade (Appendix Table A7 shows a frequency table for the share of eighth graders present in the data for the full 9 years, separately by subsidized-meal status in eighth grade). Among all eighth graders in our analysis, 76% were present in all 9 years, and 86% were present for at least 8 years. Students eligible for subsidized meals in eighth grade were slightly less likely to be in the Michigan public school system for 9 years (74% compared to 78% of non-eligible eighth graders).
In regressions, we include an indicator for whether a student was not in the Michigan public school system for all 9 years. These students typically had lower math test scores, on the order of 0.01 to 0.06 of a standard deviation. Results are nearly identical if we instead limit the sample to students present in Michigan public schools in all grades from kindergarten through eighth grade.
Acknowledgements
We thank our partners at the Michigan Department of Education (MDE) and Michigan’s Center for Educational Performance and Information (CEPI) for providing the data used in these analyses, especially Erika Bolig, Thomas Howell, and Venessa Keesler. We thank Mónica Hernandez, Amy Schwartz, and seminar participants at Aarhus University, University of California–Santa Barbara, University of Chicago, University of Southern California, University of Michigan, University of Wisconsin, and the Institute for Research on Poverty Summer Research Workshop for providing helpful comments. The Institute of Education Sciences, U.S. Department of Education, provided support through Grants R305E100008 and R305B110001. This research uses data structured and maintained by the Michigan Consortium for Educational Research (MCER). MCER data are modified for analysis using rules governed by MCER and are not identical to data collected and maintained by MDE and CEPI. Results, information, and opinions are the authors’ and do not reflect the views or positions of MDE or CEPI.
1.
2.
See Duncan and Brooks-Gunn (1997); Duncan, Magnuson, Kalil, and Ziol-Guest (2012); Duncan and Murnane (2011); or ![]() for a review of this literature.
for a review of this literature.
3.
See, for example, Duncan, Brooks-Gunn, and Klebanov (1994); Haveman, Wolfe, and Spaulding (1991); Ku and Plotnick (2003); National Institute of Child Health and Human Development Early Child Care Research Network (2005); Potter and Roksa (2013); Rothstein and Wozny (2013); and Wolfe, Haveman, Ginther, and An (1996).
4.
Meyer, Mok, and Sullivan (2015) and ![]() show that nonresponse and attrition are increasingly common in household surveys.
show that nonresponse and attrition are increasingly common in household surveys.
5.
We use a household survey, the Early Childhood Longitudinal Study, in this supplementary analysis. Our findings are consistent with income following a random walk, with drift: Families with very low permanent incomes are unlikely to randomly cross the eligibility threshold for subsidized meals, whereas those with slightly higher incomes will randomly do so in some years.
7.
See Ashworth, Hill, and Walker (1994); Bane and Ellwood (1986); and Cellini, McKernan, and Ratcliffe (2008). ![]() find that whereas incidence of chronic poverty in childhood was relatively uncommon among children in the Panel Study of Income Dynamics in the late 1960s and 1970s, approximately half of all children experienced economic hardship at some point during childhood.
find that whereas incidence of chronic poverty in childhood was relatively uncommon among children in the Panel Study of Income Dynamics in the late 1960s and 1970s, approximately half of all children experienced economic hardship at some point during childhood.
8.
See Duncan and Magnuson (2011); Fryer and Levitt (2004); Magnuson and Duncan (2006); Heckman, Moon, Pinto, Savelyev, and Yavitz (2010); Duncan et al. (1994, 2012); Haveman et al. (1991); Ku and Plotnick (2003); Peters and Mullis (1997); Petterson and Albers (2001); Rothstein and Wozny (2013); Smith, Brooks-Gunn, and Klebanov (1997); ![]() .
.
9.
11.
The National School Lunch Program uses the federal poverty guideline, which differs slightly from the federal poverty threshold. The federal poverty threshold has different settings depending on whether the additional family members are children or not, whereas the guidelines make no such distinction. See ![]() for more information.
for more information.
12.
These are the income cutoffs in the 48 contiguous states. Separate guidelines are established for Alaska and Hawaii. See http://aspe.hhs.gov/poverty-guidelines for details. Take-up in social welfare programs is correlated with attributes that determine social outcomes (Currie, 2004). Research shows that some students receiving subsidized meals have income above the program cutoff (Harwell & LeBeau, 2010; Hauser, 1994; Kurki, Boyle, & Aladjem, 2005; Newman & Ralston, 2006; Randolph & Prejean-Harris, 2014). This finding is in part due to the eligibility rules: Eligibility is determined by a single month’s income. Once a student is certified, she or he maintains eligibility for the entire calendar year, even if her or his household income rises over the course of the year.
13.
The income cutoff for food stamps is 130% of poverty (U.S. Department of Education, 2012), and for the Women, Infants, and Children Program, it is 185% of poverty (http://www.fns.usda.gov/wic/wic-income-eligibility-guidelines). The income thresholds for Temporary Assistance for Needy Families vary by state; in more than half of states, it is $9,540 a year for a single parent of two children in 2012 (Falk, 2014). Michigan required monthly income to be less than $814 for a single parent with two children as of 2012. There are no income requirements for foster care.
14.
Results are quite similar if we focus on an earlier cohort, for example, those in eighth grade during the 2009–2010 school year. See Appendix Table A1. Patterns are also quite similar if we analyze students in other grades; see ![]() .
.
16.
17.
Patterns are quite similar for other subject areas.
18.
19.
In order to be considered “persistently disadvantaged,” students must be present in the data set for all 9 years. Students who were not present for all 9 years and had at least 1 year of subsidized meal eligibility are automatically considered “transitorily disadvantaged.” Our results are not sensitive to this decision, changing little when we restrict the sample to students observed for the full 9 years (see ![]() ).
).
20.
We also create measures based on kindergarten-through-fifth-grade eligibility, third-through-eighth-grade eligibility, and fifth-through-eighth-grade eligibility. See Appendix Figure A1 and ![]() .
.
21.
Some administrative data sets include a variable that distinguishes between eligibility for free versus reduced-price meals. Since not all researchers have this variable, we do not focus on it in our analysis. In Michigan, almost all children (85%) eligible for a subsidized meal are eligible for a free meal; our results therefore change little if we focus on the free-meal children (see ![]() ).
).
22.
Table 3 shows a substantial gap within schools between disadvantaged and nondisadvantaged children. This contrasts with the Black-White gap, which, as shown by ![]() , is largely eliminated by school fixed effects.
, is largely eliminated by school fixed effects.
23.
Median household income data come from a 5-year sample of the American Community Survey from 2010 to 2014. In an alternative specification, we included zip code fixed effects, which produced very similar results to those presented here. Results not shown but available upon request.
24.
As in all previous regressions, we include a dummy that indicates whether a child was not observed in Michigan public schools during one or more grades. Results are similar when the sample is limited to a balanced panel of children enrolled in every grade from kindergarten through eighth grade.
25.
Family income is measured in 13 income categories, ranging from less than $5,000 to more than $200,000. We assigned the midpoint of each category for this analysis. All dollars are reported in 2015 real dollars using the Consumer Price Index.
26.
Authors
KATHERINE MICHELMORE is an assistant professor of public administration and international affairs at Syracuse University’s Maxwell School as well as a senior research associate at the Center for Policy Research at Syracuse University. Her research focuses on evaluating socioeconomic differences in life course processes, such as educational attainment and family formation, and evaluating the impact of U.S. social policies in affecting these differences.
SUSAN DYNARSKI is a professor of public policy, education, and economics at the University of Michigan, where she holds appointments at the Gerald R. Ford School of Public Policy, School of Education, Department of Economics, and Institute for Social Research and serves as codirector of the Education Policy Initiative. Her research focuses on the effectiveness of charter schools, the optimal design of financial aid, the price elasticity of private school attendance, the relationship between postsecondary schooling and labor market outcomes, and the effect of high school reforms on academic achievement and educational attainment.