
Abstract
Since its entry into the Programme for International Student Assessment (PISA) in 2009, the Chinese province of Shanghai has been the top-performing economy within these international rankings. Many have interpreted this as demonstrating how Shanghai has a “world class” education system, the most effective teaching methods, and the best schools. This article questions such interpretations of the PISA results. Specifically, we argue that statements about school and school system quality require information on the progress that children make during their time at school, which the PISA rankings do not provide (at least not directly). Our empirical analysis then uses a “fuzzy” regression discontinuity design approach to demonstrate how a rather different perspective of Shanghai’s performance in PISA emerges once pupils’ academic progress over one particular school year is considered. Our key finding is that the first year of upper secondary school in Shanghai adds essentially no value (on average) to children’s PISA reading, science, and mathematics test scores.
The Programme for International Student Assessment (PISA) is an important cross-national study of 15-year-olds’ academic achievement. PISA is conducted by the Organisation for Economic Co-Operation and Development (OECD) every 3 years, and the results now routinely attract significant academic, media, and political attention. Policy makers worldwide have shown particular interest in the exceptionally strong performance of Shanghai since its entry into PISA in 2009. This Chinese province has been listed at the top of the PISA reading, science, and mathematics rankings, even extending its lead over most Western economies between 2009 and 2012. Consequently, there is now widespread belief that Shanghai has the best schools and the most effective education system in the world. This notion has been actively promoted by the OECD, with Andreas Schleicher (2013), director of education and skills at the OECD, arguing that the PISA rankings demonstrate “what Asian schools can teach the rest of the world” (our emphasis).
But does PISA provide any hard evidence that Shanghai does indeed have the best schooling system in the world? In reality, PISA headline findings do not provide the answer. Why? Because PISA and other similar studies are based on only cross-sectional data, documenting the skills of school pupils in a limited range of subjects at a single point in time (age 15). Children’s achievement on this test will therefore be influenced by a range of factors (e.g., parents, peers, family, and community), many of which are likely to operate even before children have started school. In other words, there are likely to be significant differences across countries in children’s knowledge and skills even before the schooling system has been involved. Consequently, before anything meaningful can be said about school system quality and how this may vary across countries, it is the academic progress that children make that needs to be measured. Without doing so, isolating the impact of schools on children’s achievement is almost impossible. 1
This observation then leads to an interesting question. How much progress do children in the “world’s best schooling system” of Shanghai really make? The OECD (2010, p. 167) has presented a basic analysis of how an additional year of schooling influences children’s PISA test scores. By estimating a simple multilevel model, including controls for just gender, immigrant status, and socioeconomic status, it found that an additional year of schooling is approximately equal to 40 PISA test points in the average OECD country. 2 However, it also suggested that pupil progress may differ significantly across international jurisdictions. This is illustrated in Figure 1, which plots mean PISA 2009 reading scores on the x-axis against the OECD estimates of pupil progress on the y-axis. Interestingly, despite Shanghai’s impressive average PISA reading score, 15- to 16-year-olds in this economy actually make relatively little academic progress (at least during this particular school year—between Grades 9 and 10). The same also seems to hold true for other East Asian economies, such as Chinese Taipei.

The relationship between mean Programme for International Student Assessment (PISA) reading scores and pupil progress in reading between age 15 and 16 years: evidence from the Organisation for Economic Co-Operation and Development (OECD). Note. Author-produced figure based on data drawn from OECD (2010, p. 169). Sample restricted to OECD and high-performing East Asian jurisdictions only. QC = Shanghai; TP = Chinese Taipei.
However, as noted by Benton (2014), the existing analysis conducted by the OECD has a number of limitations. In particular, the results presented by the OECD do “not differentiate between the effect of additional schooling and the effect of pupil age,” and “failing to account for the effect of age may lead to an overestimation of the relationship between additional schooling and performance” (p. 2). The OECD (2015) noted the limitations of the existing analysis itself but indicated that “regression discontinuity models can be used to enhance the estimation of the effect of one year of schooling” (para. 41).
The aim of this article is therefore to start to provide some robust evidence on the extent to which children in two “world leading” education systems make academic progress. Using PISA 2009 and 2012 data, we apply a “fuzzy” regression discontinuity design (RDD) approach to estimate the “value added” by the Shanghai and Chinese Taipei education systems over one particular school year (the first year of upper secondary school). As a result of the sampling scheme used by PISA in these jurisdictions, individuals take part in the study across two academic grades. By comparing individuals who are very similar in age but within different school grades, it is possible to tease apart the impact of an additional year of schooling in these jurisdictions from other potentially important factors (e.g., being older at the time when taking the test). Other authors have used a similar methodology to estimate the progress made over one school year in England (e.g., Benton, 2014; Luyten, Peschar, & Coe, 2008). Our work builds on this previous evidence by presenting evidence of the progress children make in two “world leading” education systems between Grades 9 and 10, as they move from lower to upper secondary school.
We exploit this discontinuity to instrument the number of years of education that pupils have received. This allows us to estimate the causal impact of this additional year of schooling due to the essentially random timing of an individual’s birth on one side of the discontinuity rather than the other. Our analysis produces a striking result—the first year of upper secondary school in these two jurisdictions leads to essentially no increase in children’s reading, science, or mathematics PISA test scores. As well as testing the assumptions of a fuzzy RDD using the steps suggested by Imbens and Lemieux (2008), we explore and reject alternative explanations—including grade repetition and advancement (the reason why we employ a fuzzy, rather than “sharp,” RDD), differences in age of school entry (as pupils in a lower grade could also be disadvantaged by starting school later), relative age effects (having lower test scores due to being younger than one’s school peers), ceiling effects (that all pupils in Shanghai and Taipei achieve the maximum possible score on the test), and a lack of statistical power.
This finding does, of course, require careful interpretation. The stringent requirements of our statistical approach means that we are unable to compare results for Shanghai with those for any Western economy. Moreover, we are able to estimate progress made only by Shanghai children over one particular secondary school year, as children move from lower to upper secondary education around age 15. We are therefore unable to rule out the possibility that children in Shanghai make exceptional progress during an earlier educational phase (e.g., primary school). However, this does not detract from the central message of the article: that, without a measure of pupil progress, PISA cannot provide robust evidence on the impact of teaching methods, schools, and school systems, so we cannot use it to deduce which country or economy has the “best” education system, the most effective teachers, and the strongest schools.
The article proceeds as follows. The PISA data are described in the next section, with an overview of our statistical methodology to follow. Results are then presented, followed by conclusions and recommendations.
Data
PISA is designed to represent a sample of 15-year-olds within each participating economy. A stratified clustered sample design is used, with at least 150 schools selected as the primary sampling unit. A total of 30 children aged from 15 years 3 months to 16 years 2 months are then randomly selected from within each school. In this article, we focus on the PISA data for Shanghai and Chinese Taipei; since the PISA sample design differs across countries, these the only two economies where our statistical methodology can be successfully applied (see next section for further details). Note that we have included Chinese Taipei in our analysis as well as Shanghai, as it is another highly ranked East Asian education system. We therefore want to establish whether our results hold within this setting as well.
Due to the sampling date, children participating within PISA in Shanghai and Chinese Taipei are born within the same calendar year. As the academic year in these jurisdictions typically starts in September, PISA participants in Shanghai and Chinese Taipei span two school grades: Grade 9 (September to December born) and Grade 10 (January to August born). This is key to the statistical approach that we outline in the next section, where we focus on August- and September-born children, who are almost identical in absolute age when they sit the PISA test but differ in terms of their current school grade. As we focus on children born in these particular 2 months, we pool data across PISA 2009 and 2012 to maximize statistical power. Note that it is not possible to use a fuzzy RDD to estimate progress in other countries, such as England, where all the children participating in PISA belong to the same school grade. 3
The transition between Grades 9 and 10 represents a critical point within the Shanghai education system. In particular, it represents the age when children make the transition from completing a general lower secondary school program to following either an academic or vocational school track. 4 A similar transition between “junior” and “senior” high school occurs in Chinese Taipei. All our estimates therefore refer specifically to the impact that this particular academic year has on children’s PISA test scores. The total sample size used in our analysis for Shanghai is 1,762 (858 children born in August and 904 in September), while the total sample size in Chinese Taipei is 2,020 (1,057 born in August and 963 born in September). 5
As part of the PISA study, children sit a 2-hour test in reading, science, and mathematics. Their responses to the test questions are then converted into a scale via an item-response theory model. The intuition behind the model is that young people’s true ability in a subject cannot be directly observed and so must therefore be estimated from the answers that they provide on the test. This results in five plausible values within each academic domain; each refers to a different possible estimate of children’s achievement. The mean PISA score across OECD countries is approximately 500, with an international standard deviation of approximately 100. We follow recommended practice when analyzing these data, estimating all models five times (once with each plausible value) and then taking an average of the results (OECD, 2009). To account for the complex survey design and to adjust estimates for the small amount of nonresponse, the final PISA student and replication weights are applied throughout our analysis. This is implemented with the Stata command “repest” (Avvisati & Keslair, 2014).
Methodology
Our analysis uses a fuzzy RDD approach to estimate the impact of an additional year of schooling in Shanghai and Chinese Taipei on children’s PISA scores. It has many similarities to the method used by Luyten et al. (2008) and Benton (2014), which was based on sharp RDD to estimate the progress made by children in England over one school year, according to data from PISA 2000 and 2003. 6 The key difference is that our approach allows for the fact that not all individuals in these jurisdictions are in the school year that their month of birth would suggest.
The intuition behind the RDD methodology is as follows. If there is an effect of 1 year of schooling, a sharp drop in average PISA scores is expected to occur between pupils born in August and September. The reason is that August-born children in Shanghai have been exposed to the first year of upper secondary school (Grade 10), while their September-born peers have not (they are still in Grade 9). As noted by Luyten et al. (2008) and Benton (2014), it is this kink between August- and September-born children that provides an estimate of the progress that young people in Shanghai make during this particular school year.
Within this context, a sharp RDD refers to where month of birth perfectly predicts the school grade to which a child belongs. For instance, all August-born children would be found in Grade 10, while all September-born children would be within Grade 9. In this situation, one could simply compare average scores for August- and September-born children to estimate the impact of an additional year of schooling. The same basic intuition holds for a fuzzy RDD, although with the additional complication that some August- and September-born children have crossed over into a different grade. In other words, month of birth is strongly associated with, but does not perfectly predict, children’s school year group.
The RDD within Shanghai and Chinese Taipei is fuzzy rather than sharp, as in both instances, some children are found within the “wrong” school grade (Figure 2). For instance, in Shanghai (Chinese Taipei), 15% (1%) of August-born children are found in Grade 9, when according to their month of birth, they “should” be in Grade 10 (i.e., children in Shanghai are more likely to be held back than children in Chinese Taipei). Similarly, 20% (16%) of September-born children are in Grade 10, when their month of birth implies that they should be in Grade 9. Such movement of August- and September-born children into a higher or lower grade could be the result of grade repetition, grade advancement, or “red-shirting” (parents delaying when their child starts school). Whatever the reason, the key implication is that school grade is self-selected for a small proportion of children, rather than being purely determined by their month of birth.

Probability of assignment to Grade 8 by month of birth: (a) Shanghai and (b) Chinese Taipei.
The fuzzy RDD approach that we use attempts to abstract from this issue. It is an instrumental variable procedure whereby month of birth acts as the instrument for children’s school grade. The ability of this procedure to provide an unbiased estimate of the impact of an additional year of schooling rests on a set of assumptions, as outlined by Imbens and Lemieux (2008) and Lee and Lemieux (2010). These articles set out a series of investigations and tests that researchers should perform to confirm that the strict assumptions underpinning the fuzzy RDD approach are met. A full run-through of the checklist set out by Imbens and Lemieux is provided in Appendix A. A summary of the key points from this appendix are as follows.
First, in a fuzzy RDD, the running variable (month of birth in our application) should strongly predict whether the individual receives the treatment (being in school Grade 9 or 10). We find strong support for this assumption, as illustrated by Figure 2. Second, whether a child is born in August or September should be as good as randomly assigned so that month of birth affects test scores only through the grade that children are in. 7 This, in turn, means that there should be little difference between August- and September-born children in terms of demographic characteristics. We test this assumption by comparing August- and September-born children in terms of 50 variables and find few statistically significant differences (see the online Tables A1 and A2 for further details). Third, there should be no evidence that parents are able to precisely manipulate children’s birth date so that they are more likely to be born in August than September (or vice versa). Again, we find little evidence that this occurs in either Chinese Taipei or Shanghai (see Figure A5). Finally, the robustness of all estimates from an RDD should be robust to extending the bandwidth around the discontinuity. In our application, this means that the results from comparing children born within 2 months of the cutoff date (e.g., comparing July/August with September/October) should be the same as those based on just 1 month (i.e., just comparing August with September-born children), which we find that they are (see next section). Therefore, after undertaking this set of investigations, we are confident that a fuzzy RDD is a credible strategy for estimating the impact of an additional year of schooling in Shanghai.
To implement this procedure, we use two-stage least squares. We begin by restricting the sample to individuals within close proximity of the discontinuity (i.e., to August- and September-born children). A first-stage model is then estimated, where the instrumented variable (children’s school grade) is regressed on the instrument (month of birth) along with other relevant background variables:

where grade = a binary indicator of school grade at the time of the PISA test (0 = Grade 9 and 1 = Grade 10), month = whether the child is born in August or September, and demographics = a set of background characteristics.
These first-stage estimates are presented in Table 1.
8
Predicted values of children’s school grade are then generated from Equation 1 (

where
First-Stage Regression Parameter Estimates

Note. Figures refer to results from the first stage of the instrumental variable regression. In this regression, grade is regressed on month of birth and pupil’s background characteristics. These estimates are from the baseline model specification (see Table 2). Results for first-stage estimation without controls are reported in Appendix B.
The parameter
To conclude this section, we briefly discuss why it has not been possible to use this methodology in other participating PISA nations. First, in some countries (e.g., England), children included in the PISA sample are drawn from only one school grade (e.g., all children are within “Year 11”). This means that the RDD approach is impossible to implement, since there are no individuals from the grade below (“Year 10”) with whom to compare performance. Second, in a number of countries, birth month is a much weaker predictor of school grade. In such instances, the first-stage regression (Equation 1) produces more uncertain predictions, meaning that statistical power is low, providing little prospect of detecting an effect even if one is present. Third, in some countries (e.g., Northern Ireland), children on either side of an apparent discontinuity differ in terms of observable characteristics. Hence, a key assumption of the RDD approach is violated, as demonstrated for Shanghai and Chinese Taipei in Appendix A. Finally, in a number of economies, grade retention is common and, even more important, seems to differ by month of birth (e.g., Finland). This again leads to important technical challenges when implementing and interpreting results from an RDD. 10 Consequently, Shanghai and Chinese Taipei are the only two PISA participants for whom we believe that our statistical design is appropriate and where it can be implemented effectively.
Results
Descriptive Analysis and Baseline Estimates
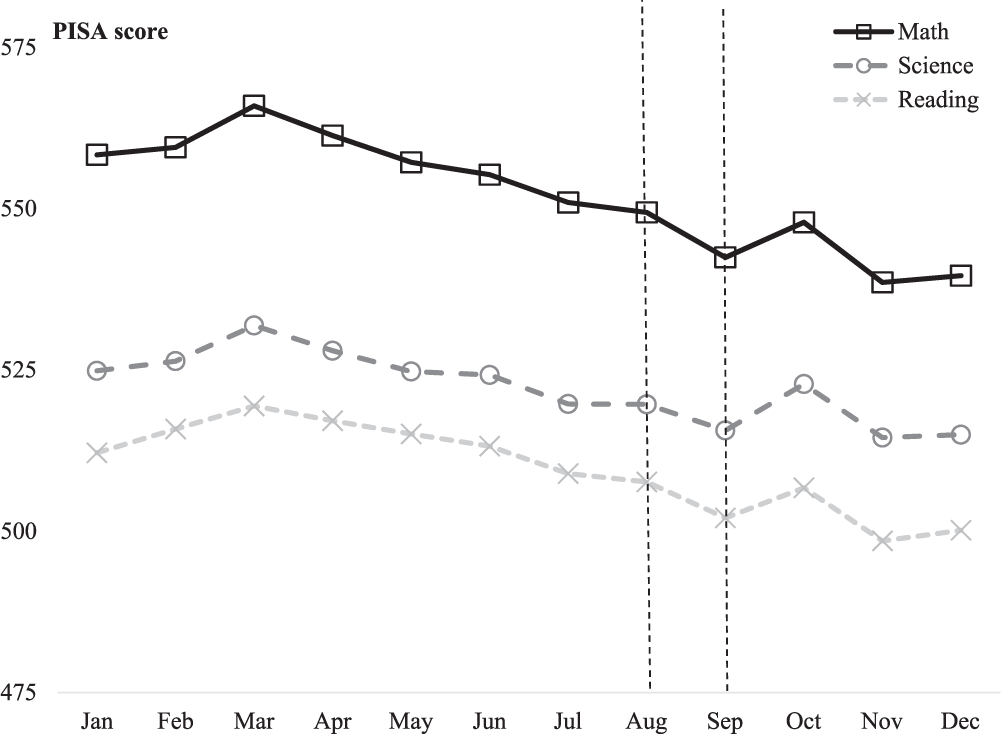
Figure 3 illustrates the raw association between month of birth and average PISA test scores in Shanghai. Analogous results for Chinese Taipei can be found in Figure 4. The dashed vertical lines illustrate the discontinuity where one might expect a big difference in PISA scores between children born in August and September; yet, there is little evidence that this is the case. In Shanghai, the link between birth month and average PISA scores is essentially flat. Similarly, there is no obvious sharp decline in PISA scores in Chinese Taipei around the discontinuity. Figures 3 and 4 therefore provide the first suggestion that children in these “world leading” education systems actually make rather little progress in reading, mathematics, and science between Grade 9 (the final year of lower secondary school) and Grade 10 (the first year of upper secondary school).

Association between month of birth and children’s mean Programme for International Student Assessment (PISA) test scores in Shanghai. Note. Authors’ calculations based on the pooled PISA 2009 and 2012 data sets.
Association between month of birth and children’s Programme for International Student Assessment (PISA) scores in Chinese Taipei. Note. Authors’ calculations based on the pooled PISA 2009 and 2012 data sets.
These findings are formalized in Table 2, which presents our baseline fuzzy RDD estimates. These results are from a conditional RDD model including the controls detailed in the previous section. Alternative unconditional RDD estimates are reported in Appendix B, with little substantive difference with the results presented in the main body of the article.
Baseline Fuzzy Regression Discontinuity Design Estimates of the Impact of an Additional Year of Schooling on Children’s PISA Test Scores

Note. Authors’ calculations based on the pooled PISA 2009 and 2012 data sets. Beta provides the estimated impact of an additional year of upper secondary schooling on children’s PISA test scores. Control variables included are household wealth, immigrant status, gender, 2009/2012 dummy, father labor market status, Internet access at home, computer at home, software at home, textbooks at home, number of cars parents own, number of phones at home, and number of books at home. Sample restricted to children born in August and September. PISA = Programme for International Student Assessment.
p < .10.
Table 2 shows that the first year of upper secondary schooling in Shanghai leads to an increase of 12 points (0.12 SD) in PISA mathematics, 8.5 points (0.085 SD) in reading, and 2.9 points (0.03 SD) in science. Similar but smaller results are found for Chinese Taipei. Effects of this magnitude are typically considered small, with statistical significance rarely reached at conventional levels (the only exception is mathematics in Shanghai, which reaches statistical significance at the 10% level). Overall, our baseline estimates suggest that the first year of upper secondary school in Shanghai and Chinese Taipei has little impact (on average) on children’s reading, science, and mathematics skills.
It is instructive to compare our findings with those of others who have used a similar approach to estimate the effect of schooling. Benton (2014) also found small effects of schooling for England, applying a regression discontinuity approach to PISA data from earlier years when the design was appropriate. By contrast, Luyten (2006) found larger effects from applying the approach to data from late primary schools (around age 9) in the Trends in Mathematics and Science Study, while Luyten, Tymms, and Jones (2009) found the same in early primary school (around age 5) using data from Performance Indicators in Primary Schools. Using a different approach, Jerrim and Choi (2014) attempted to measure the relative progress that children make during secondary school in a number of countries, based on data from PISA and the Trends in Mathematics and Science Study. Their key finding is that there is little evidence that pupils in East Asian countries make more academic progress during secondary school (between ages 10 and 16) than pupils in many Western countries, such as England. In other words, East Asia already has a sizable academic lead over the West at the end of primary school, which is then maintained (but not increased) during secondary school. They consequently concluded that East Asian educational success is likely to be driven by factors that have an impact on pupils’ achievement before age 10.
What About Grade Repetition and Grade Skipping?
In the subsections that follow, we investigate a series of alternative explanations for this null result. First, issues surrounding grade repetition and skipping are explored. These could bias our results since they clearly affect the number of years of schooling that an individual has received but are far from randomly allocated: Those who repeat grades are likely to be among the lowest achievers, while those who skip them are among the highest. If not dealt with by the identification strategy, they could both attenuate the estimated effect of schooling due to grade repeaters performing less well despite having more schooling and vice versa for grade skippers.
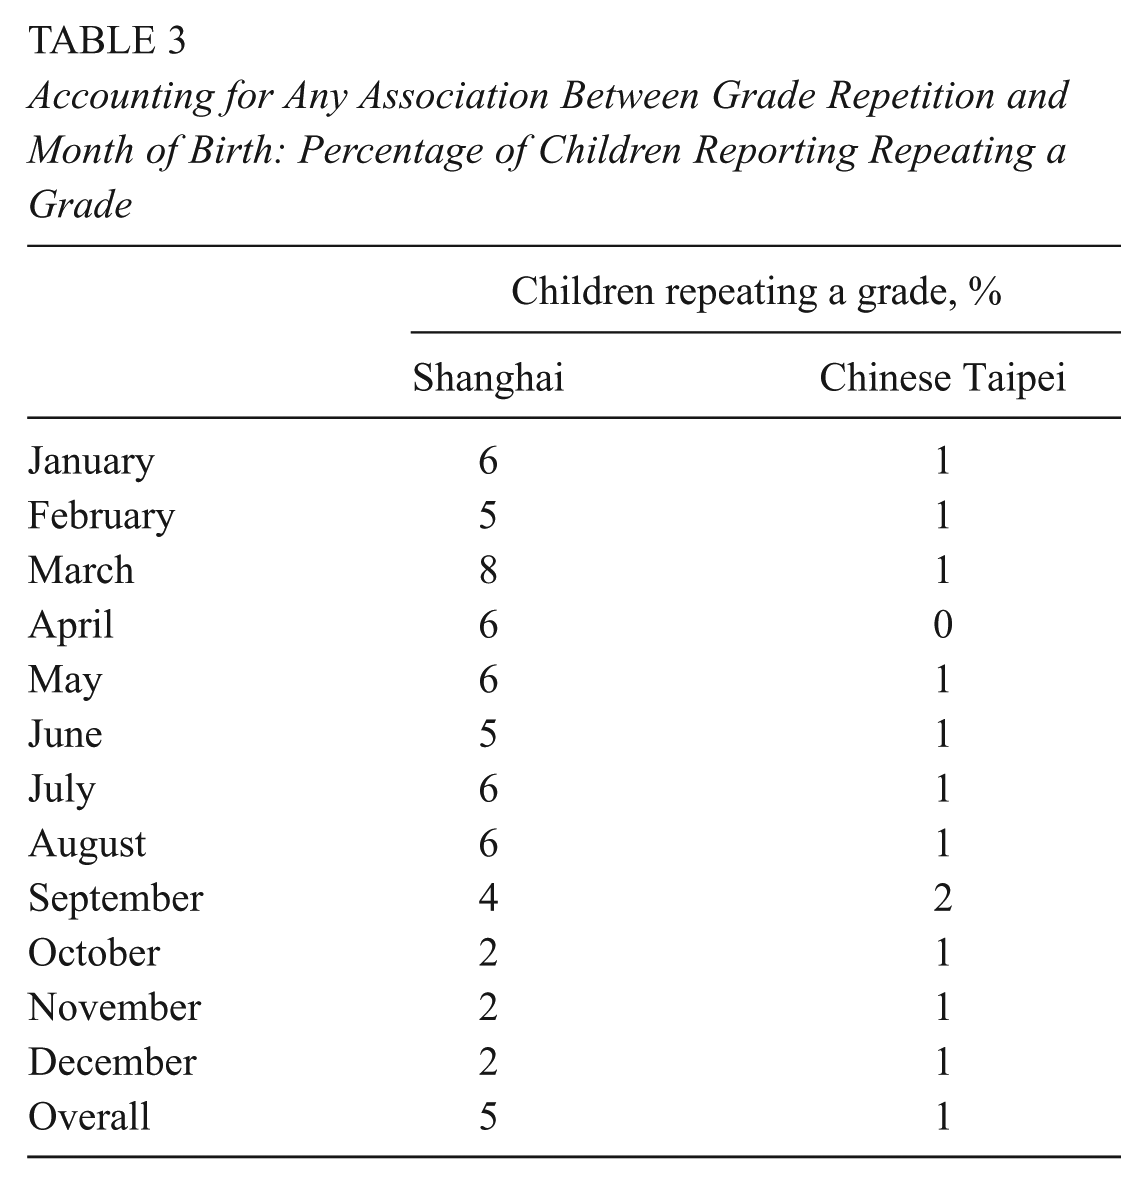
It is worth noting that our fuzzy RDD approach should have already dealt with issues surrounding grade advancement and repetition (a key feature of this design is that it accounts for the fact that some children may be within a higher or lower school grade than they should be for their age). We nevertheless conduct an additional analysis after including a control for grade repetition, to further illustrate the robustness of our results. (It is not possible to also include a control for grade advancement, as pupils are not asked to report this information as part of the PISA study). Table 3 presents, by month of birth, the proportion of children who repeated a grade, as reported in the PISA background questionnaire. Two key features stand out. First, reported grade repetition is low in both Shanghai (5% of pupils) and Chinese Taipei (1%). Second, there is little evidence that the probability of repeating a grade differs greatly between children born in August and September. Together, this suggests that grade repetition is unlikely to have a major impact on our substantive results.
Accounting for Any Association Between Grade Repetition and Month of Birth: Percentage of Children Reporting Repeating a Grade
We investigate this proposition formally in Table 4. This replicates our baseline estimates (presented in Table 2) but now also includes an additional control for grade repetition. As expected, our substantive findings are very similar to before. In both Shanghai and Chinese Taipei, the impact of an additional year of schooling is usually <10 PISA test points (0.10 SD) within each PISA domain. Moreover, statistical significance is reached only once (mathematics in Shanghai) and even then at only the 10% level. These results therefore support our previous conclusion: In these economies, the first year of upper secondary schooling has little impact on children’s reading, science, and mathematics skills.
Accounting for Any Association Between Grade Repetition and Month of Birth: Fuzzy Regression Discontinuity Design Estimates Controlling for Possible Differences

Note. See notes to Table 2. An additional control variable has been added for grade repetition.
p < .10.
What About Differences in Age of School Entry?
In a recent article, Crawford, Dearden, and Greaves (2014) explore a number of mechanisms through which birth month may be associated with later educational outcomes. They note that children born on either side of a discontinuity may start school at different ages. This could, in turn, advantage or disadvantage children born in one month (e.g., August) versus another (e.g., September). With respect to this article, an “age of starting school” effect could therefore be confounding our results.
As part of the PISA background questionnaire, children were asked to report (a) the age at which they started school and (b) whether they attended a preschool. Descriptive statistics are reported by month of birth in Table 5. There is little evidence that preschool attendance is associated with month of birth in either Chinese Taipei or Shanghai. However, there is a link between birth month and the age when children started school. Specifically, August-born children in Shanghai entered school at an average age of 6.6 years, compared with 6.9 years for their September-born peers. The analogous figures are 6.7 years (August born) and 7.1 years (September born) in Chinese Taipei. In other words, children born in August have not only completed an additional year of school but also began formal education at a slightly younger age.
Preschool Attendance, Age of Starting School, and Month of Birth: Descriptive Statistics

How do our results change once this has been taken into account? Table 6 replicates the analysis presented in the previous subsection (see Table 4) but now includes additional controls for preschool attendance and the age when children started school. Interestingly, evidence of a null result is actually strengthened. Point estimates in both Shanghai and Chinese Taipei have declined as compared with the previous subsection and are now ≤6 PISA test points (0.06 SD). This holds true in both economies and across each PISA domain. Indeed, point estimates are now sometimes even <0 and are statistically insignificant at conventional thresholds for both economies and all domains. Therefore, accounting for possible differences in age of school entry has served only to strengthen our previous results.
Preschool Attendance, Age of Starting School, and Month of Birth: Fuzzy Regression Discontinuity Design Estimates Controlling for Possible Differences

Note. See notes to Table 2. Additional control variables have been added for grade repetition, preschool attendance, and age of school entry.
What About Relative Age Effects?
Crawford et al. (2014) also raised the possibility that children born in different months may differ in terms of their relative age when compared with other children in their school grade. With respect to this article, this means that August-born children are the youngest within Grade 10, while September-born children are the oldest within Grade 9. Previous research has suggested that this may disadvantage the former relative to the latter in terms of their educational attainment and development. For instance, being the youngest within a grade may mean that a child is more likely to be bullied (Department for Education 2010) and develop lower levels of academic self-concept and self-esteem (Crawford et al., 2014). If this continues to hold true at age 15, such factors may attenuate our estimate of the effect of an additional year of secondary school.
The validity of this argument is considered in three ways. First, do we observe any evidence of there being relative age effects in Shanghai and Chinese Taipei children’s PISA test scores? Returning to Figures 3 and 4, the presence of relative age effects would suggest that PISA scores should progressively decline between children born in January (who are around the average age of their school cohort) and children born in August (who are the youngest children within their school cohort). In other words, the plotted line should be downward sloping within the region to the left of the discontinuity. Although such a pattern can be observed for Chinese Taipei, the same does not hold true for Shanghai, where the trajectory of the plotted line is essentially flat. This suggests that relative age effects are unlikely to be driving our key result, at least in the case of Shanghai.
Next, we turn to potential mechanisms: What is meant to be driving relative age effects, and can they be observed within the PISA data? It is thought that the youngest children within a school cohort may be more likely to be bullied (due to being less physically developed than their peers) and may also have lower levels of self-belief (due to being judged by their teachers as being of lower ability in comparison with the rest of their classmates). Previous work suggested that this may have a negative impact on August-born children’s test scores at earlier points in the schooling system (Bedard & Dhuey, 2006). But does this still hold true at age 15?
This issue is explored in Figure 5. As part of the PISA background questionnaire, children were asked a series of questions about their attitudes, expectations, and feelings toward school. Responses have been converted into a scale by the survey organizers, with the mean equal to 0 and standard deviation equal to 1 across all participating economies. Figure 5 plots mean scores on the following four scales by children’s month of birth:
Self-efficacy (sample question: How confident do you feel in solving an equation like 3x+5 = 17)
Self-concept (sample question: I am just not good at mathematics)
School belonging (sample question: I feel awkward and out of place in my school)
School attitudes (sample question: School has been a waste of time)

The association between relative age within year group and children’s self-efficacy, self-concept, sense of belonging, and attitudes toward school: (a) Shanghai and (b) Chinese Taipei. Note. Data based on Programme for International Student Assessment: 2012 data for self-efficacy, self-concept, and belonging; pooled 2009 and 2012 data set for school attitude.
There is little evidence that average scores on any of these scales varies systematically with month of birth. This holds true for both Shanghai and Chinese Taipei. In other words, the youngest children within Grade 10 do not seem to have lower levels of self-concept, self-efficacy, sense of school belonging, or attitudes toward education than their peers who are of average age for their school grade. Consequently, the key mechanisms thought to drive relative age effects cannot be observed within the PISA data.
Finally, we turn to evidence on the impact of relative age effects from elsewhere in the literature. Although referring to a different context (England), Crawford et al. (2014) noted that “relative age does not have a significant impact upon cognitive development” and that the combined impact of this and other possible mechanisms that we have considered, such as differences by birth month in the age of starting school, is “close to zero.” Indeed, they concluded that the “age at test is the most important factor driving the difference between the oldest and youngest children in an academic cohort” in England. As August- and September-born children in Shanghai and Chinese Taipei are almost identical in terms of age when they sit the PISA test (15 years 8 months vs. 15 years 7 months), this potential explanation can also be ruled out.
Could This Be due to Ceiling Effects?
Ceiling effects occur on cognitive assessments when a large proportion of test takers answer every test question correctly. Such effects can in turn introduce bias into subsequent statistical analyses, including comparisons of mean scores across groups. In reference to this article, if a large proportion of children are answering every test question correctly, then this may explain why we find children in Shanghai and Chinese Taipei to be making little academic progress between Grades 9 and 10.
To investigate this issue, we begin by exploring whether evidence of ceiling effects can indeed be observed within the PISA test. Specifically, if such effects exist, one would expect to see a spike in the upper tail of the PISA test score distribution. Figure 6 plots the PISA mathematics test score distribution for August- and September-born pupils in Shanghai (similar substantive results are obtained for reading and science and for Chinese Taipei). There is little evidence of any bunching of scores at the maximum of the test score distribution, with no suggestion that ceiling effects are present.

The Programme for International Student Assessment (PISA) mathematics test score distribution for August and September born pupils in Shanghai. Note. Authors’ calculations based on pooled PISA 2009 and 2012 data sets. Estimates produced with the first plausible value only.
We extend this analysis by investigating the responses of children who completed one particular PISA test booklet (booklet 1) in 2012. These children completed a total of 25 mathematics test items. If ceiling effects are present, one would expect many of the children in Shanghai to obtain a perfect score of 25. As expected, the distribution is negatively skewed, with most children in Shanghai answering around 20 of the 25 questions correctly. However, only 1% of children score 25 out of 25, and only 10% score ≥23. This again demonstrates how there is little evidence of a large spike of children at the maximum value, suggesting that ceiling effects are unlikely to be the main driver of our substantive conclusions.
Finally, we investigate the robustness of our results with a different measure of central tendency. Specifically, do our results differ if we focus on median test scores rather than the mean? The intuition here is that, unlike the mean, the median is much less sensitive to extreme values and, hence, much less likely to be affected by any possible ceiling effects. Figure 7 reproduces our analysis of average test scores by month of birth (initially presented in Figure 3) but now focuses on the median rather than the mean.

Association between month of birth and median Programme for International Student Assessment (PISA) test scores in Shanghai. Note. Authors’ calculations based on the pooled PISA 2009 and 2012 data sets.
Results for the median are similar to those for the mean (see Figure 3). There is only a relatively small drop in median test scores between August- and September-born pupils in Shanghai, with a difference of around 7 test points (0.07 SD) in mathematics and reading and only 1 PISA test point in science. This again suggests that ceiling effects are unlikely to be driving our conclusion.
Is It Just a Lack of Statistical Power?
Although point estimates in our preferred model sit close to or below zero (recall Tables 5 and 6), they are subject to some imprecision due to sampling variation. One way to investigate the impact of this is to increase the sample size by extending the area around the discontinuity. In this application, this means comparing children born 2 months on either side of the cutoff, rather than just one (i.e., by now comparing July/August- with September/October-born children). Table 7 therefore replicates the analysis presented in Table 6 but now includes children born in July and October. 11 This increase the total sample size to 3,460 in Shanghai (1,590 July/August-born children and 1,870 September/October-born children) and 4,076 in Chinese Taipei (2,065 July/August-born children and 2,011 September/October-born children).
Fuzzy Regression Discontinuity Design Estimates Extending the Discontinuity: July/August vs. September/October Born

Note. See notes to Table 2. Sample restricted to children born in July, August, September, and October.
Most point estimates now sit below zero and are accompanied by smaller standard errors. Indeed, in Shanghai the 95% confidence interval spans −10 to 6 test points in reading, −16 to 4 in science, and −13 to 9 in mathematics. This suggests that it is not simply a lack of statistical power that is driving our results; rather, we believe that there is strong evidence that the first year of upper secondary school in Shanghai has little impact (on average) on children’s reading, science, and mathematics PISA test scores.
Limitations and Alternative Explanations
The previous subsections have demonstrated how pupils in Shanghai make little progress in reading, science, and mathematics between Grades 9 and 10. Although this may indicate that Chinese education may not be as effective as some suggest, credible alternative explanations can not be ruled out.
For instance, there is the issue of curriculum content. As 15-year-olds in Shanghai already have such high-level skills, the material that they are taught in school during the particular year on which we focus may not be closely aligned with the PISA test. Consequently, the distribution of PISA scores may not change between Grades 9 and 10, because the first year of upper secondary school covers material not examined within PISA. Indeed, for some Shanghai pupils, the upper secondary school curriculum has a change of focus, particularly for those who move into more vocationally orientated tracks. It may therefore be that although average PISA reading, science, and mathematics scores do not increase substantially during this particular school year, young people may enhance their competencies in areas not measured by PISA. This includes more specialized skills, such as foreign languages and professional and technical abilities, which are quite separate from PISA’s core areas of reading, science, and mathematics.
Relatedly, it was noted how pupils in Shanghai complete the PISA test as they make the transition from lower to upper secondary school. A key part of this transition is the Lower Secondary School Graduation Examination, which pupils complete at the end of Grade 9. This is an important test that helps to determine the type of upper secondary school that young people attend. It is likely that young people will work particularly hard in the lead-up to these examinations, maximizing their knowledge and skills as a results. Conversely, pupils in Grade 10 have already completed these exams and may not be under the same pressure to study. It is therefore possible that the lack of progress that we observe could be due to the differing incentives of Grade 9 and 10 pupils to work hard in school, including the possibility that the former have already started to cram for these important upcoming exams. Unfortunately, the data that we have available are not sufficiently detailed to allow us to further explore these issues. Nevertheless, we note that the findings of Jerrim and Choi (2014) suggest that unspectacular rates of progress during secondary school hold more generally across East Asian educational systems and that our key findings are unlikely to be driven by our focus on this particular school year. However, we are also unable to rule out the possibility that East Asian pupils make particularly strong progress at younger ages (particularly within primary school).
Finally, all the results presented in this article refer to the “average” pupil. However, there could be heterogeneous effects, with certain types of students making more progress than others. Likewise, it is possible that value added could vary by school. The limited size of the available sample, particularly within individual schools, means that further exploration of heterogeneous effects in this article has not been possible. However, examining differential progress made by pupils within East Asian economies remains an important direction for future research.
Conclusions
Since its entry in 2009, the Chinese province of Shanghai has dominated the top of the PISA educational achievement rankings. Shanghai’s high PISA scores are widely interpreted as demonstrating the superiority of East Asian teaching methods and the quality of Chinese schools (Jerrim, 2015; Jerrim & Vignoles, 2016). This has led policy makers, academics, and journalists from across the globe to wonder what makes Shanghai’s schools so phenomenally successful.
In this article, we argue that it would be incorrect to base such views on evidence from PISA alone. Many factors outside the schooling system, such as the readiness of pupils when they enter education, could play a role. Thus, before anything meaningful can really be said about school system quality and how this compares across countries, “value added” (i.e., the rate at which children progress) needs to be measured. PISA’s headline findings do not provide such information, since they are based on absolute performance rather than value added.
Our empirical analysis emphasizes this point by providing, to our knowledge, the first attempt to measure pupil progress in Shanghai and Chinese Taipei with the PISA data in a statistically robust way. By applying a fuzzy RDD approach, we are able to estimate the academic progress made by children in these jurisdictions as they move from lower to upper secondary school. Our results find evidence of only small levels of progress in reading, science, and mathematics over this particular academic year.
This finding does require careful interpretation. Due to the stringent requirements of our statistical methodology, we are unable to compare estimates of academic progress in Shanghai with those for any Western economy: It could be that even these small estimates are larger than they would be in Western schools at the same point in time. Moreover, it is perfectly possible that schools in Shanghai are much more effective at younger ages (e.g., when children are in primary school). Indeed, while Shanghai’s and Chinese Taipei’s high absolute levels of achievement may not be entirely due to the education system, it also seems unlikely that the quality of schooling in these economies is poor.
Nevertheless, we believe that this serves only to strengthen the key message of this article. PISA simply does not provide enough information to make robust judgements on school system effectiveness and how this compares across countries. To do so would require longitudinal data, allowing children’s academic progress, not just the level, to be measured. Policy makers, academics, and journalists should therefore not interpret the PISA results as providing a measure of school system quality, certainly not a definitive one. Instead, they ought to draw on the depth and breadth of the available evidence to inform their judgments.
Footnotes
Acknowledgements
We thank the Fisher Family Trust Education Datalab for funding this project. We also thank the Department for Education for their comments on a previous draft.
Notes
Authors
JAKE ANDERS is a research associate at the UCL Institute of Education. He has written papers about higher education and subject choice.
JOHN JERRIM is an associated professor at the UCL Institute of Education, London. He has written articles about PISA, international comparisons and social mobility.
ANDREW MCCULLOCH is a researcher at the FFT datalab. He has produced papers on statistical methods applied to social science data.
References
Supplementary Material
Please find the following supplemental material available below.
For Open Access articles published under a Creative Commons License, all supplemental material carries the same license as the article it is associated with.
For non-Open Access articles published, all supplemental material carries a non-exclusive license, and permission requests for re-use of supplemental material or any part of supplemental material shall be sent directly to the copyright owner as specified in the copyright notice associated with the article.