
Abstract
In a randomized field trial with 2,850 seventh-grade mathematics students, we evaluated whether an educational technology intervention increased mathematics learning. Assigning homework is common yet sometimes controversial. Building on prior research on formative assessment and adaptive teaching, we predicted that combining an online homework tool with teacher training could increase learning. The online tool ASSISTments (a) provides timely feedback and hints to students as they do homework and (b) gives teachers timely, organized information about students’ work. To test this prediction, we analyzed data from 43 schools that participated in a random assignment experiment in Maine, a state that provides every seventh-grade student with a laptop to take home. Results showed that the intervention significantly increased student scores on an end-of-the-year standardized mathematics assessment as compared with a control group that continued with existing homework practices. Students with low prior mathematics achievement benefited most. The intervention has potential for wider adoption.
Keywords
F
The purpose of mathematics homework is typically to provide practice for the student. Literature reviews and meta-analyses show generally positive or neutral effects for homework on learning (Cooper, Robinson, & Patall, 2006; Maltese, Robert, & Fan, 2012). Effects due to homework are more positive in middle and high school than elementary school (reflecting greater student maturity) and particularly for mathematics, which requires substantial individual practice (Eren & Henderson, 2011). Parents and teachers understand the importance of practicing mathematics but sometimes disagree about the value of school homework policies. Indeed, popular media and books recurrently cover debates among parents and schools regarding homework (e.g., Bennett & Kalish, 2006; Kohn, 2006; Shumaker, 2016; Wallis, 2006). One prominent issue is that students may not receive timely feedback or help as they practice. Public discourse raises questions about whether homework increases learning, what kind of homework is more effective, and how homework may affect students’ well-being (e.g., Fernández-Alonso, Suárez-Álvarez, & Muñiz, 2015; Galloway & Pope, 2007).
We hypothesized that homework could be improved from the insights of research on formative assessment and related strategies (Black & Wiliam, 1998; Boston, 2002). Formative assessment involves using data from students’ independent work to give them helpful feedback and guidance while enabling the teacher to use the data to adjust instruction to meet students’ learning needs. Frequent use of formative assessments can improve achievement, particularly when the results are used to adjust instruction (Bergan, Sladeczek, Schwarz, & Smith, 1991; Speece, Molloy, & Case, 2003). Timely, nonevaluative, supportive, and specific feedback and guidance are beneficial to students (Azevedo & Bernard, 1995; D. L. Butler & Winne, 1995; Shute, 2008). Timely feedback is better for students than receiving no feedback at all, and conflicting results suggest that immediate feedback (Corbett and Anderson, 2001) or slightly delayed feedback (A. C. Butler, Karpicke, & Roediger, 2007) may be better. ASSISTments is closely related to the Cognitive Tutor program of research (Ritter, Anderson, Koedinger, & Corbett, 2007), which has used immediate feedback successfully to advance mathematics problem solving for decades. An extensive literature review suggested that immediate feedback may be more useful to students for procedural tasks and that delayed feedback may be useful for conceptual or transfer tasks (Shute, 2008). The homework tasks in this study are more procedural.
Likewise, data on the students’ recent performance can guide teachers to adapt instruction (Marsh, Pane, & Hamilton, 2006; Means, Chen, DeBarger, & Padilla, 2010). In one rigorous study that found a positive effect, teachers collected answers to mathematics problems from students via networked handheld calculators and used these data to adapt their instruction to fit students’ needs (Pape et al., 2012). Broadly speaking, evidence suggests that formative assessment improves learning outcomes (Black & Wiliam, 1998; Hattie & Timperley, 2007), although there has been criticism of the quality of the research (Dunn & Mulvenon, 2009; Kingston & Nash, 2011). Critics also emphasize the importance of helping teachers make sense of the results and take appropriate action (e.g., Bennett, 2011), and they have been cautious about the expected effect size (Kingston & Nash, 2011), given that some recent students found no or mixed effects (Carlson, Borman, & Robinson, 2011; Cordray, Pion, Brandt, & Molefe, 2013; Konstantopoulos, Miller, & van der Ploeg, 2013; Konstantopoulos, Miller, van der Ploeg, Li, & Traynor, 2011; Quint, Sepanik, & Smith, 2008). The studies that found no effect examined interventions that rely on infrequent assessments, such as interim or benchmark tests, and provide feedback across many tasks, not the task level. In contrast, the intervention considered here provides daily feedback to students and teachers, and the feedback is at the task level. Despite mixed results overall, there are good reasons to expect that a formative assessment could provide benefits for student learning when (a) the feedback is frequent and at the task level and (b) teachers are prepared to make sense of and use the feedback in an instructionally meaningful manner.
In alignment with the literature in mathematics education that recommend technology for formative assessment (Drijvers et al., 2016), our study was designed to contribute to the field by investigating whether technology could improve student learning by enabling formative assessment practices related to homework. Although formative assessment is a desirable practice, it is not easy for a mathematics teacher to provide every student with timely feedback and guidance or organize student data for instructional decision making. Generally speaking, technology can provide each student with timely feedback and hints as one does homework, and it can allow additional practice opportunities that match a student’s individual needs. Technology may help teachers to adapt instruction by automatically organizing data that indicate which topics deserve more attention, which students need additional help, and what wrong answers need to be addressed.
The intervention that we tested combined ASSISTments (Heffernan & Heffernan, 2014): an online platform that assists students while they solve mathematics problems, with related teacher training (described later). ASSISTments had shown positive results in previous experiments, but those were relatively short and involved small numbers of teachers (Kelly et al., 2013; Mendicino, Razzaq, & Heffernan, 2009; Singh et al., 2011). Although initial experiments were small in scale, ASSISTments has potential for larger adoption. The ASSISTments approach requires only modest changes to school and instructional policies. For example, it is not necessary to change the textbook that is used, the degree of homework that is assigned, or the pace and order in which mathematics topics are addressed. Interventions like this can be delivered at a reasonable cost as long as students have access to the basic technology—in this case, a tablet or laptop computer.
We chose to evaluate ASSISTments in Maine because of the statewide policy that gives every middle school student a laptop to take home, thus providing equitable access. This policy has been in place since 2001, yet evidence of impact on mathematics achievement is limited (Silvernail, Pinkham, Wintle, Walker, & Bartlett, 2011). As an increasing number of states and regions deploy technology, it is important to understand which intervention programs can leverage the hardware to improve learning.
Research Design
We investigated what happened when teachers in Maine were newly trained to use ASSISTments and then deployed it with all their students throughout a full year of seventh-grade mathematics instruction. Our main research question was as follows:
Do students in schools that use ASSISTments for mathematics homework learn more than students in schools who do homework without ASSISTments?
We investigated this question through a randomized controlled experiment in which schools were assigned to either an intervention or a business-as-usual condition.
Intervention
Worcester Polytechnic Institute provided the ASSISTments intervention—comprising the technology and closely related professional development—to schools, teachers, and students for this study.
The ASSISTments technology is a web-based platform that is made available to schools without charge. The name “ASSISTments” intends to convey that the technology gives students assistance while providing teachers with assessments of what students know and can do. ASSISTments was developed with funding from the National Science Foundation and the U.S. Department of Education’s Institute of Educational Sciences. Three prior research studies involving small numbers of students and few instructional days are described here, and they showed that ASSISTments could have an effect on learning.
In Mendicino et al. (2009), the experiment covered 4 days of instruction and involved 28 students. The control group received a worksheet with problems, whereas subjects in the treatment condition entered their answers online, receiving scaffolding and hints immediately after answering a problem wrong. A pre- and posttest measure was developed by the experimenter in consultation those teaching the content. Posttest results showed a significant effect of condition, d = 0.6. There were two main differences between the groups in how they experienced homework during the study: The treatment group answered homework on a computer and got immediate feedback, whereas the control group neither answered homework on a computer nor got immediate feedback. In a follow-up study with a similar design involving 63 students over 2 instructional days (Kelly et al., 2013), both groups answered homework on a computer: One group got immediate feedback via computer, and the other group received next-day feedback from a teacher. Students in the computer-based feedback condition had higher posttest scores. In another follow-up study (n = 172 students; Singh et al. 2011), both groups again answered homework questions on a computer, but the computer-based feedback group received both correctness feedback and tutorial guidance if they got a problem wrong, whereas the control group did not receive computer-based feedback. Again, the students who received computer-based feedback and tutorial guidance had higher posttest scores than the students who entered their answers on a computer without receiving feedback. Overall, these studies offer preliminary evidence for the effectiveness of ASSISTments but conflate the timing of feedback (immediate vs. delayed) and the modality of feedback (from a computer or a teacher). The experiments involved less than a week of instruction, whereas the present study lasted an entire school year.
Content in ASSISTments consists of mathematics problems with answers and hints (and, in some cases, more extensive online guidance on how to solve the problem). These mathematics problems are bundled into problem sets that teachers assign to their students. As the students work online, the computer informs them about the correctness of a solution and offers guidance, if available for that problem. Teachers receive reports on how students perform on the assigned problem sets, including information about common wrong answers.
Two types of ASSISTments content were included in the intervention for this study. One type is closely linked to existing textbook homework problems or to related homework problems that teachers write themselves. During the summer, undergraduates entered all the homework problems into ASSISTments from all the mathematics textbooks used in the treatment group; thus, each teacher had access to every homework problem in his or her textbook. The ASSISTments interface enabled teachers to bundle these into problem sets to assign to their students.
The second kind of content was specifically developed for mastery-oriented skill practice and was called “skill builders.” Existing skill builders in ASSISTments cover >300 topics in middle school math. Teachers can assign skill builders to students to provide practice problems that focus on a targeted skill until they reach a teacher-defined criterion for correctness (e.g., a streak of three correct answers on similar math problems). Students can be checked at 1- and 2-week intervals for retention of skills demonstrated on past problem sets, which links to the research-based instructional strategy of spaced practice (Pashler et al., 2007). For both types of content, teachers (rather than the system or intervention developers) decided how much and what type of homework was assigned, and they were asked to do so in accordance with their existing school homework policy.
The intervention also incorporated teacher professional development aimed to increase teachers’ readiness to use ASSISTments. The target practices included (a) encouraging students to rework problems they initially got wrong (and to enter revised answers), (b) focusing attention on the homework problems that students did not answer correctly, (c) reviewing correct solution processes for the problems that students found difficult, and (d) discussing common wrong answers to address underlying misunderstandings.
ASSISTments provides teachers with an easily accessible report that summarizes student work for a particular assignment in a grid format (Figure 1). The rows of the grid correspond to individual students (if teachers display this report publically, they can hide student names). The columns of the grid correspond to individual problems in the assignment and show the percentage correct for each problem, as well any common wrong answers that students gave. The color-coded cells provide information on each student’s performance on each problem in a format that focuses on problems that were difficult for many students. In addition, teachers can use information about students to form study groups and address common issues or to work with the students individually. The professional development training helps teachers learn to use this information to make instructional decisions, such as which problem to focus on or which student to spend time with. It also coaches teachers to determine when a topic needs to be retaught or student mastery is high enough to move on. Consequently, teachers were able to personalize ASSISTments for individual students, groups of students, or the whole class; for example, they could assign additional practice to particular students (e.g., by assigning skill builders) or enter other problems or hints to existing problem sets.

A popular ASSISTments report organizes student homework results in a grid—with tasks in columns and students in rows and enables teachers to quickly identify which problems to review and what the common errors were, as indicated by the annotations.
Recruitment, School-Level Attrition, and Demographics
We recruited 46 schools to represent the range of school sizes and mathematics achievement levels found throughout Maine. For the recruitment process, we developed a consistent set of message and presentations, which were available on a project website and as handouts. The study was described to teachers as a delayed treatment design: Some schools would be initially assigned to use ASSISTments, whereas others would wait 2 years and then be given training and access to use ASSISTments. We advertised the study to teachers and school principals throughout Maine via a mix of bulk mailings, presentations at statewide events, a webinar hosted by the state’s Department of Education, visits to schools, personal communication through existing relationships, and some news coverage. As interested parties were identified, the team visited each school to make a presentation about the study and requirements for participation. Interested schools were required to complete an application form to ensure that they understood all the requirements of participation and that teachers and school leaders fully agreed to participate; in addition, the application form gave the researchers useful demographic data about the schools. All schools that successfully completed an application were accepted into the study and randomly assigned to a condition, as described later. The procedure for recruitment is detailed in an online technical report (Roschelle et al., 2014).
Attrition is relatively common in experiments that are fielded in schools and that unfold over a school year or longer. As planned and executed, this experiment required that schools remain in the condition for 2 years and provide student data in the second year. We expected some attrition in the design of the study and thus recruited more schools than needed.
The specifics of attrition from 46 to 43 schools are as follows: Most schools were placed into pairs prior to randomization. The pairs were formed by rank ordering schools by prior test scores and making slight adjustments to the resulting order when schools of similar rank were of dissimilar sizes. In one case, a pair was formed, but then one school dropped out, leaving 45 schools. A new pair was formed with the remaining school, and we proceeded with random assignment. One treatment school dropped out after the start of the project, but its matching control school did not drop out, leaving 44 schools. We continued to collect data for the unpaired control school but later excluded it from analysis because it had lost its matching treatment school. The net result was 43 schools in the final analytic sample, consisting of randomly assigned pairs (n = 40) plus three schools that had never been paired and were individually randomly assigned to treatment (n = 2) or control (n = 1). The school-level overall attrition rate was 6.5%, and the school-level differential attrition rate was 3.8%. The What Works Clearinghouse (2008) publishes guidelines on the acceptability of attrition, and these rates are within its published parameters for attrition. In the Data Linking section, we provide related information on student-level attrition.
The overall demographics of the students in our data sample of 43 schools are reported in Table 1. We studied only the seventh-grade students in each school. Both in our sample and in Maine in general, most students are White, and many qualify for free and reduced-price lunch (FRL), a common measure of socioeconomic status. Students with individualized education programs (IEPs), an indicator of the need for special education services, made up about 12% of our sample.
Demographics of Students in the Sample of 43 Schools

Values in percentages except where noted.
Procedure
As discussed, schools were placed into pairs with similar prior achievement levels and enrollment sizes, and pairs were randomly assigned to treatment and control. In three cases, no pair was available at the time of randomization, so we randomly and independently assigned each to one of the conditions. Both teacher groups were expected to assign and review mathematics homework for seventh-grade students in accordance with their local school policies. As previously described, the content of the homework in both groups came from the textbooks already in use at each school as well as from skill builders. The treatment group was immediately offered the intervention, comprising both the ASSISTments platform and teacher professional development, as detailed later. The control group was eventually provided with both ASSISTments and the same professional development but after a 2-year delay; thus, it did not have access to ASSISTments while we were collecting data.
Teachers in the treatment group participated in professional development training beginning in the summer preceding the first year of implementation (3 days) and later throughout the school year (approximately 6 hr across three classroom visits from an ASSISTments coach). During the first year of ASSISTments use, the coach worked with teachers to improve their implementation and formative assessment practices. Teachers attended a second professional development workshop in the summer between the first and second years (2 days). The coaching component of the professional development was both in-person and remote. The coach, who was a member of the ASSISTments team, visited every teacher in his or her classroom at least three times (with the exception of a school located on the far north side of the state of Maine). The coach also conducted remote webinars two to three times each year and encouraged all teachers to attend. Last, many teachers took advantage of the opportunity to occasionally email and call the coach for help during the school year.
Teachers used ASSISTments with a new cohort of seventh-grade students during the second school year. Scores from this second cohort of students were used for our analysis of the impact on student learning.
In the control group, teachers continued with their existing homework practices without any specific teacher training beyond that offered by their districts. Control group teachers were not able to use ASSISTments with seventh-grade students. Teachers knew that after the 2-year experiment ended, they would be invited to attend professional development training for ASSISTments and use it without cost. Thus, via a delayed treatment design, the study provided all schools with a similar incentive while maintaining an intervention contrast during the first 2 years.
Measures
To measure students’ levels of achievement prior to intervention, we obtained data from the state of Maine under an approved institutional review board and data security plan. The data included students’ achievement on the New England Common Assessment Program (NECAP) test for reading and mathematics. The data also included demographic indicators, such as gender, FRL status, and IEP status. During the fielding of this experiment, the state of Maine phased out NECAP but was not yet administering Smarter Balanced, the replacement Common Core examination. Hence, we could not rely on a state-administered test as an outcome measure. To measure students’ levels of achievement at the end of the intervention, we administered the TerraNova standardized test. We chose TerraNova because it has well-established and reputable psychometric qualities. The developers of ASSISTments did not make any changes to the content of their intervention to align with TerraNova, nor was TerraNova selected with an expectation that there was an especially strong alignment with ASSISTments.
NECAP
Mathematics scores from the NECAP test were used as the measure of students’ knowledge. NECAP was developed in response to the federal No Child Left Behind Act of 2001 (2002). The NECAP test is considered a well-designed assessment with strong technical qualities. Maine administered the NECAP test once each year from Grades 3 through 8 to comply with the act. NECAP data were collected by the state of Maine for students when they were in sixth grade, which was the year before they were first exposed to the intervention. Due to the transition from NECAP to Common Core–based testing, the last available scores for our students were sixth-grade scores; we used the most recent available data.
TerraNova
Scores from the TerraNova Common Core assessment mathematics test were used as a primary outcome measure to provide data on student achievement in mathematics concepts, processes, and skills, and the test was administered at the end of students’ seventh-grade year. This achievement test is published by Data Recognition Corporation CTB and is nationally normed.
According to the publisher, TerraNova’s content is aligned with the Common Core Standards for Mathematics and represents mathematics curriculum taught throughout the United States. During the time of this experiment, schools in Maine were transitioning from prior instructional frameworks to the Common Core. The TerraNova content is appropriate for the transitional period because it is largely consistent with existing instructional practices but focuses on grade-level expectations in the Common Core. The TerraNova mathematics test at Level 17 is appropriate for Grade 7; it has 37 items and requires 1.5 hr to administer. This instrument combines selected-response items with sections of constructed-response items that allow students to produce short and extended responses. It generates norm-referenced achievement scores, criterion-referenced objective mastery scores, and achievement-level information that includes five levels of proficiency. We used the norm-referenced achievement scores, which are units of a single equal-interval scale that extends across 12 years of schooling.
Teachers were trained to administer the TerraNova mathematics test at the end of the second year of implementation in both cohorts of schools. Training and administration of the test occurred near the end of the school year. The test booklets were then returned to the test publisher for scoring. The test publisher (blind to condition) scored the test booklets and reported the scale scores to us.
System use data
The electronic records collected by the ASSISTments system are a source of implementation data in the treatment group. For each classroom, the system collects data for each student on each day at an individual action level (e.g., when a student enters an answer or requests a hint). In addition to data about student usage, the system collects data on teacher usage. Using these data, we confirmed that all treatment group teachers used ASSISTments, and we found no evidence that control teachers were using the system.
Data Analysis
Data Linking and Student-Level Attrition
Students and parents were first notified about the study when students entered seventh grade and were exposed to the intervention (treatment group only). Teachers, however, began the study with a warm-up year, while student participants were still in sixth grade. Hence, for the purpose of counting the students who left a study school or joined a study school, we began with the student population as of the first semester of sixth grade. Although we have no evidence of this occurring, it is theoretically possible that a sixth-grade student or parent would have learned about the seventh-grade study and decided to change schools, and this conservative method of determining the populations would count such students as joining or leaving the study.
In the first semester of sixth grade, 3,035 students were in a study school. Of these, 2,728 completed the study by taking a TerraNova assessment at the end of seventh grade. Hence, 307 exited the study because they left a study school or skipped the TerraNova assessment. Of the 307 leavers, 178 were in the control group and 129 in the treatment group. The student-level attrition is thus 10.1% overall, with 5.6% differential attrition between groups. Compared with the What Works Clearinghouse (2008) model for differential attrition, this level of attrition fits within the zone considered to be acceptable with regard to potential bias.
In addition, 122 students (61 in the control group and 61 in the treatment group) joined a study school, had available NECAP scores, and completed the study by taking the TerraNova assessment. (Later we report an analysis of whether our findings are sensitive to the addition of joiners and further justify our decision to include them in our analysis.) Thus, our total study sample size was 2,850 (the sum of 122 and 2,728) with 1,621 in the treatment group and 1,229 in the control group.
Baseline Equivalence of Groups
Analyses found no difference between the treatment and control groups in various demographic and predictor variables. Multilevel logistic models found no control-versus-treatment condition differences in student-level FRL status, γ = 0.012, t(21) = 0.121, p = .905; non-White/non-Hispanic heritage, γ = −0.219, t(21) = −0.809, p = .427; IEP status, γ = −0.013, t(21) = −0.115, p = .910; and student sex, γ = 0.100, t(21) = 1.747, p = .095. Multilevel regression found no treatment condition differences in prior year math performance, γ = 0.194, t(21) = 0.463, p = .648, or prior year reading performance, γ = −0.139, t(21) = −0.177, p = .861.
Use of ASSISTments
We tracked usage of ASSISTments directly via system log files. Students in the ASSISTments condition used the system, on average, for 967 mathematics problems and for 14 hr in the course of a school year. We had expected 18 to 24 hr of use in the course of the year, by estimating that homework assignments could be completed in about 10 min and would be assigned three to four nights each week.
Analytic Models
To estimate the impacts of the intervention on student learning, we developed analytic models that reflect the clustering of students. We primarily report results from a hierarchical linear regression model (HLM) with two levels: students nested within schools. In most of the schools in our sample, there is only one teacher for seventh-grade mathematics; thus, in these schools, there is no distinction between the school and teacher level. Furthermore, the two- and three-level models produced similar statistical results. In our primary HLM, we included the following variables as student-level covariates: prior NECAP mathematics (PriorMath), NECAP reading scores (PriorRead), FRL status, and IEP status. The school-level covariates included are the school’s mean prior NECAP mathematics score (SchMath) and 20 school-pair variables (SchPair), indicating which school pair a school belonged to. The three schools not paired before randomization were treated as their own cluster.
All analyses were conducted with students’ TerraNova-scaled scores as the dependent (outcome) variable. The two-level HLM that predicts student TerraNova performance is as follows:
Level 1 model (student)

Level 2 model (school)


Trx is a binary variable to indicate whether the school is in the treatment condition (Trx = 1) or control condition (Trx = 0), and γ01 is the estimate of the average adjusted difference between the treatment and control conditions in spring TerraNova scores.
Using a separate model, we also analyzed whether ASSISTments benefited students with low or high prior mathematics achievement differently. Using the sixth-grade NECAP mathematics scores, we divided students into groups with scores at or below the median (low prior achievement) or above the median (high prior achievement). An HLM used the treatment condition and the binary prior-math-performance variable as predictors of seventh-grade TerraNova scores, controlling for student-level FRL status, student-level IEP status, school-level prior-year mean NECAP mathematics scores, and the 20 school-pair variables. This model evaluated the interaction between prior achievement status and being in the treatment condition.
Results
We first provide the results from fitting the data to the primary HLM and then consider the impact on students with low prior mathematics achievement.
Modeling Student Achievement
We modeled student achievement and tested statistical significance using the primary HLM described above. Two- and three-level models gave similar statistical results. We report the results for the simpler two-level model.
When we controlled for student-level covariates (prior math and reading achievement, FRL status, and IEP status), the treatment students’ adjusted mean TerraNova scale score was 8.84 points higher than the control students’ model-adjusted mean scale score of 681.95. This difference is statistically significant, t(20) = 2.992, p = .007. Further details of the model results appear in Table 2. As a check on the reasonableness of the statistical model, we also examined the unadjusted difference in mean TerraNova scores between groups. The unadjusted difference between the mean scores of the two conditions was slightly greater, 11 points, and also favored the treatment group. We then computed an effect size using the adjusted difference in scaled scores and the pooled standard deviation of the scores in our overall seventh-grade sample. The difference of 8.84 points corresponds to an effect size of 0.18 standard deviation units (we used Hedges’s g as our measure of effect size throughout the analyses).
Results of Two-Level Hierarchical Linear Regression Model for TerraNova Score Based on Treatment Status and School- and Student-Level Covariates

Note. All variables other than treatment status were centered on their grand mean. For succinctness, the parameter estimates for the school-pair indicators are not included in this table. Effect size: Hedges’s g = 0.18. NECAP = New England Common Assessment Program; IEP = individualized education program; FRL = free and reduced-price lunch.
We also examined the sensitivity of the impact findings to the inclusion of 122 students who joined the study after their school was randomly assigned to a treatment condition. To do so, we reanalyzed the data using the same HLM but without these 122 students in the sample. The findings are essentially the same (see Table 3); the adjusted mean difference between groups is 8.57 and remains statistically significant (p = .01). We report the main findings based on a sample that includes joiners, for three reasons. First, this intervention has low risk for bias due to the inclusion of joiners in the analytic sample. All schools in Maine already send students home with laptops for the purpose of doing homework; thus, laptops were given to students in both conditions. Furthermore, it is unlikely that a student would change schools because a teacher in one school subject (math) uses a particular application for homework; in general, students are tolerant of a variety of applications that their teachers ask them to use on the school-assigned laptop and are unlikely to change schools just to obtain or avoid a particular application used only in mathematics classes. Second, we did not detect a threat to internal validity due to the presence of joiners. The joiners were equally distributed across treatment groups; their average prior math test scores were also similar across groups, t(120) = 1.085, p = .280; and the impact results are very similar with and without joiners in the sample. Third, with regard to external validity, school officials are typically concerned about impacts for all their students who complete a particular school year, not only those students who stayed in the same school for 2 years in a row.
Results of Two-Level Hierarchical Linear Regression Model for TerraNova Score Based on Treatment Status and School- and Student-Level Covariates Without “Joiners”

Note. All variables other than treatment status were centered around their grand mean. For succinctness, the 20 indicators used to control for school-level matching are not included in this table. Effect size: Hedges’s g = 0.17. NECAP = New England Common Assessment Program; IEP = individualized education program; FRL = free and reduced-price lunch.
Students With Low and High Prior Achievement
For those students with NECAP scores at or below the median, the mean score on TerraNova in the treatment group was 13.35 points higher than that in the control group. For the students who started above the median, the mean score in the treatment group was 5.84 points higher than that in the control group (see Table 4). The interaction is statistically significant, t(2770) = 2.432, p = .015; the effect of the ASSISTments intervention is greater for lower-performing students than for higher-performing students (see Figure 2). We calculated effect sizes for each group using the pooled standard deviation for the total sample. The corresponding effect sizes were .29 for those students at or below the median and .12 for those students above the median.
Median Split Investigating Interaction Between Prior Math Scores and Treatment Condition as It Affects Unadjusted TerraNova Scores

Note. The Prior Math Score × Condition interaction is statistically significant, t(2770) = 2.432, p = .015.
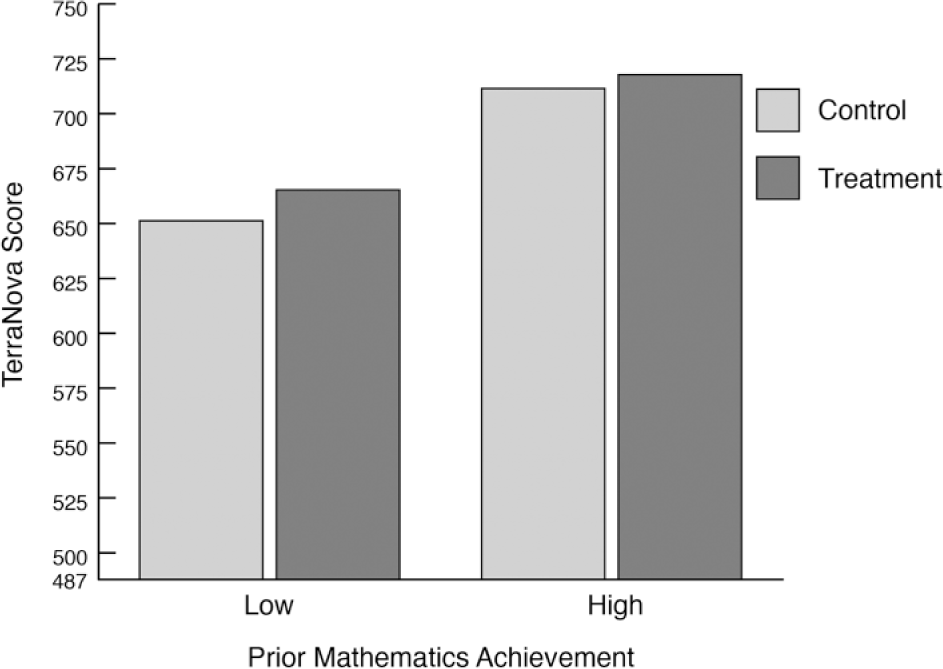
Students were divided into low and high groups based on prior achievement scores. The results shown are the observed TerraNova scores. In both groups, the students in treatment schools obtained higher TerraNova scores. The difference between treatment and control groups was greater for students with lower prior achievement, t(2770) = 2.432, p = .015. The TerraNova is scaled from 0 to 1,000, from kindergarten through the end of high school. However, this experiment concerned only the seventh-grade test, which uses a smaller range of possible scale scores. We scaled the vertical axis to show the minimum possible score on the seventh-grade test (487) at the low end of the axis and the largest observed results on the high end.
Discussion
Compared with the business-as-usual control group, we found that achievement was higher in the schools that used the online homework intervention comprising ASSISTments and related teacher professional development. Furthermore, the intervention provided a greater benefit to students with lower, rather than higher, prior mathematics achievement.
To interpret this effect size of 0.18 standard deviations, we considered standard guidance (Lipsey et al., 2012). We noted that the gains due to the intervention were greater in magnitude than the difference in scores between students with and without FRL status; thus, the effect is meaningful relative to the size of achievement gaps among students with different levels of socioeconomic status. The magnitude of the effect can also be described in terms of an improvement index: Students at the 50th percentile without the intervention would improve to the 58th percentile if they received the ASSISTments treatment. (An improvement index is the expected percentile gain for the average student in the control group—the student who scored at the 50th percentile on the outcome measure—if that student had attended a school where the intervention was implemented.)
We also examined how the difference in means on the TerraNova translates to differences on a grade-level scale. Terra Nova scores are scaled such that the mean score in a nationally normed sample increases by a modest number of scale points per school year. For example, the mean scale scores for the test publisher’s nationally normed sample at the beginning of sixth, seventh, eighth, and ninth grades are 655, 670, 678, and 690, respectively (an average difference of 11.66 points per year). In the context of these modest expected differences, the measured difference of 8.84 scale score points is meaningful.
This intervention was designed for use by all students in a school. Some interventions target particular identified populations, such as students with needs for special education, students whose performances are below grade level, or students with poor language skills. In contrast, this intervention followed typical homework policies, which apply to all students. A notable effect size is less likely when the treated population is inclusive, as some students in the population will probably do well without any specific intervention. Indeed, we found that the benefit was smaller for students with above-median prior mathematics achievement. It is reasonable to expect that students with high prior mathematics achievement may be doing well on homework without any special supports. Yet school stakeholders are frequently concerned about fairness; thus, schools often prefer interventions that can be offered to all students and that have the potential of benefiting all students. Hence, a desirable feature of this experiment is that the intervention was assigned to all seventh-grade students in a school and that a meaningful impact was nonetheless obtained.
There were several limitations of this study. First, the state of Maine provides laptops to all seventh-grade students; other settings might have less or variable access to technology. Inequitable access to technology within the treatment condition might result in smaller effects. Second, Maine is more rural and homogeneous than many other states and regions; results could vary in other regions. Third, teachers had one school year to improve their quality of implementation before we measured impact in a second school year. Implementations that seek results quickly or provide less teacher support may result in smaller or different effects.
Within the scope of this report, we are also limited in the degree to which we can identify specific mechanisms within the intervention that were most closely related to the effects observed. The project collected several additional data sources that provide insight on possible mechanisms, but the analysis and integration of this additional qualitative and quantitative data require further work. For example, in further analysis we plan to use additional data from teacher interviews, surveys, and instructional logs to consider whether variations in the type and amount of homework might explain effects. It is possible that students spent more or less time on homework in the treatment condition (i.e., when using ASSISTments) than the business-as-usual condition. We do not expect this to be the case, because the amount of homework assigned was set by school policies on homework and we found the policies to be similar among schools in our sample (Fairman, Porter, & Fisher, 2015). It could also be that the content of the homework was different; however, this is also unlikely because teachers in both conditions assigned homework from their textbooks. We will be examining the extent to which the additional skill builder content offered in the ASSISTments treatment group (but not the control group) might explain the findings.
In further analysis, we plan to look at the extent to which changes in student learning were mediated by changes in teacher behavior, by analyzing and integrating additional data from observations, interviews, surveys, and instructional logs. Students may receive a direct benefit from the feedback and hints that they receive in ASSISTments as they do homework, regardless of whether their teacher’s behavior is different during classroom instruction; however, teachers can use the reports generated by ASSISTments to adapt their teaching based on their students’ work. There is some preliminary indication that teachers did change their behavior, but due to the complexity of analyzing and integrating the multiple qualitative and quantitative data sources to address this issue, comprehensive analysis of this issue will await a subsequent research effort.
Conclusion
In this study, an online mathematics homework intervention produced a positive impact on students’ mathematics achievement at the end of a school year. Students with low, rather than high, prior achievement benefited more. The intervention provided students with personalized feedback and hints immediately—more typically, students wait until the next day to know what they did right and wrong and to get help. When students struggled, they had additional opportunities to work toward mastery in supplementary problem sets. The intervention also enabled formative assessment practices for teachers, such as adapting their discussions of homework to fit students’ needs. Specific professional development was provided to teachers to enable them to enact these adaptive practices. Formative assessment is a frequently recommended practice; this intervention provided a practical, targeted way to do it.
Our findings are relevant to many schools because mathematics homework is a commonplace school policy and school stakeholders often critique the value of existing homework practices. This study demonstrates one way to improve the value of homework. Furthermore, the tested intervention fit within common school policies for homework and did not require change in instructional policies, such as the school’s choice of textbook or pacing through topics. Thus, the intervention was targeted and modest: Teachers were not expected to change their entire repertoire of classroom routines. Although reformers often promote more ambitious changes to classroom routines (e.g., “flipped classrooms”), such changes in teaching practice require much more intensive teacher training and can meet resistance. Here, teachers continued to make the majority of instructional decisions following their own approach in accordance with existing school policy. An intervention that mostly fits existing school policies is typically easier for schools to adopt.
Interventions like this one can also bring new personalized options to schools. Schools tend to have a uniform homework policy for all students, and teachers can assign mathematics homework to all students in ASSISTments. However, students’ assignments need not be identical. Students who show mastery of a particular topic after just a few minutes could perhaps do only a few problems that are likely to be discussed with the full class the next day (so they get some practice and can participate in class discussion). Other students may benefit from more intensive practice opportunities as well as specific skill builder exercises or other resources. ASSISTments and similar technology could help mathematics teachers assign some problems uniformly while personalizing some assignments so that particular students have additional opportunities to learn. Although the potential to combine elements of uniformity and personalization seems promising, an empirical basis for recommending exactly how to optimize this mix of homework assignments remains a topic for further research.
Footnotes
Acknowledgements
This material is based on work supported by the Institute of Educational Sciences of the U.S. Department of Education under Grant R305A120125. Any opinions, findings, and conclusions or recommendations expressed in this material are those of the authors and do not necessarily reflect the views of Institute of Educational Sciences. The data reported in the paper may be obtained from the State of Maine Department of Education. We thank the Department of Education for providing access to the data. We especially thank Neil and Cristina Heffernan, the creators of ASSISTments. ASSISTments is available as a free public service of Worcester Polytechnic Institute at ![]() . None of the authors has a financial interest in ASSISTments. We also thank the students, teachers, and schools who participated in the study, as well as the project staff from SRI International, University of Maine, and Worcester Polytechnic Institute.
. None of the authors has a financial interest in ASSISTments. We also thank the students, teachers, and schools who participated in the study, as well as the project staff from SRI International, University of Maine, and Worcester Polytechnic Institute.
Authors
JEREMY ROSCHELLE is co-director of the Center for Technology in Learning at SRI International, 333 Ravenswood Ave, Menlo Park CA 94025;
MINGYU FENG is a senior research scientist in the Center for Technology in Learning at SRI International, 333 Ravenswood Ave, Menlo Park CA 94025;
ROBERT F. MURPHY is director of evaluation research in the Center for Technology in Learning at SRI International, 333 Ravenswood Ave, Menlo Park CA 94025;
CRAIG A. MASON is a professor of education and applied quantitative methods at the University of Maine, 312 Shibles Hall, Orono, ME 04469;