
Abstract
The current focus on assessing “college and career readiness” raises an empirical question: How do high school tests compare with college admissions tests in predicting performance in college? We explored this using data from the City University of New York and public colleges in Kentucky. These two systems differ in the choice of college admissions test, the stakes for students on the high school test, and demographics. We predicted freshman grade point average (FGPA) from high school GPA and both college admissions and high school tests in mathematics and English. In both systems, the choice of tests had only trivial effects on the aggregate prediction of FGPA. Adding either test to an equation that included the other had only trivial effects on prediction. Although the findings suggest that the choice of test might advantage or disadvantage different students, it had no substantial effect on the over- and underprediction of FGPA for students classified by race-ethnicity or poverty.
The redesigned SAT will be better and more clearly aligned to best practices in classroom instruction so that the most effective preparation for the SAT is the development of the ELA/literacy and math skills taught in great courses across the disciplines. . . . No longer will the SAT stand apart from the work of teachers in their classrooms. (p. 13)
This view raises an empirical question: If mastery of the high school curriculum should be the focus of college admissions testing, how well do states’ own high school tests predict performance in college? This question has been made more salient by the current view that high school tests should measure “college and career readiness.” Although there would be obvious practical problems in substituting scores on high school tests for college admissions test scores—in particular, the use of different tests in different states—these do not make the question moot. States could use the high school test scores of applicants from their own states or from other states using the same high school tests to substitute for or supplement traditional college admissions test scores. For example, more than 250 colleges and universities currently have agreed to use the Smarter Balanced Assessment Consortium (SBAC) summative tests as one indicator to determine whether students should be placed in remedial or credit-bearing courses (SBAC, 2016). In addition, because of the current focus on college and career readiness, some states—beginning with New York in 2010—have used the prediction of college performance as one element in setting standards on their high school tests, including the specific Regents tests we use in this study (e.g., Steiner, 2010).
Even when college admissions tests reflect high school curricula, there are a number of reasons why predictive relationships with college performance could differ between them and high school tests and among various states’ tests. Some states, like Massachusetts, use a single survey assessment for all students, whereas others, like North Carolina, use end-of-course (EOC) exams. Some states use scores as a criterion for high school graduation, but many do not. The tests vary in terms of the standards to which they are aligned, and some focus on content less advanced than that on college admissions tests.
In addition, college admissions tests and state tests may vary in their vulnerability to score inflation, that is, upward bias from inappropriate test preparation, which could undermine their value in predicting performance in college. In particular, college admissions and high school summative tests may be affected differently by inflation because preparation differs for the two types of tests. Preparation for college admissions tests is not ubiquitous and is often intensive but short term. In contrast, substantial research (albeit conducted mostly in grades lower than high school) suggests that preparation for high-stakes K–12 tests is both widespread and long term (e.g., Koretz, Barron, Mitchell, & Stetcher, 1996; Pedulla et al., 2003; Shepard & Dougherty, 1991; Smith & Rottenberg, 1991; Stecher, Barron, Chun, & Ross, 2000). Studies have found that the resulting inflation of scores in K–12 tests can be very large, in some cases half a standard deviation or more within a few years of the first implementation of the test (Jacob, 2007; Klein, Hamilton, McCaffrey, & Stecher, 2000; Koretz & Barron, 1998; Koretz, Linn, Dunbar, & Shepard, 1991). In contrast, some studies have shown more modest effects of test preparation on college admissions tests, often in the range of 0.1 to 0.2 standard deviations on the mathematics test (e.g., Briggs, 2009; Domingue & Briggs, 2009; Powers & Rock, 1999). However, these studies rely on covariate adjustment or propensity score matching in an attempt to remove differences between coached and uncoached students, whereas most studies of K–12 score inflation rely on comparisons of identical or randomly equivalent groups.
Despite these differences, research to date suggests that the two types of tests are roughly similar as predictors of performance in college. However, this research is very limited; it comprises only a few studies in a few contexts. Most of the data are old, antedating the enactment of No Child Left Behind. They include no evidence about the predictive power of EOC tests and, with the exception of only a single weak contrast, present no evidence about summative tests that are high stakes for students. These studies do not include analysis of over- and underprediction as a function of student demographics, which is standard in validation studies of college admissions tests.
In response to these limitations, we compared the power of high school high-stakes summative tests and college admissions tests to predict the freshman-year performance of students who entered two different university systems more recently in 2 consecutive years. Our primary analysis, which was part of a larger series of studies conducted in collaboration with the City University of New York (CUNY), used data from the cohorts entering CUNY in 2010 and 2011. Our outcome was freshman-year grade point average (FGPA), which is the outcome most commonly used in the literature. The college admissions test used in the CUNY system is the SAT. For state tests, we used two of the Regents Examinations. To obtain a “Regents diploma,” the standard high school diploma in New York, students must pass five Regents Examinations (New York State Education Department, 2008). For much of their history, Regents Examinations were EOC tests, but since the 1990s, they have not been tied to specific courses, and schools can offer students varying course work leading up to each exam. We used the scores from two of the required Regents tests: the English language arts examination, which is most often taken in the 11th grade, and the lowest-level mathematics test, which is most often taken during the ninth or 10th grade.
To avoid the risk of system- or state-specific findings, we conducted a partial replication with data from students entering public universities in the state of Kentucky in 2011 and 2012. Kentucky provides a good replication because it differs in several important respects. The demographic profile of students in Kentucky system is very different from that of CUNY students. Kentucky uses the ACT rather than the SAT as a college admissions test, and unlike New York, Kentucky administers this test to all high school students. For state test scores, we used the Kentucky Core Content Test (KCCT) scores in English and math. These survey tests, not tied to specific courses, were used for accountability under No Child Left Behind but were not high stakes for students.
In addition, we used the CUNY data to compare the effects of choice of test on specific groups of students. We followed the procedure that is conventional in the validation of college admissions tests by examining the strength of correlations and over- and underprediction of FGPA for racial-ethnic subgroups, comparing the results for the SAT and Regents tests. In addition, the CUNY data also allowed us to evaluate over- and underprediction by income.
Background
Three prior studies used data from graduating cohorts earlier than 2002 to examine the predictive value of high school summative tests. All found only minor differences in the strength of aggregate prediction between these tests and college-admissions tests when combined with high school GPA (HSGPA). None examined differences in over- and underprediction of FGPA for subgroups of students.
Cimetta, D’Agostino, and Levin (2010) compared the prediction of both FGPA and cumulative GPA (CGPA) by the Arizona Instrument to Measure Standards (AIMS) test and the SAT among students entering 4-year programs at the University of Arizona in 1999 and 2000. The AIMS was a survey test. It did not have high stakes for students in the 1999 cohort. The 2000 cohort took the exam believing it to be required for graduation, but shortly after students took the test, the state delayed implementation of the graduation requirement for 6 years. The authors suggested that the small differences in prediction they found between the 1999 and 2000 cohorts could reflect the expected imposition of the graduation requirement, but they acknowledged that they could have arisen from other factors.
Cimetta et al. (2010) did not find large effects of the choice of tests when subject-specific scores were combined with HSGPA in regressions predicting FGPA, and they found only minor differences between their two cohorts. The R2 values from the AIMS and SAT models were nearly identical, differing by only .003 and .004 in the two cohorts. They did not provide regression coefficients for these models. They showed that the increase in R2 when adding SAT scores to HSGPA was larger for Asians than for Whites or Hispanics, but they did not provide corresponding results for models with HSGPA and AIMS scores. They did not examine groups other than those three, and they did not examine over- or underprediction.
Cimetta et al. (2010) also explored the effects of adding scores from the second test to a model predicting FGPA from HSGPA and scores on the other test. They found that using two tests did not appreciably improve aggregate prediction. The increase in R2 was essentially zero when AIMS was added to a model that included SAT scores and only .01 and .02 when SAT scores were added to a model that included AIMS scores. Cimetta et al. found that when all four scores were entered (mathematics and English or verbal, SAT and AIMS), several regression coefficients were near zero, and one in each cohort (AIMS reading in one cohort, AIMS mathematics in the other) were negative. They did indicate whether these were significantly different from zero.
McGhee (2003) used data from students entering five campuses of Washington State University in 2001 to compare the prediction of FGPA from HSGPA and both college admissions tests and a state test. The state test was the Washington Assessment of Student Learning, a survey test battery that was not high stakes for students. The study included both SAT and ACT scores. However, different samples took the SAT and ACT, and differences in results for these two tests could reflect differences between the samples. McGhee provided the R2 values from regressions predicting FGPA from HSGPA and one of the three tests, for each campus separately. There were modest differences in R2 values across tests, but these were inconsistent across campuses. McGhee did not examine differences in prediction for subgroups of students.
Coelen and Berger (as cited in Cimetta et al., 2010) compared the predictive value of scores on the SAT and the Connecticut Academic Performance Test (CAPT) for students who took the CAPT as sophomores in 1996. They found that the two English tests predicted GPA similarly, but they overlapped to the point where neither predicted independently when both were included in a model together. In contrast, the two mathematics tests did provide some independent predictive power.
A more recent study compared the Partnership for Assessment of Readiness for College and Careers (PARCC) tests to the Massachusetts Comprehensive Assessment System tests (Nichols-Barrer, Place, Dillon, & Gill, 2015). Because no students who had taken the PARCC tests while in high school had yet progressed to college, this study differed from others in the literature in that it used cross-sectional rather than longitudinal data. The two tests were administered to college freshmen who volunteered for participation in the study. The study is seriously underpowered and vulnerable to selectivity bias, but its results were consistent with the earlier studies in finding no significant differences in predictive power between the two tests.
Data
CUNY Sample
Our data include two cohorts. The 2010 cohort consists of students who graduated from high school in 2010 and entered the CUNY system as a freshman in 2010, 2011, or 2012. The 2011 cohort consists of students who graduated from high school in 2011 and entered CUNY as freshmen in 2011 or 2012. Because of data limitations, we restricted both cohorts to students who graduated from New York City public schools, who constitute the majority of CUNY students. We further restricted our sample to the 11 senior and comprehensive colleges, with the intention of focusing on students enrolled in 4-year programs. We were unable to differentiate between 2-year and 4-year students at the three comprehensive campuses, so we were unable to drop 2-year students from these campuses directly. However, most were deleted because we also dropped students who are missing either scores for the tests used in our analysis or HSGPA, and 2-year students typically did not submit SAT scores. Across the cohorts, SAT scores were missing for 19% to 38% of the students attending the three comprehensive colleges, but apart from the comprehensive colleges, where we expected this, the percentages of students missing test scores or HSGPA were small: Across campuses and cohorts, under 1% to 3% were missing SAT scores, 1% to 2% were missing one of the two Regents scores, and 1% to 5% of students were missing HSGPA. After removing these students with missing scores or missing HSGPA, our analytic samples include 86% and 88% of the original 2011 and 2010 cohorts, respectively, who attended senior and comprehensive colleges.
These results from these two cohorts did not differ appreciably, so we report most of our findings only for the 2011 cohort. The 2010 data include a modest number of additional cases (students who enrolled 2 years after high school graduation) and has a cleaner mathematics Regents variable, as explained below, but we focused on the 2011 cohort because the data for the 2010 cohort lack a usable variable indicating low-income status.
In our sample for the 2011 cohort, 15% of students identified as White, 15% Black, 24% Asian, and 25% Hispanic. Average SAT scores were slightly below the national average: 505 in mathematics and 464 in critical reading, compared with national averages of 514 in mathematics and 497 in critical reading (College Board, 2011). Additional descriptive statistics are presented in Table 1. The 2010 cohort was demographically similar.
Demographics of the CUNY 2011 Cohort

Note. CUNY = City University of New York; HSGPA = high school grade point average.
Kentucky Sample
Our data include students who graduated from high school and entered their 1st year of college in 2011 or 2012. We restricted the sample to students attending the eight campuses of the Kentucky system. We dropped students who were missing HSGPA scores or scores for either of the tests used in our analysis. We used the 2011 cohort as our primary data but report the modest differences between cohorts below. Across the 2011 cohort, 0.2% were missing ACT scores, 3.1% were missing KCCT scores, 0.06% were missing HSGPA, and 2.4% were missing FGPA. After removing the students with these missing scores, the analytic sample includes 94% of the original 2011 cohort.
In the 2011 cohort, the average ACT score for the cohort was somewhat above the national average: 21.9 in math and 22.9 in English, compared with the national average of 21.1 in math and 20.6 in English (ACT, 2015).
In the analytic sample for the 2011 cohort, 56% of students were female, 83% of students identified as White, 11% of students identified as Black, 2% of students identified as Asian, and 2% of students identified as Hispanic. Additional descriptive statistics for the 2011 cohort are presented in Table 2. The 2012 cohort was demographically similar.
Demographics of the Kentucky 2011 Cohort
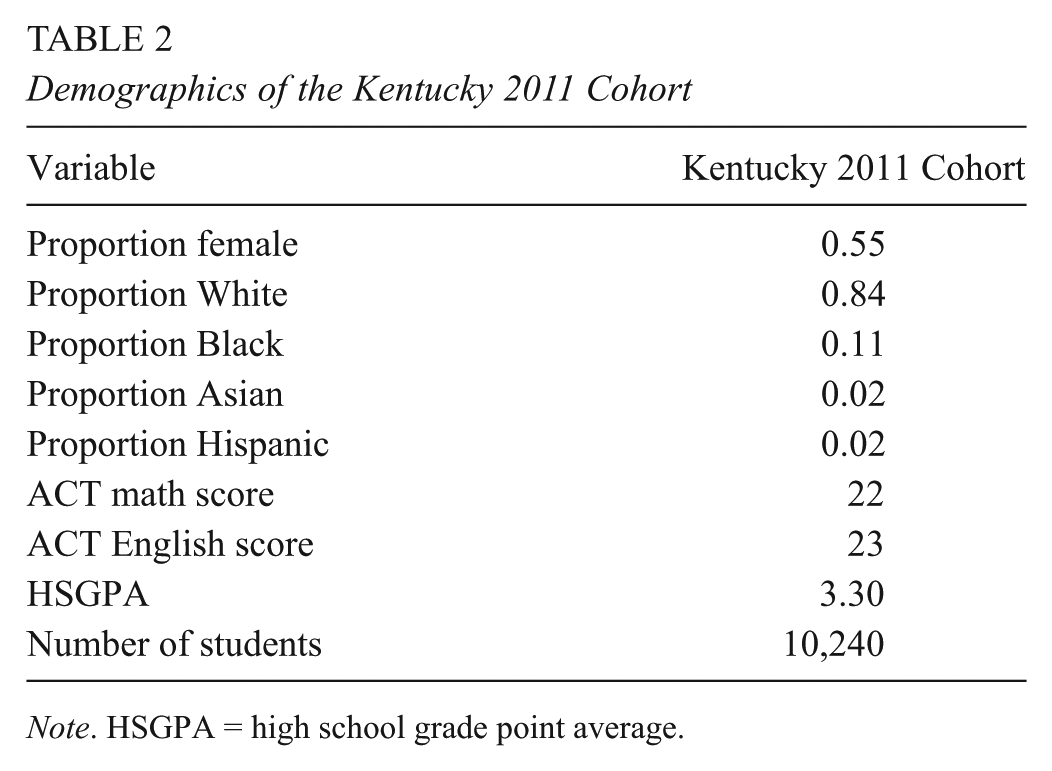
Note. HSGPA = high school grade point average.
Measures
Our outcome variable in both databases is FGPA, calculated on a 4-point scale and weighted according to the number of credits for each class. In both databases, we found a spike of students with failing grades in all courses, FGPA = 0 (Figure 1, Panels A and B). The distribution of scores, with almost no other cases with FGPA close to zero, suggested that these students were qualitatively different from others, and we excluded them from analysis. A sensitivity test showed that this decision did not have a substantial impact on our results (see online supplementary materials, Tables S.1 and S.2).
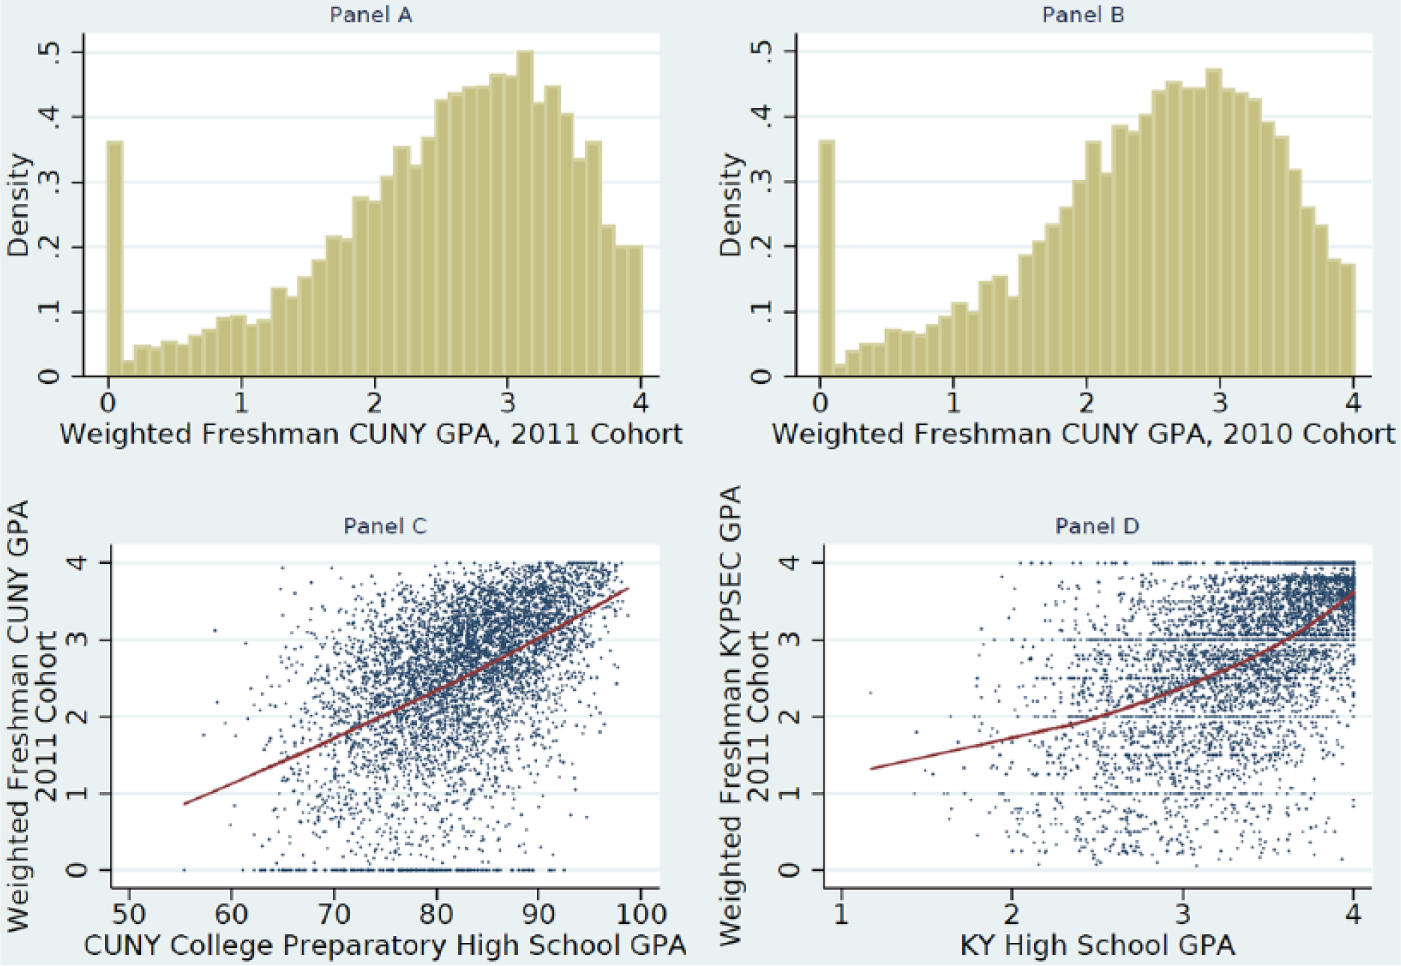
Panels A and B: Histograms of weighted freshman-year grade point average (FGPA) for the 2011 and 2010 cohorts. Panel C: Weighted FGPA plotted against City University of New York (CUNY) college preparatory high school GPA, 2011 cohort. Panel D: FGPA plotted against Kentucky high school GPA, 2011 cohort.
In the CUNY data, our predictors include HSGPA, SAT scores, and New York State Regents mathematics and English scores. HSGPA is on a scale of 50 to 100 and is calculated by CUNY based only on courses from a student’s transcript determined to be “college preparatory.” The HSGPA variable does not weight advanced courses differently except in the rare cases of high schools that report only weighted grades on their students’ transcripts. This differs from other studies (e.g., Bridgeman, McCamley-Jenkins, & Ervin, 2000) in which the HSGPA variable reflects all course grades on a student’s transcript. In all cases, the test scores we used were the highest available for a given student. Scores were left on their original scales.
The creation of the Regents mathematics score variable was complicated by the transition between two tests, the Math A exam and the Integrated Algebra exam that replaced it, that occurred while the students in our sample were attending high school. The first Integrated Algebra exam was administered in June of 2008, and the last Math A exam was administered in January of 2009. During this transition phase, students were allowed to take either exam, and some in our sample took both. The modal test for the 2011 cohort was the Integrated Algebra exam, taken by 76% of our analytic sample, while the modal test for the 2010 cohort was the Math A exam, taken by 95% of our analytic sample. In both cohorts, a Regents math variable was created by using the score on the modal test if available and the score on the nonmodal test otherwise. A sensitivity analysis test showed that the effects of this decision were minor (see online supplementary materials, Tables S.3, S.4, and S.12).
In the Kentucky data, our predictors were HSGPA, KCCT scores in mathematics and English, and ACT scores in mathematics and English. We normalized the KCCT scores and standardized the other predictors. The HSGPA variable was provided by the Kentucky Department of Education on a 1-to-4 scale. This measure does not weight advanced courses differently.
Methods
Our methods followed the conventions found both in the studies cited above and in the SAT validation literature (e.g., Bridgeman et al., 2000; Kobrin, Patterson, Shaw, Mattern, & Barbuti, 2008). To assess the strength of prediction, we estimated a series of single-level ordinary least squares (OLS) regression models in which FGPA was predicted by HSGPA, state test scores, and college admissions test scores, separately and in several planned combinations. Using this traditional approach has the advantage of making our findings directly comparable to a large, established literature. We used subject-specific rather than composite test scores as predictors to examine between-subject differences in the predictive power of scores and to contrast these differences across tests. 3
We applied two conventional tests of differences in prediction across groups of students. The first is a simple comparison of the strength of prediction across groups, often called “differential validity.” For example, Mattern, Patterson, Shaw, Kobrin, and Barbuti (2008) found that the correlation between SAT scores and FGPA is stronger for females than for males and stronger for Whites than for Blacks. The second examines over- and underprediction of FGPA, often called “differential prediction.” We calculated the mean of each group’s residuals from each of the prediction models. Positive mean residuals—underprediction—indicate that the selection disfavors that group, that is, that their predicted FGPA is lower than their actual FGPA. For example, Mattern et al. found that SAT scores overpredict the performance of Blacks and underpredict the performance of students whose best language is not English—that is, SAT scores favor the former and disfavor the latter.
It is common in the validation literature to conduct the analysis of overall prediction separately by campus and then to calculate an average of the regression results. This lessens the risk that between-campus differences in grading standards will attenuate the estimated predictive relationships. That is, using data pooled across campuses might create the risk of a conservative bias. However, we found that campus mean FGPA was strongly related to campus means of our predictors and nearly perfectly related to mean HSGPA (r = .97), which suggests a high degree of consistency in grading standards across the CUNY senior campuses. (See online supplementary materials for this analysis, Figure S.2 and Table S.5.) This in turn suggests that conducting analyses at the campus level is not necessary. A comparison of campus-level to system-level analyses suggested that campus-specific analysis discards important information; we estimated the same model both within campus and in the pooled sample and found that the average R2 from the campus-level regressions was lower than the corresponding R2 from the pooled analysis. Therefore, we focus primarily on the pooled results for simplicity. However, we also present campus-level results for all of the CUNY campuses and examine the consistency of those findings to the results of the pooled analyses.
We estimated six regression models for each data set: HSGPA alone, college admissions scores alone, state test scores alone, HSGPA with college admissions scores, HSGPA with state scores, and HSGPA with both sets of scores. We report standardized coefficients to allow for comparisons across variables reported on different scales.
For a number of reasons, we did not adjust the data for measurement error or restriction of range, both of which may attenuate the standardized coefficients in our models. Our primary purpose was to compare models across tests, not to compare the magnitude of the coefficients within models. Both measurement error and restriction of range would have similar effects regardless of the test scores used, so these corrections would not have a major impact on our findings. We did not disattenuate for measurement error for two additional reasons. First, the uncorrected relationship is the one relevant to admissions decisions. Second, we lack information on the reliability of the FGPA and HSGPA variables, both of which are certainly far less reliable than either set of test scores. We also had two additional reasons not to apply a correction for restriction of range. We lack information on the distribution of college admissions scores for the applicant pools of the campuses in our data, and it is the applicant pool rather than the population of students that would be the most appropriate population. Moreover, the conventional correction for restriction of range can be seriously misleading if the selection function differs from the simple selection assumed in the derivation of the correction (e.g., Linn, 1983).
Results
We first present brief descriptive findings. We then present the pooled-sample regression models for one cohort in each data set and evaluate the stability of these results across cohorts. We follow this with campus-level results from the CUNY system. Finally, we present our findings pertaining to the effects on subgroups of students, again using the CUNY data set.
Descriptive Results
In the CUNY system, correlations between FGPA and scores are similar for the Regents and SAT tests (Table 3). In English, the correlation with Regents scores was slightly higher than that with SAT scores: r = .33 compared with r = .29. In mathematics, the two correlations were for all practical purposes the same: r = .35 and r = .36, respectively. Between-test correlations differed substantially by subject. The correlation between the two mathematics scores was r = .77, compared with r = .57 in English.
Student-Level Pearson Correlations Between Outcome and Predictor Variables for the CUNY 2011 Cohort

Note. CUNY = City University of New York; GPA = grade point average.
For the most part, correlations in the Kentucky data were similar to those in the CUNY data. Again, correlations with FGPA were similar for the two tests. The two primary exceptions both involved the ACT English test. Whereas in the CUNY data, SAT critical reading had the weakest correlation with FGPA (r = .29), in Kentucky, the ACT English test had the strongest (r = .37; see online supplementary materials, Table S.6). ACT English scores also showed a substantially stronger correlation with HSGPA than did the SAT critical reading test (.50 vs. .30, respectively).
In the CUNY data, despite a clear ceiling in the distribution of FGPA, a lowess plot showed a linear relationship with HSGPA (Figure 1, Panel C). In contrast, in the Kentucky data, a lowess curve suggests a nonlinear relationship (Figure 1, Panel D). A sensitivity test showed that while the HSGPA 2 term is significantly nonzero in the Kentucky models, including it has very little effect on other coefficients (see online supplementary materials, Table S.7). For the sake of comparability with the CUNY models and the extant literature, we did not include it.
Pooled Regression Results: CUNY, 2011 Cohort
When only one predictor is used (HSGPA or either set of two subject-specific tests), HSGPA is the strongest predictor of FGPA (R2 = .25; Table 4, Models 1, 2, and 3). This is a common finding (e.g., Bridgeman et al., 2000). The predictive value of the two tests was similar, with Regents scores (R2 = .16) only trivially more predictive than SAT scores (R2 = .14).
Regression Results for CUNY 2011 Cohort, Pooled Across Campuses

Note. CUNY = City University of New York; GPA = grade point average.
p < .05. **p < .01. ***p < .001.
When tests are used alone (Models 2 and 3), the subject area tests differ in predictive power: Mathematics scores have more predictive value than English scores, regardless of the test. The small difference in predictive power between Regents and SAT scores is entirely explained by the English language arts tests, as the Regents comprehensive English is substantially more predictive than SAT Critical Reading (
However, the differences between both tests and subjects are minor in a traditional model that includes both HSGPA and test scores (Models 4 and 5). In these models, the coefficients for mathematics are only slightly larger than those for English, and in each subject, the SAT and Regents coefficients are similar.
Our findings are consistent with previous research in showing that including test scores along with HSGPA adds only a small but statistically significant amount of predictive power beyond that provided by HSGPA alone. The performance of the SAT and Regents tests is nearly identical in this respect. SAT scores increase R2 by only .03 (p < .001), while Regents scores increase R2 by .02 (p < .001; Models 4 and 5 compared with Model 1). The total prediction is therefore nearly identical for models using HSGPA and scores (R2 = .28 and R2 = .27 for the SAT and Regents tests, respectively).
Although adding scores to HSGPA improves prediction only slightly, adding HSGPA to test-only models substantially strengthens prediction. It doubles R2 in the case of the SAT (.14 to .28) and increases it similarly in the case of Regents scores (.16 to .27).
Adding either set of tests to a model that included HSGPA and the other tests had only trivial effects on the strength of prediction. The model with HSGPA and both tests (Model 6 in Table 4) and the model with HSGPA and SAT scores (Model 4) both yield R2 = .28, and the model with HSGPA and Regents scores (Model 5) produces R2 = .27.
Nonetheless, the results of this model indicate that in this particular context, the college admissions test and state test are not entirely duplicative. Including both tests reduces the parameter estimates, as one would expect given the matrix of positive correlations. However, all four coefficients remain significantly nonzero. This is in contrast to the findings of the Cimetta et al. (2010) study described above, in which some state test score coefficients went to zero when FGPA was predicted by a combination of HSGPA and scores on both tests.
Pooled Regression Replication: Kentucky Data, 2011 Cohort
Analysis of the same cohort in Kentucky replicated the principal results from the CUNY models. In both databases, HSGPA is the strongest single predictor, adding scores from either the college admissions or the state tests produced a small increase in the aggregate strength of prediction, and adding the second test when one was already in the model had no appreciable effect on the strength of prediction (Table 5). As in the CUNY data, the choice of test had no appreciable impact on the strength of prediction in the Kentucky data; in Models 4 and 5, R2 = .34 and .33, respectively.
Regression Results for Kentucky 2011 Cohort, Pooled Across Campuses

Note. GPA = grade point average; KCCT = Kentucky Core Content Test.
p < .05. **p < .01. ***p < .001.
The Kentucky results differ in several other respects, but these do not affect our primary conclusions. HSGPA is a somewhat stronger predictor in all models in the Kentucky data, and aggregate prediction is slightly stronger than in comparable models in the CUNY data. Perhaps most striking is that the predictive power of the two subject-specific tests is reversed. In the CUNY data, when tests are used without HSGPA, mathematic scores are a stronger predictor, particularly in the case of the SAT. When HSGPA and scores are used together, mathematics scores remain more predictive but by a very small amount. In Kentucky, the reverse is true. When tests are used alone, English scores are stronger predictors (ACT) or comparably important (KCCT). In the more conventional models that include both HSGPA and one set of scores, English scores are more predictive than mathematics scores regardless of the test used.
One other notable difference appears when both tests are used along with HSGPA (Model 6). In CUNY analysis, all coefficients remained positive and significantly nonzero. In contrast, in the Kentucky model, this was true of the English tests but not of the mathematics scores. With both tests included, the parameter estimates for both mathematics tests were trivial and not significantly nonzero.
Between-Cohort Differences
We replicated the models in Tables 4 and 5 for the subsequent cohort in Kentucky and the previous CUNY cohort.
In the case of CUNY, the results from the (2010) cohort were virtually identical (see online supplementary materials, Table S.8). The R2 values were unchanged in models that did not include Regents scores. In the three models with Regents scores, R2 was slightly larger, by .02 when only scores were included and by only .01 when HSGPA was included. Changes in coefficients were mostly small and were inconsistent in direction. However, the coefficients for English scores were slightly but consistently larger, by .02 or .03.
In Kentucky, however, the two cohorts differed a bit more: Prediction was consistently stronger in the more recent (2012) cohort. The R2 values increased by .03 in all models but one (see online supplementary materials, Table S.9). The two variables that showed the largest increases in coefficients were HSGPA and ACT mathematics scores. We are not aware of any relevant changes in testing or policy between these two cohorts. Despite this increase in predictive power, however, our most important findings were replicated in the 2012 data. Regardless of whether HSGPA was included in the models, the strength of prediction was not substantially affected by the choice of tests, with R2 differing by only .01 in both cases.
Campus-Level Models, CUNY System
For simplicity, we present here only two models for each of the 11 CUNY campuses: HSGPA and SAT scores (Table 6) and HSGPA and Regents scores (Table 7).
Campus-Level Results for Model 4, 2011 CUNY Cohort
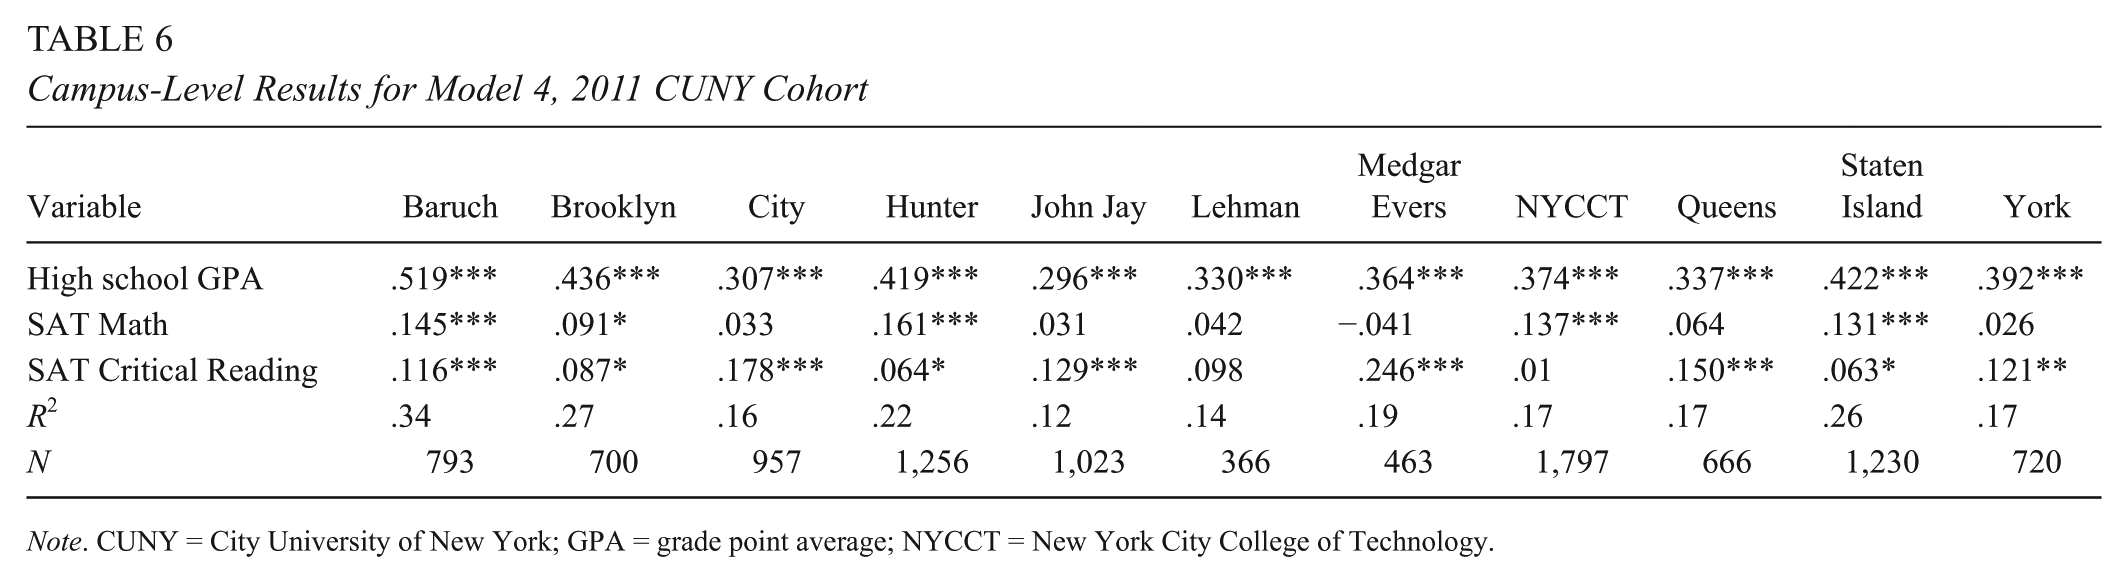
Note. CUNY = City University of New York; GPA = grade point average; NYCCT = New York City College of Technology.
Campus-Level Results for Model 5, 2011 CUNY Cohort

Note. CUNY = City University of New York; GPA = grade point average; NYCCT = New York City College of Technology.
The predictive power of HSGPA and scores together varied markedly among campuses. The R2 for these models ranged from .12 to .14 (John Jay and Lehman) to .34 and .33 (Baruch; Tables 6 and 7).
Despite these large differences among campuses in R2, the choice of test had almost no impact on the strength of prediction. In all but two campuses, the absolute difference in R2 between the SAT and Regents models to two places beyond the decimal was either zero or .01. The exceptions were Hunter and Medgar Evers, where the R2 from the SAT models was larger by .02 and .03, respectively.
In all campuses, HSGPA was by a substantial margin the strongest predictor regardless of the test used, with coefficients ranging from .26 to .52. In all campuses, the predictive power of HSGPA was larger when SAT scores were used in the model, but these differences in coefficients were small, ranging from .0 to .04 across campuses.
The coefficients on scores, however, varied dramatically among campuses. The estimates for SAT math ranged from –.04 to .16 and were not significantly different from zero in six of the 11 models (Table 6). Estimates for SAT critical reading scores were significant in nine of 11 models but ranged from .01 to .25. The ranges of coefficients were roughly similar in models using Regents scores (Table 7).
More important for present purposes, however, are the within-campus between-test differences, and these were small on most campuses. The absolute value of the difference in coefficients for the two math tests fell between .01 and .04 in all but two campuses, Medgar Evers (Regents larger by .18) and Hunter (SAT larger by .07). Likewise, the absolute difference in coefficients for the two English tests ranged from .01 to .04 in all but two campuses, Medgar Evers (SAT larger by .23) and Lehman (SAT larger by .06).
Because the smaller samples at the campus level raise the risk of patterns reflecting chance, we replicated these models with the 2010 cohort. The between-cohort differences were minor and do not alter the general patterns described above. The maximum absolute value of the campus-level difference in R2 between cohorts was .06 regardless of the test used in the model in all campuses except one, Brooklyn College, ΔR2 = .13 and .14. Differences in the coefficients in the model were also mostly modest. (Campus-level results for Models 4 and 5 are provided in online supplementary materials, Tables S.10 and S.11.)
Thus, despite the marked variations among campuses in estimated relationships, these results largely echo those of the pooled analysis in suggesting that the choice of test rarely has a substantial impact on prediction.
Which Students Are Disadvantaged by the Choice of Test?
Consistent with prior research, we found substantial variations in the strength of prediction across demographic groups, but we found no substantial differences between the SAT and Regents tests in this regard. Both tests have a weaker association with FGPA for Black, Hispanic, and low-income student groups than for Whites and students who are not low income, and these differences are similar in magnitude for the two tests (Table 8).
Correlation of Academic Achievement Measures With CUNY FGPA for Select Student Subgroups

Note. CUNY = City University of New York; FGPA= freshman-year grade point average; HSGPA= high school grade point average.
Similarly, when tests are used alone without HSPGA to predict FGPA, the SAT and Regents scores produce very similar patterns of over- and underprediction. The FGPA of Black students and Hispanic students is overpredicted when each test is used separately to predict FGPA, but that of low-income students is accurately predicted (Table 9, Models 2 and 3). The overprediction is more severe for Blacks (–.12) than for Hispanics (–.05 and –.07). Necessarily balancing the overprediction of FGPA for Black and Hispanic students is modest underprediction for White and Asian students.
Mean Overprediction (–) and Underprediction (+) of CUNY FGPA by Academic Achievement Predictors for Particular Student Subgroups (Residuals)

This greater overprediction for Blacks than for Hispanics is consistent with earlier studies (e.g., Bridgeman et al., 2000; Mattern et al., 2008). Although the overprediction of Hispanic students by SAT is lower in the present study than in one earlier study of the SAT (Mattern et al., 2008), it is similar to the findings of a previous study (Bridgeman et al., 2000).
Regardless of the test, including HSGPA in the model with test scores reduced the overprediction for Black students by more than half, from –.12 to –.04 and –.05 with the SAT and Regents, respectively (Table 9, Models 4 and 5). In contrast, adding HSGPA has no appreciable effect on the overprediction of the FGPA of Hispanic students.
Finally, we evaluated the impact on over- and underprediction of adding scores on the second test to a conventional model that includes HSGPA and scores on one test. Adding a second test to the model had no appreciable effect on over- and underprediction for any student groups.
Discussion
The current emphasis on standards and assessments focusing on readiness for college and career underscores a question that has received only limited empirical attention to date: How different are states’ summative tests and college admissions tests in terms of their ability to predict performance in college? The extant literature suggested that neither substituting a state test for a college admissions test nor adding it to the prediction model had a large effect on the prediction of FGPA. However, this literature is severely limited. It comprises a small number of studies using old data. It includes a very limited range of state tests—no EOC tests and only one test that may have had consequences for students. It provides almost no information on the impact of the choice of test on important subgroups of students. None of the existing studies compare findings across systems.
This study was undertaken to help fill some of these gaps. We applied conventional prediction models to more recent data, and we conducted parallel analyses in two contexts with very different testing programs.
Our first finding is consistent with the limited earlier literature: The choice between summative state tests and college-admissions tests does not appreciably affect the strength of aggregate prediction, as indexed by the R2 from single-level OLS models. Also consistent with earlier research was our finding that adding scores on a state test to a model that includes HSGPA and scores on a college admissions test had only trivial effects on the strength of prediction. This finding held in both data sets, despite some differences in the prediction equations and major differences in context: EOC tests that were high stakes for students in one versus survey tests without high stakes for students in the other, the SAT in one versus the ACT in the other, and very different demographics in the two contexts. It also held at the level of individual campuses, despite the substantial differences in prediction equations across campuses.
Perhaps more surprising is our finding that over- and underprediction in the CUNY system was largely unaffected by the choice of test or by inclusion of both tests in the model. There were two reasons to expect that the choice of test might matter in this respect. First, although supplementing college admissions tests with state test scores had little effect on the strength of prediction, the two tests were not entirely duplicative. In the CUNY system, all four of the subject-level tests had significantly nonzero positive coefficients when all were included in a model with HSGPA. This implies that the tests might advantage or disadvantage different groups of students.
The second reason one might expect differences in under- and overprediction is likely different patterns of preparation for the state test and college admissions tests. Previous studies have shown that at least in some contexts, preparation for state tests varies with the demographic characteristics of students and schools (e.g., Diamond & Spillane, 2004; Herman & Golan, 1993; Jacob, Stone, & Roderick, 2004; Lipman, 2002; McNeil & Valenzuela, 2001). Although systematic data are lacking about variations in preparation for college admissions tests, it is clear that many advantaged students purchase preparation from private companies that less advantaged students would find prohibitively expensive. Variations in preparation across groups could generate both meaningful differences in performance and differences in score inflation.
Our findings cast doubt on Cimetta et al.’s (2010) conclusion about the impact of high stakes for students. They suggested, albeit noting that their findings were insufficient to rule out alternatives, that the slightly stronger prediction they found in their second cohort, which expected scores to be used as a graduation requirement, stemmed from the imposition of high stakes for students. We found a larger change in prediction between our two Kentucky cohorts, which experienced no change in stakes. This instability underscores that one cannot draw conclusions about the impact of a testing change from a single cohort unless the effects are very large. It remains possible that in some contexts, with some tests, high stakes will affect prediction, but a different research design would be required to ascertain this.
Although our findings are straightforward and consistent across settings, they leave many important questions unaddressed.
First, the accumulated research is still limited and reflects only a small fraction of the wide variety of demographic contexts, testing programs, and postsecondary programs for which these questions are germane. Although our principal findings about the similar predictive value of state and college admissions tests are consistent across two very different contexts, that finding does not imply that there are not important variations across other contexts. One indication that findings might differ elsewhere is that one of our other findings—the relative predictive power of HSGPA and test scores—is different in magnitude from the results reported in the most recent SAT validation study published by the College Board (Kobrin et al., 2008), which was based on a national but not representative set of institutions. Kobrin et al. found only slightly stronger prediction by HSGPA alone (R2 = .13) than by the SAT alone (R2 = .10), and they also found that combining both predictors yielded appreciably better prediction than either alone (R2- .19). In contrast, in both the CUNY and Kentucky data, we found substantially stronger prediction by HSGPA alone than by either set of tests alone, and we also found that adding either set of tests to HSGPA had only a very small effect on prediction. This raises the possibility that between-test comparisons may also yield different results in other contexts and suggests the need for further replication.
Second, our focus was coarse: aggregate prediction at the level of entire campuses or systems. It is entirely plausible that the two types of tests differ in value for subsets of the student population—for example, for students at different ability levels, for students applying to schools that differ in selectivity, or for students entering different fields of study. Similarly, we looked at over- and underprediction only for a small number of subgroups. Our results suggest that some students may be advantaged or disadvantaged by the choice of test, but different analytical approaches would be needed to identify them.
Third, we considered only one outcome, FGPA. Although this is the outcome most commonly used in studies predicting postsecondary performance from test scores, it is not the only one, and it is not necessarily the most important. This work could be extended to longer-term outcomes, such as persistence and 4- and 6-year completion.
Fourth, our study shares an important limitation with the earlier Cimetta et al. (2010) and McGhee (2003) studies: We did not examine students who crossed state lines to enroll in college. State tests vary a great deal in content, format, and difficulty, and it is plausible that the variety of state test scores presented by students applying to campuses that admit many out-of-state students vary in their predictive properties.
The large number of out-of-state students in many applicant pools also raises a serious practical issue that limits the applicability of our results to practice. Ideally, to compare applicants who submit different test scores, admissions officers would want a link that allows them to treat a score of X on one test as comparable to a score of Y on another, such as the ACT-SAT concordance tables used by many colleges. Providing colleges with concordance tables for multiple state tests would presumably be prohibitive. Nonetheless, as we noted, this need not render high school tests useless. They could be used for in-state students, for students from other states that share tests (such as SBAC or PARCC), or as a supplement to rather than a substitute for traditional college admissions tests.
Despite the practical impediments to substituting state summative tests for college admissions tests, further comparisons would be valuable because the design of both types of tests continues to evolve. Moreover, as long as state tests are intended to support inferences about college readiness, empirical evidence about the strength of prediction of postsecondary outcomes will be essential validity evidence.
Footnotes
Acknowledgements
The research reported here was supported by the Institute of Education Sciences, U.S. Department of Education, through Grant R305AII0420 to the President and Fellows of Harvard College and by the Inequality and Social Policy program at Harvard University and the Harvard Graduate School of Education’s Dean’s Summer Fellowship. The authors thank the City University of New York and the New York State Education Department for the data used in this study. The opinions expressed are those of the authors and do not represent views of the Institute, the U.S. Department of Education, the City University of New York, the New York State Education Department, the Inequality and Social Policy program, or the Harvard Graduate School of Education.
Notes
Authors
DANIEL KORETZ is Henry Lee Shattuck Professor of Education at the Harvard Graduate school of Education, 415 Gutman Library, 6 Appian Way, Cambridge, MA 02138;
CAROL YU is currently associate director of teacher evaluation and selection at Bridge International Academies;
PREEYA P. MBEKEANI is a doctoral student in quantitative policy analysis in education at the Harvard Graduate School of Education and a doctoral fellow in the multidisciplinary program in inequality and social policy;
MEREDITH LANGI is currently a doctoral student in the Graduate School of Education and Information Studies at the University of California, Los Angeles;
TASMIN DHALIWAL is currently a doctoral student in the Rossier School of Education at the University of Southern California;
DAVID BRASLOW is a doctoral student in the education policy, leadership, and instructional practice program at the Harvard Graduate School of Education, 13 Appian Way, Cambridge, MA 02138;
References
Supplementary Material
Please find the following supplemental material available below.
For Open Access articles published under a Creative Commons License, all supplemental material carries the same license as the article it is associated with.
For non-Open Access articles published, all supplemental material carries a non-exclusive license, and permission requests for re-use of supplemental material or any part of supplemental material shall be sent directly to the copyright owner as specified in the copyright notice associated with the article.