
Abstract
Leveraging data from two nationally representative cohorts from the ECLS-K (Early Childhood Longitudinal Study–Kindergarten), we examine the types of transition practices that schools use to ease children’s adjustment to formal schooling. The transition to kindergarten is a critical juncture in a child’s life that entails a host of social, behavioral, and academic changes. We find a modest increase between the two cohorts in the number of transition practices that schools offer children and their families, although we also find that fewer of these practices are offered in traditionally underserved schools. We conclude with a discussion of the implications of these findings and suggest areas for future research.
T
The purpose of this article is not to evaluate the efficacy of transition practices for improving academic and noncognitive skills in early grades. That will need to be addressed by others using a different study design. Here, we are interested in revealing the prevalence of different transition practices, the distribution of those practices across varied school settings, and any changes in their use over time. Consistent with previous studies, our findings suggest that schools continue to be much more likely to report using low-intensity practices, such as sending information home to parents, than high-intensity practices, such as having a preschool class visit a kindergarten classroom. Additionally, we find that the use of readiness assessments is common among elementary school principals, who report using assessment results to individualize instruction and to identify children in need of additional testing. We also find a modest increase in the overall number of transition activities used by elementary schools between 1998–1999 and 2010–2011, as well as changes in the proportion of schools using specific types of transition activities. Apart from changes in the types of activities used, we find substantive shifts in the ways that kindergarten readiness assessments have been used over the 12 years studied. Finally, we find that schools serving traditionally underserved student populations report using fewer transition activities, meaning that the students who could benefit most from such activities are the least likely to receive them. In the following sections, we motivate the need for this study, review the extant literature on transition practices, and present our data, methods, and results. Finally, we conclude by placing the findings in the context of current policy discussions.
Literature Review
A large body of evidence points to the importance of early educational experiences on proximal and distal outcomes. In fields from education and psychology to neuroscience and economics, studies have shown that children’s early educational experiences are highly consequential and have lasting effects throughout their educational careers and later stages of life (Barnett, 2008; Campbell et al., 2014; Chetty, Friedman, Hilger, et al., 2010; Claessens & Engel, 2013; Phillips & Shonkoff, 2000; Watts, Duncan, Siegler, & Davis-Kean, 2014; Watts et al., 2015). While much attention has been given to early childhood interventions such as preschool (Barnett, 2008, 2011; Campbell et al., 2014; Curran, 2015; Jenkins et al., 2016; Magnuson et al., 2007a, 2007b), studies have demonstrated that the experiences of students during the first year of formal schooling—kindergarten—are also highly predictive of immediate and later outcomes (Chetty, Friedman, Hilger, et al., 2011; Claessens & Engel, 2013; Claessens, Engel, & Curran, 2014; Fusaro, 1997; Morgan, Farkas, Hillemeier, & Maczuga, 2016; Watts et al., 2015). For instance, structural characteristics, such as the length of the kindergarten school day and class size, are associated with increased achievement through the early years of elementary school (Cooper, Allen, Patall, & Dent, 2010; Krueger & Whitmore, 2001). Furthermore, features of the kindergarten experience, such as the quality of the teacher, as well as some of these structural characteristics (e.g., class size), have recently been shown to influence outcomes as remote as college attendance and earnings nearly two decades later (Chetty, Friedman, Hilger, et al., 2011; Dynarski, Hyman, & Schanzenbach, 2013).
The ability of students to fully engage in and benefit from their kindergarten experiences has been shown to depend on the degree to which they successfully transition into kindergarten, and the success of that transition is at least partially predicated on their home and early educational backgrounds. Evidence from Rimm-Kaufman, Pianta, and Cox (2000), for example, indicates that 48% of children have difficulty adjusting to school, and these difficulties are most prevalent for children from low socioeconomic backgrounds. One third of the teachers surveyed for the study reported that more than half of their students had difficulty following directions, lacked basic academic skills, and struggled to work independently.
Difficulties in transitioning to kindergarten may only be exacerbated by recent shifts in the orientation of kindergarten to focus more on academic content. New research has documented the increasing focus on academics during the kindergarten year; specifically, evidence shows an increase in the academic expectations of teachers, the level of literacy and mathematics content taught, and the use of teacher-directed instruction in kindergarten between 1998–1999 and 2010–2011 (Bassok, Latham, & Rorem, 2016; Bowdon & Desimone, 2014). Additionally, kindergarten has undergone structural changes over this period, with the majority shifting from part- to full-day programs (Bassok et al., 2016). Each of these changes might be expected to increase the difficulty that kindergartners have adjusting to school.
Understanding the importance of kindergarten, school leaders have sought ways to smooth the school transition to help children make the most of their early-grade experiences. We focus in this article on two such approaches: (a) the transition activities that schools offer children and their families at the beginning of the kindergarten year and (b) schools’ use of readiness assessments to identify the skills that students bring with them. For our purposes here, transition activities include steps taken by the school or teacher—such as hosting an orientation night, sending home information about kindergarten, or visiting students’ homes—to help ease children’s transition into kindergarten. Readiness assessments refer to testing instruments administered to gauge students’ incoming skills and provide information that teachers and administrators can use to determine placement or individualized instruction. Together, these transition practices involve ways that schools provide information outward to parents, caregivers, and children about kindergarten and receive information about incoming students to best serve their needs. We now turn to review the existing literature on each of these approaches, beginning with transition activities and moving onto readiness assessments.
Kindergarten Transition Activities
The most comprehensive study of kindergarten transition activities and their prevalence comes from the National Center for Early Development and Learning. Published in 1999, the study draws on data from the 1996–1997 academic year and suggests that nearly all kindergarten teachers utilize some transition activities but that there is considerable heterogeneity in the use of specific types of activities (Pianta et al., 1999). Moreover, “high intensity” activities, or those that involve individualized contact with parents and occur before the first day of school, are less common than “low intensity” activities, such as sending information home via a flyer (Daley, Munk, & Carlson, 2011; Pianta et al., 1999). Furthermore, studies document fewer high-intensity activities in schools serving lower-income students or located in larger districts (Daley et al., 2011; Pianta et al., 1999).
Such variation in the use of activities may have important implications for student success, given findings that link their use to student outcomes. After controlling for socioeconomic and demographic factors, Schulting, Malone, and Dodge (2005) found, using the ECLS-K 1998–1999 data, that the number of transition activities that a school employs is associated with higher student achievement scores at the end of kindergarten. Furthermore, the authors found that the effect of transition activities was stronger for low-income students than more affluent students. Given that the number of transition activities offered by a school was associated with increased academic achievement in kindergarten, a key contribution of this article will be to examine if the total number of activities that schools offer has changed over time and, if so, for which types of schools.
Apart from Schulting et al. (2005), we could find no other study in the literature that evaluated the effects of commonly practiced transition activities on student outcomes. There is additional research, however, that considers longer-term and/or more intensive school transition programs. Evidence from a randomized controlled trial of a comprehensive transition orientation program, for example, found that the program improved teachers’ ratings of the transition to the social aspect of kindergarten for girls. The study also found that children who experienced the transition intervention with the same teacher that they would have in kindergarten were better able to adjust to kindergarten routines (Berlin, Dunning, & Dodge, 2011). The program was a 4-week intervention that focused on parental engagement, school routines, and preliteracy and prenumeracy skills; specifically, it involved providing rising kindergartnerers 4 weeks of classroom time with kindergarten teachers and teaching assistants, during which students were exposed to curriculum specific to developing social competence and understanding school routines (Berlin et al., 2011).
Several federally supported transition programs, such as those associated with Project Head Start, have also been evaluated. Like the orientation program described above, these programs generally represent much more comprehensive interventions than those offered by individual schools (Kagan & Neuman, 1998). They include Head Start with Follow Through, which provides an aligned, continuous curriculum spanning preschool through early elementary years; Project Developmental Community, which provides pre- and in-service teacher training on transition practices; and the Head Start Transition Project, which arranges kindergarten classroom visits prior to the start of school as well as summer activity lists for children (Kagan & Neuman, 1998). Evidence suggests that the implementation of transition activities matters. Studies have demonstrated that coordination between preschool and primary school teachers around transitions are important (Ahtola et al., 2011; Desimone, Payne, Fedoravicius, Henrich, & Finn-Stevenson, 2004).
The evidence on transition activities suggests that at least some of these activities may be effective for improving student outcomes in kindergarten. Nevertheless, the evidence on the effects of transition activities is not very specific, with studies focusing on comprehensive transition programs or the aggregate number of transition activities that a school uses, as opposed to specific individual activities (Pianta et al., 1999; Schulting et al., 2005). There is, however, theoretical evidence from Pianta and colleagues (1999) that high-intensity activities that make individualized connections and span across time will be most effective. Research from the 1990s and early 21st century suggested that, at the time, such high-intensity activities were less common than lower-intensity activities and that transition activities in general were less available for underserved student populations (Daley et al., 2011; Pianta et al., 1999). That said, little research has examined the prevalence and distribution of transition activities in more recent data, despite numerous changes to the nature and policy context of kindergarten (Bassok et al., 2016; Bowdon & Desimone, 2014).
Kindergarten Readiness Assessments
Far less research has examined schools’ administration of kindergarten readiness assessments and the use of the data that they produce. The primary focus of the existing literature on the topic is on the technical aspects of defining school readiness and issues regarding the instrumentation of specific readiness measures (Mashburn & Henry, 2004; Snow, 2006). Although 21 states required the use of universal readiness assessments in kindergarten in 2011 (Howard, 2011), we are unaware of any studies, peer reviewed or otherwise, examining the prevalence of school readiness assessments at the district or school level or the range of ways in which schools utilize data from them. Furthermore, in the competition for Race to the Top—Early Learning Challenge, a core priority for funding was for states to “administer a kindergarten entry assessment, aligned with the Early Learning and Development standards, to all children entering a public school kindergarten” (U.S. Department of Education, 2011). Elsewhere, we are conducting a review of agency websites in the 50 states and the U.S. Department of Education to reveal how many states today require an assessment for all or a subset of its kindergarten students (Little & Cohen-Vogel, 2016).
The Present Study
This study makes several important contributions to the literature on kindergarten transition practices. First, much of our current understanding of the prevalence of kindergarten transition activities (e.g., parent orientations, home visits) comes from data collected during the 1996–1997 academic year as part of the National Center for Early Development and Learning (Pianta et al., 1999). Nearly 20 years later, much has changed in terms of what we know about the importance of early educational experiences and with regard to what kindergartners are being asked to do. In the context of No Child Left Behind and increased accountability pressure, there is evidence that kindergarten teachers and their administrators faced significant pressure to prepare students for mandatory tests in mathematics and reading in third grade (Booher-Jennings, 2005; Cohen-Vogel, 2011; Grissom, Kalogrides, & Loeb, 2014; Jacob, 2005). In fact, in a comprehensive analysis of changes in kindergarten between 1998 and 2010, Bassok et al. (2016) found substantial changes in terms of kindergarten teachers’ beliefs about school readiness, time spent on academic and nonacademic content, classroom organization, pedagogical approach, and use of standardized assessments. Finally, the demographic composition of public schools has changed dramatically over the past 20 years, with the proportion of Hispanic students increasing from 14% to 27% (U.S. Department of Education, n.d.). Together, these changes have likely led schools to expand and retool the ways that they transition students.
The current study leverages survey items—common to both the 1998 and the 2010 versions of the ECLS-K—about transition practices to examine whether and how things have changed. We include all of the school-based transition measures that are available in the ECLS-K surveys, but it is important to point out that schools may engage in other practices not included in the survey—practices such as sharing student records between prekindergarten and kindergarten teachers and coordinating the prekindergarten and kindergarten curricula (LoCasale-Crouch, Mashburn, Downer, & Pianta, 2008). That said, the transition practices that we cover in this article represent the majority of practices that have been examined in previous literature (Pianta et al., 1999) and extend on that work to include readiness assessment use.
In this article, we address the following four research questions:
Question 1: What transition activities do elementary schools employ, and which activities are most common?
Question 2: How do educators use data from kindergarten readiness assessments?
Question 3: How has the prevalence of transition activities and the use of readiness assessments changed over time?
Question 4: Are school-level geographic, structural, and demographic factors associated with schools’ use of transition practices?
Answering these questions has the potential to inform our understanding of the prevalence of kindergarten transition practices while providing insight into the degree to which the use of these practices has changed over time and varies across school contexts. These answers can inform policy makers and educators as they continue their work to improve the kindergarten experience for all students regardless of where they live or what their family background is.
Conceptual Model
We rely on the ecological and dynamic model of transition outlined by Rimm-Kaufman and Pianta (2000) to conceptualize the transition from preschool to kindergarten. As Rimm-Kaufman and Pianta note, the ecological and dynamic model of transition “defines the transition to school in terms of the dynamic qualities of the transition ecology—the interconnectedness of relationships among child characteristics; and peer, family, school and neighborhood contexts—and how these connections develop and change” (p. 492). This framework builds on a range of similar ecologically orientated systems theories, such as Bronfrenbrenner and Morris’s (1998) bioecological model and Pianta and Walsh’s (1996) developmental/ecological framework.
At the center of this model is the child (see Figure 1). According to the model, characteristics of the child, such as temperament and intelligence, are affected by external factors, such as family, neighborhood, teachers, and peers. These external factors interact, and these interactions can in turn affect child-level outcomes. The development of a strong family-teacher bond, for example, has been shown to help foster positive outcomes for children (Crosnoe, 2004; Epstein & Sanders, 2000). Guidance from the ecological and dynamic model of transition helped us to conceptualize the various practices examined in our study as potentially representing the interconnectedness of factors shaping the school transition process. Some of the practices in which schools engage to facilitate transition appear to better recognize and foster the interconnectedness of contextual factors. Having preschool students and their parents visit a kindergarten classroom together before the start of the school year honors these interconnections by bringing children, families, teachers, and peers together for a shared experience. Sending a notice home with a child—a notice that cannot be read by a child of preschool age—is an activity that does little to recognize the ecology of the transition process. The classroom visit described here is an example of a transition practice that Pianta et al. (1999) termed high intensity because of its recognition of interconnections described in the ecological and dynamic model of transition; in contrast, practices that do not recognize the interconnections are deemed low intensity and include hosting adult-only parent orientation nights and sending information home.

Conceptual framework (Rimm-Kaufman & Pianta, 2000).
The Rimm-Kaufman and Pianta (2000) model also conceptualizes the transition process as evolving over time. The authors noted that “knowledge of only the direct and indirect effects of contexts on children’s adjustment to school provides an incomplete picture of school transition. The transition process, by nature, begins in the year before kindergarten entrance and continues through the kindergarten year” (p. 500). In essence, the transition process, according to these scholars, spans a 2-year time frame. In response to the model’s guidance, we recognize the importance of conceptualizing kindergarten transition as a multiyear process and do what we can through our analysis to examine it as such. As described in full in the Method section, five of the six survey items on which this study is based contain a temporal component. While imprecise, they do give us the ability to reveal the percentage of schools that offer transition practices during the preschool year, in the summer before kindergarten starts, and at the beginning of the kindergarten year.
Method
Data
In this study, we leverage data from the 1998–1999 and 2010–2011 kindergarten cohorts of the Early Childhood Longitudinal Study (i.e., the ECLS-K). Both ECLS-K surveys provide nationally representative data on children beginning in kindergarten. In both surveys, a wealth of information was collected about kindergarteners, through parent, teacher, and school administrator surveys as well as one-on-one assessments of children. While the ECLS-K 2010–2011 is not an exact replication of the ECLS-K 1998–1999, numerous survey items are the same and enable comparison between two cohorts of kindergarteners over 10 years apart (Mulligan, Hastedt, & McCarroll, 2012; Tourangeau, Nord, Lê, Sorongon, & Najarian, 2009). Since transition practices included in the ECLS-K are schoolwide, the unit of analysis in this study is the school. Additionally, we limit our sample to public schools. For both the 1998–1999 and 2010–2011 cohorts, the sample of schools is nationally representative in the base year. Our analytic samples include 630 public schools from the 1998–1999 cohort and 725 public schools from the 2010–2011 cohort.
The ECLS-K surveys employed a complex multistage sampling strategy to produce nationally representative estimates. Sampling took place in a three-stage process. In the first stage, the country was divided into primary sampling units (PSUs), and PSUs were then sampled (100 PSUs in 1998–1999 and 90 PSUs in 2010–2011). In the second stage, public and private schools were sampled in each sampled PSU. Finally, in the third stage, children enrolled in kindergarten programs in the selected schools were sampled (Mulligan et al., 2012; Tourangeau et al., 2009). Due to this complex sampling design, a school-level sampling weight (W2SCH0) was required to produce nationally representative estimates and adjust for the effect of differential nonresponse. Additionally, corresponding replicate weights (W2SCH1-W2SCH80) were used with the jackknife replication method to yield accurate standard errors for estimates. 1
Measures
Transition Activities
In the fall of kindergarten in both ECLS-K cohorts, teachers completed surveys about their backgrounds, teaching practices, beliefs, and students’ performance. In both the 1998–1999 and 2010–2011 fall kindergarten surveys, teachers were asked if their schools used any of six listed transition activities:
“I (or someone at the school) phone or send home information about the kindergarten program to parents.”
“Preschoolers spend some time in the kindergarten classroom.”
“The school days are shortened at the beginning of the school year.”
“Parents and children visit kindergarten prior to the start of the school year.”
“I (or another teacher) visit the homes of the children at the beginning of the school year.”
“Parents come to the school for orientation prior to the start of the school year.”
In addition to including each of these six binary (yes or no) transition activity measures in our analysis, we developed an aggregate measure for the total number of activities offered. The 2010–2011 survey included a new response option that asked teachers if their schools staggered school entry where kindergarteners start the school year in smaller groups before meeting with the full class. We included this item in our analysis focusing on only the 2010–2011 data but not when comparing changes from 1998–1999, as this item is not common to both data sets.
While these transition activities were reported from individual teachers, they are largely implemented at the school level. Thus, we developed school-level transition variables from the teacher-level reports. We computed school-level transition variables by averaging the responses of all teachers within a particular school. As expected, the internal consistency among teachers within schools was high, with an intraclass correlation of 0.91. All other measures included in this analysis were originally school-level variables.
Readiness Assessments
The school administrator survey, which was completed by administrators in the same schools as the teachers, included a set of items related to schools’ use of readiness assessments near the beginning of kindergarten. With our conceptual model in mind, we see readiness assessments as part of the dynamic transition process where schools come to know their students and cater instruction and services according to their needs (Rimm-Kaufman & Pianta, 2000). First, administrators were asked if their schools administered a readiness assessment before or shortly after the start of the school year; if so, they were then prompted to answer six questions about how they utilize the assessment results:
to determine eligibility for enrollment when a child is below the cutoff age for kindergarten,
to determine children’s class placements,
to identify children who may need additional testing (e.g., for a learning problem),
to help teachers individualize instruction,
to support a recommendation that a child delay entry for an additional year, and
other purposes.
For each item, the response options were yes or no. The ECLS-K provides only general information regarding whether or not a school reported using a readiness assessment and how it used the data from the assessment. We do not have specific information on the type of readiness assessment used.
Covariates
We included a set of school-level measures from the 2010–2011 cohort to investigate factors that have been found to be associated with the use of transition activities and kindergarten readiness assessments. Our selection of covariates was driven primarily by (a) measures used in prior research on transition practices and (b) measures that reflect the significant changes in early-grade education between 1998 and 2010. First, we included an indicator variable to designate if the school was located in an urban area. In Pianta and colleagues’ (1999) study, the number and type of transition practices that children received were found to vary per the geographic location of a school, so we included the location variable to see if the disparities still exist and if the relationship translates to the use of readiness assessments. For the same reason, we included a continuous measure of the level of poverty in each school’s district. The district poverty variable comes from the Small Area Income and Poverty Estimates and measures the percentage of children aged 5 to 17 years who are in poverty, by school district (Tourangeau et al., 2009).
We also included more refined measures of school demographics, including continuous variables for the percentage of students eligible for free lunch, the percentage of students of color, and the percentage of English language learners (ELLs) in each school. Given the significant demographic changes in public schools since the 1998–1999 ECLS-K cohort (Kena et al., 2015), it is important to understand how these factors may be associated with the availability of transition activities and the prevalence of readiness assessment administration itself. Furthermore, since many transition practices involve communication with parents, the increase in ELLs in public schools may pose challenges for schools to conduct certain practices (Kena et al., 2015).
In addition to the demographic changes in public schools between the two ECLS-K cohorts, there has been a dramatic shift in the provision of early care and education (Barnett, Carolan, Squires, & Brown, 2014; Curran, 2015). To examine how these changes may covary with transition practices and readiness assessment use, we included a variable that indicates if the school’s kindergarten program is full day, as well as a variable that indicates if the school hosts a prekindergarten program. 2 We hypothesized that these early childhood education characteristics may be associated with the provision of transition activities or the use of readiness assessments. For example, if an elementary school hosts a prekindergarten program, that school may be more likely to provide opportunities for preschoolers to spend time in a kindergarten classroom.
Last, we included a continuous measure of the number of students enrolled in each school’s kindergarten program and an indicator variable for whether or not the school met adequate yearly progress (AYP) in the preceding academic year. 3 We hypothesized that transition activities and readiness assessment use may vary per the enrollment of the kindergarten due to efficiency constraints. For example, larger kindergartens may be more likely to use readiness assessments because there are simply too many students to efficiently address readiness skills through other means. Additionally, prior research suggests that high-intensity practices (e.g., home visits) are less common in high-enrollment districts (Daley et al., 2011; Pianta et al., 1999). That said, since some readiness assessments may be time intensive, it could be that larger districts are less likely to use them. We included the measure of whether or not the school met AYP due to the increased accountability pressures under which schools operate (Hamilton, Stecher, Marsh, McCombs, & Robyn, 2007). For example, as compared with schools that did meet AYP, schools that did not may feel more pressure to better prepare students for state assessments in the third grade, which is the first year that annual testing is required for accountability purposes. Thus, these schools may focus on ensuring successful transitions and relying on data from earlier tests, such as the kindergarten readiness assessment, to identify areas for improvement and instructional focus.
Analytic Strategy
We began our analysis by generating basic descriptive statistics for all of the measures from the 1998–1999 and 2010–2011 cohorts. Additionally, to examine the extent to which the prevalence of transition activities and the use of readiness assessments have changed between the two ECLS-K cohorts, we calculated independent sample t tests.
Next, we sought to understand how public schools’ use of transition activities and readiness assessments varied according to the school-level covariates in our data set. To understand the unconditional differences, we ran bivariate regressions between each dependent and independent variable. For our purposes, unconditional differences mean that the relationship between each school-level covariate and transition practice is modeled without controlling for any other factors. The unadjusted models convey the actual gaps that are present in the world. Such unadjusted gaps are analogous to unadjusted achievement gaps that present the Black-White gap or the gap between affluent and less affluent individuals (Fryer & Levitt, 2004; Reardon, 2011). While it is true that such gaps may be reduced by controlling for other covariates, it is important and policy relevant to illuminate the gaps as they actually exist before exploring the degree to which other covariates explain the gap. This approach is consistent with prior work on transition practices that also presented unadjusted comparisons to illuminate disparities across independent variables (Pianta et al., 1999).
We then moved from unconditional bivariate regressions to models that included all covariates, contemporaneously, to explore the degree to which any gaps in the unconditional models were explained by the inclusion of covariates. These models enabled us to understand not only how the use of transition activities and readiness assessments vary across school-level factors but how these factors are associated when holding constant school demographics, program type, and whether or not the school met AYP. Using ordinary least squares regression, we first modeled the total number of transition activities that a school utilized. Then, we ran linear probability models predicting each binary outcome. The models took the following general form:
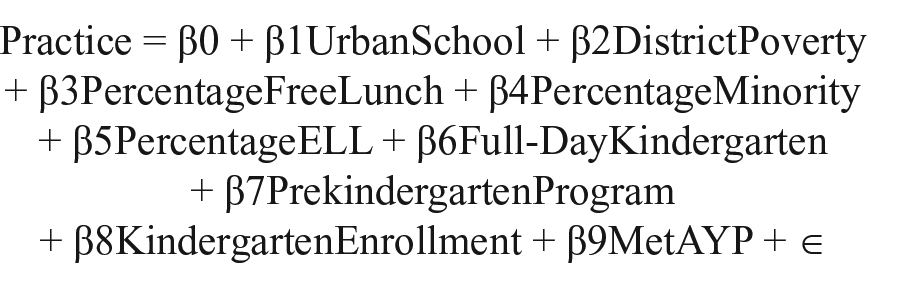
For the linear probability models, the coefficient is the change in the probability that the outcome variable is equal to 1 for a unit change of the independent variable. Because the outcome is dichotomous, linear probability models are inherently heteroskedastic, so we use robust standard errors when generating estimates (Wooldridge, 2009). To better capture the magnitude of the observed associations, we standardized all continuous independent variables into z scores with a mean of 0 and a standard deviation of 1.
Robustness and Sensitivity Tests
For all of the models with binary outcomes, we first ran logistic regression models and examined the magnitude of the odds ratios to determine whether or not our primary estimation method should be linear probability models or logistic regression models (Von Hippel, 2015). While this analysis supported our use of linear probability models, we present the results from the logistic regression models in Tables A1–A4 as a robustness check. While the interpretation of the odds ratios is not directly comparable to linear probability regression coefficients, the results indicate nearly identical directions of association and statistical significance. A statistically significant odds ratio >1 suggests a positive association between the predictor and the binary outcome. Conversely, a significant odds ratio <1 suggests a negative association between the predictor and the binary outcome (Kleinbaum & Klein, 2010).
For the models with the total number of transition practices as the outcome, we also ran Poisson regression models, which are suited for the discrete values of a count outcome. The results for the Poisson regressions indicated that our ordinary least squares results were robust to this alternative estimation strategy. Finally, we explored the extent to which variation across states or school districts may drive the observed relationships. We ran models with state and district fixed effects and found qualitatively similar results. That the results are robust to restricting to variation within states or within districts suggests that the observed results are not being driven by policies at such higher levels of governance.
Results
Question 1: What Transition Activities Do Elementary Schools Employ, and Which Activities Are Most Common?
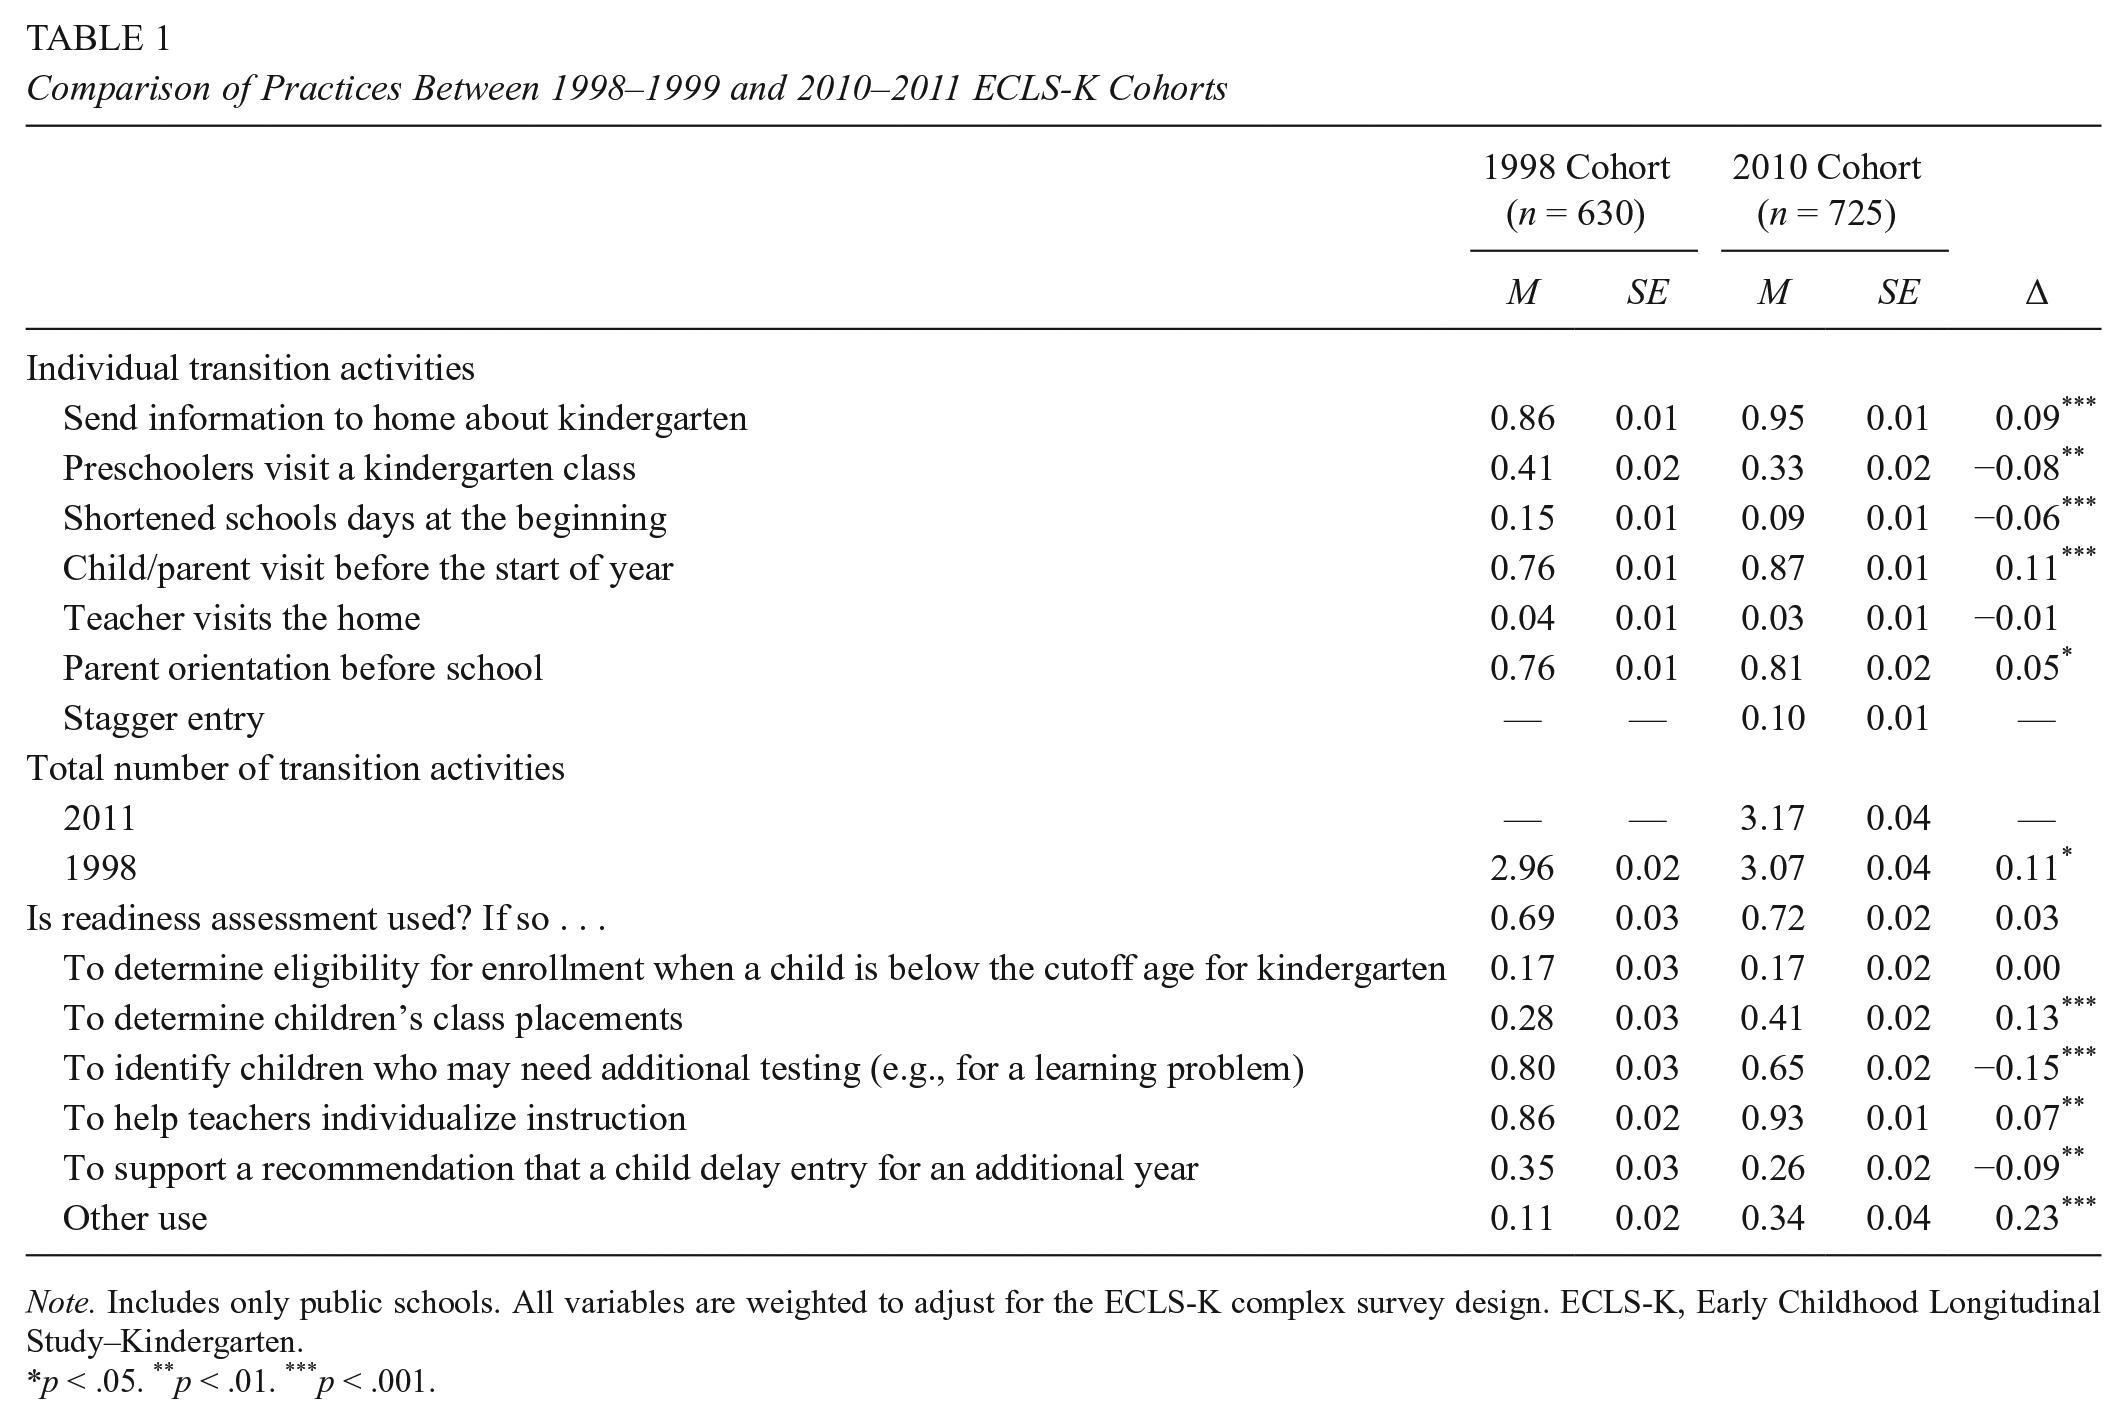
We find that the use of at least some transition activities is a common occurrence in schools but that the frequency of use varies greatly by activity. Descriptive statistics for all transition practices are presented in Table 1. As shown for the 2010–2011 cohort, most public schools used at least one of the seven surveyed transition activities (only 1.1% reported using none of the practices). On average, schools reported using 3.17 kindergarten transition activities. Of the seven individual transition activities, the most commonly reported activities included a school sending information home about kindergarten (95%), using child/parent visits prior to the start of the school year (87%), and hosting a parent orientation before school begins (81%). According to our conceptual model, the latter two activities recognize the transition as a dynamic process that occurs over time. There was a large difference in the proportion of schools implementing these three most commonly reported transition activities and the proportion implementing the other four. The next-most frequent transition activity was having preschoolers spend some time in a kindergarten classroom before the start of the year (33%), while the other three activities occurred in ≤10% of schools.
Comparison of Practices Between 1998–1999 and 2010–2011 ECLS-K Cohorts
Note. Includes only public schools. All variables are weighted to adjust for the ECLS-K complex survey design. ECLS-K, Early Childhood Longitudinal Study–Kindergarten.
p < .05. **p < .01. ***p < .001.
Question 2: How Do Educators Use Data From Kindergarten Readiness Assessments?
We find that the use of readiness assessments was a commonly reported practice but that schools using them varied in how the results of such tests were utilized. As shown in Table 1, a significant majority of administrators in the sampled schools reported that their schools used a student readiness assessment at the beginning of kindergarten (72%). Of schools utilizing such an assessment, the most commonly reported uses were related to decisions about the students’ learning environment. For instance, the majority of schools utilized assessment data to help teachers individualize instruction (93%), to identify children in need of further testing (65%), or to determine class placements (41%).
A nontrivial proportion of schools used the readiness assessment results to make decisions regarding whether students should even enroll. For instance, one in four schools utilized the assessments to support a recommendation to delay entry for an additional year, and almost one in five schools used the assessment to determine eligibility for enrollment if the child was below the cutoff age for kindergarten entry.
Question 3: How Has the Prevalence of Transition Activities and the Use of Readiness Assessments Changed Over Time?
We find that, overall, the use of transition activities has increased between 1998–1999 and 2010–2011, with the most frequently used activities becoming more common and most of the least frequently used activities becoming less common. The final column in Table 1 provides mean differences for all practices between the 1998–1999 and 2010–2011 ECLS-K cohorts. Of transition activities listed on the survey, we found a statistically significant increase between the two cohorts in the total number of activities that schools reported using (from 2.96 to 3.07). 4 The three most common reported practices in 1998–1999 were also those that increased the most between that time and 2010–2011. Specifically, between 1998–1999 and 2010–2011, there was a significant 11–percentage point increase (from 76% to 87%) in the reported usage of visitation programs, wherein children and/or parents were encouraged to visit the school before the start of the academic year. Sending information home about kindergarten also increased substantially, with 86% of schools reporting doing so in 1998–1999 and 95% in 2010–2011 (a 9–percentage point increase), as did hosting parent orientations before the start of school (+5%).
Over this same period, there was a significant reduction in the percentage of schools that reported implementing two of the three least common transition practices of 1998–1999 and no change in the third. Reports of having preschoolers visit a kindergarten class fell from 41% in 1998–1999 to 33% in 2010–2011, a drop of 8 percentage points. According to educators’ reports, the practice of beginning the year with shortened school days also dropped during this time, from 15% in 1998–1999 to 9% in 2010–2011 (a decrease of 6 percentage points). There was no significant change in the least common transition practice—teachers visiting the child at home.
In contrast to the use of transition activities, overall utilization of readiness assessment results stayed stable between the two survey administrations, although the frequency of a number of such assessments did shift (see Table 1). Reports of using data specifically to determine eligibility for enrollment when a child is below the cutoff age for kindergarten did not change; 17% of school administrators in both years reported that their schools applied readiness assessment data in this way.
However, significant changes were found regarding the other five applications of readiness assessment data. Between the two most commonly reported assessment data applications in 1998–1999, the use of one spread to a greater proportion of schools, while the use of the other contracted. With regard to using readiness assessment data to help teachers individualize instruction—the most commonly reported application in both 1998–1999 and 2010–2011—the percentage of administrators reporting using the practice in their schools went from 86% in 1998–1999 to 93% in 2010–2011, an increase of 7 percentage points. Additionally, the percentage of school administrators in 2010–2011 who reported using assessment data for determining children’s class placements was 41%, a statistically significant 13–percentage point increase as compared with 1998–1999 (28%). Reports of using data for “other uses” also increased, from 11% to 34%, suggesting that future surveys be revised to capture additional applications.
The second-most commonly reported application of readiness assessment results in 1998–1999, identifying children for additional testing (e.g., for a learning disability), decreased by 15 percentage points in 2010–2011 (from 80% to 65%). While surprising, this decrease might be explained by an increase in the use of other instruments designed expressly for these purposes. For example, a skills assessment may not be the best way to diagnose learning disabilities, but we do not have access to data that would allow us to test this explanation here. Additionally, we found a significant 9-point reduction in the number of school administrators reporting that educators in their schools use readiness assessment data to support a recommendation that a child delay entry for an additional year—from 35% in 1998–1999 to 26% in 2010–2011.
Question 4: Are School-Level Geographic, Structural, and Demographic Factors Associated With Schools’ Use of Transition Practices?
We present the results for Question 4 in two subsections. These results report the associations between school-level covariates and transition practices in the 2010–2011 ECLS-K. The complete list of school-level covariates and descriptive statistics on these covariates are shown in Table 2. In the first section, we summarize the bivariate associations between our dependent and independent variables. The bivariate regressions, which are shown in Tables 3 and 4, provide information on the degree to which the use of transition practices varies across contexts. For instance, the bivariate regression between urbanicity and transition practices indicates whether urban schools use more or fewer practices than do nonurban schools. Following the bivariate regressions, we summarize results from the full covariate-adjusted regression models, which are shown in Tables 5 and 6. The covariate-adjusted models provide insight into the degree to which relationships persist after controlling for other predictors of transition practices. For instance, they provide insight into the degree to which urbanicity predicts the use of transition practices after accounting for differences such as the demographics of students served or structural characteristics of the school (e.g., enrollment).
School Demographic Descriptive Statistics: 2010–2011

Note. All variables are weighted to adjust for the Early Childhood Longitudinal Study–Kindergarten complex survey design. Includes only public schools. AYP = adequate yearly progress; ELL = English language learner; K = kindergarten; pre-K = prekindergarten.
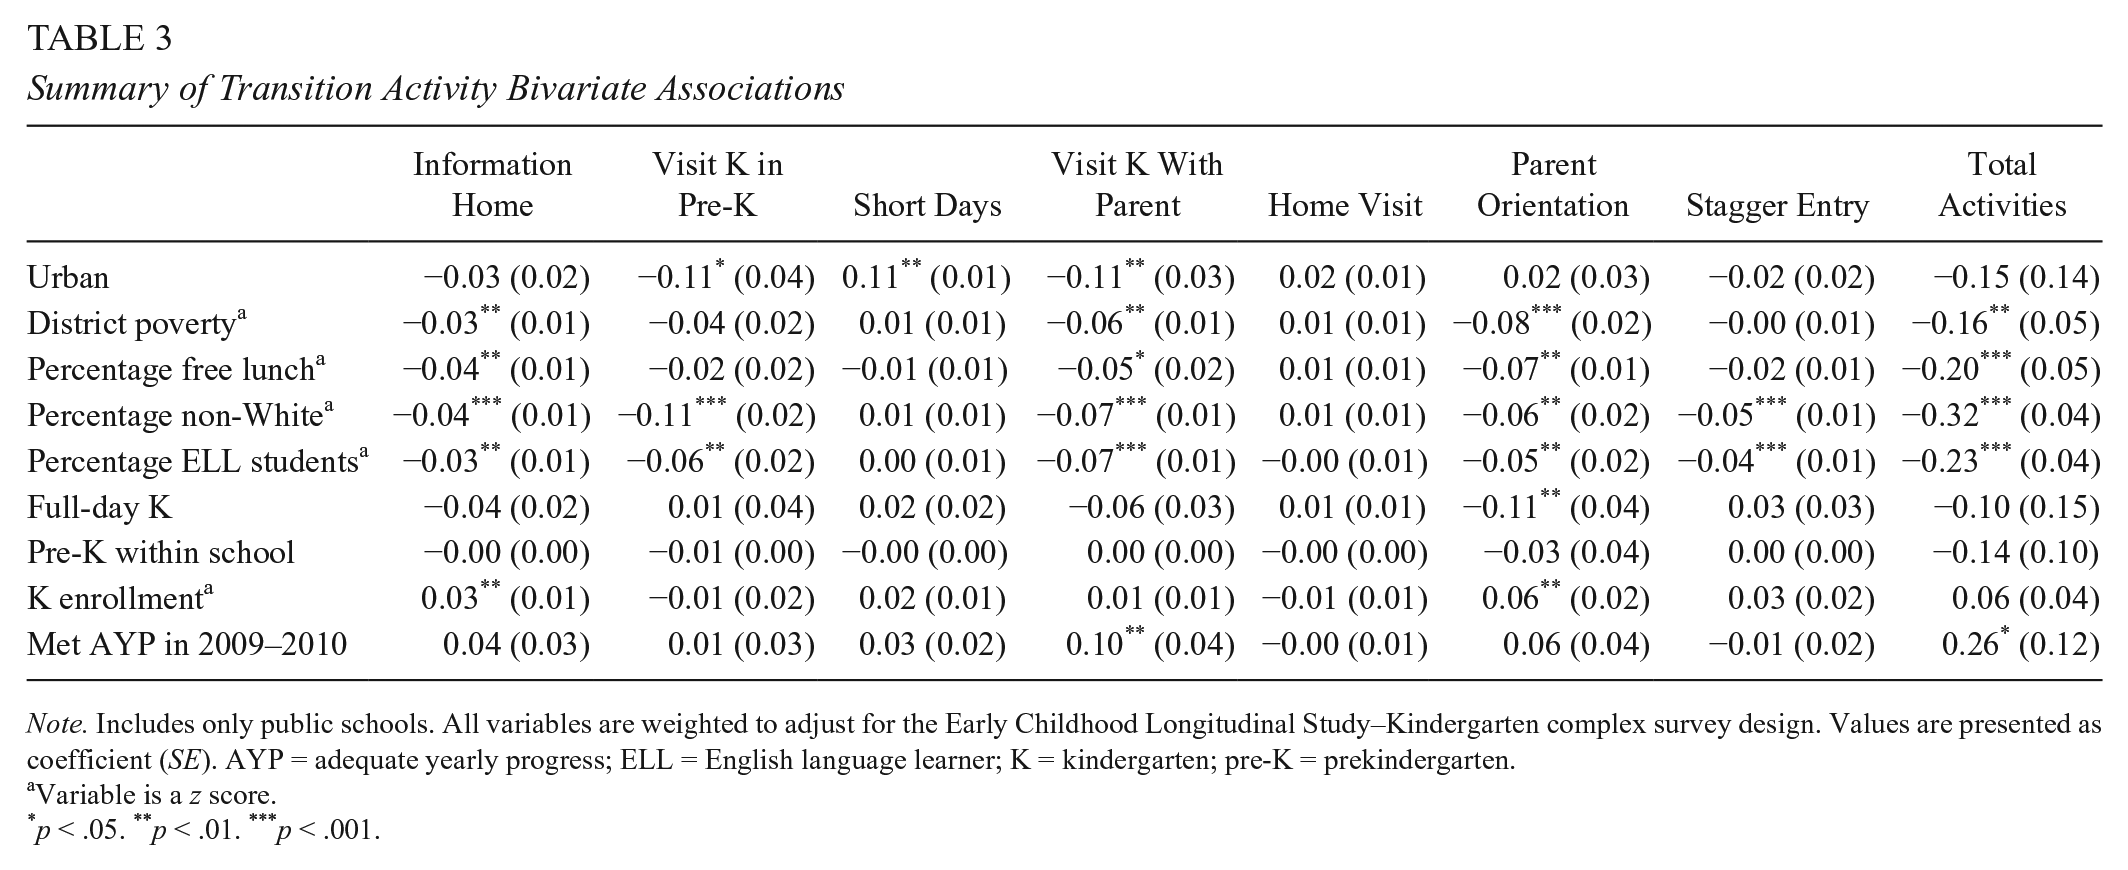
Summary of Transition Activity Bivariate Associations
Note. Includes only public schools. All variables are weighted to adjust for the Early Childhood Longitudinal Study–Kindergarten complex survey design. Values are presented as coefficient (SE). AYP = adequate yearly progress; ELL = English language learner; K = kindergarten; pre-K = prekindergarten.
Variable is a z score.
p < .05. **p < .01. ***p < .001.
Summary of Readiness Assessment Bivariate Associations

Note. Includes only public schools. All variables are weighted to adjust for the Early Childhood Longitudinal Study–Kindergarten complex survey design. Values are presented as coefficient (SE). AYP = adequate yearly progress; ELL = English language learner; K = kindergarten; pre-K = prekindergarten.
Variable is a z score.
p < .05. **p < .01. ***p < .001.
Summary of Full Transition Practice Models

Note. Includes only public schools. All variables are weighted to adjust for the Early Childhood Longitudinal Study–Kindergarten complex survey design. Values are presented as coefficient (SE). AYP = adequate yearly progress; ELL = English language learner; K = kindergarten; pre-K = prekindergarten.
Variable is a z score.
p < .05. **p < .01. ***p < .001.
Summary of Full Readiness Assessment Models

Note. Includes only public schools. All variables are weighted to adjust for the Early Childhood Longitudinal Study–Kindergarten complex survey design. Values are presented as coefficient (SE). AYP = adequate yearly progress; ELL = English language learner; K = kindergarten; pre-K = prekindergarten.
Variable is a z score.
p < .05. **p < .01. ***p < .001.
Bivariate Models
In general, we find that the use of transition activities differs across urban and nonurban environments and that schools serving less advantaged groups of students tend to use fewer such practices. The bivariate regression results for the transition activities are presented in Table 3. In terms of geographic location, we find that schools located in urban areas are 11 percentage points less likely to have preschoolers spend time in a kindergarten class and have the parent/child visit kindergarten before the start of the year. Conversely, urban schools are 11 percentage points more likely to shorten school days at the beginning of the academic year.
We find that schools located in districts with higher percentages of students living in poverty provide fewer overall transition activities (b = −0.16). Consistent with Pianta et al. (1999), we find that schools located in districts with higher percentages of children in poverty are less likely to send information home about kindergarten (b = −0.03), have the child/parent visit kindergarten before the start of the year (b = −0.06), and host a parent orientation before school (b = −0.08).
In terms of school-specific demographic factors, we find that, similar to our findings for district poverty level, schools with traditionally disadvantaged students are also less likely to provide transition practices. For each of the three school demographic measures—the percentage of students qualifying for free lunch, the percentage who are students of color, and the percentage classified as ELLs—higher percentages are associated with fewer total practices offered by a school.
School’s early education programming—that is, whether kindergarten is full day and whether or not the school hosts a prekindergarten program—is generally unrelated to the use of transition practices, with one exception. We find that schools with a full-day kindergarten program are 11 percentage points less likely to host a parent orientation before the start of the school year.
Neither kindergarten enrollment nor AYP status in the prior academic year was consistently related with a school’s transition activities. Schools with higher enrollments were more likely to host a parent orientation before the start of the school year (b = 0.06), and schools that met AYP in the previous academic year were more likely to have a parent/child visit the school prior to the start of kindergarten (b = 0.10). Additionally, schools that met AYP offer more total transition activities (b = 0.26).
With regard to the use of readiness assessments, we find few associations with the likelihood to use such assessments but a number of differences in how they are used across school characteristics. Table 4 displays the bivariate regression results for the readiness assessment measures. First, only district poverty and kindergarten enrollment size are associated with the overall use of readiness assessments, and the magnitude of the coefficients is moderate.
Schools that are located (a) in urban areas and (b) in districts with higher poverty levels and that have higher percentages of (c) students eligible for free lunch and (d) students of color are all less likely to use readiness assessment data to determine eligibility for kindergarten enrollment if the child is below the cutoff age. In terms of utilizing assessment data to determine class placements, schools in urban areas are less likely to do so (b = −0.13), and schools with higher enrollments are more likely to do so (b = 0.11). Schools with higher percentages of ELL students are less likely to use readiness assessment data for diagnostic purposes (e.g., to identify learning problems; b = −0.08).
We find that urban schools, schools in higher-poverty districts, schools with higher percentages of students eligible for free lunch, and schools with higher percentages of minority students are all less likely to use assessment data to support a recommendation that a child delay entry into kindergarten. The magnitude of these associations is largest for schools in urban districts (b = −0.20) and schools with higher percentages of minority students (b = −0.13).
The results in Tables 3 and 4 highlight unconditional associations, speaking to the degree to which these practices vary across contexts. It is possible, however, that these associations confound one another. For instance, significant relationships for urban schools may be a function of differences in the demographics of students served. In the next section, we present our findings from models that include a full set of covariates, allowing for an exploration of the degree to which the relationships observed in the bivariate regressions persist when controlling for other characteristics of the school.
Full Models
Results from our full covariate-adjusted models with the transition activities are shown in Table 5. While many of the relationships are qualitatively similar to those in the bivariate models, there are a number of notable changes with the inclusion of all variables as covariates. First, while schools located in urban areas are still >10 percentage points more likely to have shortened school days at the beginning of the year, they are 16 percentage points more likely to host a parent orientation before school begins after controlling for other covariates. Additionally, urban schools offer more practices overall (b = 0.31), a result that was previously insignificant. In terms of district poverty level, all three of the significant relationships from the unconditional comparisons became insignificant, although we do find that schools in more impoverished districts are more likely to stagger school entry in the full model (b = 0.05).
The percentage of students eligible for free lunch is not significantly associated with any of the transition activities in the full model. The percentage of non-White students, however, remains negatively associated with a number of transition activities—including sending information home about kindergarten (b = −0.03), having preschoolers visit kindergarten (b = −0.13), having parent/child visit kindergarten before the start of the year (b = −0.05), using staggered entry (b = −0.05), and providing fewer overall transition activities (b = −0.34). The percentage of ELL students in a school is also negatively related to some transition activities; however, this relationship is less pronounced as compared with the unadjusted models, and the magnitudes of the significant associations are small.
With the exception of enrollment size, structural characteristics of kindergarten remain weak predictors of transition activities. Whether or not the school offers full-day kindergarten or hosts a prekindergarten program is not significantly associated with any of the transition activities. As compared with the bivariate models, the enrollment of a school’s kindergarten remains positively associated with several transition activities and becomes a significant predictor of overall number of transition activities utilized.
Results from our full covariate-adjusted models with the readiness assessment measures are shown in Table 6. As in the bivariate models, kindergarten enrollment is positively associated with schools’ use of readiness assessments (b = 0.06). Additionally, we observe a positive relationship between district poverty level and the use of readiness assessments (b = 0.06). For both the aforementioned independent variables, the association is stronger in the full models than the bivariate models. In terms of the specific uses of the assessment data, schools in higher-poverty districts are more likely to use the data to individualize instruction (b = 0.05). Similar to the transition activities, the percentage of students eligible for free lunch is not significantly associated with readiness assessment uses. Schools with higher percentages of non-White students are less likely to use the data to determine eligibility if a child is below the cutoff age for enrollment (b = −0.11) or to advise that the child delay entry (b = −0.13). Consistent with the estimate from the bivariate model, schools with higher percentages of ELL students are less likely to use readiness assessments for diagnostic purposes (b = −0.07) but more likely to use the data to support delaying entry into kindergarten (b = 0.06). Last, schools with larger kindergarten enrollments are more likely to utilize readiness assessment data to make classroom placements (b = 0.10).
Discussion
The decade and a half between the late 1990s and early 2010s saw significant shifts in the practices and expectations of early education. For instance, state-funded preschool programs have expanded rapidly, with a corresponding increase in student attendance in early childhood education (Curran, 2015). Kindergarten, in particular, has undergone major shifts in both structure and design. For instance, there has been a large increase in the proportion of students attending full-day as opposed to half-day kindergarten, as well as an increased focus on academic content (Bassok et al., 2016; Bowdon & Desimone, 2014). The result is that, on average, the experiences that students bring into kindergarten and the expectations put on these students once they arrive look much different today than they did at the time of the original ECLS-K survey.
At the same time, the nation’s public schools have witnessed major policy shifts as a result of the passage and implementation of No Child Left Behind and state accountability initiatives. It is a shift that may have substantive yet nuanced implications for the way that schools approach the transition to kindergarten. Among its many components, NCLB resulted in an increased emphasis in standardized testing and accountability for academic achievement (Booher-Jennings, 2005; Cohen-Vogel, 2011; Grissom et al., 2014; Jacob, 2005). The underlying goal of these policy changes is that student achievement data will be used by school administrators to help inform teacher practice and boost high-quality instruction (Wachen, Harrison, & Cohen-Vogel, 2015).
Taken as a whole, these changes in the educational environment over the past decade and a half suggest the possibility of large shifts in the practices around kindergarten transition. The increased prevalence of preschool may prompt kindergartens to approach transition differently, under the assumption that more students have had exposure to a structured learning environment. Likewise, the increased emphasis on testing and academics could prompt shifts in the use of assessments and choices about how to use such assessment data. The focus on equitable educational outcomes potentially means that schools serving larger proportions of disadvantaged or at-risk student groups may have differentially changed transition practices to attempt to improve the outcomes of these students. In short, there are a number of reasons to believe that the extant research on kindergarten transition practices, most of which was conducted in the mid-1990s, may not accurately reflect the current context of the 2010s.
Indeed, as a whole, our findings indicate significant differences in the prevalence of transition practices—activities and readiness assessments—across time and update findings regarding differences across school contexts. While the use of transition activities has increased slightly over the decade between the two ECLS-K surveys, schools serving greater proportions of traditionally disadvantaged student groups still utilize significantly fewer of such activities. Similarly, while the prevalence of readiness assessments is similar in both surveys, we found significant changes in how the data from these assessments are used. When we array our findings against the recommendations of previous authors and expert panels, some troubling patterns emerge.
First, results of our bivariate regression models appear to corroborate prior research by Pianta et al. (1999) and others (e.g., Daley et al., 2011), showing that schools with larger proportions of low-income children provide fewer kindergarten transition activities overall. Additionally, our findings suggest that schools serving larger percentages of students of color and ELLs utilize fewer transition activities. In short then, it appears that, due to such differences across schools serving different populations, students who may be the most at risk when transitioning to kindergarten are, in fact, receiving fewer services to facilitate their transition. Given that the number of transition activities that a school provides has been empirically linked to positive academic outcomes (especially for less advantaged students; Schulting et al., 2005), the discrepancy is alarming and may contribute to further exacerbation of inequities across these groups.
In addition to finding disparities across student groups, we find that the transition activities engaged in across the spectrum tend to be what Pianta and Walsh (1996) term low-intensity activities. For instance, like Pianta and colleagues (1999), we find that the most common transition activity in which schools engage is, by far, sending written information home about kindergarten. While there are no rigorous studies comparing the efficacy of individual transition practices, the likelihood is low that a written message from the school—a message that may or may not make it home and is not able to be read by the kindergartner himself or herself—is as effective or more as a visit to the school or kindergarten teacher prior to the start of school. Higher-intensity practices, such as having a teacher visit the child’s home, are rarer. This suggests, then, that schools may not be engaging in the activities that could have the greatest impact on easing the transition to kindergarten.
Third, how schools are reportedly using data produced by kindergarten readiness assessments appears to contradict key recommendations of the National Research Council (NRC). Published in 2008, an NRC report cautioned against using assessments for high-stakes decisions, such as delaying children’s entry into kindergarten (Snow & Van Hemel, 2008). Our analysis reveals that approximately one quarter of public school administrators who administer readiness assessments reportedly use the results to support decisions to delay kindergarten entry by an additional year. That said, the proportion who report using the data for these decisions decreased by 9 percentage points between 1998–1999 and 2010–2011. Furthermore, these data were collected only 2 years after the publication of the NRC recommendations, so future research should examine if this downward trend has continued.
A significant proportion of schools also report using data in what is arguably a high-stakes decision—to determine children’s class placements. Given the widely accepted finding that the quality of a student’s teacher and his or her peers has a significant impact on academic achievement (e.g., Rockoff, 2004; Sanders & Rivers, 1996), class placement is, in our view, a high-stakes proposition. Of concern to us, the use of readiness assessment data for determining class placements rose by 12 percentage points between survey administrations. In 2010–2011, more than four in 10 school administrators in schools using readiness assessments reportedly used such assessments to assign students to classes. Research shows that tracking of students can exacerbate educational inequalities and reduce student performance (Hanushek & Wößmann, 2006; Oakes, 1985). Although it is unclear from the available data in the ECLS-K whether readiness assessments are being used to facilitate either tracking or better matching between teachers and students, the large use in readiness assessments for this class placements necessitates research (a) to understand how and for what purposes schools are sorting students on the basis of test scores in kindergarten and (b) to protect against practices that may do harm.
Other recommendations in the NRC report stressed that assessment data be used to provide teachers with information necessary to individualize instruction and drive program improvement (Snow & Van Hemel, 2008). Here, we have good news. The two most commonly reported applications—using data to individualize instruction and to identify students who may need additional testing—appear to conform to these guidelines.
Limitations
There are several data limitations to consider when interpreting these results. First, while ECLS-K measures provide guidance on transition practices and readiness assessments, the measures are somewhat general. For example, the data allow us to know whether a school hosts an orientation for kindergarten parents but do not provide any information about what the orientation covers. The same is true of the readiness assessments. The data tell us nothing specific about the readiness assessments used and the particular skills or content domains they cover. Subsequent research should address this limitation with a combination of methods to understand what types of assessments states are using, which students are assessed, what domains are covered, and how the data from these assessments are used. We are currently working on a review of kindergarten readiness assessment policies in the 50 states and supplementing these findings with in-depth interviews of school administrators from North Carolina (Little & Cohen-Vogel, 2016).
Another limitation is that data regarding readiness assessments in the ECLS-K come from the school administrator survey. Consequently, we are unable to understand how teachers are using the data to shape their practice. Recent evidence from Wachen et al. (2015) suggests that even if a school has a so-called culture of data, teachers struggle to translate information from student data into individualized instructional modifications. As readiness assessments become more common, attention must turn to how these efforts shape instructional practice and the ultimate goal of improved academic outcomes for all students.
Conclusion
The transition to kindergarten is a critical starting point in students’ educational trajectories and one that can have an impact through the use of transition practices by the schools receiving these students. This study has provided information on the use of such transition practices, focusing on the activities that schools employ as well as their use of readiness assessments. We have documented changes over time in the use of transition practices as well as variation in the use of these practices across school characteristics. In doing so, we provide the most comprehensive examination of kindergarten transition activities since work conducted in the mid- to late 1990s (Pianta et al., 1999) and provide some of the first evidence on the prevalence and use of school readiness assessments.
Our findings point to critical discrepancies in the way that transition activities are utilized across schools as well as discrepancies between the recommended use of readiness assessments and the use reported by school administrators. The finding that schools serving greater percentages of students of color, ELLs, and students from economically disadvantaged backgrounds provide fewer transition activities suggests a need for an improved focus on equity in the transition to kindergarten. In particular, educators working in these settings may consider adding additional transition activities, while policy makers may consider allocating additional resources to facilitate such provision of activities. Though it is encouraging that the use of transition activities has increased slightly over time, it is critical that these increases include the most high-impact activities and that these activities are available to all students.
Similarly, discrepancies between the use of school readiness assessments and recommendations by the NRC suggest the need for further work on readiness assessments. Our results point to a large increase in the use of such assessments for class placements; however, further research is needed to explore the degree to which such placements are either increasing or decreasing educational opportunity.
In short, our findings lay a foundation for further research in the area of kindergarten transitions. The importance of kindergarten for future outcomes is clear (Chetty, Friedman, Hilger, et al., 2011). Better understanding the practices that facilitate a successful transition to this environment therefore holds the potential to have lasting impacts on student outcomes. Further research should provide more nuanced examinations of how such practices are used, how they vary across teachers within schools, and how they relate to proximal and distal student outcomes.
Footnotes
Appendices
Summary of Full Readiness Assessment Models

| Assessment Used | Age Cutoff | Class Placement | Diagnostic Uses | Individualize Instruction | Delay Entry | Other Use | |
|---|---|---|---|---|---|---|---|
| Urban | 0.98 (0.28) | 0.64 (0.29) | 0.83 (0.28) | 1.03 (0.32) | 0.92 (0.40) | 0.48 (0.20) | 3.72 (2.97) |
| District poverty | 1.40 * (0.23) | 0.60 (0.19) | 0.82 (0.15) | 1.31 (0.23) | 2.11 ** (0.61) | 0.67 (0.15) | 2.20 * (0.78) |
| Percentage free lunch | 1.01 (0.17) | 1.11 (0.30) | 1.18 (0.21) | 1.05 (0.20) | 0.74 (0.21) | 1.22 (0.26) | 0.78 (0.27) |
| Percentage non-White | 0.82 (0.13) | 0.42 ** (0.12) | 0.71 (0.15) | 0.80 (0.16) | 0.96 (0.22) | 0.42 *** (0.10) | 0.55 (0.27) |
| Percentage ELL students | 1.08 (0.14) | 1.40 (0.29) | 1.24 (0.17) | 0.73 * (0.11) | 1.01 (0.19) | 1.50 * (0.26) | 1.46 (0.58) |
| Full-day K | 0.67 (0.22) | 1.39 (0.64) | 0.78 (0.25) | 1.06 (0.34) | 0.90 (0.49) | 1.89 (0.71) | 1.76 (1.09) |
| Pre-K within school | 0.73 (0.17) | 1.22 (0.43) | 1.36 (0.36) | 1.25 (0.34) | 1.12 (0.52) | 0.70 (0.22) | 1.02 (0.58) |
| K enrollment | 1.42 ** (0.18) | 0.80 (0.14) | 1.55 ** (0.23) | 1.18 (0.18) | 0.84 (0.12) | 1.04 (0.14) | 1.11 (0.32) |
| Met AYP in 2009–2010 | 0.76 (0.20) | 0.83 (0.32) | 0.64 (0.18) | 1.06 (0.30) | 1.85 (0.97) | 0.65 (0.22) | 2.42 (1.53) |
Note. Includes only public schools. All variables are weighted to adjust for the Early Childhood Longitudinal Study–Kindergarten complex survey design. Values are presented as odds ratios (SE) unless noted otherwise. AYP = adequate yearly progress; ELL = English language learner; K = kindergarten; pre-K = prekindergarten.
p < .05. **p < .01. ***p < .001.
1.
The percentage of missing values per variable in our data set ranged from 1% to 32%. Consequently, we performed multiple imputation to address the bias associated with missing data when analyzing complete case data (Royston, 2004; Rubin, 2004). Multiple imputation replaces each missing value with a set of possible values that represent the uncertainty about the correct value to impute. Our imputation model included both dependent and independent variables, and 20 imputed data sets were generated (Young & Johnson, 2010).
2.
In cases where a school offered both full- and partial-day programs, we coded the school as if it had only a full-day program.
3.
Adequate yearly progress was a provision of No Child Left Behind to determine if schools were successfully educating their students and making progress toward the law’s goal of 100% proficiency in 2014. Each state set targets for progress toward this goal, and a school met adequate yearly progress if at least 95% of students in each subgroup were tested and all students and subgroups met the state’s proficiency targets (U.S. Department of Education, n.d.).
4.
The six items that were common between the two cohorts are included in this comparison. The seventh item, staggering school entry (which was added in the 2010–2011 cohort), was excluded.
Authors
MICHAEL H. LITTLE is a Royster Fellow and doctoral student at the University of North Carolina at Chapel Hill, Peabody Hall, Campus Box 3500, Chapel Hill, NC 27599-3500;
LORA COHEN-VOGEL is the Robena and Walter E. Hussman Jr. Distinguished Professor of Policy and Education Reform in the School of Education at the University of North Carolina at Chapel Hill, Peabody Hall, Campus Box 3500, Chapel Hill, NC 27599-3500. Her research focuses on education politics and policy, teacher quality reforms, continuous improvement research, and bringing to scale processes for school system improvement.
F.CHRIS CURRAN is an assistant professor of public policy at the University of Maryland, Baltimore County, School of Public Policy, 1000 Hilltop Circle, Baltimore, MD, 21225;