
Abstract
The present study explored the utility of a widely used performance-based assessment of children’s readiness skills as a kindergarten entry assessment. In a sample of 520 kindergarten students across 52 classrooms, we compared students’ school readiness skills as assessed by teachers using Teaching Strategies GOLD (TS GOLD) to direct assessments administered by independent data collectors. We found evidence of the concurrent validity of TS GOLD. However, the measure demonstrated weaknesses in its ability to differentiate readiness skills. Specifically, the highly correlated latent constructs and intraclass correlations associated with TS GOLD indicated that teachers were less likely to differentiate readiness skills among children within the same classroom relative to direct assessments. The findings are discussed in terms of assessing children’s school readiness at scale. As the number of programs, districts, and states that require school readiness assessments increases, so does the need to better understand the information that can be inferred from particular methods of assessment.
Keywords
The large learning disparities that emerge during early childhood contribute to gaps that are present when children enter kindergarten (Magnuson et al., 2004; Lee & Burkam, 2002; Pratt, McClelland, Swanson, & Lipscomb, 2016; Rimm-Kaufman et al., 2000). These early differences can persist and become wider as students progress through the educational system, leading to a gamut of negative outcomes in later school and life (Belsky & MacKinnon, 1994; Duncan et. al., 2007; Galindo & Sonnenschein, 2015; Hamre & Pianta, 2001; Sadowski, 2006). However, early targeted intervention has been shown to improve the performance of children who initially lag behind their more advantaged peers (Conroy & Brown, 2004; Dunlap, Johnson, & Robbins, 1990; S. Ramey & Ramey, 2004; Walker et al., 1998) and has been most effective at influencing long-term outcomes (Belfield, Nores, Barnett, & Schweinhart, 2006; F. Campbell & Ramey, 1994, 1995; Ferrer et al., 2015; C. Ramey & Campbell, 1991; Schweinhart, 1993).
The success of early interventions suggests a need to accurately identify children’s learning needs, which can in turn inform education practice and policy. Early childhood assessments contribute a crucial piece of feedback as these measures provide information about both students’ learning needs as they enter kindergarten as well as the types of experiences children have prior to school entry (K. Snow, 2011). Establishing statewide assessment systems can therefore serve the needs of classroom teachers and instructional specialists by providing data on children’s current skill levels, which can be used to inform instructional practices in the classroom while also enabling division leaders and educational policymakers to examine the learning gaps that might be addressed through programmatic preschool and early elementary interventions.
Statewide kindergarten entry assessments (KEAs) have been used for the aforementioned purposes by providing information regarding young children’s incoming skills across a range of early learning domains across a large population of students. Most KEAs are intended to inform instruction and identify students who fall below developmental expectations in order to intervene in areas of need (Shields, Cook, & Greller, 2016). Whereas some states have focused their KEAs on a single domain (such as Idaho’s Reading Indicator and the Phonological Awareness Literacy Screening in Wisconsin), many departments of education have incorporated multidimensional measures that assess students’ skills across more than one area of readiness. Regardless of the dimensions of readiness, these entry assessments come in multiple formats, including checklists/rating scales, performance-based assessments, and direct assessments (Connors-Tadros, 2014).
The majority of states with mandated entry assessments have adopted performance-based measures—also known as observation-based, authentic, naturalistic, or work sampling assessments—for use as their statewide KEAs. Broadly, performance-based measures permit the teacher to rate a child’s skills on a set of items after a period of observing and documenting the student’s functioning, usually as it occurs naturally in the classroom context (K. Snow, 2011). Scholars and educators have asserted that these types of assessments offer several advantages over more standardized tools. Most commonly, educational practitioners have argued that performance-based assessments are more developmentally appropriate for young children (Macy & Bagnato, 2010; K. Snow, 2011), enable the measurement of skills and behaviors as they occur naturally rather than in an artificial or unfamiliar setting (Bagnato & Macy, 2010; Dennis, Rueter, & Simpson, 2013), are better at informing intervention/instruction than alternative forms of assessment (Dennis et al., 2013; Macy & Bagnato, 2010; Wiggins, 1990), and can pose less imposition on teachers, students, and classroom time as skills are assessed during regular instruction (McAfee & Leong, 2011; K. Snow, 2011).
However, the advantages of performance-based assessments must be considered along with the intended use of the subsequent ratings of students’ skills. The psychometric properties (e.g., reliability and validity) of any assessment provide insight into a measure’s utility for varied purposes as well as the extent to which practitioners can trust the results produced by a given measure (C. Snow & Van Hemel, 2010). The higher the demonstrated consistency—or reliability—of an assessment, the more comparable scores will be across the classrooms, raters, and contexts in which they are administered. This is particularly useful for large-scale KEAs as many educational stakeholders are able to gain insight into the same set of skills for individual students and aggregated to the class, school, district, and state levels (C. Snow & Van Hemel, 2008; K. Snow, 2011). Generally, the more standardized the assessment protocol and procedures, the higher the reliability of the measure will be, as standardization limits the likelihood that extraneous and subjective influences, such as a rater’s preconceptions or administration inconsistencies, will factor into students’ scores (C. Snow & Van Hemel, 2008; Waterman, McDermott, Fantuzzo, & Gadsden, 2012).
Regardless of a measure’s consistency, an assessment tool is valuable only if it is valid—or captures necessary and meaningful information regarding the domain it is supposed to measure. Validity considers whether the discrete skills measured by an instrument align in expected ways to the larger learning construct in the target population. In some instances, higher reliability can come at the sacrifice of greater validity, as greater standardization can narrow the scope of an assessment, which can in turn limit the measure’s ability to capture relevant information about students’ abilities in a specific learning domain (C. Snow & Van Hemel, 2008). Therefore, when making comparisons across children or classrooms, early educators must attempt to balance the breadth of data obtained and flexibility of administration with safeguards against inconsistencies across administrations that may obscure students’ relative abilities (Pavelski-Pyle, 2002; K. Snow, 2011).
In this study, we examined the utility and psychometric properties of one such multidimensional performance-based assessment used by many states as a KEA: Teaching Strategies GOLD (TS GOLD; Heroman, Burts, Berke, & Bickart, 2010). More specifically, we focused on evidence of validity within the KEA context and compared the performance of this teacher-administered performance-based measurement tool to direct assessments of the same skills conducted by independent data collectors.
KEAs
Current Use of Kindergarten Entry Assessments
In response to the need for accurate assessments of children’s readiness skills, state-level departments of education across the country have instituted kindergarten entry measures intended to serve a variety of purposes, from evaluating early educational opportunities to informing teachers’ instruction and identifying students who may not be ready for kindergarten (Shields et al., 2016). Although the use of school-level entry assessments has remained fairly consistent over the past decade (Little, Cohen-Vogel, & Curran, 2016; Shields et al., 2016), the use of statewide multidimensional assessments of kindergarten readiness has grown and continues to trend upward (Maxwell, Scott-Little, Pruette, & Taylor, 2013; U.S. Department of Education, 2013). Although only seven states collected kindergarten entry data during the 2009–2010 school year, more than 25 states had some form of KEA in place as of 2012 (Connors-Tadros, 2014; National Center on Quality Teaching and Learning, 2013). By 2014, 33 states applied for federal funding through Race to the Top–Early Learning Challenge (RTT-ELC), which required the implementation of a KEA. The response to RTT-ELC indicates that the number of states systematically measuring these skills is poised to increase as national policies continue to encourage the use of KEAs (Connors-Tadros, 2014).
Assessment Methods Used for KEAs
In accordance with the National Research Council’s recommendations for early childhood assessments (C. Snow & Van Hemel, 2008), RTT-ELC suggested that KEAs should minimally cover five areas of learning (language and literacy, cognition and general knowledge, approaches toward learning, physical well-being, and motor development) and that the intended use of the assessment should be clearly delineated and aligned with the chosen assessment. In practice, the purpose of KEAs is often multifaceted, with needs in one or more of four categories: (a) identifying children’s readiness status relative to a predetermined developmental benchmark, (b) informing teachers’ instructional practices aimed at narrowing the school readiness gap at kindergarten entry, (c) developing and targeting resources for practitioners and students, and (d) informing early childhood initiatives and programs. States have chosen different assessment approaches and are forced to strike a balance between stakeholder needs, such as the timeliness and depth of data reporting, with practical limitations, such as cost and administration time. Some states have relied on off-the-shelf assessments, whereas others have modified preexisting measures. Others still have developed their own KEAs (Connors-Tadros, 2014; Siddens, Hubbell, & Otto, 2013).
Although there has been some variation in the structure and content of state KEAs, the majority of states utilizing entry measures have opted for classroom-embedded performance-based assessments, also known as authentic or observation-based assessments. In a recent search of documentation available on state websites, at least 10 states were either using or considering the use of TS GOLD as their primary KEA as of the 2015–2016 school year (Colorado Department of Education [DOE], 2016; Korobkin, 2012; Louisiana DOE, n.d.; Massachusetts Executive Office of Education, 2016; Michigan DOE, 2016; Minnesota DOE, n.d.; Nevada Early Childhood Advisory Council, 2016; New Jersey DOE, n.d.; State of Alabama DOE, 2015; State of Washington, 2015). Fourteen additional states were implementing another performance-based measure or an assessment with a large observational component as their school entry assessment during the 2015–2016 school year (Alaska Department of Education and Early Development, 2016; Arkansas DOE, n.d.; California DOE, 2016; Connecticut DOE, n.d.; Florida Office of Early Learning, 2014; Illinois State Board of Education, 2016; Maine DOE, 2015; Maryland State Board of Education, 2015; Missouri Department of Elementary and Secondary Education, n.d.; New Mexico Public Education Department, n.d.; Ohio DOE, 2016; Public Schools of North Carolina, n.d.; Vermont Agency of Education, 2016; Wyoming DOE, 2016).
Many of the performance-based assessments used by states, such as the Work Sampling System (Meisels, Jablon, Marsden, Dichtelmiller, & Dorfman, 2001), the Desired Results Developmental Profile–Kindergarten (California DOE, 2016), and TS GOLD (Heroman et al., 2010), follow a similar format and align closely in terms of the skills and domains assessed (Lambert, Kim, & Burts, 2015; Teaching Strategies, 2010). For each of these measures, teachers are asked to collect data from multiple sources, including student work, observations, and classroom tasks. Based on the information collected for each student, teachers rate children’s skills across multiple domains, such as approaches to learning, language and literacy development, and mathematics ability. Generally, the skills are described and a rating scale is used to identify a student’s ability level across different readiness domains. All three of the aforementioned assessments provide information about how a student is doing in each area relative to research-based developmental expectations with the intention of helping teachers plan for students’ learning needs in a comprehensive manner (California DOE, 2016; Heroman et al., 2010; Meisels et al., 2001).
Despite the relative newness of performance-based assessments, most states have opted for this format over direct assessments. Although direct assessments have been used by clinicians and other educational specialists to measure young children’s early academic skills for a longer period of time (Atkins-Burnett, 2007; Dennis et al., 2013; C. Snow & Van Hemel, 2008), the need for specialized training often makes them more costly and/or complicated to administer than performance-based alternatives. Within the direct assessment format, the administrator interacts with each student individually and asks the child to respond to series of highly standardized prompts or complete a sequence of tasks, and the administrator then records the child’s responses to each item. The specific skills assessed by each of the items within a given measure are intended to represent a sampling of the abilities included in the overall construct of interest (Koretz, 2002). Direct assessments place more restrictions on the ways in which the child is presented with tasks and how the assessor can prompt or respond to a student. This is done to ensure that students have very similar experiences across contexts/administrators, increase the comparability of scores, and improve the objectivity of the measure and ability to compare scores across children.
Authentic assessments offer several potential advantages over direct assessments that make them appealing, particularly in the early childhood setting. First and foremost, pencil-and-paper tests traditionally administered in upper-elementary grades and higher are neither feasible nor desirable in the kindergarten setting (C. Snow & Van Hemel, 2008). Although one-on-one direct assessments can circumvent issues with young children’s ability to independently read and write, they are often time-consuming and sometimes require a student to focus on the assessment task for longer than is developmentally appropriate (Atkins-Burnett, 2007; Macy & Bagnato, 2010). Additionally, when administered by the teacher, the lengthiness of direct assessments can translate into a loss of instructional time (McAfee & Leong, 2011). Alternatively, if the assessment is completed by someone unfamiliar to the student, it can cause the child to become nervous or uncomfortable, compromising the validity of the results and introducing measurement error (Atkins-Burnett, 2007; C. Snow & Van Hemel, 2008). Performance-based assessments, on the other hand, can often be completed outside of class time and, in the case of teacher-administered authentic assessment, are less intrusive to both students and teachers as information is collected over the course of regular instruction (K. Snow, 2011). Last, these types of assessments are purported to capture more complete and relevant information about students’ skills as teachers are able to compile and consider multiple sources of the child’s performance in context (Atkins-Burnett, 2007). Because of these advantages, the performance-based measures that were once used in conjunction with a specific curriculum, such as TS GOLD, have evolved to become stand-alone entry assessments.
However, some have expressed concern over the potential influence of factors that are unrelated to students’ actual skills on the accuracy of performance-based teacher ratings (Cabell, Justice, Zucker, & Kilday, 2009; Hoyt, 2000; Kilday, Kinzie, Mashburn, & Whittaker, 2012; Mashburn, Hamre, Downer, & Pianta, 2006; Sudkamp, Kaiser, & Jens, 2012). Raters may systematically differ in the scores that they assign to students by being too lenient, too severe, or less discriminating across skills or students or by rating all students as average (Engelhard, 1994). Such tendencies introduce score variation that is attributable to rater characteristics rather than students’ demonstrated abilities, what Waterman and colleagues (2012) refer to as “assessor variance.” Providers of performance-based assessments have attempted to safeguard against rater effects by providing reliability training or checks (Cash, Hamre, Pianta, & Myers, 2011) or carefully defining scoring rubrics to reduce subjectivity (Atkins-Burnett, 2007). However, these efforts are not consistent. For instance, although TS GOLD provides interrater reliability training, it does not require that teachers administering the assessment pass or complete the training process (Teaching Strategies, 2011). Despite these concerns, multiple studies have examined the psychometric functioning of performance-based assessments and have found promising evidence for both the reliability and validity of these types measures in samples of young children (Burts & Kim, 2014; Halle, Zaslow, Wessel, Moodie, & Darling-Churchill, 2011; Karelitz, Parrish, Yamada, & Wilson, 2010; Kim & Smith, 2010; Meisels, Liaw, Dorfman, & Nelson, 1995; Lambert, Kim, & Burts, 2014, 2015; Soderberg et al., 2013; Teaching Strategies, 2013a, 2013b). Below, we have included an overview of prior research on the psychometric properties of the measure utilized in this study.
Several studies have examined the reliability and validity of TS GOLD in samples of preschool (Burts & Kim, 2014; Kim & Smith, 2010; Lambert et al., 2014, 2015; Teaching Strategies, 2013a, 2013b) and kindergarten students (Lambert et al., 2015; Soderberg et al., 2013). Focusing on the two most relevant studies to the current research, Lambert and colleagues (2015) used a sample of preschool students, and Soderberg and colleagues’ (2013) examined TS GOLD as a KEA in Washington state. In terms of validity, both studies focused largely on the convergent (or concurrent) validity of TS GOLD through its association with well-established direct assessments of the same or similar learning constructs. The findings of both studies were similar in terms of convergent validity estimates expressed as correlations between the TS GOLD domains and corresponding subscales on norm-referenced assessments, which ranged from low (r = .26 for measures of social-emotional and physical skills in Soderberg et al., 2013) to moderate (r = .68 for measures of literacy and mathematics in Lambert et al., 2015). Additionally, Lambert et al. (2015) performed a confirmatory factor analysis to verify the proposed six domains of TS GOLD. Although the six-factor model produced a statistically significant chi-square value, it also had generally acceptable fit across several indices in a sample of students ages 3 to 5 (standardized root mean square residual [SRMR] = .038, comparative fit index [CFI] = .918, and root mean square error of approximation [RMSEA] = .061), providing support for the internal structure of TS GOLD. Correlations between the latent constructs were positive and strong and ranged from .68 to .93. Finally, Lambert and colleagues (2015) compared the intraclass correlations (ICCs) associated with TS GOLD and external direct assessment, and found the former to be much larger, suggesting “a high probability of rater effects such as leniency or strictness” (p. 60). One limitation of these studies is that they did not report or discuss estimates of discriminant validity. Understanding an assessment’s capacity for discrimination is important if these tools are to be used to individualize and guide classroom instruction, as a measure needs to be able to differentiate students’ skill levels across learning domains and to differentiate students within a classroom.
Purpose of Study
This study focused on TS GOLD due to its similarities to other performance-based KEAs, its widespread use as a mandated KEA in at least 10 states across the country (see Colorado DOE, 2016; Korobkin, 2012; Louisiana DOE, n.d.; Massachusetts Executive Office of Education, 2016; Michigan DOE, 2016; Minnesota DOE, n.d.; Nevada Early Childhood Advisory Council, 2016; New Jersey DOE, n.d.; State of Alabama DOE, 2015; State of Washington, 2015), and the mixed validity evidence in prior research. We examined TS GOLD for its internal consistency and its convergent and discriminant validity in a sample of kindergarten classrooms. Specifically, the study was designed to answer three primary research questions: Do the previously reported TS GOLD constructs replicate in the current sample? How closely do the TS GOLD ratings of children’s skills in key early learning domains at kindergarten entry align with the results of other validated direct assessments of the same or aligned constructs? How well does TS GOLD differentiate children’s readiness skills within a classroom? In order to address these questions, we first performed a confirmatory factor analysis and estimated the interdomain correlations for TS GOLD to see how similar/dissimilar students’ scores were across the different learning constructs. Second, we examined convergent and divergent validity by comparing children’s school readiness scores as measured by teachers using TS GOLD to scores as measured by independent data collectors using direct assessments. Finally, we compared ICCs among student scores as determined by TS GOLD versus the independently administered direct assessments.
Research Methods
Participants
Fifty-eight teachers and 1,086 kindergarten students within 16 public elementary schools across four diverse districts in one southeastern state within the United States were included in the present study. These participants were part of a program evaluating best practices of kindergarten readiness assessment. The sample was chosen to contain teachers and children with diverse demographic characteristics (see Tables 1 and 2).
Descriptive Statistics of Student Sample and Subsample
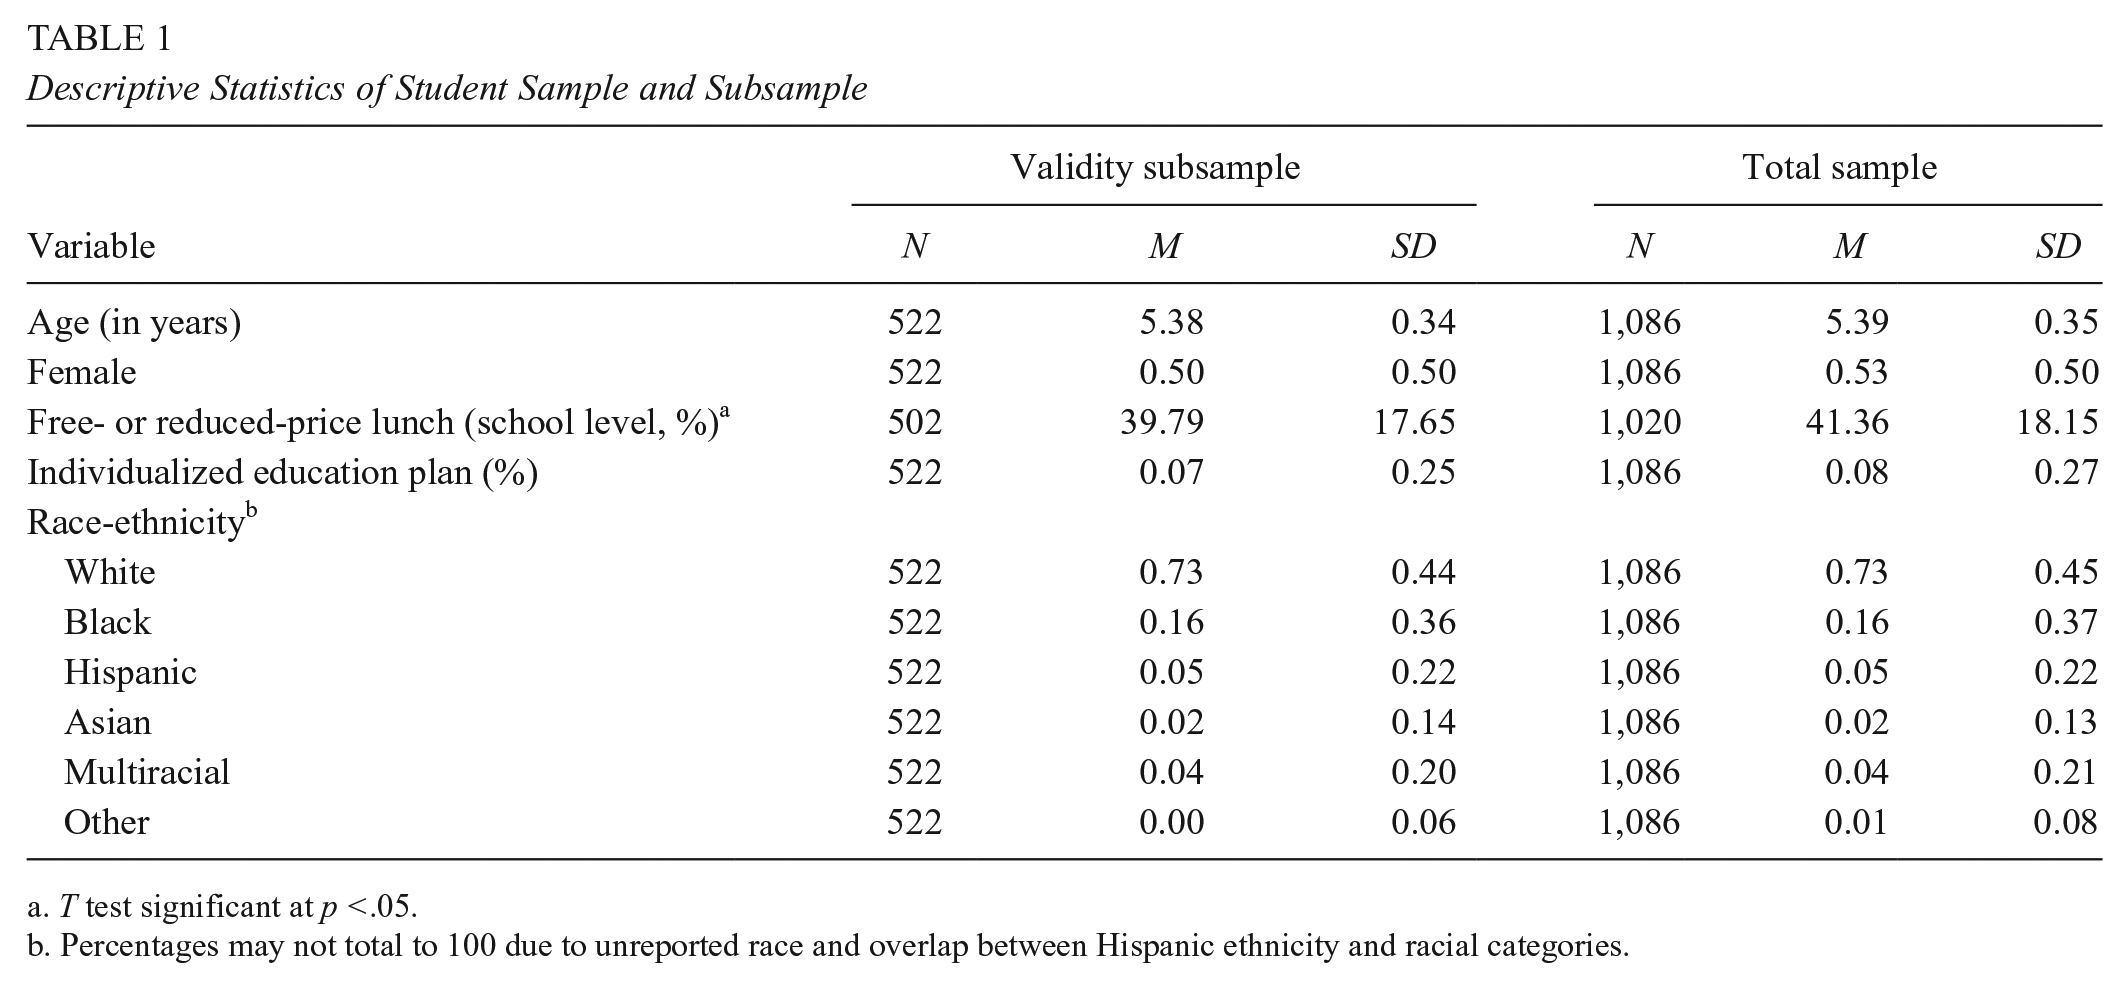
T test significant at p <.05.
Percentages may not total to 100 due to unreported race and overlap between Hispanic ethnicity and racial categories.
Descriptive Statistics for Participating Teachers

In order to construct the subsample used in the validity analyses, classrooms from the program were strategically selected to maintain diversity, and an average of 10 students within each of these classrooms were randomly selected to receive a battery of previously validated direct assessments. This resulted in a subsample of 522 students in 52 classrooms. Comparisons of the validity subsample to those students not randomly chosen from the larger sample revealed no significant differences across age, gender, or race (p > .05), but the students who received direct assessments did come from schools with a somewhat lower proportion of students receiving free- or reduced-price lunch on average (p < .05).
The demographic characteristics of the students in the full sample and validity subsample are presented in Table 1. Participating students were between 4 and 7 years of age upon entering kindergarten, and the majority of children (73%) in the study sample were White. Black students composed the second largest racial group (16 %), Hispanic students represented 10% of the sample, and Asian students accounted for 4% of the sample. Approximately 7% of participants were identified as having special education needs. On average, children included in the sample were situated in schools in which 40% of students qualified for free or reduce-priced lunch.
The background characteristics of all participating teachers are included in Table 2. On average, teachers had been practicing for 14 years. All teachers had earned a bachelor’s degree or higher, with more than half of teachers (57%) possessing a master’s degree. The vast majority of sampled teachers were White (91%), and almost all were female (98%).
Measures
TS GOLD
TS GOLD is a multidimensional early childhood assessment in which teachers observe children’s skills during typical instruction for certain period of time, provide documentation of what is observed, and then rate children on a set of items (Heroman et al., 2010). The assessment covers children’s development in nine broad skill areas, including literacy, mathematics, language, social-emotional, cognitive, physical, science and technology, social studies, and arts. These skill domains are further described by 38 objectives (listed by skill domain in Table 3) and 65 behavioral indicators referred to as “dimensions.” Using an online portal, teachers collect pieces of evidence of students’ demonstrated skills, including classroom notes, videos, and samples of student work related to multiple domains of school readiness. At several points during the year, teachers are asked to review their students’ documentation and rate them using “age-bands” to determine whether children’s skills are developing in expected ways. In the first six skill areas listed (literacy through physical), teachers rate children’s skill levels on each of the dimensions using a 9-point scale with descriptive anchors at points 2, 4, 6, and 8 on the scale. These ratings are placed within a continuum that reflects designated developmental expectations within each learning objective based on nationally normed benchmarks (Teaching Strategies, 2012). Previous studies of TS GOLD have shown moderate to strong reliability (Lambert et al., 2015) and adequate to strong convergent validity (Lambert et al., 2015; Soderberg et al., 2013).
Teaching Strategies GOLD Domains and Objectives

Note. The six domains above represent the subset of the nine domains covered by Teaching Strategies GOLD. These were included in the present study.
Direct assessments of literacy, mathematics, and language
Literacy, mathematics, and expressive language were assessed using subtests from the Woodcock-Johnson III Tests of Achievement (WJTA; Woodcock, McGrew, & Mather, 2001). All direct assessments and their corresponding TS GOLD domain are listed in Table 4. Descriptive statistics for all measures in the current sample are provided in Table 5. The WJTA is a widely used (e.g., Burchinal, Peisner-Feinberg, Pianta, & Howes, 2002; Duncan et al., 2007; Peisner-Feinberg et al., 2001), individually administered assessment battery that measures achievement in individuals from age 2 through adulthood. Twelve achievement subtests can be used with young children, with items (scored as either incorrect or correct) progressing in difficulty over the course of the assessment. Six of the WJTA subtests were used in this study due to their alignment with the constructs covered by TS GOLD. Picture Vocabulary was used to assess students’ language skills, in which children are presented with an illustration and then asked to point to a particular object or state what is depicted on the card. Literacy was assessed using the Letter-Word Identification and Word Attack subtests. Letter-Word Identification is a measure of children’s sight vocabulary. This subtest begins with letters and moves to increasingly complex words, measuring children’s ability to identify words either through decoding or visual memory. Word Attack is a measure of the ability to decode and pronounce phonically regular nonwords, or pseudo words. These two subtests combine to form a Basic Reading composite score used for analyses. Mathematics skills were assessed with the Applied Problems and Quantitative Concepts subtests. Applied Problems measures analytical and problem-solving skills and requires children to listen to a problem, identify the procedure to solve it, and perform simple calculations. Quantitative Concepts measures math knowledge of concepts, symbols, and vocabulary and includes two sections: Concepts (recognizing numbers, shapes, and sequences) and Number Series (identifying the missing digit in a series). Together, Applied Problems and Quantitative Concepts compose the Math Reasoning cluster used for analyses.
Domains and Skills in Direct Assessments

Note. The six domains above represent the subset of the nine domains covered by Teaching Strategies GOLD included in the present study. WJ = Woodcock-Johnson.
The two subtests used to assess literacy compose the WJ Tests of Achievement Basic Reading Composite.
The two subtests used to assess mathematics compose the WJ Tests of Achievement Math Reasoning cluster.
Descriptive Statistics of Measures

Note. TS = Teaching Strategies; WJ = Woodcock-Johnson; HTKS = Head-Toes-Knees-Shoulders.
Basic Reading is a composite of Letter-Word Identification and Word Attack subscales.
All WJ scores are reported as W scores.
Math Reasoning is a composite of Applied Problems and Quantitative Concepts subscales.
Previous research on the WJTA has established its validity and reliability in diverse, nationally representative samples of children and adolescents (Woodcock et al., 2001; Woodcock, McGrew, Schrank, & Mather, 2007). A series of analyses provide information about each subtest’s psychometric properties. Median reliability coefficients clustered by intended use of assessment and age of test taker ranged from .85 to .99, with the majority of subtests possessing reliabilities above .90 (Woodcock et al., 2001, 2007). Several studies in samples of different ages and abilities also provided strong evidence for the concurrent, discriminant, and predictive validity (McGrew & Woodcock, 2001).
Direct assessments of self-regulation
Aspects of children’s behavioral regulation/executive functioning (e.g., the integration of children’s behavior requiring attention to instructions, working memory, and inhibitory control; Cameron, McClelland, Matthews, & Morrison, 2009) were assessed using two measures: Pencil Tap (Diamond & Taylor, 1996; Smith-Donald, Raver, Hayes, & Richardson, 2007) and the Head-Toes-Knees-Shoulders (HTKS) task (Cameron et al., 2009). Both assessments have been widely used in recent developmental and early education research.
Pencil Tap was adapted from the Preschool Self-Regulation Assessment (PSRA; Smith-Donald et al., 2007) to measure inhibitory control, or a child’s ability to stop himself or herself from the dominant response. In Pencil Tap, children are given instructions to tap their pencil once on the table when the examiner taps twice, and twice when the assessor taps once. In the present study, raw scores were calculated by summing all correct and incorrect responses, with possible totals ranging from 0 to 16. Previous research has provided evidence of strong reliability (Smith-Donald et al., 2007) and concurrent and predictive validity (Blair & Razza, 2007; Rimm-Kaufman, Curby, Grimm, Nathanson, & Brock, 2009; Smith-Donald et al., 2007) of Pencil Tap in samples of young children.
The HTKS task is a measure of children’s behavioral regulation and assesses a child’s ability to control his or her behavior through the use of attention, working memory, inhibitory control, and cognitive flexibility (Cameron et al., 2009). Framed as game, the task asks children to do one of two actions that is the opposite of what the assessor says (e.g., when examiner says, “Touch your head,” the student should touch his or her toes; when examiner says, “Touch your toes,” child should touch his or her head). As the examinee progresses through the three levels of the assessment, the instructions become increasingly complex with the addition of new rules. Each item is scored as an incorrect response (0), a self-correct (1), or a correct response (2), for a maximum score of 40. Raw scores were used for all analyses. The HTKS task has demonstrated strong reliability (Cameron et al., 2008) and construct (Cameron et al., 2008, 2009) and predictive validity (McClelland et al., 2007) in other studies.
Procedures
TS GOLD
Before using TS GOLD in their classrooms, all teachers participated in an onsite 2-day training provided by Teaching Strategies. The session focused on various aspects of administration, including navigation of the online application, documentation of student work, and assessment of children’s readiness skills using the TS GOLD criteria. Following training, teachers were instructed to observe and document children’s readiness skills for the first 4 weeks of school and to subsequently assess children’s skills during a 2-week assessment window. Teachers reported a wide range of administration times via a post-assessment survey. For the majority of participants, the TS GOLD documentation took an average of 1 to 2 hours per child. Teachers also reported that entering scores for the fall assessment took an additional 30 minutes to 1 hour per student.
Direct assessments
Eleven independent data collectors completed the direct assessments on-site using an electronic system. All data collectors completed a 2-day training led by the research team. In order to ensure fidelity to assessment procedures, data collectors were required to practice administration and record one session for review and feedback by a university researcher. Data collectors were also supervised in their initial administration. Direct assessments were conducted within 6 to 10 weeks from the start of student instruction and overlapped with the TS GOLD assessment window. The full assessment battery took between 20 and 45 minutes per student to complete.
Analytic Approach
We performed several different analyses in order to address our three primary research questions. First, we verified the proposed six-factor structure of TS GOLD in a confirmatory factor analysis (CFA) with the full sample using Mplus Version 7.11. In a CFA, the unobserved, theoretical constructs are modeled to predict the observed responses to the assessment items to which they are hypothetically related. Multiple fit indices are considered to determine if the proposed model provides an acceptable fit to the observed data, with adequate fit on multiple (but not all) indicators suggesting an appropriate modeling of the underlying data structure. For the present study, the CFA model accounted for the clustering of students in classrooms (using the “type=complex” command in Mplus) and included six factors representing the primary learning domains suggested by TS GOLD: social-emotional, physical, language, cognitive, literacy, and math. Each item in the assessment was allowed to load onto its corresponding domain but had no links to any of the other skill areas. The domains were allowed to covary, but no specific inter-item covariances were included. We examined several indices in order to determine the adequacy of the fit using Hu and Bentler’s (1999) criteria for acceptable fit: chi-square test (p > .05), RMSEA (<.06), SRMR (<.08), CFI (>.95), and Tucker Lewis index (TLI; >.95).
To further examine the discriminant validity of the proposed factors, we examined the interdomain correlations produced by a two-level CFA (using the “type=twolevel” option in Mplus) and calculated the average variance extracted (AVE) for each latent construct (Fornell, Tellis, & Zinkhan, 1982). The two-level factor analysis, in which we estimated separate models at the within- and between-class levels, permitted us to determine the extent to which observed correlations between latent constructs were reflective of scoring similarities within a classroom (e.g., within cluster) and/or across teachers (e.g., between cluster). We used the aforementioned indices (χ2, RMSEA, SRMR, CFI, TLI) to establish the adequacy of the fit for two-level factor model. The AVE represents the average amount of variance explained by a given construct (ξ j ) and is calculated by taking the average of all the squared standardized factor loadings (λ2) across k items that load onto the construct:

Under the criterion suggested by Fornell et al. (1982), a construct has exhibited discriminant validity if the square root of the AVE for that construct is larger than the absolute value of the correlation between that construct (j) and any of the other latent constructs (i) included in the model:

More simply, this formula ascertains whether or not the construct is more strongly related to the items that compose it than to other constructs.
In the remaining analyses, we restricted our sample to include only those students who were assessed using both TS GOLD and the battery of direct assessments. In order to evaluate the convergent and discriminant validity as well as differentiation among TS GOLD domains, we estimated a series of bivariate correlation coefficients using Mplus Version 7.11. All correlations accounted for the nesting of students within classrooms. To assess convergent validity, we examined the correlation coefficients between TS GOLD and direct assessments of the same skill area. Typically, correlations between performance-based ratings and direct assessments of similar constructs are moderate, ranging from .40 to .60 (Cabell et al., 2009; Kilday et al., 2012; Sudkamp et al., 2012). To further explore TS GOLD’s ability to distinguish between skill levels across the different learning domains, we looked at the associations between the TS GOLD domains and direct assessments of different learning constructs (e.g. TS GOLD literacy score vs. direct assessment math score). Although there is not currently a standard for the desired magnitude of these correlations, the relationship between two assessments that target different learning constructs should be weaker than the relationship exhibited between assessments of the same or similar domains (D. Campbell & Fiske, 1959; Downing, 2003; Messick, 1995; Peter, 1981).
ICCs provided additional information about TS GOLD’s ability to differentiate among students within a given learning domain in the same classroom. Similar to the two-level CFA, the ICC partitions the amount of variance in students’ scores that is between the clusters (in this case, the classroom/teacher) versus within the clusters. It is defined by the following ratio:

where σB2 represents the between-cluster variance and σW2 represents the within-cluster variance. In other words, the ICC compares that amount of score variation that can be attributed to the classroom/teacher to the total amount of variance that is observed in scores. By definition, ICCs range from 0 to 1, with higher values indicating that students’ scores look more similar within the classroom than across classrooms. Although there is no convention by which to judge the magnitude of the ICC, previous research on ICCs in performance-based assessment found values that ranged from 0.15 to 0.35 (Mashburn et al., 2006; Waterman et al., 2012). The ICC coefficients were calculated using a two-step process in Stata 14. First, a series of two-level mixed-effects models were estimated using maximum likelihood estimation, with scores for each TS GOLD domain and direct assessment as the dependent variables and students nested within classrooms. Through this estimation, we were able to obtain the two components needed to calculate the ICC: the residual variance (σW2) and the variance associated with the classroom (σB2). The ICC was then calculated using the formula above.
Results
Internal Structure of TS GOLD
We first confirmed the six-factor structure of TS GOLD using CFA. On the basis of the criteria suggested by Hu and Bentler (1999), the estimated six-factor model had acceptable fit on two (RMSEA = .043, SRMR = .052) of the five indices, χ2(1209) = 3586, CFI = .845, TLI = .837. All item loadings were significant, and standardized factor loadings ranged from .54 to .89. The correlation coefficients between each of the latent factors (Table 6) were positive and ranged from moderate (r = .66 between physical and literacy) to large (r = .91 between language and cognitive) based on the criteria suggested by Hinkle, Wiersma, and Jurs (2003). Although all of the associations among the direct assessments (Table 7) were also significant and positive, the coefficients were smaller in magnitude, ranging from small (r = .17 for literacy with self-regulation) to moderate (r = .61 for literacy with math).
Correlations Between Latent Factors (off diagonal) and Square Root of the Average Variance Extracted (diagonal)

Note. All of the correlations are significant (p < .001). The coefficients along the diagonal represent the square root of average variance extracted, which is equivalent to the average of the squared factor loadings for each construct.
Correlations of Direct Assessments

Note. All correlations are significant (p < .001). WJ = Woodcock-Johnson.
Because of the nested nature of our TS GOLD data, it is important to determine the extent to which the aforementioned correlations among TS GOLD domains were reflective of scoring relationships within or between classes. In order to do this, we examined the correlations of the latent constructs produced in a two-level CFA. The two-level model exhibited acceptable fit on two (RMSEA = .039, SRMR = .043 at within level) of the five indices, χ2(2418) = 6287, CFI = .906, TLI = .901. All items loaded significantly onto their given constructs (p < .05), with the exception of one item in math and one in literacy at the between level (p < .10). Standardized factor loadings ranged from .59 to .90 for the within-level and from .28 to .99 for the between-level model. Both the within- and between-cluster interdomain correlations were moderate to large, ranging from .67 (math with social-emotional) to .94 (math with literacy) for the within-class correlations and from .69 (math with literacy) to .94 (social-emotional with language) for the between-class correlations. The relatively consistent magnitude of the correlations at both levels suggests that, on average, children’s ratings within a given classroom and a teacher’s average classroom score tended to look similar across all TS GOLD domains.
The relationships between TS GOLD domains were further explored using the square root of the AVE for each latent construct (included with factor correlations in Table 6). All latent constructs had at least one estimated correlation with another domain that exceeded the square root of the AVE across all of the proposed TS GOLD domains. In particular, the square roots of the AVE for literacy cognitive, and mathematics domains are smaller than three of the five correlations with the other latent constructs. This suggests that more of the observed variation in the literacy items is explained by the language, cognitive, or mathematics latent constructs than by the literacy construct.
Convergent and Discriminant Validity With Direct Assessments
To establish the convergent validity of TS GOLD, we examined the relationship between each domain and the direct assessment of the same construct, represented by the bolded correlation coefficients in Table 8. The strength of the within-domain associations varied based on the skill area and ranged from small to moderate. The TS GOLD literacy domain demonstrated the strongest correlation with its corresponding direct assessment (r = .68), whereas the cognitive domain displayed the weakest associations with the direct assessments of self-regulation (r = .28 and r = .33 for Pencil Tap and HTKS, respectively).
Correlations Between TS GOLD Domains and Direct Assessments

Note. All correlations are significant (p < .001). TS = Teaching Strategies; WJ = Woodcock-Johnson. Bolded correlations indicate corresponding assessments and domains. For instance, WJ Basic Reading is most closely aligned with the TS GOLD domain of literacy.
Next, we examined the associations with TS GOLD domain scores and direct assessments of different learning domains for evidence of discriminant validity. We found that the majority of the correlations across less similar constructs were comparable in strength to the relationships within the same skill area. For instance, the TS GOLD literacy domain had a moderate relationship of similar magnitude to math compared to its within-domain association with Woodcock-Johnson Basic Reading (r = .67 vs. r = .68 for math and reading, respectively). In the case of both TS GOLD language and cognitive domains, several of the cross-domain assessments demonstrated stronger correlations than the corresponding measure of the same construct. These findings also suggest that many of the TS GOLD domain scores had as much or more in common with measures of different skills than they did with assessments of the same learning domain.
Skill-Level Differentiation Within TS GOLD Domains
To determine the extent to which teachers’ ratings discriminated among children’s skill levels in a given learning domain relative to the direct assessments, we examined the ICC coefficients. The ICCs for each TS GOLD domain and direct assessment are presented in Table 9. The values derived from the TS GOLD domain-specific scores ranged from .18 in literacy to .59 in the physical domain, with a median ICC of .37. Thus, on average, 37% of a student’s TS GOLD score within a learning domain can be explained by the student being in a particular classroom. In comparison, the ICCs corresponding to the direct assessments were much smaller (.01 for Pencil Tap to .04 for math and HTKS), indicating that the variability in students’ direct assessment scores was almost entirely attributable to differences between students, with 1% to 4% of the variation explained by a student being in a particular classroom.
Intraclass Correlation (ICC) Coefficients

Note. ICCs were estimated as the ratio of between-class variance to total score variance. Not all TS GOLD domains have corresponding direct assessments and the Cognitive domain corresponds to two direct assessments. TS = Teaching Strategies.
ICC for Pencil Tap.
ICC for Head-Toes-Knees-Shoulders.
Discussion
The large-scale use of KEAs has evolved over the past decade to include more states, domains of readiness, and forms of utilization. Most commonly, states have relied on embedded, performance-based assessments to provide information about students’ skills at school entry. This type of assessment has appealed to educational administrators and practitioners for multiple reasons, including (a) the increased validity of the results through the observation of students’ exhibited skills in genuine contexts while still maintaining adequate psychometric properties, (b) the enhanced ability of such assessments to comprehensively inform instruction and intervention, and (c) the flexibility of administration without sacrificing instructional time. However, such performance-based assessments have also been criticized as being more susceptible to the influence of rater characteristics (Jonsson & Svingby, 2007), meaning that variation in students’ scores may be driven by differences across administrators rather than actual differences in students’ abilities (Engelhard, 1994; Waterman et al., 2012). In our examination of one such assessment, TS GOLD, we found important strengths and weaknesses that both align with the literature and diverge from the purported advantages of embedded, performance-based assessment.
Consistent with previous research (Burts & Kim, 2014; Cabell et al., 2009; Lambert et al., 2014; Soderberg et al., 2013), TS GOLD exhibited a consistent internal structure composed of the proposed readiness domains. It also demonstrated strong associations with independent direct assessments of the same constructs. Thus, the present study provides further evidence of the scale reliability in terms of factor structure as well as the convergent validity.
However, the strength of TS GOLD’s psychometric characteristics diminished somewhat when we considered both discriminant validity and the potential for rater effects, which have not been examined in prior research. For a measure to have evidence of discriminant validity, we would expect associations between conceptually related domains to be stronger than the relationships between measures of different constructs (D. Campbell & Fiske, 1959; Downing, 2003; Messick, 1995; Peter, 1981). For example, we would anticipate that two measures of literacy would have a larger correlation than a measure of literacy and a measure of mathematical ability, as the former result would suggest that the measure is assessing skills that are uniquely associated with literacy, whereas the latter implies the influence of a confounding factor also captured by the theoretically unrelated math assessment. Although several of the TS GOLD domains were strongly related to the direct assessments of corresponding skills, three of the four domains (literacy, language, and cognitive) had comparable or larger associations with direct assessments of different constructs (see Table 8). The lack of discrimination was further indicated by the high correlations between the TS GOLD learning domains in our factor analysis relative to the average variance extracted by the individual constructs. This suggests that teachers tended to rate individual students more similarly across all learning constructs despite empirical evidence of more substantial variation across domains when skills are measured via direct assessment. Additionally, TS GOLD appeared less able to differentiate students’ skills in a specific learning area within a classroom. The substantially larger ICCs associated with TS GOLD ratings indicated that students’ scores in each learning construct were much more similar within a given classroom compared to those produced by the direct assessments. This suggests that the readiness ratings produced using TS GOLD—and likely other performance-based assessments—may be more influenced by factors that are separate from a child’s actual skills compared to results obtained from direct assessments (Mashburn et al., 2006; Waterman et al., 2012).
Measuring the readiness competencies of incoming kindergarten children is a challenging task. No assessment will satisfy all of the potential uses for entry assessment, and because no assessment is a panacea for all instructional and programmatic needs, educational policymakers must be deliberate about matching appropriate measures to their constituents’ identified requirements. Although TS GOLD was originally intended as a curriculum-embedded assessment (Halle et al., 2011), it is now commonly utilized, as well as other performance-based measures, with a variety of curricula as a KEA and as a progress-monitoring tool in preschool (Teaching Strategies, 2013b). It is important for educational policymakers and educators to understand whether the psychometric properties of the chosen assessments allow for the data to be used in the way the user intends. If teachers are investing additional time in order to assess a wide range of skills for all children in their classrooms with the intention of individualizing instruction, the expectation is that they come away with an improved understanding of how students are differentially functioning across multiple learning domains. Thus, the value of having an assessment that measures multiple types of skills is reduced if children tend to look the same across readiness domains.
Limitations and Directions for Future Research
There are several important limitations that affect the generalizability of the current findings. First, the performance of a measure is influenced by context (Halle et al., 2011). As emphasized above, this study considers only the use of TS GOLD as a KEA, with the intention of identifying students who are at risk and in need of further assessment and/or early intervention in a specific area. As described in the introduction, TS GOLD and other performance-based measures are now being used for this purpose. We did not examine the use of TS GOLD as a formative assessment linked to implementation of a particular curriculum as this was not the purpose of this study.
Additionally, the broad set of behaviors assessed within some of the TS GOLD domains made it difficult to identify the appropriately aligned direct assessments. A lack of alignment between the constructs assessed could lead to lower convergent-validity associations. This was particularly problematic for the cognitive and social-emotional domains, the first of which touches on a wide range of skills, from approaches to learning and working memory to symbolic representation and classification skills, and overlaps with the behaviors represented within social-emotional domain. We chose to look at the relationship between cognitive scores and those obtained from HTKS and Pencil Tap as opposed to the social-emotional domain due to the narrower focus of the cognitive domain as well as better alignment with the behaviors measured by the direct assessments (in particular, behavioral regulation and executive functioning). Still, this potential lack of alignment was less problematic for the academic domains, and the correlations between the direct assessments and TS GOLD in these domains were largely of the size and significance needed to establish convergent validity.
Furthermore, the data were collected during the pilot year of TS GOLD after a single 2-day, in-person training session, which could suggest that participating teachers had limited familiarity with the measure. This lack of experience and comfort with TS GOLD and its procedures is underscored by the small number of teachers attempting and/or achieving certified reliability within the present sample. Research suggests that the accuracy of teachers’ ratings of students could improve with continued use of an instrument (Ackerman & Coley, 2012; Meisels, Wen, & Beachy-Quick, 2010), although other studies have found that familiarity only moderately improves the accuracy of teacher-administered performance-based assessments (Begeny & Buchanan, 2010). Further research should be done in classrooms where teachers have implemented the measure of interest for multiple years to see if the similar patterns hold and to the same degree found within this sample.
Finally, additional research is needed to understand the utility of performance-based assessments and the most appropriate uses of these types of measures. In the present study, we found that teachers scored students’ skills much more similarly across school readiness domains using TS GOLD than was evident when students were measured using direct assessments. For example, when teachers rated children in their classroom highly in literacy skills, they also tended to rate them highly in math skills. Although the level of young children’s skills across readiness domains tends to be somewhat consistent within a child, we would expect less consistency in children’s skills across readiness domains than was demonstrated when children were assessed by teachers using TS GOLD. However, it is unclear from the current analyses whether or not teachers systematically and consistently differ in the ways in which the rate their students. Future studies should do more to parse out rater biases based on administrator and child characteristics.
Footnotes
Acknowledgements
This study was supported by a grant from Elevate Early Education (E3). The findings, opinions, and implications expressed are those of the authors and not E3. The authors are grateful for the help of the many children, teachers, administrators, and field staff who participated in this study. We also thank Elise Rubinstein, Jason Downer, Bridget Hamre, Robert Pianta, Caroline Werenskjold, and Lee Williams for their contributions to this project.
Authors
KATHERINE L. MILLER-BAINS is a doctoral student in the Curry School of Education’s Research, Statistics, and Evaluation program at the University of Virginia. She is interested in investigating scalable ways to make educational data more useful to practitioners and applying rigorous experimental and quasiexperimental methods to educational program evaluation.
AMANDA M. WILLIFORD is a research associate professor at the Center for Advanced Study of Teaching and Learning within the Curry School of Education at the University of the Virginia. Her research focuses on (a) creating, evaluating, and unpacking early interventions that change children’s early education experiences to improve their readiness skills; (b) understanding the proximal processes within the early childhood education context that influence children’s development and learning; and (c) applying research to policy and scalable practice.
JACLYN P. RUSSO is a clinical psychology doctoral student within the Clinical and School Psychology Program within the Curry School of Education at the University of Virginia, where she conducts research at the Center for Advanced Study of Teaching and Learning. Her research interests include school readiness, particularly the social and emotional development of young children and how to better help teachers use readiness assessments to guide classroom instruction and interventions.
JAMIE DECOSTER is a senior scientist at the Center for Advanced Study of Teaching and Learning within the Curry School of Education at the University of the Virginia. His research focuses on discovering ways to make the methods practiced by scientists more accurate, flexible, and efficient.
ELIZABETH A. COTTONE is a research scientist at the Center for Advanced Study of Teaching and Learning within the Curry School of Education at the University of the Virginia. Her research interests include investigating pathways from economic disadvantage to poor outcomes for children, understanding attributes of families in poverty through a resilience lens, and contributing to the field’s growing recognition of cultural and socioeconomic differences in both early intervention and measurement development with disadvantaged populations.