
Abstract
This study evaluated the extent to which existing measures met standards for a continuous suite of general outcome measures (GOMs) assessing children’s early literacy from preschool through early elementary school. The study assessed 316 children from age 3 years (2 years prekindergarten) through Grade 2, with 8 to 10 measures of language, alphabetic principle, phonological awareness, and beginning reading. We evaluated measures at each grade group against six standards for GOMs extracted from earlier work. We found that one measure of oral language met five or six standards at all grade levels, and several measures of phonological awareness and alphabetic principle showed promise across all five grade levels. Results are discussed in relation to ongoing research and development of a flexible and seamless system to assess children’s academic progress across time for effective prevention and remediation, as well as theoretical and empirical analyses in early literacy, early reading, and GOMs.
Reading proficiency ensures early and continued academic achievement. Research shows that early reading achievement prepares for later learning and achievement (e.g., Chard & Kame’enui, 2000; National Early Literacy Panel [NELP], 2009; National Reading Panel, 2000) and that students struggling to read in the earliest grades are apt to continue struggling through school (cf. Stanovich, 1988). While some historical accounts of factors affecting reading achievement begin analysis with child and instructional practices at or after kindergarten (e.g., Anderson, Hiebert, Scott, & Wilkinson, 1985), theoretical advances (Sénéchal, LeFevre, Smith-Chant, & Colton, 2001; Snow, Burns, & Griffin, 1998; Whitehurst & Lonigan, 1998), descriptive and intervention research (Walker, Greenwood, Hart, & Carta, 1994; Whitehurst et al., 1999), and systematic reviews (Juel, 2006; NELP, 2009; Snow et al., 1998) suggest that children’s status at and before kindergarten (K) controls important variance in reading success. This better understanding of children’s achievement from preschool to early elementary school can help design and evaluate prevention and early intervention services to avert reading disabilities.
This “age 3 to Grade 3” focus has sparked significant expansion in curricular, programmatic, and other interventions designed to promote early literacy and prevent later reading delays among high-risk children. Federal priorities (e.g., Early Reading First) expand the formal focus of existing programs (i.e., Head Start and initiatives under the Individuals with Disabilities Education Improvement Act of 2004) through Good Start, Grow Smart, and the Preschool for All federal initiatives. States have also acted, increasing the scope of publicly funded early childhood education to include literacy. Commercial publishers have developed and released >20 scientifically based early literacy curricula, and evidence-based practice portals (e.g., What Works Clearinghouse) now review these curricula online.
Theoretical and conceptual models of early literacy development 1 in later preschool (NELP, 2009; Sénéchal et al., 2001; Whitehurst & Lonigan, 1998) relate to, but differ from, theoretical analyses of beginning reading in early elementary school (e.g., Adams, 1990; National Reading Panel, 2000). In general, models of preschool early literacy development emphasize oral language and linguistic processes, phonological sensitivity and analysis, and informal skills for letter-sound correspondence, while models of primary-grade beginning reading emphasize decoding, letter-sound correspondence and other formal phonological analysis tasks, production of oral equivalents of printed words, and proficiency in the production and comprehension of connected text. 2 Little attention goes to the overlaps and boundaries among these models and to ways in which child proficiency in preschool literacy relates to elementary school reading proficiency (McConnell & Wackerle-Hollman, 2006).
Clarifying the overlap between early literacy and beginning reading may be especially important in advancing research and practice that promote proficiency and prevent delays or disabilities throughout the primary grades. Preschool early literacy interventions can promote later reading achievement to the degree that they enrich basic skills for beginning reading (Dickinson & Neuman, 2006; Greenwood, Bradfield, et al., 2011; Snow et al., 1998); a lack of alignment between the outcomes of preschool intervention and required skills for later reading may blunt these relations and may account for noted declines in intervention effects as preschoolers move into elementary school (Cooper & Lanza, 2014). This suggests the importance of a detailed analysis of the relation between early literacy and beginning reading and the identification of measures that describe these relations in ways that will assist in aligning curricula and instruction.
Such an alignment will require improved resources for assessing child performance across the full age range of intervention. Best practices and a growing research base (e.g., Wallace, Espin, McMaster, Deno, & Foegen, 2007) suggest that a coordinated, ongoing assessment system that is both related to long-term outcomes and sensitive to short-term changes in child performance and intervention effects will contribute significantly to improved intervention outcomes. General outcome measures (GOMs; Deno, 1985, 1986, 1997; Deno, Mirkin, & Chiang, 1982; Fuchs & Deno, 1991) in particular can meet the needs of progress monitoring and intervention enhancement in this expanded model. GOMs are brief, easy-to-collect, sensitive, and valid measures of child performance related to long-term outcomes. Research has led to robust procedures and practices for GOMs in elementary and secondary schools, including measures of reading (Wayman, Wallace, Wiley, Tichá, & Espin, 2007), writing (McMaster & Espin, 2007), and mathematics (Foegen, Jiban, & Deno, 2007), and applications to allocate services that promote achievement among children with or at risk for disabilities (Fuchs, 2003; Fuchs & Fuchs, 2007).
The logic of GOMs has helped to develop measures of earlier skills. Dynamic Indicators of Basic Early Literacy Skills (DIBELS) partly represent extending GOMs to reading achievement in the first school years (Good, Gruba, & Kaminski, 2002; Good & Kaminski, 1996; Kaminski & Good, 1996). Individual Growth and Development Indicators (IGDIs) follow similar logic for infants and toddlers (Carta, Greenwood, Luze, Cline, & Kuntz, 2004; Greenwood, Luze, & Carta, 2002; Luze, Linebarger, Greenwood, Carta, & Walker, 2001) and preschoolers (Carta et al., 2005; McConnell & Missall, 2008; McConnell, Priest, Davis, & McEvoy, 2002; Missall, McConnell, & Cadigan, 2006; Priest et al., 2002), with an emphasis on preschool early literacy (Cadigan & Missall, 2007; Hojnoski & Missall, 2006; Missall et al., 2006). To date, these measures have demonstrated correlations with later reading achievement (e.g., Missall et al., 2006) and predictive validity for basic research and intervention evaluation (Missall et al., 2007). Preschool IGDIs and early elementary DIBELS might show promise as part of an aligned portfolio of early literacy and reading assessments (cf. Wallace et al., 2007), but no one has yet evaluated the characteristics of such a portfolio to determine what assessment from preschool early literacy to early elementary beginning reading could be.
To date, most GOMs have been developed and used in ways consistent with classical test theory (Cronbach, 1990); broad and loosely controlled samples of child behavior are summed or scored to serve as measured performance. Given this and based on the recommendations of Deno (e.g., 1997; Deno et al., 1982) and others (e.g., McMaster & Espin, 2007), a set of implicit psychometric standards can be defined for evaluating GOMs and other measures of child progress. In particular, these standards assess the degree to which measures, when used with a particular sample, yield individual scores and aggregate group distributions that are useful; that is, individual measures produce scores with distributions that are relatively normal and with few outliers or artificial minimum and maximum scores (as in floor and ceiling effects).
Based on a broad reading of the GOM and curriculum-based measurement literature (Espin, McMaster, Rose, & Wayman, 2012), we have identified six sample characteristics that can serve as standards for identifying GOMs that produce meaningful data at any particular grade level. These standards operationalize the desirable characteristics for GOMs and provide an empirical basis for selecting one measure or set of measures in any domain and grade level. Possible psychometric standards include the following:
Standard deviation (SD) < 50% of sample mean: With tight distributions around sample means and fewer outliers, measures have greater capacity to discriminate differences in higher- and lower-performing students.
Skew < absolute value of 1: Skew evaluates discrepancies from normality by determining the asymmetry of a distribution about its mean (Hopkins & Weeks, 1990); absence of asymmetry in score distributions is consistent with minimal floor or ceiling effects in individual measures.
Kurtosis < absolute value of 1: DeCarlo (1997) reports that “kurtosis represents a movement of mass that does not affect the variance” (p. 294). Complementing skew, measures with acceptable levels of kurtosis are more likely to yield useful, well-distributed measures across individuals.
Test-retest reliability > .60: GOMs must demonstrate short-term temporal stability. Test-retest reliability is a typical method to determine stability. GOMs should demonstrate a test-retest reliability of at least .60, with strong preference for test-retest coefficients ≥.7, with coefficients .9 considered excellent (Litwin, 2002).
Sensitivity to growth: While studies have documented the test-retest reliability of GOMs in reading (e.g., Goffreda & DiPerna, 2010), such temporal stability is a double-edged sword: stability over short intervals of time provide evidence of test reliability, but stability over longer periods of time and in the context of effective intervention should not be expected. Intervention, particularly high-intensity intervention for lower-performing students, would be expected to change rank ordering of students and, in turn, reduce estimates of correlation across time. As a result, in addition to short-term temporal stability, evidence of sensitivity to growth for individual students is essential. In early cross-sectional research on any measure, growth may be inferred by relating test performance to age or grade (i.e., positive relations indicate scores increasing across time). As research continues, however, growth should be modeled directly through two or more assessments nested within children (e.g., repeated measures analysis of variance, hierarchical linear modeling).
Under 20% of target sample scoring 0: Measures that are too difficult for individuals or groups at earlier levels of skill development produce high rates of individuals scoring zero items correct. Such scores distort descriptions of performance and reduce the utility of assessment. More than a modest rate of zeros in a sample indicates floor effects or a lack of sensitivity in the measure’s ability to assess performance (Carta, Greenwood, Walker, & Buzhardt, 2010). With few zeros, a tool is more likely sensitive to growth and free of influential floor effects.
These characteristics can provide crucial standards to select a set of measures that can be used in research and practice coherently over time and can help address tricky dilemmas in “age 3 to Grade 3” interventions: how to assess the growth and effects of an intervention across time as the topography of academic responding changes and how to assess reading among students who are developing essential skills but unable to decode or perform other early reading tasks. With these standards, researchers can logically identify measures that would be appropriate samples of early literacy within and across grades, all related to important long-term outcomes. As this selection process continues, attention can turn to more careful analysis of sources of variance in promising individual measures—for instance, studies of differential performance of items and scale scores across groups or, when appropriate, item- and person-fit estimates more traditionally associated with item response theory (Wilson, 2005). Measures meeting these preliminary criteria might also be assessed for sensitivity and specificity in identifying individual children who, on the basis of external criteria, might be candidates for additional intervention (Burns, Haegele, & Peterson-Brown, 2014).
Research reported here was conducted as part of a larger effort to produce a system of early literacy and beginning reading assessment for preschool and early elementary school by identifying an aligned suite of procedures for assessment from early literacy through beginning reading (from age 3 to Grade 2) for children who are developing age-typical literacy and reading skills (Wallace et al., 2007). We collected a variety of measures, including GOMs and standardized tests, using a sample of typically developing children ranging from 3 years old to Grade 2. We applied our six standards to each measure within age groups and across ages to identify measures that demonstrate adequate quality within a particular age group and that predict performance at a later age. Specific questions that we addressed were as follows:
Question 1: What are the basic sample characteristics of early literacy and beginning reading measures within grades?
Question 2: To what extent do these measures demonstrate characteristics of GOMs across grades, including balanced SD and mean, normal skew and kurtosis, sensitivity to growth, temporal stability, and low percentage of zero scores?
Question 3: To what extent do these measures relate to one another?
We then summarized results to descriptively illustrate whether student performance across these measures suggests a sequence of development and evidence to support a model of seamless assessment of early literacy and reading over time.
Methods
Participants and Settings
Participants were drawn from an initial pool of 340 children between 3 years (36 months) and 8 years 10 months (106 months) of age. Sampling included classrooms that served typically developing students and those receiving special education; however, small numbers of special education students (n = 24), coupled with uneven distribution of these students across grades and a lack of detailed information regarding disability status, led to our dropping these children from current analyses. Beyond this, we did not limit participation on gender, SES, or ethnicity. However, we excluded nonnative English-speaking students, due to evidence of differential effects on language and literacy measures for this population (Lindsey, Manis, & Bailey, 2003). Results here are for a total sample of 316 children.
The sample was sorted into grade groups for analyses. For children enrolled in elementary schools, current grade assignment (K, 1, or 2) was recorded. For children in preschool settings, age in relation to statewide eligibility for K entry was used: Children who were age eligible to enroll in K in the following academic year were assigned PK4, and children eligible for K entry two academic years hence were assigned PK3. Table 1 presents demographic information by grade. The sample was primarily White/Caucasian (mean percentage across grades, 72%) and represented students who came from homes with parents with at least a high school diploma (mean percentage across grades, 92%). Of the total sample, an average of 11% of students received free and reduced-price lunch. These demographic data were collected by direct survey request to parents of preschool participants and from school district administrative data for K and Grade 1 and 2 participants.
Demographic Variables for Entire Sample by Sample, Sex, Free/Reduced-Price Lunch Status, Ethnicity, Parent Education by Grade

Note. Values presented as n (%) unless noted otherwise. F-RPL = free/reduced-price lunch; PK = prekindergarten (for PK3 and PK4, see Participants and Settings).
Measures
The early literacy and beginning reading assessment protocol included 11 measures (10 developed as GOMs and 1 standardized). We chose measures to assess language development, phonological awareness, letter identification and letter-sound correspondence, and reading. We used known measures representing one or more aspects of early literacy and demonstrating initial evidence of reliability and validity (e.g., NELP, 2009; Wayman et al., 2007).
Language development
IGDI Picture Naming (PN; Early Childhood Research Institute on Measuring Growth and Development [ECRI-MGD], 1998) is an individually administered 1-minute measure of expressive language for 3- to 6-year-olds. With 120 randomly ordered photos and drawings of everyday objects labeled in the lexicon of typical 5-year-olds, the administrator (a) described and demonstrated the task to the child, (b) asked the child to “name the pictures as quickly as you can,” and (c) showed the cards sequentially for 1 minute (for details, see http://www.myigdis.com). PN shows moderate to high alternate-form reliability and concurrent validity with established norm-referenced measures of preschool skills (ECRI-MGD, 2004; Priest, Davis, McConnell, McEvoy, & Shinn, 1999). Missall and McConnell (ECRI-MGD, 2004) found it to be sensitive to growing expressive language skills. The score is the number of pictures named correctly in 1 minute.
Alphabetic principle
DIBELS Letter Naming Fluency (LNF; Good et al., 2002) is an individually administered 1-minute task. The examiner showed the student upper- and lowercase letters, randomly ordered and arranged in rows, and then asked the child to name as many letters as possible. The student’s final score is the number of letters named correctly (Assessment Committee Analysis of Reading Assessment Measures [ACARAM], 2002; Good et al., 2002). LNF demonstrated high alternate-form reliability (ACARAM, 2002; Good et al., 2002) and high concurrent validity relations with the Woodcock-Johnson Psycho-Educational Battery Total Reading Cluster, Stanford Diagnostic Reading Test at Diagnostic Reading Assessment, and the Test of Early Reading Ability (ACARAM, 2002; Good et al., 2002; Rouse & Fantuzzo, 2006).
Minneapolis Kindergarten Beginning Assessment Letter Sounds, a standardized format developed locally and based on other reported measures (Research Evaluation and Assessment, 2004), was used to assess letter-sound correspondence. The administrator presented the child with a sheet containing 100 randomly ordered upper- and lowercase letters. The administrator stated, “I’m going to show you some letters and I want you to make the sound the letter makes.” The child’s score is the number of correct responses in 1 minute. Analysis of this measure during its development yielded 4-week test-retest reliability at .89 and evidence of moderately high internal consistency.
Phonological awareness
IGDI Rhyming is an individually administered 2-minute task in which children identify two rhyming words (a target stimulus and one of three distractors; ECRI-MGD, 2004). The test includes about 60 randomly ordered stimulus cards. Each card has four pictures: a target in the top row center and three below. The assessor labeled each picture and asked the child to identify the one in the bottom row that rhymed with the top one. Correct responses measure rhyme awareness (see http://www.myigdis.com). Rhyming scores are stable for 3 weeks and correlate with other measures of language and literacy development, including the Peabody Picture Vocabulary Test–Third Edition (PPVT-3; r = .56–.62), Concepts About Print (r = .54–.64; Clay, 1985), and the Test of Phonological Awareness (r = .44–62; Torgesen & Bryant, 1994; see also, ECRI-MGD, 2004; McConnell, McEvoy, & Priest, 2002; Missall 2002; Priest, Silberglitt, Hall, & Estrem, 2000).
IGDI Alliteration is an individually administered 2-minute task in which children identify two words (a target and one of three distractors) that share an initial sound (ECRI-MGD, 2004). The test includes approximately 60 randomly ordered stimulus cards, each containing four pictures: a target in the top row and three choices below. The assessor labels each picture and asks the child to identify the bottom one that begins with the same sound as the top one. Correct responses record a measure of alliteration. Alliteration scores are moderately stable over 3 weeks (ECRI-MGD, 2004) and correlate with other measures of language and early literacy, including the PPVT-3, Test of Phonological Awareness, and Concepts About Print.
IGDI Sound Blending (SB) is an individually administered 2-minute task in which children produce words after being presented with stimulus items segmented at the level of compound words (e.g., cow/boy), syllable (e.g., ta/ble), or phoneme (e.g., s/a/t). The student views about 30 segmented words. The number of correct blends produced served as the score. Limited analyses of psychometric properties of this task took place during initial development and testing, with analyses based on samples of 30 to 90 children. Test-retest over 2 weeks demonstrated moderate stability (.73). The measure also demonstrated moderate relations to individually administered measures of oral language development, including PPVT-3 and Concepts About Print.
DIBELS Phoneme Segmentation Fluency (PSF) is an early literacy measure of phonemic awareness measuring a child’s ability to segment simple words into single phonemes. The examiner speaks words with three to four phonemes and asks the student to state the individual phonemes in each word (e.g., the examiner says the word sat; the student says “/s/ /a/ /t/” to receive three possible points). The number of correct phonemes in 1 minute is the score. PSF alternate-form reliability ranges from .60 to .88 (ACARAM, 2002; Good et al., 2002), with moderate to strong relations to concurrent validity measures, including PSF in later grades, the Metropolitan Readiness Test, and the Stanford Diagnostic Reading Test (Good et al., 2002).
Beginning reading
DIBELS Nonsense Word Fluency (NWF) is an early literacy test of alphabetic principle and blending. To administer the test, an examiner shows the student a paper with randomly ordered vowel/consonant and consonant/vowel/consonant nonsense words. The administrator asks the student to vocalize individual sounds of each letter or read the whole nonsense word. For example, if the stimulus word is “rav,” the student could say /r/ /a/ /v/ or say the word “rav” to earn a score of 3. The score is the total number of correct letter sounds in 1 minute (Good et al., 2002). Alternate-form reliability has been tested through single- and multiprobe methods. Reliability coefficients range from .92 to .98 (ACARAM, 2002; Good et al., 2002). Predictive and concurrent validity has also been shown. NWF correlates with DIBELS PSF (.59; Good et al., 2002), and predictive validity indicates that NWF correlates with the Woodcock-Johnson Psycho-Educational Battery Total Reading Cluster score (.66) and Curriculum-Based Measurement–Oral Reading (CBM-OR; .82; ACARAM, 2002; Good et al., 2002). Concurrent validity coefficients with the Test of Early Reading Ability and Diagnostic Reading Assessment range from .35 to .62 (Rouse & Fantuzzo, 2006).
Dolch Word List includes 220 high-frequency words published by Edward Dolch in 1948. For this study, the administrator showed the first 50 words of the list on a sheet of paper to students and asked them to read the words as quickly and correctly as they could. The administrator told students to go on to the next word if they did not know a word. Words read correctly were recorded for a 1 minute. We located no empirical evaluation of reliability and validity for the Dolch Word List but included it due to the frequency with which investigators use the list (e.g., Bliss, Skinner, & Adams, 2006; Reifman, Pascarella, & Larson, 1981).
CBM-OR is an assessment of reading accuracy and fluency with connected text. Students receive a series of passages taken from standardized publications or grade-level curricula. Passages are calibrated by grade level. Student performance is measured as students read the passages aloud for 1 minute. Omitted or substituted words and hesitations >3 seconds are counted as errors. After students read the passages, the median score of words read correctly becomes the oral reading fluency rate (Deno et al., 1982). We obtained the passages with permission from Vanderbilt University courtesy of Dr. Lynn Fuchs (see Wallace et al., 2007). Test-retest reliability ranges from .92 to .97 and alternate-form reliability from .89 to .94 (Deno et al., 1982; Tindal, Marston, & Deno, 1983). Eight separate studies reporting coefficients from .52 to .91 established criterion validity (Good & Jefferson, 1998; Marston & Magnusson, 1988; Ysseldyke et al., 1983).
Standardized measure
Woodcock-Johnson Test of Achievement–III (Woodcock, McGrew, & Mathers, 2002) is an individually administered norm-referenced test to assess reading, oral language, mathematics, written language, and academic knowledge. We used only the Letter-Word Identification (LWI) subtest, a test of basic literacy skills involving symbolic learning and identifying isolated letters and words. The child identifies letters that are in large type and reads the words correctly. Items are set in difficulty order, with the easiest first and the most difficult last. Testing stops when the student scores zero on six successive items (Woodcock et al., 2002).
Procedures
After receiving parental consent, we tested students on some or all of the 11 measures, based on likely performance by grade. Preschoolers completed all measures except CBM-OR. First and second graders did not complete IGDI Alliteration or Letter Naming (LN), due to evidence of significant ceiling effects in prior pilot testing. Each test was administered in two individual sessions 12 weeks apart. Trained graduate research assistants assessed the participants in or immediately outside the classroom.
Design and Data Analysis
To answer Question 1—What are the basic sample characteristics of early literacy and beginning reading measures within grades?—we examined mean, median, range, skew, kurtosis and normality of each measure within each grade group.
For Question 2—To what extent do these measures demonstrate characteristics of GOMs across grades, including balanced SD and mean, normal skew and kurtosis, sensitivity to growth, temporal stability, and low percentage of zero scores?—we evaluated each measure collected for each grade against our proposed six psychometric standards to determine use as an acceptable GOM. First, we calculated a ratio of the SD to sample mean by grade, and we identified those instances where the SD was <50% of the sample mean. Next, we evaluated measures by grade where skew and kurtosis were each less than an absolute value of 1. We also noted those measures where <20% of a sample failed to obtain a single correct response. We modeled stability over time by calculating test-retest reliability. Sensitivity to growth was determined by significant within-subject differences from Time 1 to Time 2 as well as slopes >1. Effect sizes for differences between Time 1 and Time 2 are reported, with p values reported for testing across-time differences and nonzero slope. To summarize analyses, we calculated the number of psychometric standards met by grade group, with a heuristic criterion that defined measures as “acceptable” for a particular grade if they met four of six psychometric standards.
To answer the third question—To what extent do these measures relate to one another?—we examined concurrent correlations across measures collected at Time 1. To evaluate our final point—Does student performance across these measures suggest a sequence of development and a model for a “seamless” system of assessment over time?—we examined mean, median, range, skew, kurtosis, and normality of each measure across grade groups to ascertain the extent to which measures aligned seamlessly over time.
Results
Sample and Psychometric Characteristics
Table 2 presents descriptive statistics, including means and SDs for all measures. Table 3 presents results of comparisons to the six GOM standards. Assumptions regarding normality, outliers, linearity, and homogeneity of variance were not violated for any measure.
Early Literacy Measure by Grade Descriptive Statistics
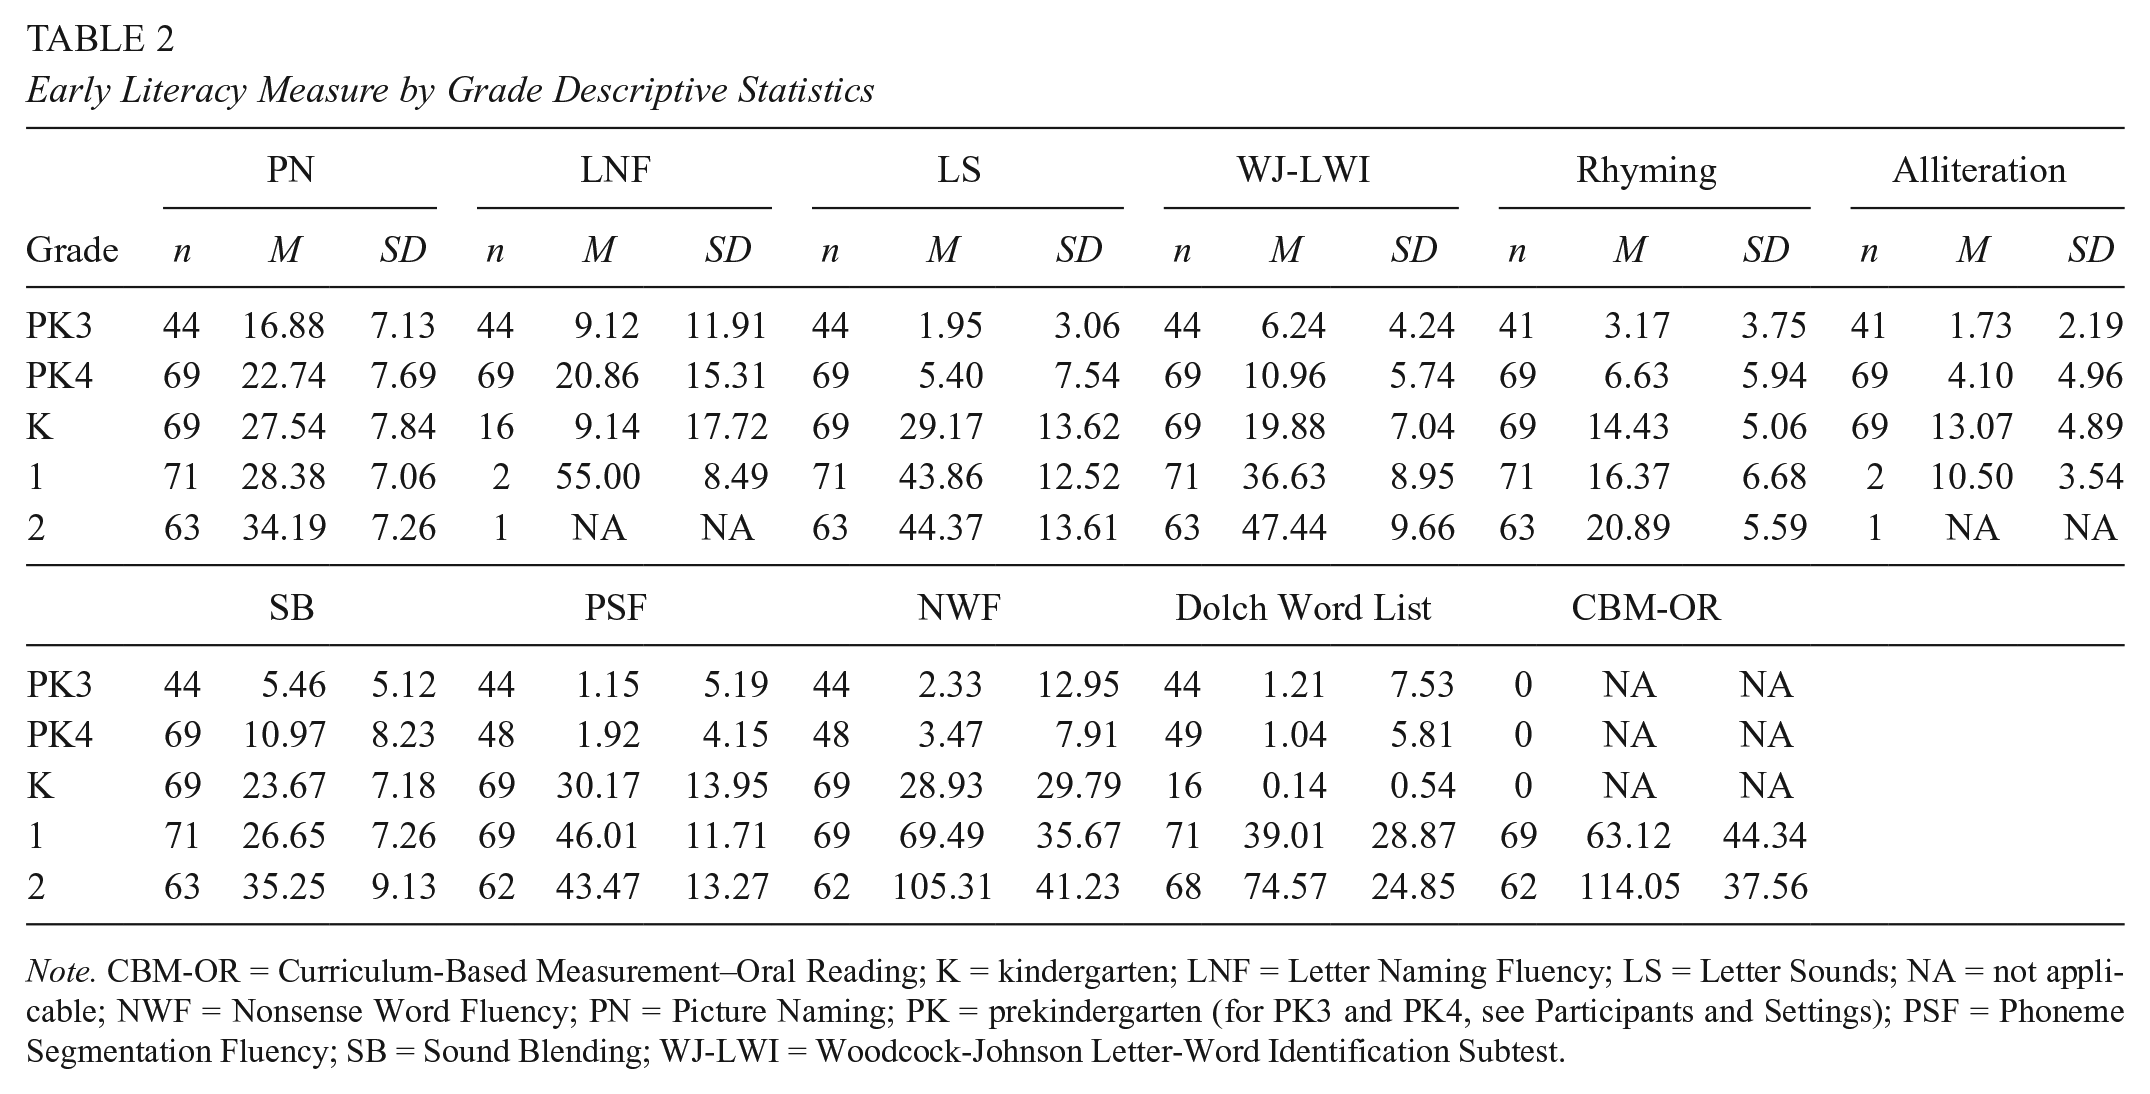
Note. CBM-OR = Curriculum-Based Measurement–Oral Reading; K = kindergarten; LNF = Letter Naming Fluency; LS = Letter Sounds; NA = not applicable; NWF = Nonsense Word Fluency; PN = Picture Naming; PK = prekindergarten (for PK3 and PK4, see Participants and Settings); PSF = Phoneme Segmentation Fluency; SB = Sound Blending; WJ-LWI = Woodcock-Johnson Letter-Word Identification Subtest.
Analysis of General Outcome Measure Characteristics by Measure: Time 1

Note. Bold indicates those values meeting the general outcome measure criteria. Time 1 and Time 2 scores were used to evaluate the effect size (partial η2) of the slope and reliability. Differences between the slope and zero as well as differences between Time 1 and Time 2 were used to examine probability value, as indicated by asterisks. Maximum over time was evaluated with repeated measures analysis of variance, within-subjects effect. NA = not applicable; PK = prekindergarten (for PK3 and PK4, see Participants and Settings).
Minimum for all measures included observed zero scores.
p < .05. **p < .01. ***p < .001.
Language development
In general, distributions were relatively normal, with acceptable skew and kurtosis. PN slopes differed significantly from zero (with significant difference in performance between Time 1 and Time 2) for PK4, K, and Grade 1. Reliability estimates were low-moderate to moderate. PN met five of six standards for PK3, PK4, K, and Grade 1 and four of six standards for Grade 2.
Alphabetic principle
LNF, Letter Sound Fluency (LSF), and LWI measured alphabetical principle. LNF distributions varied somewhat from desired characteristics, with SDs (particularly for PK3 and PK4) ranging from 0.74 to 1.94 of the sample mean and with skew and kurtosis substantially above standards for two of three assessed grades. Change over time was detected at all three grades. Test-retest reliability was in the range of high-moderate to high. LNF met all six quality standards for K, five of six for PK4, and two of six for PK3.
Measures of distributions for LSF also showed variation from desired standards. Change over time was noted for three grades (PK4, K, and Grade 2); temporal stability met standards for four of five grades (all but PK3). LSF met all six standards for K and five standards for Grades 1 and 2. In PK4, LSF met only the standard for sensitivity to growth; in PK3, this measure met only the criterion for reliability.
LWI met all six standards for Grade 1, five standards for Grade 2, four standards for K, and three of six for PK3 and PK4.
Phonological awareness
Rhyming
For Rhyming, distributions were within standards for K and Grades 1 and 2, with SDs varying from 0.27 to 1.18 of the sample mean across all five grades. Sensitivity to growth was detected at all grades, and skew and kurtosis estimates ranged from |0.12| to |2.15|; skew met our a priori standard (<|1|) for all five grades, and kurtosis met this standard in three. Test-retest reliability was in the high-moderate range for all grades, although this estimate did not meet a priori standard for Grade 2. A large proportion of PK3 and PK4 children scored zero. Rhyming met all six standards for Grade 1; five for K; and four for Grade 2, PK3, and PK4. It demonstrated SD values >50% of the mean and a high percentage of zero scores for PK3 and PK4 while obtaining lower reliability (.57) and a large kurtosis for Grade 2.
Alliteration
Only PK3, PK4, and K students took the Alliteration test. In general, SDs exceeded standards when compared with means for PK3 and PK4 participants. Distributions had significant skew for PK4 students and met standard for PK3 and K. Sensitivity to growth improved by grade, and temporal reliability was low to moderate. The measure met five standards in K (with only kurtosis outside standard levels), three standards in PK4, and two standards in PK3.
Sound Blending
SB met half or more a priori standards for all grades. All distributions met standards for relations between mean and SD, and all but K students met standards for skew and kurtosis. Other than PK3 students, where 22% of the sample scored zero, almost all students scored above zero. Slope and differences between Times 1 and 2 were different from zero for PK4, K, and Grade 1 students. Five standards were met for K, Grade 1, and PK4.
Phoneme Segmentation Fluency
For PSF, the relative size of SDs varied across grades, with ratios meeting the a priori standard in only K in only K and Grades 1 and 2 meeting standard. Skew and kurtosis varied similarly, with values at K and Grades 1 and 2. Sensitivity to growth was detected at PK4 and K. Growth was also detected at Grade 2 to be significantly different from zero, however in a negative direction (slope, –0.43). PSF met five of six standards for K and four standards for Grades 1 and 2, with data at Grades 1 and 2 not meeting standards for sensitivity to growth or reliability. PK4 met one standard, sensitivity to growth, while PK3 met none of the six.
Beginning reading
Nonsense Word Fluency
Characteristics of sample distributions for NWF varied across grades. Skewness and kurtosis exceeded |2.3| for PK3, PK4, and K and were close to or below |1| for Grades 1 and 2. Sensitivity to growth was detected only during PK4, K, and Grade 1. Test-retest reliability was moderate to high across all grades. Half or more of PK3 and PK4 students scored zero on this measure, but much smaller percentages of zero scores were found in K and Grades 1 and 2. NWF met five standards in Grade 2, four standards for K and Grade 1, two standards for PK4, and one standard for PK3.
Dolch Word List
SD ratios to sample means ranged from 3.86 to 6.22, and skewness and kurtosis estimates exceeded |3.74| for PK3, PK4, and K students. SD-to-mean ratios were .33 to .74 and skewness or kurtosis estimates were close to or below |1| for Grades 1 and 2. Sensitivity to growth was only detected in Grade 1; test-retest reliability was moderate to high across all grades except PK4, and 62% to 87% of PK3, PK4, and K students scored zero. Dolch met five standards for Grade 1, four standards for Grade 2, one standard for PK3 and K, and none for PK4 students.
Curriculum-Based Measure–Oral Reading
Only Grades 1 and 2 took the CBM-OR test. Relations between means and SDs met standard; kurtosis was close to zero in both grades; and skew met standards for both grades. Test-retest reliability estimates exceeded .85, and no students had a zero score. CBM-OR was sensitive to growth over time for both grades. CBM-OR for Grade 2 met all six standards, and Grade 1 met five standards.
Summary across measures for each grade
Table 4 summarizes GOM standards met for each measure at each grade. We noted some variability across measures and grade groups, with evidence of a developmental trend: When variability in number of standards existed, the number of standards met generally increased with grade. Two measures, PN and Rhyming, met four or more standards across all grades. Several measures functioned well in one or more, but not all, groups, and each measure failed to meet at least one standard in one or more grade groups. Only PN met five standards for PK3; three measures (PN, SB, and LNF) met five standards for PK4. In K, five measures met five standards, and two (LSF and LNF) met all six. All measures met at least four standards for Grade 1, with two meeting all six (LWI and Rhyming). Finally, four measures met at least five standards for Grade 2.
Number of General Outcome Measure Standards Met by Measure and Grade Group
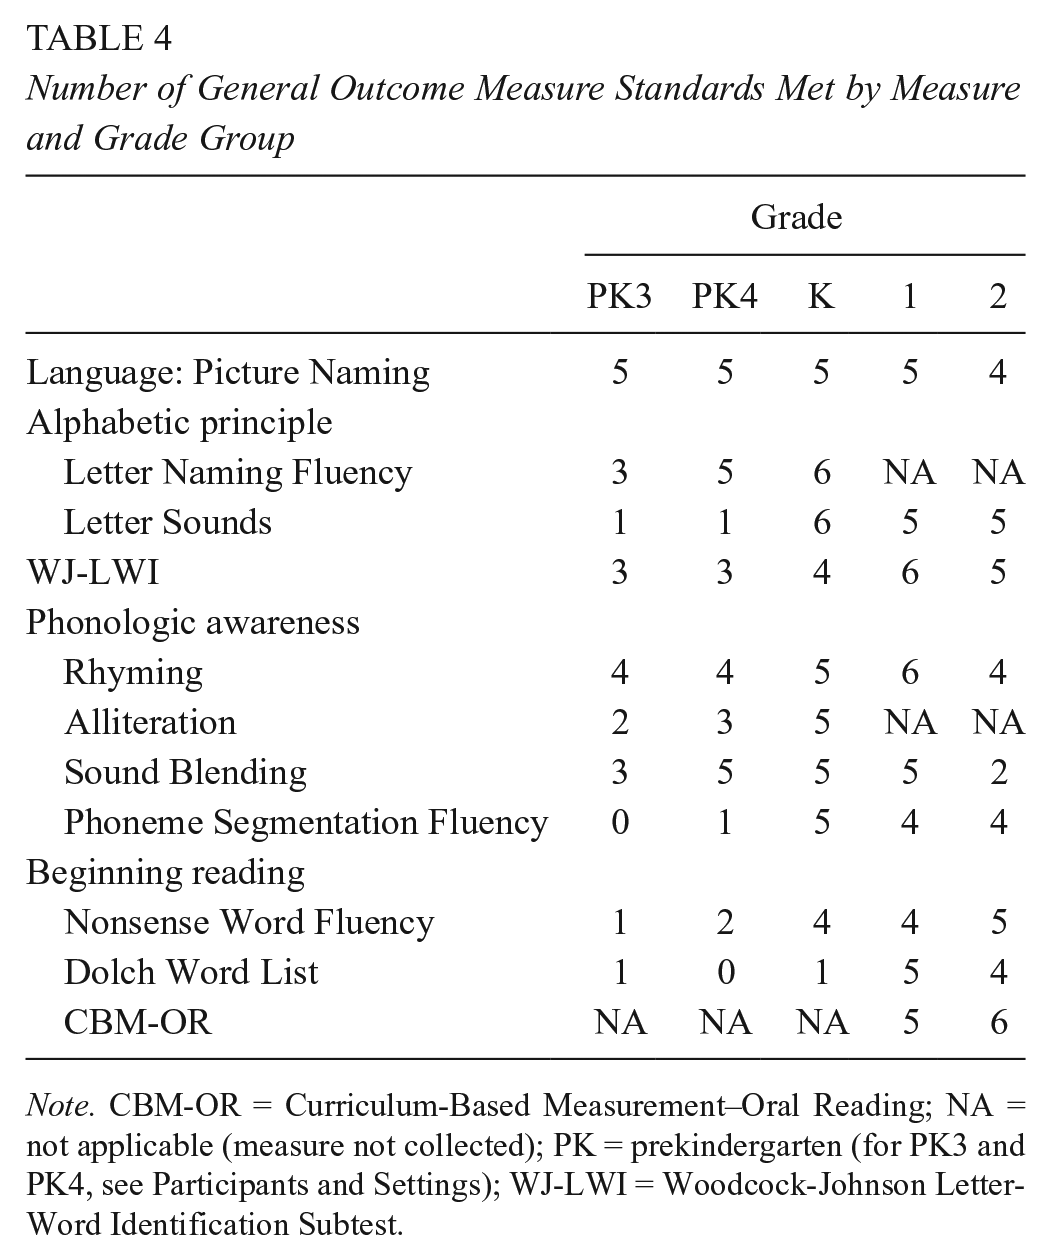
Note. CBM-OR = Curriculum-Based Measurement–Oral Reading; NA = not applicable (measure not collected); PK = prekindergarten (for PK3 and PK4, see Participants and Settings); WJ-LWI = Woodcock-Johnson Letter-Word Identification Subtest.
Relations Among Measures
To examine relations among measures, we computed Pearson correlations during Time 1 (see Table 5). 3 In general across 53 unique bivariate coefficients, relations were positive and moderate to strong, with one negative coefficient, six correlations <.40, and 36 correlations (or 68% of all coefficients) ≥.60. Relations were generally strong for measures from common elements of early literacy, with coefficients ≥.82 for LN and sounds, .70 to .81 for early childhood phonological awareness measures, and .79 to .87 for reading sight or nonsense words in isolation (Dolch and NWF) as well as reading connected text (CBM-OR). Correlations across these common elements were more variable; notably, PN (putatively, a measure of vocabulary and language development) showed moderate to moderate-strong relations across all other measures except CBM-OR.
Correlation Matrix Between and Among Measures at Time 1 Across Grade Levels: PK3 to Grade 2

Note. CBM-OR = Curriculum-Based Measurement–Oral Reading; LNF = Letter Naming Fluency; LS = Letter Sounds; NA = not applicable; NWF = Nonsense Word Fluency; PN = Picture Naming; PK = prekindergarten (for PK3, see Participants and Settings); PSF = Phoneme Segmentation Fluency; SB = Sound Blending; WJ-LWI = Woodcock-Johnson Letter-Word Identification Subtest.
p < .05. **p < .01. ***p < .001.
Discussion
This study’s aim was to assess the extent to which each of 10 measures of early literacy met standards associated with GOMs to be used across grades, to identify measures for preschool through early elementary school to assess children’s development of early literacy. The broad intent is for findings that will guide future research on assessment and intervention evaluation and modification. Using a descriptive approach, we evaluated measures at each grade from PK3 to Grade 2 against six standards for GOMs: SDs <50% of sample means, skew and kurtosis less than absolute values of 1.0, sensitivity to growth over 12 weeks, short-term test-retest reliability exceeding .60, and <20% zero scores. Results indicated variation across measures and grades in meeting heuristic standards of acceptability for GOMs within and across grades. Across grades and potential GOMs, results indicate that three measures (PN, Rhyming, and CBM-OR) met at least four standards across all grades tested, with PN and Rhyming meeting at least four of six GOM standards across all grades from preschool through early elementary school. Several other measures showed some promise for cross-grade application, particularly phonological awareness measures (i.e., Rhyming and SB).
Results suggest that several measures might be used across three or more grades. This was particularly true for K to Grades 1 and 2: Six measures (PN, LSF, NWF, Woodcock-Johnson Test of Achievement–III, Rhyming, and PSF) met four or more standards for all three early elementary grades. Similarly, three measures met four or more standards for the transition from preschool to elementary school (i.e., PK4 to Grade 1). Results for LNF and LSF were intriguing but not definitive. Future research might evaluate the utility of these measures, individually or collectively, for continuous assessment of students from PK4 to Grade 1.
Implications for Research and Practice
These results have implications for ongoing research on GOMs, as well as early intervention to promote long-term reading proficiency. For research, when considered with analyses of longitudinal relations of preschool and early elementary measures (Missall et al., 2007) and analyses of reading measures for elementary and secondary students (Wayman et al., 2007) as well as burgeoning work evaluating long-term effects of early childhood services (e.g., Burchinal, Vandergrift, Pianta, & Mashburn, 2010; Lonigan et al., 2015), these results support efforts to develop an integrated, seamless assessment system of children’s paths toward proficient reading starting in preschool. Central to such a system would be measures to mark progress within and across service delivery boundaries (e.g., preschool; preschool to K; K to Grades 1 and 2). This assessment of child progress within and across boundaries on a set of measures available to researchers and practitioners creates a stronger conceptual and empirical basis for asserting that intervention in one setting, focused on potentially different topographies of child behavior and using different curricular and instructional procedures, will produce effects on child performance in a subsequent setting and a seemingly different class of behaviors (cf. Fuchs & Deno, 1991). It also positions research findings to more rapidly transfer to implementation in practice settings through the use of common measures (Bijou, Peterson, & Ault, 1968).
At a minimum, such a system would require that (a) measures collected in an earlier setting be highly related to measures in subsequent settings and (b) measures collected in both settings be highly related to socially valid (and typically distal) general outcomes (cf. Deno, 1997; Fuchs & Deno, 1991). Results presented here suggest several measures that may meet these standards across some settings or grades. In particular, PN and Rhyming met many of the identified standards for GOMs for three or more adjacent grade groups covering preschool and early elementary (K) grades. While results indicate that some refinement or improvement of individual measures might be needed at particular grades (for instance, SB and PN for PK3), it is likely warranted to assess the function and growth trajectory of these measures in future longitudinal research.
These results offer some initial evidence and basis for considering further integration of existing theoretical models of early literacy and beginning reading. At present, theoretical models of early literacy (NELP, 2009; Sénéchal et al., 2001; Whitehurst & Lonigan, 1998) and beginning reading (Adams, 1990; Hoover & Gough, 1990) are likely to be complementary, but little attention has been given to explicit analysis of their relations and points of connection and distinction. Such an analysis will help clarify theoretically and practically important issues, such as whether some individual measure adequately indicates development or whether one or several domain-referenced measures collectively serve as broad indicators of early literacy development.
Large-scale curricular practices and educational policy also affect this issue: If the explicit skills associated with reading are introduced formally at a particular time and if there is little interest in acquiring these skills before then, acquisition might appear to be grade-related when, in fact, it is not. Such may be the case in contemporary policy and practice in early literacy: As we adjust and change our expectations about what to teach to younger children, we may reasonably expect to see changes in “normative” performance on tasks that were previously taught in later grades. If this is true, what constitutes age-appropriate early literacy and reading development may soon change.
Finally, from an applied perspective, practitioners may benefit from understanding these relations between measures (and, perhaps, skills) within and across grades when choosing and aligning assessment and intervention. With empirical information on the utility of GOMs in hand, teachers can make educated decisions about how long and to what degree each measure will be useful in data-based decision making and intervention.
Limitations
As with any investigation, several limitations of the current study should be noted. First, while grade-level samples ranged from 44 to 73 children and included some degree of variability in ethnic, economic, and parental education measures, variation in children, classrooms, and curricular offerings is necessarily limited. Such is particularly the case for students with disabilities and those who might benefit from supplemental or more intensive intervention, as provided in multitiered systems of support. These tiered intervention programs are increasingly prevalent in educational settings, and these systems frequently use measures like those studied here (Fuchs & Fuchs, 2007; Greenwood, Carta, & McConnell, 2011). Expanding investigations for relations in performance above and below standards for supplemental intervention and for children who perform significantly below grade-level expectations will yield important findings. Similarly, the sample presented in this study is limited in ethnic diversity and risk status variables, such as parent level of education and free and reduced-price lunch. Given the homogenous nature of the students and families included in this study, future research should continue to evaluate systematic approaches for evaluating a seamless collection of measures to measure the transition to reading with more diverse samples.
Measurement of educational achievement is a dynamic, fast-developing area of research. Continued evolution and development of measures like those included here (e.g., Christ & Nelson, 2014; McConnell, Wackerle-Hollman, & Bradfield, 2014) will likely improve estimates and operations across time and grades but will also necessitate new analysis of relations and applications. As measures and interventions continue to improve, research like this will need to be refined and revisited.
These results also do not answer another pressing issue in current GOM research and development: To what extent should GOMs be robust and comprehensive versus specific and sensitive? More comprehensive measures, such as CBM-OR, likely sample a variety of child skills (e.g., letter-sound correspondence, blending, prosody, fluency, text comprehension) and are apt to show growth over longer periods. Other measures, such as Rhyming or PSF, sample a narrower band of child behaviors. While narrower measures may assess a theoretically important part of a larger skill (i.e., reading) and while a more specific assessment may lend itself to greater sensitivity within samples or across time, there could be negative consequences in relation to longer-term or, more general outcomes (Deno, 1997; Paris, 2005). As measures become too specific and narrow, they may lose utility as GOMs and affect efforts to assess child progress and allocate intervention resources in ways that produce long-term benefit (Fuchs & Fuchs, 2007). This tension between generality and specificity will likely continue to vex researchers and practitioners, and it may be an important area for continued theoretical and empirical analysis.
Theoretical advances in recent decades and ongoing research articulating literacy from early childhood through elementary education lay foundations for significant gains in equity and excellence in reading and literacy outcomes. This scholarship represents ongoing efforts to build a practical, contemporary model of early literacy assessment for children in later preschool and early elementary school. This work, along with ongoing research on related and more basic topics, is likely to continue informing research, policy, and practice.
Footnotes
Acknowledgements
The opinions expressed in this article are those of the authors and imply no official endorsement by the funding agency. We thank Dr. Kevin McGrew for permission to reproduce portions of the Woodcock-Johnson III Letter Word Identification protocol; Dr. Lynn Fuchs for graciously sharing measures used in her group’s prior research; graduate research assistants and staff from the Research Institute on Progress Monitoring and the Center for Early Education and Development at the University of Minnesota for assisting with data collection; and coinvestigators from Research Institute on Progress Monitoring. We also thank Drs. Teri Wallace, Chris Espin, Stan Deno, and Kristen McMaster for comments on earlier versions of this report. Drs. Scott R. McConnell and Alisha Wackerle-Hollman have developed assessment tools and related resources known as Individual Growth & Development Indicators and Get it, Got it, Go! This intellectual property is the subject of technology commercialization by the University of Minnesota, and portions have been licensed to Early Learning Labs, Inc. McConnell has equity interest in Early Learning Labs, Inc., a company that may commercially benefit from the results of this research. The University of Minnesota also has equity and royalty interests in Early Learning Labs, Inc., which may in turn benefit McConnell and Wackerle-Hollman. These relationships have been reviewed and are being managed by the University of Minnesota in accordance with its conflict-of-interest policies.
Notes
Authors
SCOTT MCCONNELL is professor of educational psychology and child psychology at the University of Minnesota, Room 351 Education Sciences Building (Mail Stop 4101A), 56 E River Parkway, Minneapolis, MN 55455. His research focuses on assessment and intervention of language and early literacy development, particularly for children with one or more developmental risk factors.
ALISHA WACKERLE-HOLLMAN is senior research associate in the Department of Educational Psychology at the University of Minnesota. Her research focuses on assessment of language and early literacy development of English- and Spanish-speaking students, as well development and evaluation of parent education programs for young families.