
Abstract
Identifying which early mathematics skills have the largest effects on later mathematics achievement has important implications. However, regression-based estimates often rely on untested assumptions: (a) Scores on different mathematics skills reflect unique constructs, and (b) other factors affecting early and later mathematics achievement are fully controlled. We illustrate a process to test these assumptions with a sample of third and fourth graders who completed measures of mathematics skills, working memory and motivation, and standardized mathematics and English language arts tests. Factor analyses indicated that mathematics skills largely reflect the same underlying construct. The skills that loaded highest on the general factor most predicted both later mathematics and English language arts, even after adjusting for working memory and motivation. Findings suggest that relations between earlier mathematics and later achievement largely reflected more general factors that contribute to children’s learning. We discuss the importance of establishing construct validity in correlational studies.
How long should a unit on counting last? To what extent should children be required to master relevant concepts before learning a mathematical procedure? Understanding which skills to teach, how long to spend on each skill, and what order to sequence instruction of a set of skills are important goals for designers of mathematics curricula. Children’s mathematical development is often described as a hierarchical process, during which later skills build on earlier skills (Gagné, 1968), with some earlier skills reasoned to be particularly foundational for children’s later mathematics learning. Identifying these important early skills and structuring mathematics curricula around them may be an effective way to boost children’s later mathematics learning. Questions about which specific math skills are most critical are often addressed through a combination of experimental studies and correlational research based on observational data. Although correlational research lacks some logistical problems associated with experimental research, its utility for making causal inferences about the likely effects of interventions relies on important, often untested assumptions, such as the hypothesis that individual differences in different early mathematical skills reflect variation in truly unique constructs. This study provides an illustration of the problem of construct confounding and tests these assumptions through a data set of students’ mathematics skills and achievement scores in mathematics and English language arts (ELA).
Previous Methods for Understanding Effective Mathematics Curricula
Randomized controlled trials
Educators and researchers can use several approaches to understand which early mathematics skills are most foundational for supporting later mathematics learning. One method is identifying these skills through a theory-driven approach (Clements & Sarama, 2004). For example, simple addition is a subroutine of many more advanced skills, so memorizing simple addition facts may lay the groundwork to support children’s ability to learn more advanced mathematical skills. However, this theory-driven approach is not simple: the educator or researcher must consider a complex set of variables, including the extent to which earlier knowledge will be repurposed into later skills, what types of knowledge facilitate transfer of learning most effectively, and the opportunity cost of spending more time teaching a particular skill. This approach can generate predictions about which skills are likely to have the largest effects on later mathematics achievement, and these predictions can be formally tested in experiments. The strongest causal claims can come from randomized controlled trials (RCTs) that allow researchers to eliminate confounds influencing children’s learning of early and later mathematics. In these studies, children in the experimental group receive a particular type of skill training (e.g., instruction on fraction concepts; Fuchs et al., 2013) or curriculum (Clements, Sarama, Spitler, Lange, & Wolfe, 2011; Clements, Sarama, Wolfe, & Spitler, 2013), and children in the control group receive “business as usual.” Unfortunately, these studies are expensive and time-consuming. Even if schools are willing to participate, imperfect fidelity of implementation is common and threatens researchers’ ability to make claims about which intervention component caused an observed effect. Furthermore, researchers face a tradeoff between the number of changes that they make to the curriculum and the degree of confidence that any particular change is responsible for an observed treatment effect.
Correlational studies
Correlational data analyses provide a less costly alternative to such experiments but suffer from more potential threats to internal validity. Such studies use observational data with rigorous statistical methods to obtain what researchers hope are close approximations to unbiased causal estimates of the effect of improving a particular early mathematics skill on children’s later mathematics outcomes. This commonly involves regressing later mathematics achievement on earlier mathematics skills while statistically controlling for factors that might affect both, such as domain-general cognitive skills, socioeconomic status, and sex. The clear advantage of this approach is that it can address a large number of causal questions—many of which would not warrant their own RCT—through a single data set, often with a large sample. Because of this approach’s apparent ability to isolate specific early mathematics skills, this method is increasingly used to bolster arguments about the importance of early childhood interventions and what aspects of such interventions are most likely to yield the greatest effects on later mathematics achievement (see Aunio & Niemivirta, 2010; Aunola, Leskinen, Lerkkanen, & Nurmi, 2004; Bailey, Siegler, & Geary, 2014; Claessens & Engel, 2013; Duncan et al., 2007; Geary, Hoard, Nugent, & Bailey, 2013; Jordan, Kaplan, Ramineni, & Locuniak, 2009; Watts, Duncan, Siegler, & Davis-Kean, 2014).
Researchers often avoid causal language in the Results sections of such studies. However, Discussion sections often contain claims relating findings of correlational research to educational practice and policy as if such findings indicated causal effects. Others have noted that this practice is common in developmental and educational psychology studies (Duncan & Gibson-Davis, 2006; Foster, 2010; Robinson, Levin, Schraw, Patall, & Hunt, 2013). It is not our goal to chide previous researchers, who aim to improve educational practice while hedging their conclusions: Indeed, we have included such statements in our own prior work (e.g., Bailey, Siegler, et al., 2014, p. 783). The point that we put forth is that the extent to which this is problematic and the practical usefulness of these correlational findings depend partially on how much (if at all) estimates from correlational studies differ from actual causal effects.
Many correlational studies distinguish among early mathematics skills that are hypothesized to influence later mathematics achievement, such as less advanced and more advanced early mathematics skills (Claessens & Engel, 2013), early counting and relational skills (Aunio & Niemivirta, 2010), or early whole number magnitude and whole number arithmetic knowledge (Bailey, Siegler, et al., 2014). These studies focus on identifying the most predictive of these early mathematics skills for later achievement. Such identification is intended to further understanding of children’s mathematical development and is sometimes used in recommendations for educational practice: for example, recommendations that teachers focus on those early skills that show the greatest association with later achievement.
Perhaps these studies are able to fully control for the range of factors influencing mathematical learning throughout development, in which case, estimates of specific skills’ effects on later mathematics achievement are unbiased. However, this assumption is difficult to test and requires adequate measures of general factors related to children’s learning (e.g., working memory) and specific mathematics skills. If one wishes to estimate the effect of targeting a specific mathematics skill on children’s later achievement without influencing more general skills, one must demonstrate that measures of early mathematics skills have predictive and discriminant validity. For instance, specific mathematics skills should predict later mathematics outcomes much more strongly than they predict later reading outcomes, indicating that domain-general skills are fully controlled. In addition, specific mathematics skills should predict performance on more similar mathematical content more strongly than performance on measures of less similar mathematical content, indicating that specific mathematics skills are measurably distinct.
The validity of conclusions from correlational studies relies on an assumption that is difficult to test: that the factors contributing to children’s learning of early and later mathematics are fully statistically controlled. Failing to do so would lead researchers to overestimate the effects of earlier mathematics skills on later mathematics achievement. As such, correlational studies imply that increasing children’s early mathematics achievement should have a stable effect on their later mathematics achievement over time (Bailey, Watts, Littlefield, & Geary, 2014). Yet, findings from RCTs of early childhood interventions show diminishing treatment effects, a pattern known as fade-out (e.g., Leak et al., 2010).
Construct Validity of Measures of Early Mathematics Skills
Construct validity—the extent to which what a test measures is aligned with the claims that the researcher makes about that test—is of primary importance in understanding whether the claims drawn from studies are of actual use (see Borsboom, Mellenbergh, & van Heerden, 2004; Cronbach & Meehl, 1955). We posit that construct validity is a particularly relevant concept for understanding the associations between early mathematics skills and later mathematics achievement. On one hand, there is a sense in which tests of children’s mathematics skills have excellent construct validity: individual differences in early mathematics skills exist, and it is clear how children’s mathematical knowledge would affect performance on tests of these skills. For example, a child who has an accurate mental representation of the number 30 should be able to place that number on a number line with end points 0 and 100, a performance that one can reasonably assume is caused by the child’s mental representation of the number 30; such tasks have been singled out by theorists as having high construct validity (e.g., Borsboom et al., 2004).
On the other hand, knowledge that produces item responses on tests of mathematics skills is likely influenced by a long list of factors. For example, a child who can accurately place 30 on a number line may have paid more attention in class or thought more about mathematics outside of class than a child who cannot accurately complete the task. Indeed, several facets of working memory are robust predictors of children’s mathematics achievement across development (Bull & Lee, 2014; Geary, Bailey, Littlefield, et al., 2009; Swanson & Beebe-Frankenberger, 2004; Szücs, Devine, Soltesz, Nobes, & Gabriel, 2014; Welsh, Nix, Blair, Bierman, & Nelson, 2010). Therefore, even if a test incontrovertibly measures a particular mathematics skill, differences in scores may also reflect individual differences in more general cognitive abilities, which may contribute to children’s mathematics learning later in school. If these other more general abilities are not adequately statistically controlled, regression analyses may overestimate the causal effects of these particular mathematics skills on children’s later mathematics achievement and may misattribute the observed relationship as being associated with differences in scores on a particular mathematics skill instead of the more general ability. We refer to this possibility as construct confounding, following Shadish, Cook, and Campbell (2002).
There are reasons to think that construct confounding may lead to biased estimates of the effects of increasing early mathematics skills on later mathematics achievement. First, researchers tend to assume that a multiskill factor structure of mathematics exists, as many studies do not establish a measurement model for their mathematics skills (e.g., Siegler et al., 2012), but the evidence for this is unclear. Schneider and Stern (2010) did not find evidence that procedural and conceptual knowledge of decimal fractions were unique constructs despite clear theoretical reasons to believe so (Rittle-Johnson, Siegler, & Alibali, 2001). Those who found evidence of a multifactor structure of mathematics skills found it between measures of symbolic and nonsymbolic representations of number (Fazio, Bailey, Thompson, & Siegler, 2014), between counting competence and number system knowledge (Geary et al., 2013), and between magnitude comparison and number identification (Göbel, Watson, Lervåg, & Hulme, 2014). However, in each of these cases, it remains unclear if the methods with which different facets of mathematics knowledge were measured (e.g., via computer or paper and pencil) were responsible for the appearance of a multifactor structure or if the multifactor structure was in fact due to the nature of the constructs being measured. A notable exception is a study by Purpura and Lonigan (2013), which identified evidence for a three-factor model of informal numeracy skills (numbering, relations, and arithmetic operations) in a sample of preschool children tested on a large battery of mathematical tasks. Although the three-factor model best accounted for correlations among early mathematics skills, correlations between factors ranged from .80 to .88. Correlations among factors this close to unity may reflect differences in content knowledge but may also reflect small differences in the relative importance of various more general skills on children’s mathematics learning. Purpura and Lonigan did not include a measure of later mathematics achievement, so it is unclear whether these distinct skills differentially predict later mathematics achievement.
A second reason why we hypothesize that construct confounding inflates the estimated effects is that the rank order of how early mathematics skills predict later mathematics achievement is often found to be similar to the rank order of mathematics skills as predictors of reading achievement and different types of mathematics achievement (Bailey, Siegler, et al., 2014; Siegler et al., 2012). If regression coefficients approximate the likely causal effects of increasing an early mathematics skill on later academic outcomes, one would predict that early mathematics skills should most strongly predict the later skills that they are most likely to causally affect. Theoretically, whole number arithmetic knowledge should predict later fraction arithmetic knowledge because the former is essential to the latter. If it predicts later knowledge of shapes or reading achievement to a similar extent, construct confounding is a possible explanation: Relations among whole number arithmetic knowledge, fraction arithmetic knowledge, knowledge of shapes, and reading achievement may be caused by a general factor influencing learning of all these types of knowledge. Indeed, previous studies found this pattern. For example, measures of conceptual understanding of whole number magnitudes taken in middle childhood have been found to predict similarly to different measures of mathematics and reading outcomes (Bailey, Siegler, et al., 2014; Jordan et al., 2013). In two large, nationally representative samples, earlier measures of mathematics skills predicted later mathematics outcomes and, in some cases, later reading outcomes (although the magnitudes of the coefficients from prior mathematics skills to later reading were smaller; Siegler et al., 2012). Likewise, replicated over six nationally representative samples, measures of early mathematics achievement were predictive of later reading achievement even when including controls for cognitive and socioemotional skills (Duncan et al., 2007).
Current Study
As we have described, regression-based estimates of specific early mathematics skills’ effects on children’s later mathematics achievement are interpretable and unbiased assuming that (a) scores on tests of different early mathematics skills reflect unique constructs and (b) other factors affecting early mathematics skills and later mathematics achievement are fully statistically controlled. To test these assumptions, we used a sample of mathematics and ELA scores taken from a study of third and fourth graders in a digital learning environment. These data provide an illustrative case study to assess (a) the factor structure of earlier mathematics skills and (b) the discriminant validity of measures to test whether factors predicted later mathematics achievement subtests with the most similar content and whether factors predicted later ELA while accounting for working memory, motivation, and other controls. If construct confounding does not bias estimates of effects of earlier mathematics skills on later mathematics achievement, then factors should be no more than moderately correlated with one another, scores on earlier mathematics achievement subtests should predict later mathematics achievement subtests with the most similar content, and scores should predict later mathematics achievement more strongly than they predict later ELA achievement. However, if construct confounding biases estimates of early mathematics skills on later mathematics achievement and regression weights have ambiguous interpretations, then early mathematics skill factors should be highly correlated with one another and the factors that most strongly predict general mathematics achievement should also strongly predict all mathematics subtests and ELA achievement.
Method
Participants and Procedure
Participants were drawn from a sample of 1,571 third graders and 1,618 fourth graders who took part in a longitudinal study of an evaluation of a mathematics software package. The MIND Research Institute’s Spatial-Temporal Math (ST Math) was evaluated from 2008 to 2013; the current data were gathered during the 2010–2011 and 2011–2012 school years (see Rutherford et al., 2014; Schenke, Rutherford, & Farkas, 2014). Students were from 81 classrooms in 18 low-socioeconomic schools in a suburban area of Southern California. At the end of the 2011 school year, we measured cognitive skills (specifically, working memory) and motivation for mathematics via one-on-one testing with netbook computers for a randomly selected subsample of students for whom we had obtained parent consent and participant assent. Testing was conducted for 2 days at each school. Throughout the 2011–2012 school year, students used the ST Math software for 90 minutes a week and took mathematics quizzes embedded within. At the end of the school year, students took state-administered standardized tests (the California Standards Test [CST]) in mathematics and ELA. To measure specific mathematics skills, we obtained data on students’ performance on each math strand of the standardized mathematics test: Number Sense I; Number Sense II; Algebra and Functions; Measurement and Geometry; Statistics, Data Analysis, and Probability.
Factor analyses of the ST Math quiz items were conducted with the full sample of our study students who used the ST Math software. Regression analyses included students who had valid software data, baseline working memory and motivation data via the one-on-one testing from the prior year, and data on the state-administered tests given at the end of the school year. This resulted in a final sample of 357 third graders and 289 fourth graders. 1 The final sample was 80% Hispanic and 77% eligible for free or reduced-price lunch (a proxy for socioeconomic status). Table 1 shows the descriptive statistics for the variables in our models.
Descriptive Statistics for Third- and Fourth-Grade Analysis Samples

Note. Standardized math and English language arts (ELA) scores come from the California Standards Test, which students take every year starting in second grade. A score of 350 is considered proficient. Motivation, mental rotation, hearts and flowers, and backward digit span were collected at the end of second grade for the third-grade sample and at the end of third grade for the fourth-grade sample. Motivation was measured with 12 items on a 7-point Likert scale. Backward digit span is highest number of digits reached.
Measures
The study analyzed data from three sources: the mathematics software (ST Math quiz data), individual working memory and motivational testing of students conducted at the end of the previous year, and ELA and mathematics CST scores.
ST Math quiz data
The quiz material within ST Math was divided into content objectives aligned to the California State Standards for each grade level (see Table S1 in Appendix A in the online supplemental materials for the total list of objectives for third and fourth grade) and was used as our measure of mathematics skills. After each objective within ST Math, students took a quiz on objective-relevant content (e.g., addition and subtraction to 1,000). Each quiz contained 5 to 10 items. All participants had the opportunity to respond to the same quiz items, but whether they reached a particular item depended on how far the student progressed within the ST Math program. For the factor analyses, final objective quiz scores were obtained by calculating the percentage correct on the total items for each quiz. For the regression analyses, we weighted item responses by item difficulty using a Rasch model, a one-parameter logistic item response theory model, to obtain a student’s final score. All items that corresponded to a particular quiz were specified to be part of the same factor. The software contained a total of 23 quizzes for third grade and 26 quizzes for fourth grade; however, because ST Math is a self-paced program, not all students completed all content or took all quizzes. Additionally, some control was given to students and teachers in choosing optional content. To ensure that we had an adequate sample of students, we used quizzes only if at least 40% of the students had completed the quiz, resulting in 22 of 23 quizzes in third grade and 20 of 26 quizzes in fourth grade.
Mathematics and ELA achievement
The CST was administered to all California students from Grades 2 to 11 in the spring of each year. 2 Scale scores range from 150 to 600, with a score of 350 marking the state’s determined level of proficiency. For the mathematics CST, students received an overall score as well as scores corresponding to the five strands within the California State Standards for mathematics: Number Sense I; Number Sense II; Algebra and Functions; Measurement and Geometry; and Statistics, Data Analysis, and Probability. Participating school districts provided ELA and math CST scores to the authors.
Motivation
To control for baseline motivation for mathematics, we measured students’ expectancies and values (Eccles, Wigfield, Harold, & Blumenfeld, 1993) at the end of the 2010–2011 school year (second grade for the third graders in the study and third grade for the fourth graders). Students were asked to respond to 11 items on a 7-point Likert scale about their expectancies and values for mathematics. After a brief tutorial on the use of the scales, students were guided through the questions through narrated slides administered via netbooks with Eprime 2.0 (see Figure S1 in Appendix B in the online supplementary materials). Sample items include “How well do you think you will do in math this year?” (expectancy) and “In general, how useful is what you learn in math?” (value). Students’ responses on the 11 items were averaged to create a composite of motivation, with a possible range of 1 to 7, which was subsequently standardized by grade level. 3 Scale reliability was .77 for the analysis sample of third graders, and scores on the composite ranged from 1 to 7. For fourth graders, scale reliability was .73, and scores ranged from 2.18 to 7.
Working memory
Working memory—our measure of domain-general cognitive skills—was measured via performance on three tasks representing the verbal, visuospatial, and central executive components: backward digit span (Klingberg, Forssberg, & Westerberg, 2002), two-dimensional mental rotation (Hahn, Jansen, & Heil, 2010; Lange, Heil, & Jansen, 2010), and hearts and flowers (Davidson, Amso, Anderson, & Diamond, 2006), respectively. All tasks were administered in the same testing session via netbooks. Screen shots and descriptions of tasks are included in the supplemental materials (Figures S2 and S3 in Appendix B). Scores on the three tasks were standardized separately for each grade level and summed to create a working memory composite. The resulting composite was standardized by grade.
Backward digit span
In the backward digit span task assessing verbal working memory and, to some extent, visual working memory, students were presented with a series of numbers that flashed one by one on the screen. Students were then asked to re-create the pattern of numbers in the reverse order using numbers on a keypad. Students had to successfully complete practice trials before beginning the real task. For the real task, after every two correct trials, another digit was added to the sequence. The greatest length sequence reached was used as the student’s backward digit span score and ranged from sequences of three to five digits in the third-grade sample and from three to eight digits in the fourth-grade sample. The within-school-year test-retest correlation was .35 (p < .001) for the study.
Mental rotation
To assess visuospatial working memory, we used an adaptation of the procedures and stimuli from Lange and colleagues (2010). First, students were presented with a picture of an animal on its feet, then the same animal rotated a number of degrees (facing the same direction or flipped). Students were asked to make a judgment about whether the rotated animal faced in the same direction as the first animal presented. A variable was created by subtracting the number of hits from the number of misses on the valid attempted trials (ranged from −1 to 1). The within-school-year test-retest correlation was .41 (p < .001) for the study.
Hearts and flowers
The hearts and flowers task assessed the central executive aspect of working memory and was adapted from Davidson and colleagues (2006). This measure involved two stimuli: a picture of a heart and picture of a flower. There were three experimental blocks, which consisted of hearts-only trials, flowers-only trials, and trials switching between hearts and flowers, and only responses from the switch trials were used. Average accuracy on the switch trials was used as the final score for this task. Average accuracy ranged from 0 to 1 in the third-grade sample and .33 to 1 in the fourth-grade sample. The within school year test-retest correlation was .31 (p < .001) for the study.
Demographic variables
District records provided information on the following demographic variables: socioeconomic status determined by eligibility for free or reduced-price lunch (dichotomous), English language learner status (dichotomous), ethnicity (categorical), and sex (dichotomous). Ethnicity was coded into three categories representing the two largest ethnic groups represented in our sample (Hispanic and White) and a third group called other ethnicity that combined students of all other ethnic groups.
Overview of Analytic Models and Methods
To understand the factor structure underlying the association between earlier mathematics skills (as measured by ST Math quiz items) and later mathematics achievement (as measured by CST scores), we tested five models using students’ responses to ST Math quiz items. Three models were included and compared for the purpose of describing the structure of the data: a single-factor confirmatory model, a two-factor confirmatory model derived from exploratory factor analysis (EFA), and a two-factor model based on the content of the items.
One additional model—a model based on high- and low-loading items on the general factor—was included to test whether results were similar when poor-fitting items assigned to the general factor are dropped. Additional information on the factor structures, the standardized factor loadings, and which objective quizzes compose each factor are provided in the online supplemental materials (Tables S1–S4 in Appendix A).
The first structure was the one-factor structure in which all quizzes were specified to load onto one latent factor representing general mathematics ability. The second structure was empirically derived from a two-factor EFA solution. 4 The third structure was prespecified per the coded mathematics content of each quiz. Two researchers independently coded items on the third- and fourth-grade quiz topics to be related to either number or geometry/visuospatial skills. These two categories were chosen because of the resurgence of the importance of geometry and visuospatial skills in the mathematics literature (see Clements & Sarama, 2011; Tatsuoka, Corter, & Tatsuoka, 2004) and support for the finding that students’ number skills matter for later achievement (see Jordan, Glutting, & Ramineni, 2010). The independent coders had an interrater reliability of .88 for both third and fourth grade and resolved discrepant codes through discussion. In total, scores from six quizzes were used to create the geometry latent factor and 16 quizzes to create the number latent factor.
The final fourth factor structure was included, not to accurately describe the structure of children’s mathematics knowledge, but to examine possible explanations for differing criterion validity produced by the constructs estimated in the first three models. To test whether a construct’s prediction of children’s achievement outcomes depends on its loading on a general factor of mathematics, we included a fourth structure, which split the general factor into two subfactors based on the standardized factor loadings of the items on the general factor. One comprised items with the highest half of loadings on the general factor, and the other comprised items with the lowest half of loadings on the general factor. A summary of the various factor models and their respective hypotheses is provided in Table 2.
Factor Models and Hypothesis Testing for Construct Confounding

Note. CST = California Standards Test; ELA = English language arts.
The fits of these factor structures were compared (with chi-square difference tests for nested models), as were the predictive associations between each factor (with a Rasch model) and mathematics and ELA achievement. As noted above, the key predictions of the construct confounding hypothesis pertain to the correlations among factors and the predictive relations between early mathematics skills and later mathematics and ELA achievement. The construct confounding hypothesis would be supported if correlations among factors were high and there was little difference in predictive strength of each factor across more closely and distantly related mathematics skills and general mathematics versus ELA achievement.
Results
To assess the construct validity of measures of children’s mathematics skills, we first present results from factor analyses conducted on the mathematics quizzes. We first tested a one-factor solution representing the general math ability factor. We then modeled three two-factor models described above and in Table 2. We compared the fit between the one-factor model and the various two-factor models to test whether the theoretically distinct math subskills found in the extant literature are being captured by the measures.
To assess which specific mathematics skills (as measured by the various measurement models) were most predictive of later mathematics achievement, we present ordinary least squares regression results based on Rasch scores from each of the factor structures to predict overall mathematics skills and specific mathematics skills as specified by the CSTs. Finally, to further test the measurement models’ discriminant validity, we present results predicting ELA skills as measured by the CST. All analyses were first conducted with the third-grade sample and then replicated with the fourth-grade sample to increase the generalizability of our findings.
Factor Analyses for Measures of Mathematics Skills
Factor analyses were conducted in Mplus 7.2 (Muthén & Muthén, 1998–2014) with the full sample of third graders (n = 1,571) and fourth graders (n = 1,618) separately. We tested a total of four factor structures, and Table 3 presents fit statistics, ranges of the standardized factor loadings, alphas, and average percentage correct as a measure of difficulty. Quiz factor loadings are presented in the online supplementary materials (see Appendix A: Table S3 for third grade and Table S4 for fourth grade).
Results from Factor Analyses

Note. Model fit indices were compared to cutoff values indicating good model fit according to Hu and Bentler (1999), where values on comparative fit index (CFI) and Tucker-Lewis Index (TLI) ≥.90 to .95 indicate adequate to excellent fit and where that for root mean square error of approximation (RMSEA) ≤.06 and .08 indicates adequate to excellent fit, respectively. EFA = exploratory factor analysis; SRMR = standardized root mean square residual.
Highest and lowest loading on the general math factor.
Third-grade sample
First, we conducted a confirmatory factor analysis (CFA) to test the fit of a one-factor model in which all quizzes loaded onto a single factor representing general mathematics ability (Table 3, column 1). Standardized factor loadings on the general model ranged from .29 to .60 for the third-grade sample. Despite factor loadings of some items being slightly lower than the recommended value of .40 (Costello & Osborne, 2005), all items were retained in subsequent analyses to maximize the coverage of the construct.
We then tested three different models, each containing two latent variables, against the one-factor model, using chi-square difference tests to examine whether the two-factor models were better at describing the structure of the measures than the more parsimonious one-factor structure. The first of these two-factor models was constructed with latent factors extracted by an EFA. To test the reliability of the EFA solution, the sample of 1,571 third-grade students was split into two random halves containing 785 and 786 students. EFA was conducted on the first random half with items allowed to cross-load across latent variables. On the other random half, we conducted a CFA using the same item specification obtained from the two-factor EFA solution but did not allow items to cross-load across latent variables (Table 3, column 2; refer to the supplemental materials for a list of items corresponding to all factors tested in this article). A chi-square difference test suggested a statistically significant difference in model fit, with the two-factor EFA solution being a better fit than the one-factor solution, χ2(df = 1, n = 1,571) = 13.8, p < .001.
For the third model, we categorized the quizzes into two factors in the prespecified model based on quiz items coded as number and number sense (number) and as geometry and visuospatial skills (geometry). We tested the model fit of our prespecified model in a CFA and did not find it to be statistically significantly different from the one-factor solution, χ2(df = 1, n = 1,571) = 2.3, ns (Table 3, column 3). Phi correlations between the two factors in all models were very high, ranging from .91 to .997, and measures of goodness of fit were acceptable (Hu & Bentler, 1999).
In sum, correlations among the factors in the two-factor models were very high, but the majority of these models did not fit statistically significantly better than the one-factor solution. The one-factor solution of general math ability fit the data quite well. Although the two-factor solution that resulted from the EFA fit statistically significantly better than the one-factor “general math” model, the two factors were not discernible from each other to a theoretically relevant extent.
Fourth-grade sample
Standardized factor loadings on the general model ranged from.21 to .64 for the fourth-grade sample (Table 3). We found that all two-factor solutions fit the data statistically significantly better than the one-factor solution, which was also reflected in the chi-square difference tests, which ranged from 13.8 to 113.69, χ2(df = 1, n = 1,618), p < .001. The phi correlations between the two latent factors in the empirically and theoretically defined two-factor models were somewhat lower in the fourth-grade sample than the third-grade sample, though still quite high (phi = .89 and phi =.88, respectively).
In general, results from the factor analyses suggested some statistically significant differences in model fit between the two-factor models and the one-factor model, with the two-factor models providing better fit to the observed data for the fourth-grade sample (Table 3). However, correlations between the two factors were >.90 for all three two-factor models tested in the third-grade sample and approximately .88 in the fourth-grade sample, suggesting that a single factor accounted for most of the covariance in children’s mathematics skills in both grades.
Regression Analyses Predicting Later Achievement
Table 4 presents correlations among the mathematics skills factors, achievement on the mathematics CST strands, overall ELA achievement, working memory, and motivation for mathematics. As expected, CST mathematics achievement was statistically significantly correlated with ELA achievement, working memory, motivation for mathematics, and all latent variables describing mathematics skills.
Correlations for Mathematics, ELA, Cognitive Composite, Motivation, and Math Factors for Third- and Fourth-Grade Students
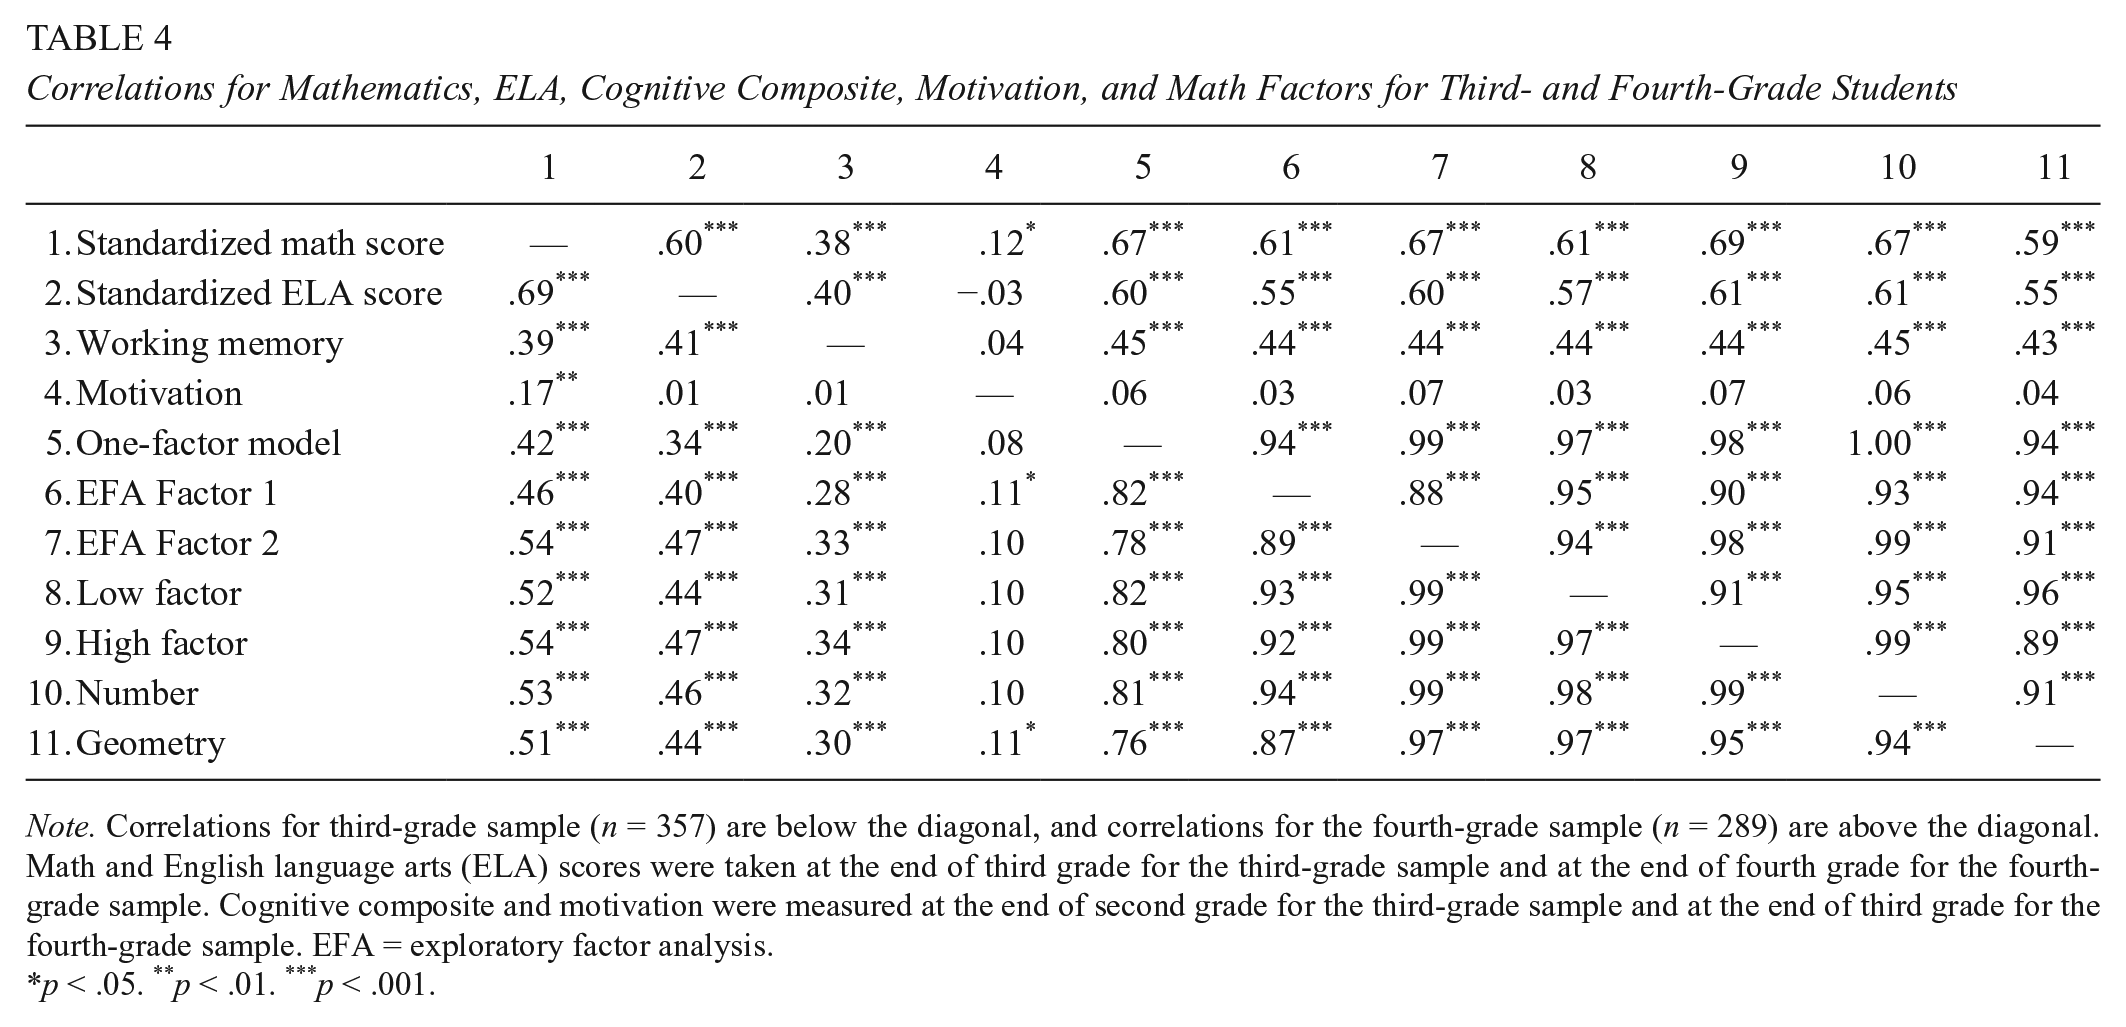
Note. Correlations for third-grade sample (n = 357) are below the diagonal, and correlations for the fourth-grade sample (n = 289) are above the diagonal. Math and English language arts (ELA) scores were taken at the end of third grade for the third-grade sample and at the end of fourth grade for the fourth-grade sample. Cognitive composite and motivation were measured at the end of second grade for the third-grade sample and at the end of third grade for the fourth-grade sample. EFA = exploratory factor analysis.
p < .05. **p < .01. ***p < .001.
To test for discriminant validity across factors, we ran a series of four ordinary least squares regression models (one model for each factor structure) predicting mathematics achievement (Table 5), specific mathematics skills (Table 6), and ELA achievement (Table 7; n = 357 for the third-grade sample and n = 289 in the fourth-grade sample; Models 1–4 in the tables). Each score was calculated from the output of the Rasch item response theory analysis and was subsequently standardized within the analysis samples. 5 To estimate the unique effect of mathematics skills on outcomes, these four models controlled for students’ working memory and mathematics motivation at baseline (the spring of the second grade for the third-grade sample and the spring of the third grade for the fourth-grade sample), sex, ethnicity, free or reduced-price lunch eligibility, and English language learner status. All continuous variables were standardized within each sample such that their coefficients can be interpreted as standardized regression weights.
Associations Between Math Factors and End-of-Year Standardized Math Achievement for Third- and Fourth-Grade Students

Note. Standard errors in parentheses. All continuous variables are standardized. Working memory was created by averaging standardizing students’ scores on the mental rotation, backwards digit span, and hearts and flowers task. The reference group is Hispanic non–English language learner, non–free or reduced-price lunch girls. EFA = exploratory factor analysis.
p < .05. **p < .01. ***p < .001.
Association Between Math Factors and End-of-Year Specific Mathematics Skills

Note. Standard errors in parentheses. Working memory, motivation, gender, ethnicity, English language learner status, and free or reduced-price lunch status were controlled for in the models but not presented in the tables. All continuous variables were standardized. EFA = exploratory factor analysis.
p < .05. **p < .01. ***p < .001.
Associations Between Math Factors and End-of-Year Standardized ELA Achievement for Third- and Fourth-Grade Students
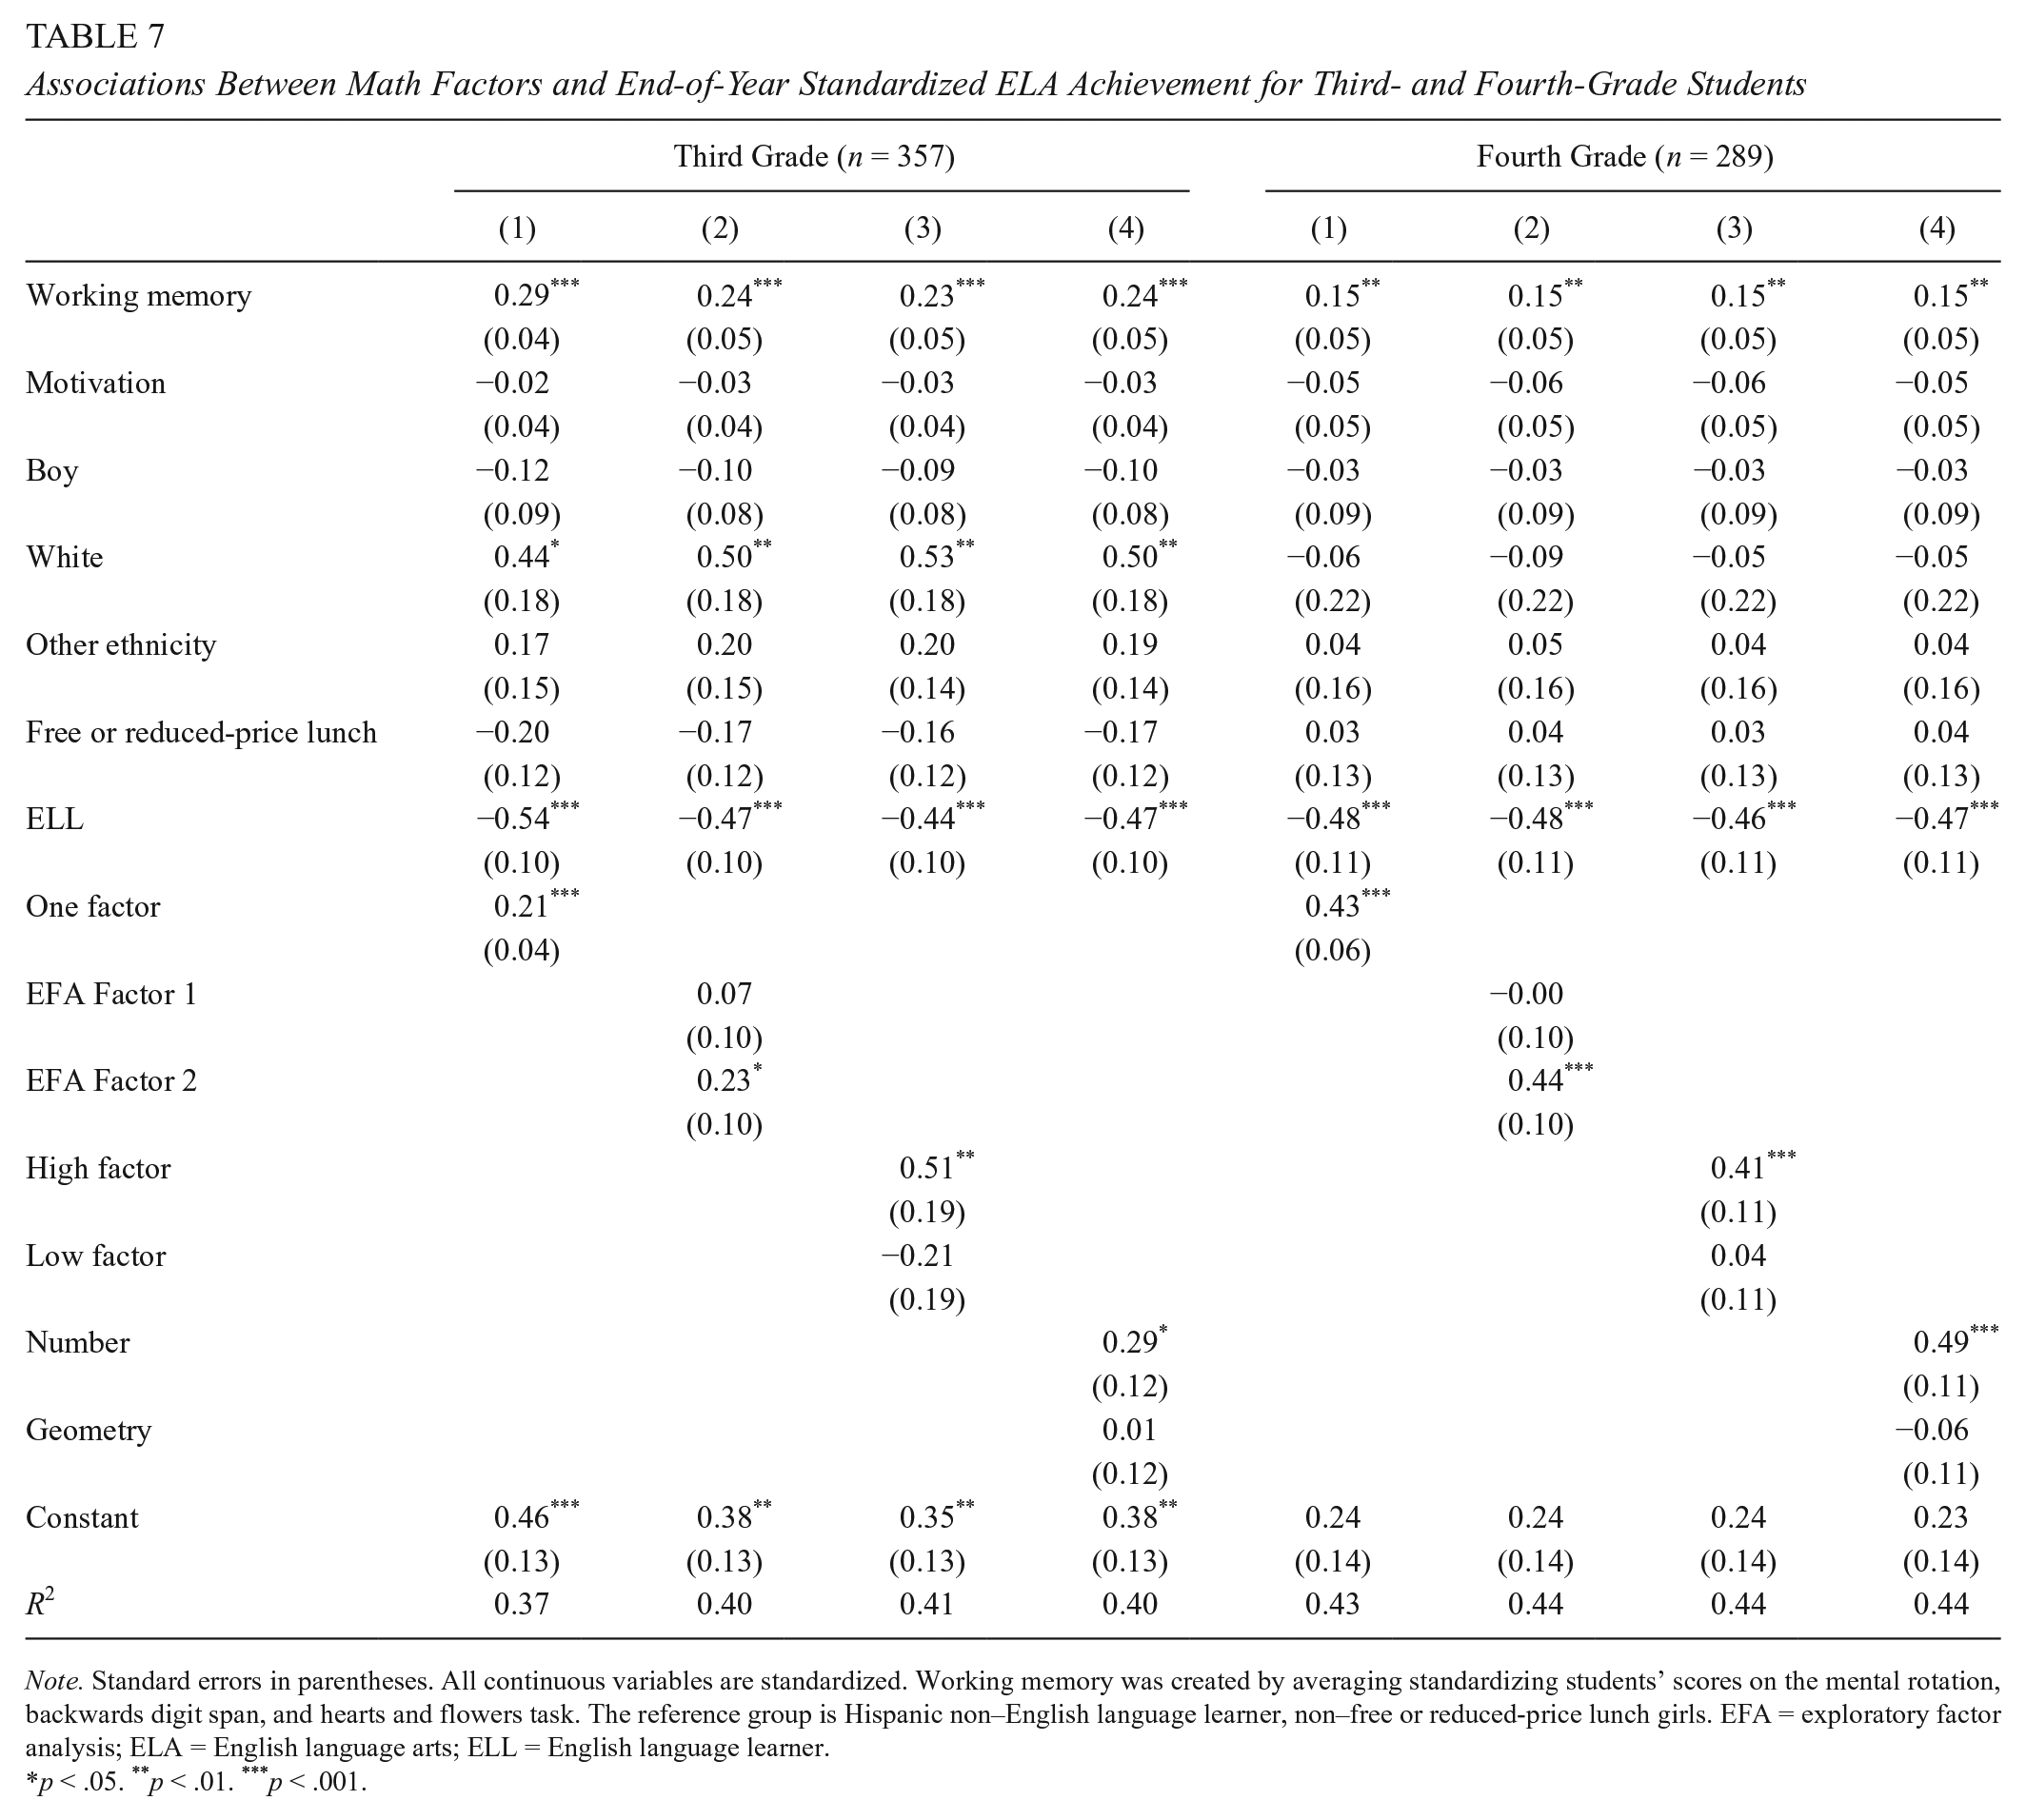
Note. Standard errors in parentheses. All continuous variables are standardized. Working memory was created by averaging standardizing students’ scores on the mental rotation, backwards digit span, and hearts and flowers task. The reference group is Hispanic non–English language learner, non–free or reduced-price lunch girls. EFA = exploratory factor analysis; ELA = English language arts; ELL = English language learner.
p < .05. **p < .01. ***p < .001.
Mathematics achievement
Descriptive statistics suggest that average difficulty was not systematically related to the magnitude of the regression coefficient (Table 3). The first model (M1 in Table 5) shows the results of the one-factor solution predicting end-of-the-year standardized mathematics achievement. Across all models in the third-grade sample, the general mathematics factor’s regression coefficient (β = .32, p < .001) for predicting end-of-the-year mathematics achievement was within the confidence interval of factors from the other models, suggesting that the general factor sufficiently describes the relationship between earlier mathematics skills and later mathematics knowledge. Results from the two-factor EFA solution (M2 in Table 5) suggest that only the second factor (EFA Factor 2) was statistically significantly associated with end-of-the-year mathematics achievement (β = .38, p < .001). The factor comprising the highest-loading items on the general factor was statistically significantly associated with mathematics achievement (M3 in Table 5; β = .35, p = .001), whereas the factor comprising the lowest-loading items was not. The predefined factor associated with number skills (M4 in Table 4) was statistically significantly associated with mathematics achievement (β = .40, p = .04), whereas the geometry factor was not. As such, the differences between the number sense and geometry factors, the two EFA factors, and the high- and low-loading factors look very similar to each other, suggesting that differences in reliance on a single factor may account for differences in correlations between subtests with different content and mathematics achievement. This general pattern of results was replicated with the fourth-grade sample.
In summary, several two-factor structures yielded factors that appeared differentially predictive of children’s later general mathematics achievement. These findings can yield two plausible interpretations. From a developmental perspective, it is possible that the most predictive factors are composed of the mathematical content most foundational for learning mathematics—for example, in our data, it appears that number sense is more foundational than geometry. Yet, perhaps the most predictive factors capture children’s ability to learn more generally, both in mathematics and in other domains. Although we statistically controlled for measures of working memory and general motivation for mathematics, it is likely that there remain elements within our mathematics skill factors that are nevertheless more general than they are specific. To examine the extent to which general learning mechanisms might still bias estimates of effects of early mathematics skills on achievement, we examined how well they predicted theoretically nearer constructs (e.g., number to a Number Sense CST strand) and how well they predicted the theoretically more distant ELA achievement.
Specific strands of mathematics
To better understand the association between specific mathematics skills and later mathematics achievement, we present the same models as in Table 5 but predict the five strands of the mathematics CST in Table 6 (Number Sense I; Number Sense II; Algebra and Functions; Measurement and Geometry; and Statistics, Data Analysis, and Probability). We specifically direct the reader to the factor structure representing the coded items for number and geometry in our models. If individual differences in number and geometry are empirically distinct constructs, we would expect the number factor to predict CST strands that are more closely associated with number, such as Number Sense I and Number Sense II. Similarly, if the geometry factor represented specific knowledge of geometry, we would expect it to better predict the Measurement and Geometry CST strand. For the third-grade sample, we found that the number factor was better than geometry at predicting three of the mathematics strands (Number Sense I, Number Sense II, and Algebra and Functions). In addition, neither factor (geometry or number) was able to statistically significantly predict the Measurement and Geometry strand. However, for the fourth-grade sample, the number factor was better at predicting each mathematics strand—even to the Measurement and Geometry outcome (β = .56, p < .001; β = –.01, ns, for number and geometry factors predicting the Measurement and Geometry CST strand, respectively). The factor consisting of the highest-loading items on the factor of general mathematics similarly predicted all mathematics strand scores more strongly than the factor consisting of the lowest-loading items.
ELA achievement
Finally, we used the same models in Table 5 to predict ELA achievement as the outcome (Table 7). Extending our models to ELA allows us to understand the extent that mathematics quiz factors represent mathematics-specific skills or whether the quiz factors are indicators of a more general cognitive skill. If mathematics factors derived from quiz scores measure something specific to mathematics achievement, we would expect the regression coefficients to be close to zero when predicting ELA achievement, after statistically adjusting for commonly used control measures (e.g., mathematics motivation and working memory). However, if correlations between mathematics factors and later academic outcomes are primarily influenced by more general skills, we would expect that the coefficients for the ELA models would mirror those for the mathematics CST models, although coefficients may vary due to differences in specific test content. Results were consistent with the latter hypothesis—that the mathematics factors largely represented measures of general knowledge or academic capability even after controlling for working memory and English language learner status. Results mirrored those for general mathematics achievement and mathematics strands analyses presented above: the second empirically derived factor (β = .23, p = .02; β = .44, p < .001, Model 2 in the third- and fourth-grade samples, respectively), the theoretically defined number factor (β = .29, p = .02; β = .49, p < .001, for the third- and fourth-grade samples, respectively), and the factor composed of the highest-loading items from the general mathematics factor (β = .51, p = .008; β = .41, p < .001, Model 4 in the third- and fourth-grade samples, respectively) all best predicted children’s ELA achievement when compared with the second factor in their respective models. Overall, patterns across ELA achievement were similar to those obtained for mathematics achievement with slightly weaker regression coefficients.
Discussion
Using data from the ST Math software game as an illustrative case study, we tested the construct confounding hypothesis to examine the extent to which regression-based estimates of specific early mathematics skills’ effects on children’s later mathematics achievement are not biased. Specifically, we tested whether scores on different early mathematics skills tests reflect unique constructs and whether factors affecting early mathematics skills and later mathematics achievement, such as working memory and motivational beliefs, are fully statistically controlled. To do this, we first estimated a series of factor structures that could reasonably be used to characterize mathematics skills. We found that although chi-square difference tests indicated that some two-factor models were better able to describe the data than a one-factor model, correlations between factors were very large—near or >.90—suggesting that a single factor explained most of the covariance in students’ mathematics skills and that separate constructs of mathematics skills based on predefined subsets of items had questionable discriminant validity. These findings replicate those of Purpura and Lonigan (2013), who also found very high correlations between factors of mathematics knowledge in a different sample of students using different measures of mathematics knowledge.
Furthermore, we tested the extent to which construct confounding could bias estimates of earlier mathematics skills on later achievement by estimating the effects of four factor structures of earlier mathematics skills on three later outcomes: general mathematics achievement, specific mathematics achievement, and ELA achievement. If construct confounding was not present, our measures of earlier mathematics achievement would not predict later ELA achievement, and specific measures of mathematics skills would best predict the most similar later specific mathematics skills. In contrast, this study found that regression coefficients were sizable when predicting ELA achievement and that the number factor predicted most highly to all mathematical content (including measurement and geometry), suggesting that our measures of early mathematics skills likely substantially reflect factors that facilitate learning across domains.
Implications
Findings from our study provide some evidence for the construct confounding hypothesis and may influence the interpretation of results reported in previous studies. Results suggest that our measures of early mathematics skills reflect a combination of factors that are associated with general mathematics learning as well as a combination of factors more general than mathematics. This is especially salient in the results that we presented using the factors to predict ELA achievement, which replicates what others have found (e.g., Duncan et al., 2007). To interpret potential effects of early mathematics skills on later mathematics achievement, we suggest that future studies first test for and understand the factor structure of early skills and the discriminant validity of measures of these skills, especially as they relate to ELA achievement. If measures of mathematics measure only mathematics skills likely to be influenced by mathematics-specific instruction, we would expect a close-to-zero association with ELA.
RCTs can provide the strongest evidence of causal links between earlier and later skills. RCTs may still be affected by construct confounding if experimenters train more than the targeted child characteristic during an intervention (e.g., a number sense intervention might also influence children’s motivation or comfort with test taking, thus confounding these constructs with each other in treatment-control comparisons of children’s academic outcomes). However, the random assignment of children to groups greatly limits bias due to other possible confounds unlikely to be influenced by a targeted early mathematics intervention (e.g., child’s working memory capacity or family’s socioeconomic status), which potentially influence performance across early math skills and later mathematics achievement.
Practically, the cost and time investment of such studies, along with the very large number of theoretically interesting treatment combinations, make them difficult to implement. Correlational studies can contribute valuable information, but we assert that greater care should be taken to eliminate construct confounding. Researchers should employ CFA in addition to domain-general controls to further understand their results. This approach has two major advantages over standard multiple regression analysis: (a) it enables researchers to test the important assumption that individual differences in early mathematics skills of interest are empirically distinct, and (b) it accounts for measurement error, thereby yielding less biased estimates. Furthermore, we recommend that researchers establish the discriminant validity of their measures of early mathematics skills by including a second outcome measure that is not likely to be caused by these skills.
A reexamination of conclusions drawn from previous analyses of children’s mathematics achievement might be important, but we do not imply that findings from these studies are not useful. First, these studies have an important practical use: They can identify efficient classifiers for children at risk for persistently low mathematics achievement or mathematics disability (e.g., Geary, Bailey, & Hoard, 2009; Gersten, Jordan, & Flojo, 2005; Mazzocco & Thompson, 2005). Students with learning disabilities may display different patterns of mathematics knowledge than do normal-developing students. Second, these findings are theoretically important, as they describe which types of knowledge load most strongly onto an underlying mathematics factor. Furthermore, although estimates of early mathematics skills’ effects on later mathematics achievement are likely biased, it is a testable claim (though far from a certain one) that the most predictive skills are those that have the strongest effects on later achievement. Regardless, this is an empirical question that should be addressed through a combination of the approaches that we recommend above. Indeed, we found that our number factor more strongly predicted later mathematics achievement than did geometry—a finding that is consistent with previous literature suggesting the primacy of early number skills (e.g., Aunio & Niemivirta, 2010; Geary et al., 2013; Jordan et al., 2009).
Limitations
We note several limitations of this work. The first concerns our measures. Measures of participants’ mathematics knowledge were taken at multiple points during the school year shortly after the students completed games on topics corresponding to those measures and represented a post hoc categorization of mathematics skills. It should be noted that participants were not at ceiling on measures of those mathematics skills, suggesting that not all students learned the material (see Table 2). Because all measures of mathematics skills were presented via the same method to students (in-game quizzes on the computer), they avoid the common problem of confounding testing format with tested material, an advantage of the current study. To the extent that using trained tasks would change the factor structure of the tests, prior evidence suggests that it would decrease the loadings of tests on a general factor. Indeed, the loadings of a subtest on a factor of general intelligence have been shown to decrease following cognitive training studies (te Nijenhuis, van Vianen, & van der Flier, 2007). Additionally, our measures of mathematics skills were contextualized as part of the ongoing mathematics curriculum and allowed for all students to have the opportunity to learn the material, which may provide additional ecological validity not afforded by previous studies. The specific strands of the later mathematics measures that we used were taken from the categorization put forth by the California State Board of Education and may not be the most theoretically justifiable way to categorize mathematics knowledge. For example, we note that the Measurement and Geometry strand contains items that ask students to use numeracy and calculation skills. Despite our use of different measures than previous studies and a sample with different age and demographic characteristics, we observed a similar factor structure (especially the very high correlations between factors) to that in a study that used a large set of standardized measures (Purpura & Lonigan, 2013). In addition, the correlations between the quizzes and the later mathematics measure were similar to those reported by Siegler and colleagues (2012), who reported correlations between tests ranging from .22 to .46. Finally, the relations between our measures and mathematics and reading achievement were similar to those estimated in other data sets using standardized achievement and control measures (e.g., Duncan et al., 2007). Taken together, our measures of mathematics skills show similar relations with other relevant measures as compared with those used in the literature.
Our measures of mathematics skills may not have been complete: We did not administer measures of the approximate number system, which others have found to be separate from other mathematics skills in factor analyses (e.g., Fazio et al., 2014; Göbel et al., 2014). However, more research is needed to understand if these differences in factor structure emerge because of the constructs that are being measured or if they reflect measurement variance unique to the different types of tasks used to assess these different systems. We recommend multitrait-multimethod approaches to further investigate the potentially unique role of the approximate number system.
Furthermore, our domain-general controls were not as comprehensive as they could have been. We did not include a measure of reasoning or general intelligence and instead focused on working memory, a construct that has been shown to be associated with mathematics (Friso-van den Bos, van der Ven, Kroesbergen, & van Luit, 2013). It is noteworthy that the correlations among our measures of working memory and academic achievement, which ranged from .33 to .40, are very close to the correlations in other studies that use measures of general knowledge or intelligence. For example, the data sets in Duncan and colleagues (2007) used measures of overall intelligence, such as the Wechsler Preschool and Primary Scale of Intelligence (Wechsler, 1967) and the Stanford-Binet Intelligence Scale Form L-M, third edition (Terman & Merrill, 1973), and found correlations ranging from .29 to .40 with achievement. The exact estimates and statistical significance of predictors will be influenced by the strength of the controls in the model. For example, some studies found that reading predicted mathematics achievement (e.g., Duncan et al., 2007), yet others did not (e.g., Hansen et al., 2015); however, finding some nonstatistically significant paths does not mean that remaining statistically significant paths are unbiased. Furthermore, limitations associated with the quality of control variables do not affect the interpretation of our factor analysis results.
A final limitation concerns the age and ability level of the students in the study. It may be that for more advanced mathematics content areas, such as fraction knowledge, individual differences in these skills are more differentiated. Other studies found evidence of age and ability differentiation of domain-general cognitive skills such that skills are less correlated in individuals as they get older (Detterman & Daniel, 1989; Tucker-Drob, 2009; Very, 1967). Particularly high-achieving children may also show more differentiated mathematical content knowledge. For example, Detterman and Daniel (1989) found evidence of differentiation on IQ subtests and that the relations among these skills may be different at different ability levels such that skills in high-ability individuals are less correlated than in lower-ability individuals.
Conclusion
This study aimed to illustrate the extent to which estimates of the effect of earlier mathematics skills on later achievement obtained from observational studies may be biased by construct confounding. By testing various factor structures of mathematics skills and using them in regressions to estimate their impacts on later mathematics achievement, specific mathematics content, and ELA achievement, we found that a general factor accounted for most of the covariance in these skills in our sample and likely most of the relations between these skills and later mathematics and ELA achievement. These findings suggest that simply statistically controlling for general cognitive factors and a selection of other specific mathematics skills is likely insufficient for obtaining unbiased estimates of how specific early mathematics skills influence later mathematics achievement. These results highlight a need for developing a better understanding of the latent structure of early mathematics skills and how these relate to knowledge in other content domains and to domain-general cognitive skills.
Footnotes
Acknowledgements
This research was supported in part by grants from the Institute of Education Sciences (R305A090527). In addition, we thank the participating districts, schools, teachers, and students, as well as our project team of personnel at the University of California, Irvine, and our laboratory graduate and undergraduate students.
1.
2.
Administration of the California State Test in California was discontinued after 2013 with the adoption of the Smarter Balanced Assessment.
3.
Expectancies and values were combined into one construct because the purpose of the study was to control for motivational beliefs for math generally, not to interpret effects of motivation on achievement.
4.
We tested three-factor exploratory factor analysis solutions as well; however, we found that the third factor accounted for only one additional item in the third- and fourth-grade samples. Thus, we decided to retain a two-factor solution instead of opting for a three-factor solution.
5.
Previous studies commonly rely on using unweighted raw scores as measures of mathematics knowledge (e.g., Bailey, Siegler, & Geary, 2014; Jordan et al., 2013).
Authors
KATERINA SCHENKE is a postdoctoral scholar in the Graduate School of Education and Information Studies at the University of California, Los Angeles. She studies teacher effectiveness, student motivation, and large-scale educational assessment.
TEOMARA RUTHERFORD is an assistant professor of educational psychology in the Department of Teacher Education and Learning Science at North Carolina State University. She studies individual agency and how it influences success of educational interventions.
ARENA C. LAM is a research associate at WestEd. She studies student motivation, career choices, and students’ perceptions of the classroom learning environment.
DREW H. BAILEY is an assistant professor in the School of Education at the University of California, Irvine. He studies children’s mathematical development.
References
Supplementary Material
Please find the following supplemental material available below.
For Open Access articles published under a Creative Commons License, all supplemental material carries the same license as the article it is associated with.
For non-Open Access articles published, all supplemental material carries a non-exclusive license, and permission requests for re-use of supplemental material or any part of supplemental material shall be sent directly to the copyright owner as specified in the copyright notice associated with the article.