
Abstract
Visual gestures, especially head movements and eyebrow raises, are time-locked to acoustic cues during the expression of spoken prosody. The present study examined the role these visual cues play in prosody perception, particularly for individuals with cochlear implants (CIs), who often experience challenges understanding prosody due to reduced access to pitch cues. A vocal mimicry paradigm was used to obtain granular, objective measures of prosody perception through acoustic analysis of mimicked sentences. Stimuli consisted of audio-visual recordings from one talker that captured naturally occurring variability in the expression of auditory and visual cues to word focus. Participants mimicked these natural recordings, as well as prosody-transplanted stimuli that allowed us to isolate the influence of auditory or visual prosody cues while holding the other modality at a neutral level (broad focus). Participants converted visual prosody cues into acoustic correlates of prosody in their mimicry, repeating acoustically unfocused words with higher F0 and intensity when those words were paired with video containing head and eyebrow gestures. This visual influence was stronger for participants with CIs than an age-matched group of typical-hearing listeners. CI participants who were less successful at acoustic mimicry tended to be more influenced by visual cues. These results indicate that CI listeners compensate for degraded auditory cues by integrating visual gestures into their perception of spoken prosody, potentially highlighting new targets for multisensory counseling or training.
Introduction
Being able to see a talker's face can substantially improve speech perception success, particularly in challenging listening conditions. Many studies have shown that intelligibility scores are higher for audio-visual as compared to audio-only speech, a benefit that increases with the amount of background noise (Crosse et al., 2016; MacLeod & Summerfield, 1987; Ross et al., 2007). Listening effort can also be mitigated by seeing a talker's face, particularly when speech perception is sufficiently challenged by background noise (Brown, 2025) or by cognitively demanding semantic processes (Fleming & Winn, 2025). These audio-visual benefits are magnified for individuals with hearing loss, who rely more heavily on visual cues to supplement degraded auditory signals (Desai et al., 2008; Fleming & Winn, 2025; Puschmann et al., 2019).
The overwhelming majority of previous audio-visual speech perception studies have focused on the role of visual cues in supporting speech intelligibility as measured by word-level repetition accuracy. These intelligibility benefits can largely be traced to phonetic cues conveyed by the talker's mouth (Erjavec & Legros, 2013; Thomas & Jordan, 2004). However, talkers also produce a bevy of additional visual gestures in real communication—including movements of the eyebrows, head, hands, and body posture—the timing of which is closely linked to prosodic elements of the talker's speech. In acoustic terms, prosody can be defined as modulations of non-phonetic aspects of a talker's voice, including their voice pitch (or fundamental frequency, F0), speech level, voice quality, speech rhythm, and the duration of certain speech segments (Cole, 2015). Functionally, prosody supports a wide array of communicative goals, including conveying information about word meaning, marking information that is novel or important, providing phrasal cues that can help the listener parse syntax, and signaling aspects of the talker's identity or emotional state (Cutler et al., 1997). While previous studies have provided detailed characterizations of the visual gestures that co-occur with spoken prosody (see the following section), substantially less attention has been paid to the potential effects of these visual gestures on prosody perception.
Comprehending spoken prosody may seem automatic to individuals with typical hearing (TH), but for those with hearing loss, prosody perception can present serious challenges. This is particularly the case among listeners who use cochlear implants (CIs), as variations in voice pitch—an essential cue across many forms of prosody—are not faithfully conveyed by current clinical CI processors (Gaudrain & Başkent, 2018; Geurts & Wouters, 2001; Laneau et al., 2004). The resulting deficits in prosody perception have meaningful impacts for these listeners. For example, in a qualitative study by Rapport et al. (2020), some listeners with CIs reported that struggling to find meaning “beneath the surface” left them feeling as if others perceived them to be “stupid” or “inferior.” In accord with these reports, the ability to identify vocal emotion has been shown to be positively correlated with self-reported quality of life among CI users (Luo et al., 2018). One strategy that could help compensate for degraded acoustic cues to prosody is to rely more on complementary visual gestures. However, little is known about how these dynamic visual cues affect prosody perception, particularly among individuals with hearing loss. The overarching aim of the current study was to objectively evaluate the influence of time-locked visual gestures on the perception of word focus, both among individuals with TH and individuals who use a CI.
Auditory and Visual Cues for Expressing Prosody
Talkers express most types of prosody by modulating the pitch (i.e., fundamental frequency or F0), intensity, and duration of speech segments. For the type of prosody under investigation in the current study—in which the talker highlights or emphasizes a specific part of an utterance—focused words are produced with upward or downward F0 excursions, longer duration, and higher intensity relative to the surrounding words (Cooper et al., 1985; de Jong, 2004; Heldner, 2003). Conversely, unfocused words following the focused word are produced with less dynamic and often lower F0 and intensity contours, a phenomenon known as “post-focus compression” (Xu, 1999; Xu & Xu, 2005). The acoustic contrasts between focused and unfocused words are readily perceived by TH listeners (Botinis et al., 1999; Xu et al., 2004).
In natural speech, talkers also produce coordinated visual gestures that are time-locked to the acoustic realization of prosody. Prominent visual prosody gestures include head turns/nods (Hadar et al., 1983), eyebrow raises (Ekman, 1979), gestures of the hands (Kendon, 1980), and jaw widening (Erickson et al., 1998). A particularly tight link has been found between the timing of eyebrow raises and peaks in the talker's F0, with the eyebrow raise typically occurring slightly before the F0 peak. Though not a universal finding (c.f., Berger & Zellers, 2022), this temporal alignment between eyebrow gestures and F0 has been observed in the expression of various types of prosody, including questions vs. statements (Cavé et al., 1996), discourse structure marking (Flecha-García, 2010), and cues to turn-taking in conversation (Guaïtella et al., 2009). Most relevant to the current study, eyebrow raise gestures reliably co-occur with F0 accents in the production of word focus (Kim et al., 2014). While the expression of visual prosody gestures can be variable across talkers and utterances (Kim & Davis, 2016), appropriately timed gestures of the head and eyebrows nonetheless improve speech intelligibility in a way that is not observed when valid mouth movements are paired with randomly timed visual gestures (Al Moubayed et al., 2009; Munhall et al., 2004). In terms of prosody perception, adding time-locked visual gestures to one word in a sentence causes listeners to give higher subjective ratings of perceived prominence on that word (Krahmer & Swerts, 2004, 2007).
Prosody Perception among Cochlear Implant Users: Challenges and Compensation Strategies
CI processing degrades some of the key acoustic cues used to convey prosody. In particular, CIs do not provide access to harmonic structure, which is critical for pitch perception (Mehta & Oxenham, 2017). The pitch cues that remain, including subtle envelope fluctuations (Kong et al., 2009) and cochlear place cues degraded by spread of excitation (Plack et al., 2005), are weak and easily corrupted by background noise. As a result, individuals with CIs have a lower fidelity representation of a talker's F0 relative to individuals with TH (Holt & McDermott, 2013; Moore & Carlyon, 2005; Won et al., 2010). This creates challenges for various forms of prosody perception, including emotion recognition (Chatterjee et al., 2015; Gilbers et al., 2015) and question-statement discrimination (Chatterjee & Peng, 2008), which also manifest in poorer productions of prosodic contours (Nakata et al., 2012; Wang et al., 2013). CI listeners also show less ability to exploit prosody to monitor key speech information (Holt et al., 2016) and tend to rely on word meanings rather than prosody when determining the emotional expression in an utterance (Richter & Chatterjee, 2021).
To compensate for degraded F0 information, listeners with CIs often upweight alternative acoustic cues to prosody, such as intensity (Peng et al., 2009) or duration (Fleming & Winn, 2022). However, these cues are typically less reliable indicators of prosodic marking of new information than F0 (Cole, 2015) and are more susceptible to variability unrelated to the intended prosody. For example, a word with a longer duration might indicate the end of a sentence rather than focused prosody.
Given the covariance of acoustic and visual cues to prosody, another potential strategy available to CI listeners to compensate for degraded F0 information is to increase their perceptual reliance on complementary visual prosody cues. This would be consistent with the relatively higher reliance on visual cues among listeners with CIs for perceiving speech in general (Fleming & Winn, 2025; Puschmann et al., 2019). While some previous studies have investigated this, most of them have focused on affective prosody, which talkers use to convey their emotional state or attitude. These studies have shown that seeing an emotive face improves emotion perception more for listeners with CIs than those with TH (Most & Aviner, 2009). Perception of emotional speech is also more influenced by conflicting facial emotions for listeners with CIs, suggesting a greater reliance on visual prosody cues (Fengler et al., 2017; von Eiff et al., 2022).
While affective (i.e., emotional) prosody is sometimes treated as a proxy for prosody perception in general, it conveys a fundamentally different kind of information than linguistic prosody, which talkers use to modify the intention of their speech (for example, emphasizing particular words or differentiating a question from a statement). A review by Everhardt et al. (2020) shows that perception of linguistic and emotional prosody are separate, with different patterns of success and difficulty. The kinds of visual cues produced during the expression of linguistic prosody are also very different than the visual cues that accompany affective prosody. Facial cues signaling a talker's emotional state are not closely time-locked to acoustic cues (e.g., F0 or intensity contours). For example, a talker might (or might not) make a happy or sad face throughout an entire utterance, irrespective of the timing of the acoustic contours that signal that emotion. In contrast, corresponding auditory and visual cues covary on a moment-to-moment timescale in the expression of linguistic prosody, resulting in a more dynamic set of audio-visual prosody cues. Functionally, this difference means that visual cues to affective prosody provide a way of inferring the talker's emotion that bypasses the acoustic signal, whereas visual cues to linguistic prosody provide complementary information that supports the auditory information itself.
Little is known about how individuals with CIs leverage visual cues when perceiving linguistic prosody. Agelfors (1996) reported that seeing the talker's face improves linguistic prosody perception about equally for CI users and hearing aid users. However, that study collapsed across several prosodic outcome measures, some of which would likely be more challenging for CI users (e.g., hearing tonal accents or word emphasis) than others (e.g., perceiving the number of syllables or vowel length). More recently, Lasfargues-Delannoy et al. (2021) showed that question-statement discrimination is substantially more aided by visual cues for individuals with CIs than those with TH. To avoid ceiling effects in the TH group, the authors chose to equate performance between groups by compressing the F0 contours and reducing visual gestures in the stimuli presented to the TH group. Meister et al. (2025) examined the perceptual impact of tightly controlled eyebrow and head nod gestures synthesized onto a virtual face saying the same German sentence on each trial. Participants with TH or CIs were both more accurate at identifying a focused word when it was paired with visual gestures (the F0 contour was again compressed for the TH listeners to avoid ceiling performance). When the auditory and visual cues indicated different focused words, most TH participants tended to select the acoustically focused word, whereas the CI group was more mixed between auditory or visual cue dominance.
The Current Study
Taken together, the studies described above point toward visual gestures as a potentially important part of prosody perception for CI listeners and also leave open numerous opportunities for growth and further understanding. Specifically, we point to the need to account for naturally occurring variability in prosodic expression, the benefit of stimulus naturalness (i.e., a real face and a real voice), methodological choices that account for performance differences between hearing groups, and the opportunity to extract granular data rather than reliance on all-or-none responses. Although forced-choice measures can indicate a key ultimate goal of perception (e.g., deciding which word was focused, deciding if an utterance was a question or a statement), the lack of granularity could conceal subtle differences in perception, including influences of visual gestures, for instance. These subtle influences might not cause the participant to change their explicit decision, but could nonetheless influence the accuracy and efficiency of prosody perception in real time. Finally, we highlight the expression of prosodic focus as spreading across an entire sentence (including compression of prosody away from the focused word) rather than being isolated to the focused word. In the current study, we aim to overcome limitations of simplified forced-choice tasks by using vocal mimicry as an objective, granular way to measure prosody perception using more naturalistic, audio-visual, full-sentence speech stimuli.
In the present work, the acoustics of participant reproductions serve as the outcome measure of prosody perception. On each trial, participants were asked to watch and/or listen to speech stimuli on which one of the words could be paired with auditory and/or visual cues to word focus. We compared visual influences on prosody perception between TH and CI groups. Specifically, we examined the role of time-locked eyebrow and head turn/nod gestures in supporting word focus perception, and how those cues compared against conventional cues in the acoustic domain such as F0 contour. The advantages of this approach are threefold. First, acoustic aspects of mimicked speech are continuous outcome measures, allowing prosody perception to be assessed in a graded (rather than all-or-nothing) way on each trial. Second, the verbal responses of interest are not bounded by explicit floors or ceilings, because participants can map the acoustic space of their mimicry into their comfortable speech production range. This allows natural prosody cues to be studied without contending with ceiling effects, particularly for TH listeners. Third, the task does not require participants to make an explicit categorization decision, removing at least one complicating factor that might obscure objective assessment of prosody perception. However, CI users produce significantly smaller F0 variation and reduced F0 contours compared to their NH peers, as shown by Hawthorne (2024). Although compressed expression of F0 in CI listeners would not in itself be a reason to explain greater or lesser relative influence by visual gestures, the influence of stimulus type—especially the influence of visual cues—must be interpreted relative to the talker's own habitual F0 range and not solely on an absolute scale.
Stimuli in the current experiment consisted of a set of audio-visual five-word sentences, where either one word was focused in one of three sentence positions, or where there was no focused word (i.e., broad focus), allowing us to examine the ability of CI users to perceive the differences between these prosodic forms. In addition to variability in the lexical content and the position of the focused word in the sentence, the exact expression of acoustic and visual prosody cues also varied organically from stimulus to stimulus. This reflects a more natural scenario than repeated exposure to identical auditory and/or visual prosodic cues.
To separately evaluate the contributions of auditory and visual prosody cues, we used two types of cross-spliced stimuli. The first type was made by transplanting videos from broad-focus stimuli onto lexically matched audio (i.e., the same sentence) where the audio contained a focused word, thereby removing visual gestures while maintaining auditory cues. The other type of cross-spliced stimuli was made by transplanting videos containing visual focus gestures onto time-aligned broad-focus audio, thereby adding visual prosody cues to audio with no focused word. Across these conditions, we tested the following specific hypotheses:
In audio-only conditions, word focus perception will be Pairing visual gestures with broad-focus audio will Replacing video containing visual prosody gestures with video from a broad-focus production will Adding complementary visual gestures to auditory stimuli containing a focused word will The influence of visual gestures on prosody perception (hypotheses 2–4) will be stronger in the CI group than the TH group.
Materials and Methods
Participants
Final participant groups included post-lingually deafened individuals who use at least one CI (N = 20; 14 female, 6 male) and an approximately age-matched cohort of individuals with TH (N = 22; 16 female, 6 male). Average participant age was 53.4 years (±17.0 years S.D.) in the CI group and 58.5 years (±16.8 years S.D.) in the TH group. A Kolmogorov–Smirnov test indicated no significant evidence that the two groups were drawn from different age distributions (D = 0.22, p = 0.52). The TH group had hearing thresholds typical for their age: ≤30 dB HL at octave-spaced frequencies from 250 Hz to 3000 Hz in both ears. The CI group comprised a mixture of bilateral (N = 10) and unilateral (N = 10) implantees. For all CI participants, both ears were plugged during the task in an attempt to isolate prosody perception through the CI(s). Bilateral CI users were allowed to do the task using both CIs. Two additional CI participants were excluded after testing because their vocal mimicry did not contain noticeable prosodic variation in any experimental condition. While this could indicate genuine difficulty with prosody perception, it could have also occurred due to a misunderstanding of the task instructions or challenges specific to prosody production (Hawthorne, 2024), which are outside the scope of the current investigation. Thus, we only included participants who showed prosodic variation in one or more experimental conditions, confirming that they understood the task and could produce word focus by modulating their voice pitch.
Stimulus Recording Procedure
All stimulus videos were recorded from a 24-year-old resident of Minnesota who was assigned female at birth, and whose visual appearance in the stimuli lacked binary gender features. The video was framed such that the talker was visible from the shoulders up, with their face near the center of the frame. Video recordings were made at 60 frames per second using a Canon XA50 video camera and audio recordings were made at 48 kHz using a HyperX Quadcast microphone.
Each stimulus was a five-word sentence of the form [name] [past-tense verb] [number] [adjective] [plural noun] (example: “Claire washed ten glass plates”). All words were monosyllabic. One hundred such sentences were recorded, each with five different focus patterns: with no particular emphasized word (broad focus), or with contrastive focus placed on the first, third, fourth, or fifth word. The second word was never focused, as implying that the verb was heard incorrectly caused a more drastic disruption to the overall meaning of the sentence. In total, this stimulus set included 500 unique stimuli. However, trials with word 5 focused were not included in the experiment because vocal creak is a common way to signal the end of a phrase in English (Davidson, 2021), and this phonation style could impair our ability to reliably track participants’ F0.
To elicit corrective focus in the stimulus recordings, the talker was shown two sentences on a screen next to the camera. The top sentence had an “incorrect” word (e.g., “Claire washed five glass plates”), while the bottom version was “corrected” with a visually highlighted changed word (e.g., “no, Claire washed
Analysis of Auditory Prosody Cues in the Stimuli
To verify the presence of the expected prosody cues, the 400 unique stimuli presented in the experiment were acoustically analyzed using Praat (Boersma & Weenink, 2024). This process started with forced alignment to automatically identify word boundary times. Each word was then divided into 31 time chunks in Praat, with stimulus F0 and intensity computed within each chunk. This resulted in a normalized time base for F0 and intensity time courses (31 samples) regardless of differences in word duration. F0 was computed using the default parameters of the filtered autocorrelation algorithm and then converted to semitones relative to the talker's median F0 when speaking broad-focus sentences (203 Hz).
Analysis of Visual Prosody Cues in the Stimuli
Visual prosody gestures were quantified based on automated face tracking, which was used to extract the spatial positions of facial landmarks in each frame of the stimulus videos. The talker's face was first identified in each video frame using a pre-trained Haar cascade classifier available in the opencv Python package (Bradski, 2000). Within the located face, a local binary features model from the dlib package (King, 2009) was used to identify 68 facial landmarks, the positions of which were tracked across all frames in each video. To get an estimate of the talker's head position in 3D space, Perspective-n-Point pose computation (opencv package) was used to estimate the 3D pose (translation and rotation) of a generic head model that would minimize the reprojection error back to points on each original 2D video frame. The salient visual prosody gestures were captured in the rotation estimates, especially head yaw (left-right turns) and head pitch (up-down nods). Time courses of estimated head rotation were smoothed using a six-frame moving average filter.
To examine the time course of eyebrow raise gestures, the distance between each eye (average of two face tracking samples representing the top of the eye) and the corresponding eyebrow (average of three samples representing the middle of the eyebrow) was computed on each video frame. This eye-eyebrow distance was then averaged across the two eyes, based on the impression that the talker expressed word focus by raising both eyebrows together, rather than one or the other.
Artifact thresholds were identified that would capture errors in head rotation estimation and eyebrow raise tracking. For head rotation, any stimulus on which the following non-plausible thresholds were hit wase removed from the analysis: head yaw beyond ±50°, head pitch beyond ±25°, and head roll beyond ±20°. Excluding trials with word 5 focused (which were not used in the experiment), 377 out of the 400 stimuli (94.3%) survived head rotation artifact rejection. For eyebrow raises, any frames on which the measured eye-eyebrow distance was less than 30 pixels were identified as artifactual and the corresponding stimulus was removed. 364 out of the 400 stimuli (91%) survived eyebrow raise artifact rejection. The previously identified word boundary times were then marked into the visual gesture data. Within each word, the head rotation and eyebrow raise time courses were up- or down-sampled to a constant 50 samples per word, which allowed time courses to be averaged at the sentence level despite differing stimulus durations.
Description of Auditory and Visual Prosody Cues in the Stimulus Corpus
Analyses of the stimulus materials revealed consistent cues—both auditory and visual—to prosodic focus. Figure 1 shows the average stimulus acoustics of words 1, 3, and 4, as only these focused word positions were presented to participants in the main experiment. As expected, the talker produced each of these words with a clear F0 peak when the word was focused as compared to when it was part of a broad-focus sentence (Figure 1A). The average peak F0 of focused words was 330 Hz (SD = 25.7 Hz), an increase of 8.4 semitones relative to the talker's median F0 in the broad-focus condition (203 Hz). This peak value is underestimated in Figure 1A due to averaging across words with slight variation in the timing of the F0 peak. For words 3 and 4, F0 was lowest when that word was “unfocused,” meaning that a different word in the sentence was focused, reflecting the expected pattern of post-focus compression (Xu, 1999; Xu & Xu, 2005). The same pattern was observed in the talker's speech intensity; focused words were spoken at a higher level than broad-focus words, and words 3 and 4 were spoken with the lowest level when they were unfocused (Figure 1B). Focused words were also spoken with longer durations than broad-focus or unfocused words (Figure 1C).

Auditory cues to word focus in the stimuli. Average stimulus acoustics are shown for the first, third, and fourth words in the sentence when the indicated word was focused (black), unfocused (dashed gray), or part of a broad-focus sentence (solid gray). Error ribbons and bars indicate S.E.M.
The stimulus talker also produced two salient visual gestures that were time-locked to focused words. The first was a stereotyped head gesture, consisting of a leftward head turn and a downward head nod; these movements are captured in the “yaw” and “pitch” panels of Figure 2A, respectively. Both components of the head gesture reached their farthest extent near the midpoint of the focused word. Leading up to focused words 3 or 4, the head initially turned in the opposite direction (to the right; downward in the top panel of Figure 2A), which increased the overall extent of the leftward head turn on the focused word.

Visual cues to word focus in the stimuli. (A) Head gestures are decomposed into estimated yaw, pitch, and roll. Diagrams to the right of each panel illustrate the direction of rotation. These time courses were baseline corrected such that 0° represents the head yaw, pitch, and roll at the start of the sentence. For these illustrations, word durations were normalized such that each of the five words represents exactly 20% of the proportional sentence time. For eyebrow raise gestures (B), the timeline of data display includes pre-sentence time to visualize eyebrow movements before the start of the first word (this time, marked as −0.2 to 0, reflects an amount of time equal to the average duration of all words in the stimuli). In all panels, color represents which word (if any) was focused, annotations at the top indicate the time spans of words 1, 3, and 4, vertical dashed lines indicate the start of each word, and error ribbons represent S.E.M.
The second type of visual gesture in the stimulus set was an eyebrow raise that was time-locked to the focused word (Figure 2B). Eyebrow height peaked near or shortly after the onset of each focused word. However, the eyebrow raise started before the focused word, opening the possibility that this might serve as a predictive visual cue to the presence of an upcoming focused word. Additionally, when word 3 or 4 was focused, the eyebrow-to-eye distance dropped below the broad-focus level (gray) before the focused word. This “compression” of the eyebrow gesture on unfocused words may serve to accentuate the eyebrow raise gesture on the focused word, similar to the opposite-direction head turn leading up to a focused word.
Stimulus Conditions
Participants were presented with various versions of the stimulus recordings described in the previous section, designed to test the influence of visual gestures on prosody perception. On some trials, participants saw and heard the original, unedited audio-visual recordings, either with no word receiving particular emphasis (“Aud-Broad + Vis-Broad”; Figure 3A) or with word 1, 3, or 4 spoken with corrective focus (“Aud-Focused + Vis-Focused”; Figure 3B). On other trials, visual prosody cues were removed completely by pairing the auditory stimuli with a fixation cross instead of the video of the talker's face (Figure 3C). These audio-only trials could also be spoken with broad focus (“Aud-Only Broad Focus”) or corrective focus on word 1, 3, or 4 (“Aud-Only Focused”). Two prosody transplant conditions were also created to further assess visual influences on prosody perception. In the first of these, each auditory stimulus containing a focused word was spliced onto a video of the talker saying the same words with broad focus. This resulted in auditory cues indicating corrective focus being paired with visual cues indicating broad focus (Aud-Focused + Vis-Broad; Figure 3D). Finally, the opposite kind of transplant was made; auditory cues indicating broad focus were spliced onto a video with visual gestures indicating a particular focused word (Aud-Broad + Vis-Focused; Figure 3E).
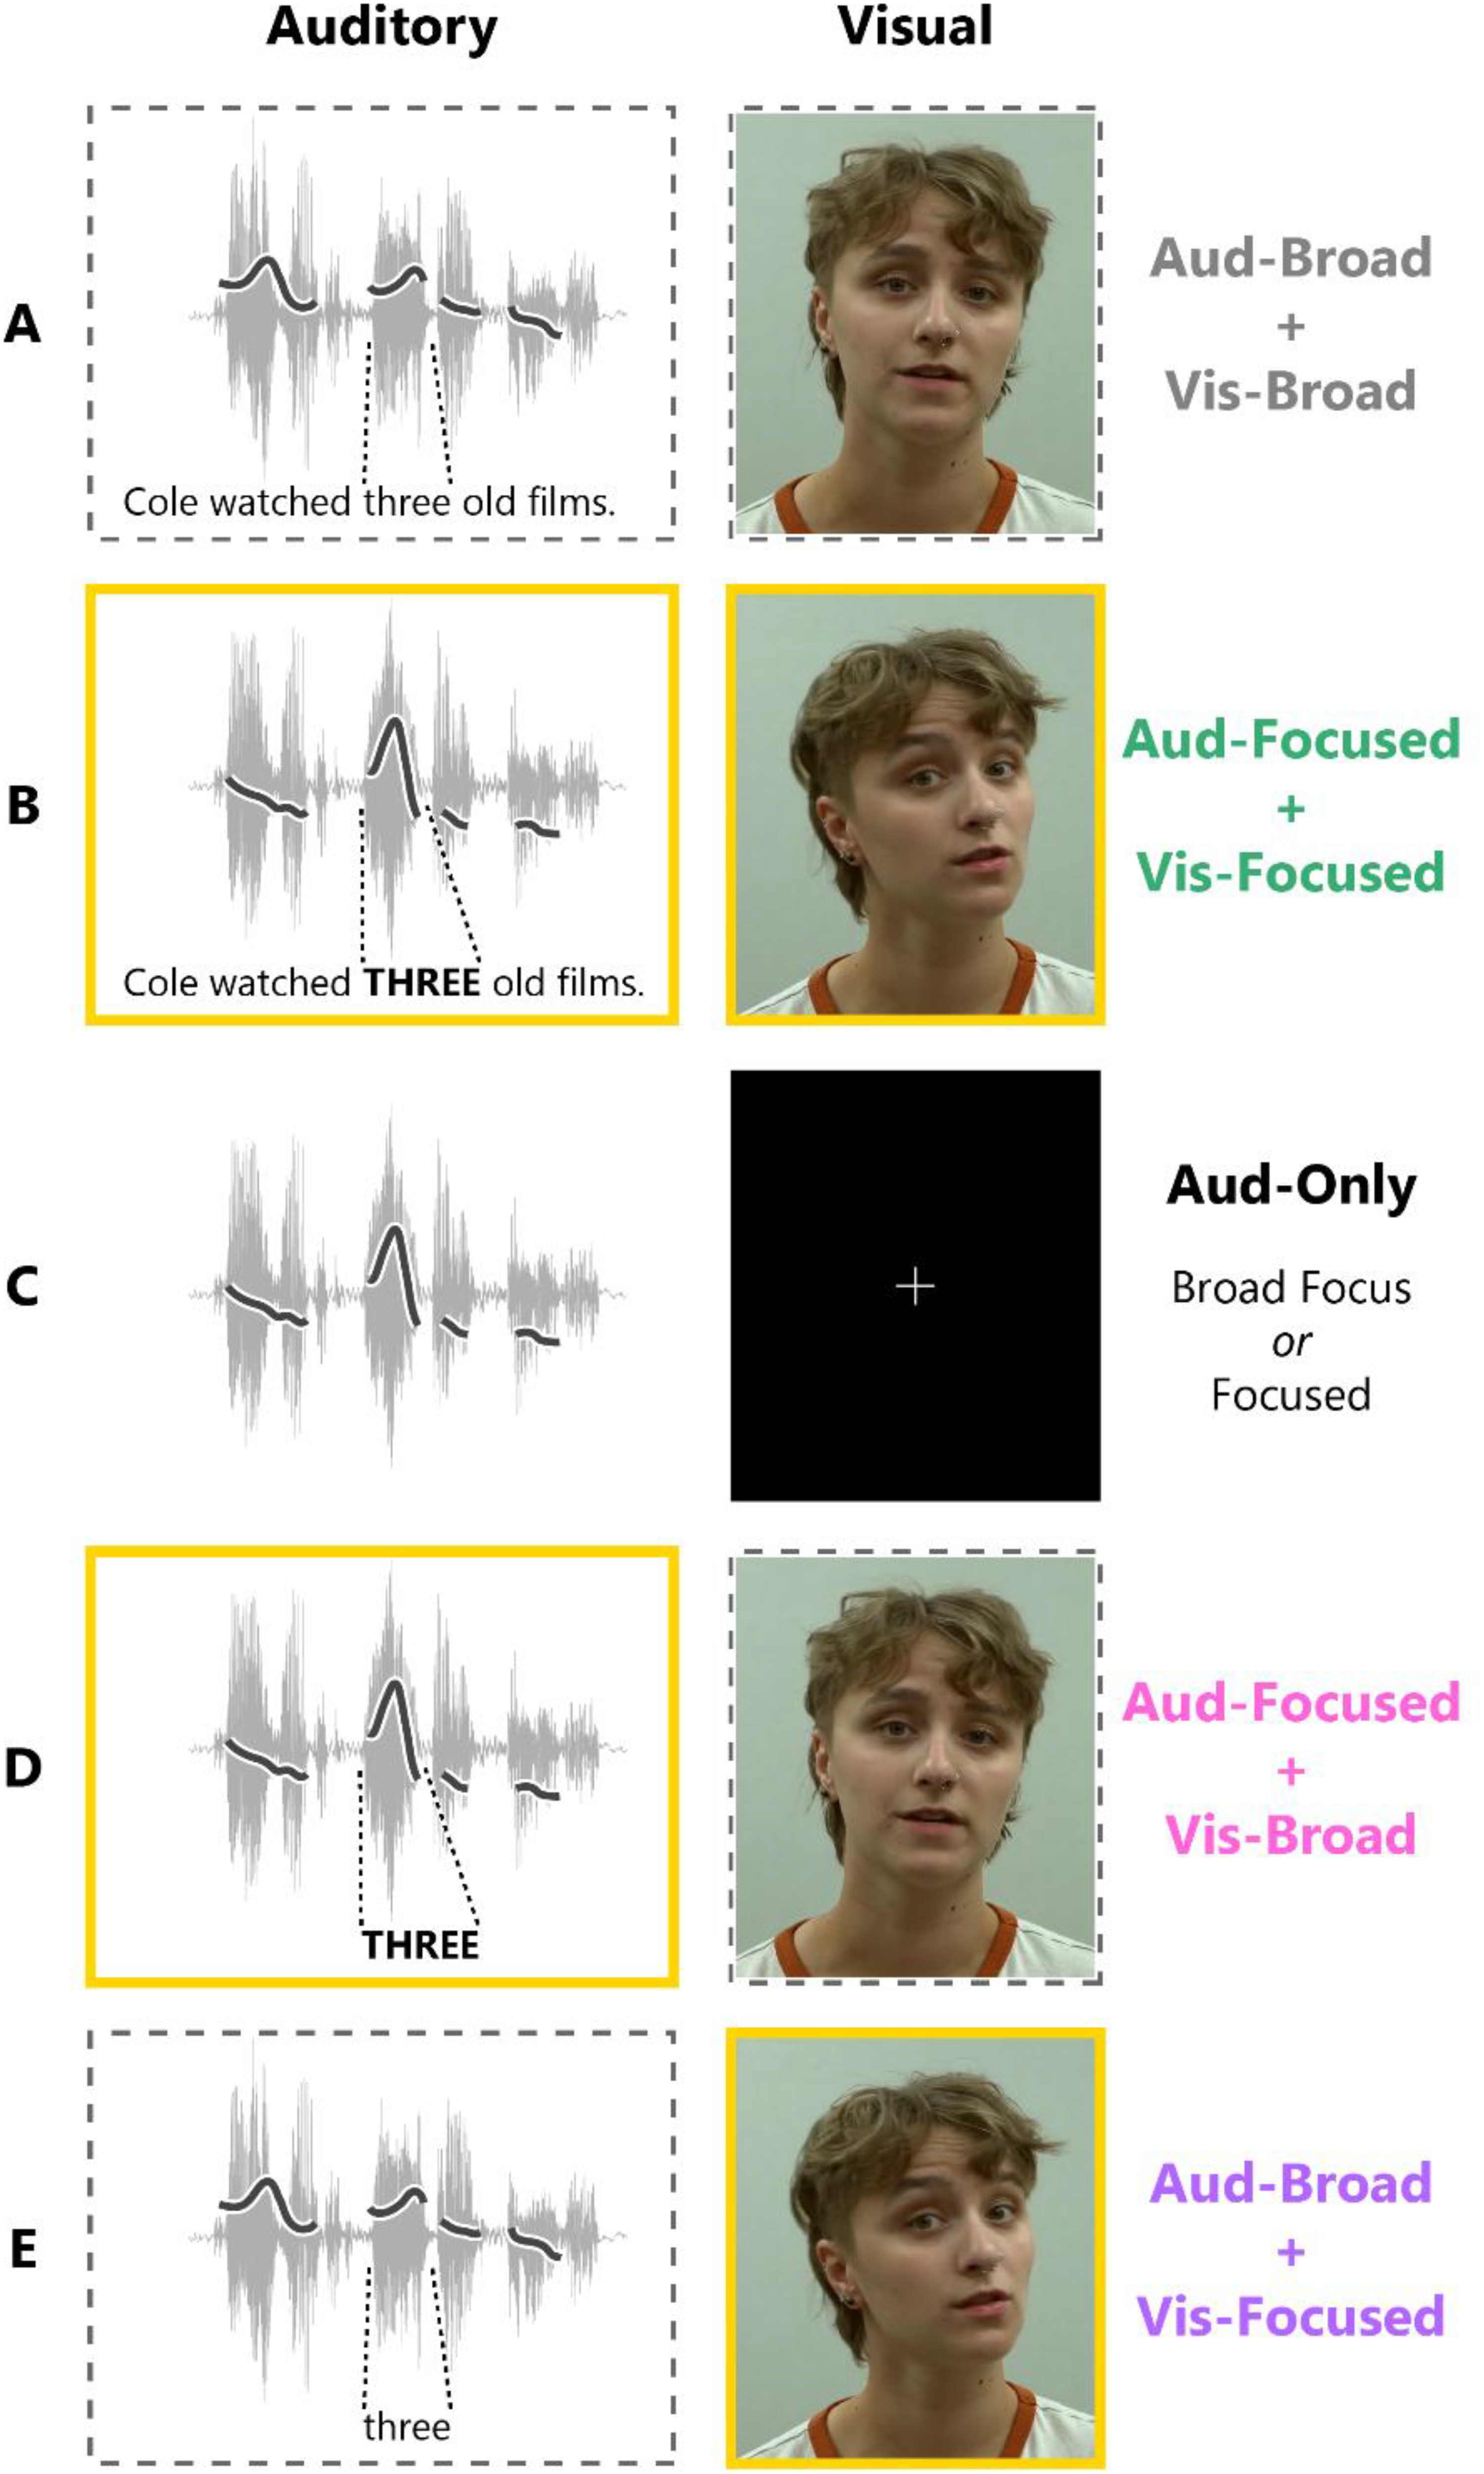
Audio-visual stimulus conditions. Auditory (left) and visual (right) stimulus components are illustrated for each experimental condition. Yellow borders indicate the presence of cues to word focus in that sensory modality, while dashed borders indicate broad-focus cues in that modality. The auditory column shows an example stimulus audio waveform, with the talker's F0 contour overlayed. Visual stimulus images are screenshots of representative frames from the stimulus videos.
It was necessary to adjust word durations to maintain audio-visual synchrony in the prosody transplant stimuli. Starting with the unmanipulated recording that would contribute the video part of the stimulus, word times were determined based on forced alignment of the corresponding audio using the Montreal Forced Aligner (McAuliffe et al., 2017). The duration of each word in the to-be-transplanted audio was then adjusted to match the audio from the video recording using the overlap-and-add resynthesis method in Praat. An additional control condition was included (“Aud-Only Duration-Warped”) to verify that any possible effects of this altered duration cue could not explain apparent influences of visual cues on prosody perception. Aud-Only Duration-Warped stimuli were created by taking Aud-Only Broad-Focus sentences and lengthening word 3 to match the duration from the corresponding stimulus with word 3 focused. This condition allowed us to test whether altering the duration cue alone could bias the F0 of mimicked prosody. This control condition was added after data collection was already underway, so it was run on 12 out of 20 participants in the CI group and 15 out of 22 participants in the TH group. The impact of this manipulation is reported in Results section titled Prosody Perception Generated by Visual Cues. In brief, duration warping did have a small effect on mimicked F0, but it could not explain the full influence of visual gestures.
Experiment Design, Setup, and Procedure
Participants completed 14 trials per focused word position (1, 3, or 4) in each condition where a word was auditorily and/or visually focused: Aud-Focused + Vis-Focused; Aud-Only Focused; Aud-Focused + Vis-Broad; and Aud-Broad + Vis-Focused. Collapsing across focused word positions, there were 42 trials in each of those conditions. There were also 14 trials each in the Aud-Broad + Vis-Broad, Aud-Only Broad Focus, and Aud-Only Duration-Warped conditions, making for a total of 210 trials. The stimuli were arranged into four premade lists, which were counterbalanced across participants. Each list was designed to have minimal stimulus overlap with the other lists, and the trial order was pseudo-randomized according to the following rules: There could be no more than three consecutive trials of the same audio-visual condition; each lexically unique sentence could be repeated no more than four times during the session; lexically unique sentences could never be repeated with the same focused word in the same audio-visual condition; there had to be at least five trials between repeats of lexically identical sentences.
Participants sat in a sound-attenuating booth with a USB condenser microphone positioned near their mouth. Sounds were played from a free-field loudspeaker (PreSonus Eris E5) immediately to the right of a visual display. After a microphone level check, participants were instructed to listen to and/or watch the stimuli, then repeat back the sentence exactly as they heard it. The experimenter emphasized that the task was not just about repeating the words, but also about mimicking the way the talker produced the sentence. A practice trial that was not in the participant's stimulus list was played to help explain the task. After that, the participant completed the 210 experimental trials split into eight blocks, with untimed breaks in between each block.
Each trial started with a screen showing the text of the upcoming sentence to limit the influence of intelligibility on task performance. We chose not to leave the text on screen throughout the trial to prevent it from interfering with the natural eye gaze strategy that participants would use to sample the visual prosody cues. After 3 s, the text was replaced with a fixation dot. The dot was on screen for 1 s, after which the audio-visual or audio-only stimulus was played. Once the stimulus concluded, a screen with an image of a microphone and instructions to “Press SPACE when done speaking” cued the participant to verbally mimic the sentence. Microphone samples were automatically captured from the soundcard until the participant pressed the spacebar. At this point, the experimenter was given the option to either accept the trial or repeat it later in the event of disfluencies in the participant's speech that would hinder acoustic analysis (e.g., coughing, forgetting one of the words, etc.). If the trial was flagged to be repeated, it was mixed back into stimulus list at a random point within the next 10 to 15 trials. Overall, 8.8% of trials were repeated (an average of 18.7 per participant). The trial repeat percentage was not appreciably different between hearing groups (9.2% CI, 8.5% TH).
Analysis of Participant Mimicry of Spoken Prosody
Analysis of participant mimicked words was similar to analysis of the stimulus acoustics (see Materials and Methods section, Analysis of Auditory Prosody Cues in the Stimuli). The primary outcome measure was the F0 contour, but the intensity of each word in the mimicked sentences was also analyzed in case CI listeners loaded their expression of word focus onto intensity rather than F0. Duration of the mimicked words was not analyzed because this cue had to be manipulated to maintain audio-visual synchrony in the prosody transplant conditions (see Materials and Methods Section, Description of Auditory and Visual Prosody Cues in the Stimulus Corpus).
The following processing steps were taken to ensure quality F0 tracking across different participant voices. After initial extraction of acoustic values in Praat, any F0 stretches shorter than four consecutive samples (out of the 31 samples each word was divided into) were considered unreliable and discarded. If no pitch contour was identified for 85% or more of a word, that entire word was discarded from later analysis. Brief jumps in F0 (a single-sample deviation of more than two times the sample-to-sample standard deviation across the trial) were corrected via linear interpolation. After these steps, all the F0 contours in the participant's dataset were plotted, and an experimenter determined whether adjustment of Praat settings might improve the F0 tracking. Typically, this involved raising the allowable F0 floor to prevent downward octave aliasing artifacts, then repeating the above processing steps. Once the F0 tracking settings were finalized, any trial still containing an F0 artifact (a jump of more than five times the sample-to-sample standard deviation across the trial, lasting more than one sample) was discarded. Across all participants, an average of 90.4% of mimicked words survived artifact rejection (maximum 99.7%, minimum 72.4%).
Word-level F0 time series data were analyzed using generalized additive mixed effects models (GAMMs). These models estimate the time course of how fixed and/or random effect terms influence nonlinear time series data. GAMMs inherently account for autocorrelation in time series data and reduce experimenter bias caused by manually selecting time windows for analysis (Baayen et al., 2017). The models can also be extended to capture difference-of-difference terms, which we used to examine how the experimental variables affected the temporal dynamics of mimicked F0, and how those variables interacted between and hearing groups (i.e., whether the influence of visual gestures was larger for one group than the other). All models in this study included fixed effect time-smooths for experimental condition (the specific conditions being compared varied between models; see Results), hearing group, and the interaction of these factors. Random time-smooths—akin to random slopes in linear mixed effect modeling—were also included for participant and participant-by-condition. Models were restricted to the middle 60% of mimicked words, as frequent word-initial and word-final unvoiced consonants meant pitch tracking data were sparse in these regions, which rendered model fits less accurate if these times were included. Specific code for GAMM implementation can be found in the OSF data repository for this project.
Results
Mimicry of Prosody Based on Auditory Cues Alone
Figure 4A shows that participants in both hearing groups were able to reliably perceive and mimic spoken prosody, even in audio-only conditions. When mimicking focused words in the Aud-Only Focused condition (black lines), participants with CIs tended to produce lower F0 peaks than participants with TH (about 4 semitones above their median F0, as compared to about 5 semitones in the TH group). Nonetheless, a GAMM fitted to these data indicated that participants in both hearing groups raised their F0 when mimicking focused words in the Aud-Only Focused condition (black) as compared to corresponding words in the Aud-Only Broad-Focus condition (gray). This difference was significant over most of the middle portion of the word, where the stimuli were consistently voiced.

Time-locked visual gestures influence prosody perception. (A) F0 time courses averaged across words 1, 3, and 4. The Aud-Only Focused (black) and Aud-Broad + Vis-Focused (purple) curves include only the focused word from each trial, while the Aud-Only Broad-Focus (gray) curve includes all three of these words from each trial. Horizontal bars above the data indicate time stretches of significant differences in the GAMM. The alternating colors of the significance bar indicate the two conditions being compared. Time regions at the edges of the word (shaded in gray) were not examined statistically. (B) GAMM estimates of the difference in mimicked F0 between the Aud-Broad + Vis-Focused condition and the Aud-Only Broad-Focus condition in each hearing group. Gold regions indicate statistical significance, the duration of which is annotated below as a percentage of the word. (C) Difference-of-difference GAMM estimate comparing visual influence between the two hearing groups (i.e., the left and right panels of B). (D) Visual influence on mimicked F0 (purple minus gray in panel A, based on the average over the middle 20% of the word) is expressed as a proportion of auditory influence (black minus gray). Gray dots represent individual participants. All error ribbons and error bars represent S.E.M. GAMM, generalized additive mixed effects model.
Prosody Perception Generated by Visual Cues
When stimulus audio lacked any acoustic cues to word focus, the presence of the head nod and eyebrow raise resulted in participants mimicking the stimuli with higher F0, confirming that visual cues generated perception of prosodic focus (Aud-Broad + Vis-Focused condition; purple in Figure 4A). This effect was statistically confirmed in both hearing groups as a stretch of time where mimicked F0 was significantly higher for visually focused words in the Aud-Broad + Vis-Focused condition compared to the corresponding words in the Aud-Only Broad-Focus condition (Figure 4B). This visual influence was stronger when gestures were paired with word 3 or 4 as compared to word 1 (see Supplemental Figure 1), perhaps because visual gestures in the stimuli (especially the head turn) were less contrastive on the first word (see Figure 2).
Visual cues to prosodic focus caused participants with CIs to increase their mimicked F0 over a longer portion of the word (significant time stretch of at least 55% of the word) compared to participants with TH (33%). On average, the influence of visual cues was also larger in magnitude in the CI group, as can be seen by comparing the left and right panels of Figure 4B. This was explicitly captured in a model term estimating the difference in the size of the visual effect (mimicked F0 in the Aud-Broad + Vis-Focused condition minus mimicked F0 in the Aud-Only Broad-Focus condition) between the CI and TH groups (Figure 4C). There was a time stretch of significant difference between hearing groups, indicating that visual cues had more influence on prosody perception for participants with CIs than for participants with TH.
Relative to TH listeners, the CI group showed a greater influence of visual cues on F0 an absolute scale and a compressed range of F0 production. To account for the joint impact of these effects, we examined the magnitude of visual influence proportional to the effect of auditory prosody cues on mimicked F0 (Figure 4D). In the CI group, the effect of visual prosody cues (average difference in mimicked F0 between the Aud-Broad + Vis-Focused condition and the Aud-Only Broad-Focus condition) was 37% as large as the same group's effect of auditory prosody cues (average difference between the Aud-Only Focused and Aud-Only Broad-Focus conditions). In other words, visual prosody gestures influenced CI listeners’ perception of F0 37% as much as an actual F0 peak in the stimuli. By comparison, the influence of visual gestures on mimicked F0 in the TH group was just 15% of the influence of auditory prosody cues. Proportional visual influence was compared between hearing groups using a permutation T-test to account for non-normal distributions. A null distribution of T-values was formed by randomly permuting the hearing group labels over 50,000 iterations, then the actual T-value was compared against this null distribution (this approach reveals the probability of the result in the analysis occurring by chance if underlying data were actually random). This permutation test revealed that visual cues had a significantly larger proportional impact on mimicked prosody in the CI group than in the TH group (actual t = 2.74, p = .005). This result still holds if the one CI participant with an especially high proportional influence of visual cues is removed (actual t = 2.70, p = .010).
To more closely examine the perception of multisensory prosody cues, we next compared mimicry of words paired with auditory or visual focus cues against mimicry of the other (unfocused) words in the same sentences. This analysis allowed us to verify that mimicked F0 increases were selective to the word with time-locked visual gestures, rather than F0 being increased overall as a result of simply seeing the talker's face (which might be notable, but would not confer support for the hypotheses). In the audio-only conditions (Figure 5, top panels), participants in both groups not only raised their F0 when mimicking the focused word, but also lowered their F0 when mimicking unfocused words as compared to broad-focus words. The latter difference reflects F0 compression of unfocused words, which was also present in the auditory stimuli (see Figure 2A). A GAMM of these data revealed that these F0 differences were statistically significant in both hearing groups and lasted for most of the word duration.

Contrastiveness of mimicked F0 driven by auditory or visual prosody cues. Grand-average F0 time courses are compared between the auditorily (top panels) or visually (bottom panels) focused word and the other unfocused words in the same sentences. All panels also show the Aud-Only Broad-Focus data as an additional comparison. Horizontal bars above the traces indicate significant time stretches in the GAMM. Each pair of lines indicates the conditions being compared. Shaded time regions were not tested in the GAMM. Error bars indicate S.E.M. GAMM, generalized additive mixed effects model.
When cues to prosodic focus were only visual in nature (Aud-Broad + Vis-Focused condition), participants raised their F0 selectively when mimicking the word that was cued visually with head and eyebrow gestures (solid purple curves in Figure 5, bottom panels). Participants did not raise F0 on the unfocused words in the same sentences (dashed purple curves), ruling out a general effect of increased F0 merely because the face was visible. In fact, in both hearing groups, the GAMM revealed a time stretch of a small but significant lowering of F0 on the visually unfocused words as compared to the same word positions in the Aud-Only Broad-Focus condition. That is, visual cues to focus on one word did not merely lead to mimicry of focus on that word, but also slight compression of the other words, consistent with the expression of prosodic cues in the natural acoustic signal despite no corresponding acoustic cues in the stimulus. This could reflect either a perceptual consequence of visual cues suggesting the word was unfocused (e.g., the eyebrow lowering or opposite-direction head turns in Figure 3), or simply a tendency produce a stereotyped F0 contour that increases contrast between focused and unfocused words. However, as will be explored later in the Results (section titled Mimicry of Fine-Grained Prosodic Detail), participant mimicry did reflect fine-grained variability in the stimuli, which argues against an account based merely on stereotyped responses.
A control condition was included to verify that the apparent effects of visual gestures could not be explained by the lengthening of the visually focused word in the auditory stimuli, which was a necessary step to preserve audio-visual alignment. In this Aud-Only Duration-Warped condition, one word was lengthened in a broad-focus sentence, without manipulating the F0 or intensity. Note that only a subset of participants performed this control condition (see Methods). F0 mimicry in this condition was compared against the Aud-Only Broad-Focus and Aud-Broad + Vis-Focused conditions (Supplemental Figure 2) using a simple linear mixed effects model of average F0 near the word midpoint (proportional times between 0.4 and 0.6). An initial model found no differences or interactions with hearing group for these conditions, so the final model collapsed across groups and had random-effects terms for participant and stimulus. This model revealed that mimicked F0 was slightly higher when repeating lengthened words in the Aud-Only Duration-Warped condition as compared to corresponding words in the Aud-Only Broad-Focus condition (β = 0.36 semitones, t = 3.09, p = .002), indicating some influence of stimulus duration on mimicked F0. However, mimicked F0 was also significantly higher when visual gestures were present (Aud-Broad + Vis-Focused condition) than in the Aud-Only Duration-Warped condition (β = 0.46 semitones, t = 2.97, p = .003), indicating that there was an additional influence of visual prosody cues that could not be explained by the duration manipulations.
Modulation of Auditory Prosody Perception by Visual Cues
The previous analyses demonstrated that visual gestures are sufficient to generate the perception of spoken prosody, especially for participants with CIs. We next asked whether visual prosody cues can modulate prosody perception when paired with words spoken with auditory cues that indicate prosodic focus. Specifically, we examined 1) whether replacing visual focus cues with visual cues indicating broad-focus disrupts the perception of auditory focus cues, and 2) whether the addition of visual gestures enhances prosody perception relative to listening alone.
Figure 6 shows mimicked F0 time courses in the three experimental conditions in which the acoustic signal always indicated the presence of a focused word. For participants with CIs, replacing video that contained complementary prosodic focus gestures (Aud-Focused + Vis-Focused; green) with video indicating that the sentence was broad focus (Aud-Focused + Vis-Broad; pink), reduced the strength of prosody perception. This is evidenced by the time stretch in which mimicked F0 was significantly lower in the Aud-Focused + Vis-Broad condition compared to the Aud-Focused + Vis-Focused condition in the CI group (Figure 6, left panel). For CI listeners, the GAMM also revealed a time stretch during which mimicked F0 was significantly higher in the Aud-Focused + Vis-Focused condition (green) than the Aud-Only Focused condition (black). This suggests that the addition of complementary visual focus cues on top of auditory focus cues slightly enhanced the perception of word focus for these participants. For the TH group, manipulating visual cues did not affect peak F0 in their mimicked reproductions of the sentences (Figure 6, right panel). The one significant stretch identified by the GAMM reflects a slight broadening of the F0 contour in the Aud-Focused + Vis-Broad condition, which might have been caused by word duration manipulations necessary to maintain audio-visual alignment in that condition.

Effects of visual gestures in the presence of auditory focus cues. Grand-average F0 time courses are shown for auditorily focused words, averaged across the three possible focused word positions (1, 3, and 4). Horizontal bars above the data indicate time stretches of significant differences in the GAMM. The alternating colors of the significance bars indicate the two conditions being compared. Gray proportional time regions were not tested in the GAMM because these regions were dominated by consonant sounds. All error ribbons represent S.E.M. GAMM, generalized additive mixed effects model.
Mimicry of Fine-Grained Prosodic Detail
The stimulus set in this study included natural variation in the F0 contour from trial-to-trial. This variability can be leveraged to explore whether participants mimicked the stimuli in a graded way, rather than categorically mapping the perceived prosody onto stereotyped verbal responses. Emergence of such stimulus-driven graded responses would provide evidence that participants did not, for example, perceive prosodic focus via intensity cues alone and then mimic the prosodic focus using a combination of intensity and F0 as would normally happen in natural speech.
Figure 7 shows that in all three conditions where acoustic focus cues were available, participants in both hearing groups scaled the peak F0 of their mimicry along with the peak F0 in the stimulus that was heard. This relationship was not significantly affected by complementary (green) or conflicting (pink) visual gestures, but in all conditions, stimulus and mimicked F0 were more tightly linked in the TH group than in the CI group (Fisher's Z > 3.1, p < .01 for all groupwise comparisons). Participants also generally undershot the highest F0 peaks in the stimulus set—that is, participants’ semitone excursion from their own individual median F0 was smaller than the semitone excursion produced by the talker in the stimuli. This undershoot pattern was more obvious among participants with CIs, who tended to produce a narrower F0 range overall.

Correlations between stimulus F0 and mimicked F0. Each point represents the peak F0 of the focused word in an individual sentence, expressed in semitones relative to the individual F0 median and averaged across participants on the y-axis. The dashed line represents exact relative mimicry of the stimulus F0. For the stimulus talker, corresponding F0 values in Hz are shown below the x-axis.
The correlations shown in Figure 7 were also analyzed separately for each participant (collapsing across the three stimulus conditions) as a measure of an individual's ability to hear and mimic prosody in a nuanced way (see Supplemental Figures 3 and 4). We used this individual metric to examine whether participants who were more accurate at mimicking acoustic cues might be less reliant on—and therefore less influenced by—visual prosody cues. Figure 8A shows the relationship between the accuracy of acoustic mimicry (x-axis) and the extent to which visual gestures transplanted onto broad-focus audio influenced mimicked F0 (y-axis). The y-axis values were obtained for each participant by taking the difference in mimicked F0 between the Aud-Broad + Vis-Focused condition and the Aud-Only Broad-Focus condition, averaged over a central region of the word (proportional times between 0.45 and 0.58). This relationship appeared nonlinear in the CI group, so we analyzed it with Spearman rather than Pearson correlation. There was a significant negative correlation in the CI group (ρ = −0.639, p = .002), which remained significant if the two CI participants with most accurate mimicry (rightmost two points) were removed (ρ = −0.532, p = .023). This indicates that CI users who were more accurate at mimicking the acoustics of individual stimuli were less influenced by visual prosody cues. As another way of examining this relationship, note that the three CI participants with most accurate acoustic mimicry were three of the four least influenced by visual cues (blue box in Figure 8A). Conversely, the larger influence of visual cues among CI listeners at the group level appears to be driven by a cluster of CI participants who did not accurately scale their mimicked F0 with the stimulus acoustics (orange box).

Factors that explain visual influence and audio-visual benefit. Each point represents a participant-average value. Panel (A) shows the relationship between acoustic mimicry accuracy (x-axis) and the influence of visual gestures (y-axis). The x-axis is collapsed across the three conditions in Figure 7, as visual condition did not affect the relationship between stimulus F0 and mimicked F0. The blue and orange boxes are referenced in the text. Panel (B) shows the relationship between the influence of transplanted visual gestures (x-axis) and the benefit from complementary visual gestures matching the acoustic prosody (y-axis).
For participants with CIs, transplanted visual gestures clearly influenced prosody perception (Figure 4), but there was only slight enhancement of prosody perception from complementary visual gestures paired with matching auditory cues (Figure 6, though see the Discussion for conditions that would likely reveal a larger visual benefit). Despite the different strengths of these effects, the degree to which CI users’ prosody perception was influenced by visual gestures transplanted onto broad-focus audio (x-axis of Figure 8B) was related to the amount of perceptual enhancement received from complementary visual cues that matched an auditorily focused word (y-axis). Both axes in this figure are based on differences between participant-average F0 contours, averaged over a middle portion of the word (proportional times of 0.45 to 0.58). The correlation between visual influence and visual benefit was statistically significant within the CI group, but not the TH group.
Effects of Visual Prosody Gestures on the Intensity of Mimicked Words
Participants expressed prosodic focus in their mimicry not only by increasing F0, but also by increasing the level of their voice when repeating focused words. Figure 9 shows the average level difference between mimicked focused words and other (unfocused) words in the sentence across the experimental conditions in which auditory and/or visual focus cues were present (i.e., not broad-focus sentences, where there is no focused/unfocused contrast). Participants in both groups not only mimicked the intensity contrast that was present in the actual acoustic component of the stimuli (green, black, and pink data points), they also produced increased intensity on words that were focused only by visual gestures without any acoustic F0 cue for focus in the stimulus (purple data points representing the Aud-Broad + Vis-Focused condition).

Intensity of mimicked stimuli. Values above 0 indicate that participants repeated focused words at a higher level than unfocused words. Error bars represent S.E.M.
A repeated-measures ANOVA computed on these data revealed a significant main effect of condition (F = 11.9, p < .001), which was driven by less contrastive mimicked level cues when only visual focus cues were present (Aud-Broad + Vis-Focused condition; purple), as expected. There was also a significant main effect of hearing group (F = 6.54, p = .012), reflecting the generally less contrastive mimicked level cues in the CI group (open triangles lower than filled circles). Although the interaction between these factors was not statistically significant, the effect of hearing appeared qualitatively different between the three conditions containing auditory focus cues (green, black, and pink) and the condition containing only visual focus cues (purple). We therefore conducted a follow-up ANOVA using the presence or absence of auditory cues as a predictor rather than the four-way condition contrast; this effectively collapsed across the Aud-Focused + Vis-Focused, Aud-Only Focused, and Aud-Focused, Vis-Broad conditions. This auditory cue factor interacted significantly with hearing status (F = 4.95, p = .03), reflecting the fact that the expression of prosody via mimicked intensity by the CI group was relatively weaker, except when it was driven by visual cues. This is consistent with the trend from the F0 data of visual gestures having a larger influence on prosody perception among participants with CIs than participants with TH.
Discussion
Using a vocal mimicry task, this study examined the influence of time-locked visual gestures on the perception of spoken prosody, both for participants who use CIs and those with TH. A key stimulus condition featured audio containing no focused word combined with video containing head and eyebrow gestures time-locked to one word. When mimicking such sentences, participants raised their F0 and intensity on the visually focused word, indicating that they perceived the visual gestures in the stimuli as prosody. The effects of visual prosody cues were expressed more strongly for the CI group than the TH group on an absolute semitone scale despite reduced F0 variation overall in the CI group, meaning there was a substantially larger effect of visual cues for the CI group especially when contextualized within their regular speaking patterns. The increased role of visual cues in the current experiment is consistent with previous studies showing larger benefits of visual cues in terms of intelligibility (Puschmann et al., 2019) and reduced listening effort (Fleming & Winn, 2025) among CI listeners compared to TH listeners. Further, participants in both groups were able to mimic subtle variations in the prosodic contour at the level of individual stimuli, though mimicry was generally more accurate among participants with TH. In the CI group, the participants with the least accurate mimicry of acoustic variability in the stimuli tended to be the most influenced by visual prosody cues. Below, we summarize the results in support of the five specific hypotheses laid out in the Introduction:
Although CI participants in this study could reliably hear the difference between stressed words and words in broad-focus sentences, they produced less contrastive mimicry of audio-only focused words compared to participants with TH. In sentences with no word focused (i.e., broad focus), the presence of visual gestures of the head and eyebrows linked with specific words resulted in mimicry of those words with relatively higher F0 and higher intensity compared to audio-only presentation. This indicates that visual cues alone can When time-locked visual gestures that matched the auditorily focused word were replaced with video from an utterance without any prosodic focus, participants with CIs lowered their mimicked F0. This indicates a Participants with CIs mimicked prosodically focused words with slightly higher F0 when visual gestures were present than when the stimuli were audio-only, suggesting the potential for visual cues to The overall pattern of results indicates that visual cues play a more substantial role in prosody perception for individuals who use CIs than those with TH.
Factors Affecting the Importance of Visual Gestures
The current study demonstrated that visual gestures influence prosody perception in the absence of clear acoustic cues to prosodic focus (i.e., when the audio was broad focus). However, when acoustic cues to word focus were present, the addition of complementary visual gestures enhanced prosody perception only slightly for listeners with CIs, and not at all for those with TH. In contrast, a recent study using simulated auditory and visual prosody cues found that audio-visual cues to prosody were influential to both listeners with TH or CIs (Meister et al., 2025). This difference can be reconciled by considering the acoustic prosody cues available in the two studies. Whereas the talker in the current study produced an F0 excursion of 100 Hz or more, the largest F0 excursions presented to CI and TH participants by Meister et al. had means of 40 Hz and 10 Hz, respectively. Therefore, it is reasonable to suspect that the TH participants in that study were compelled to use visual cues as a result of the artificially reduced acoustic information, rather than as a reflection of a strategy generalized to natural speech. In the current study, we prioritized maintaining natural prosody cues in our stimulus set to increase generalizability of the results to everyday listening in quiet conditions (although individual talkers might vary in the clarity of their visual gestures relative to the talker recorded for the current study). Toward this end, our stimuli also intentionally included trial-to-trial variability, both in the magnitude of audio-visual prosody cues and in the lexical content of the sentences. This was done to prevent overestimation of prosody perception ability based on repeated exposure to consistent patterns in the stimuli.
For participants with CIs, an individual's reliance on visual prosody cues appears to be inversely related to their ability to perceive acoustic prosody. CI participants who were less accurate at mimicking fine-grained acoustic differences at an individual stimulus level tended to be more influenced by visual gestures in their mimicry (Figure 8A). We note that this analysis was enabled by preserving the natural variability of speech rather than imposing a consistent idealized F0 contour on the stimuli. Considering the CI participants in this study were generally high-performing, with some baseline ability to hear and mimic audio-only prosody (two participants were disqualified based on this criterion), it is likely that lower-performing or more recently implanted CI users might show even more reliance on visual cues for prosody perception. This result can be viewed as consistent with the principle of inverse effectiveness (PoIE), which states that multisensory inputs strengthen neural responses and/or improve behavioral outcomes more when their unisensory components are weak or unreliable. Although the ubiquity of the PoIE is debated (Holmes, 2007, 2009), empirical support for it has come from several audio-visual tasks using speech (Crosse et al., 2016; Stevenson et al., 2012; van de Rijt et al., 2019) and nonspeech (Corneil et al., 2002; Senkowski et al., 2011) stimuli. In this study, the PoIE applies both to the strength of prosody cues in the stimuli (with larger F0 peaks limiting visual effects) and to an individual's capacity to hear and mimic those cues (with worse audio-only performers experiencing more benefit).
Many challenges of real-world listening are likely to magnify the importance of visual cues in CI users’ perception of prosody beyond what is suggested by the current results. For one, our stimuli were presented in quiet. The envelope modulations corresponding to F0 that are available to CI listeners are severely degraded by even modest amounts of noise. As a result, background noise is likely to present particular challenges to prosody perception for CI listeners, though this problem has been largely overlooked in the literature as noted in a recent review by Karimi-Boroujeni et al. (2023). Even in ideal listening conditions, pitch perception based on pure temporal cues available through a CI (with no contribution of harmonic or place pitch cues) has an upper limit of around 300 Hz (Baumann & Nobbe, 2004; Carlyon et al., 2010, 2025; Shannon, 1983; Townshend et al., 1987; Zeng, 2002). The functional upper limit for perceiving F0 in real speech is likely further constrained, because the input would be delivered onto multiple electrodes with overlapping areas of neural stimulation and with staggered activation schedules (see Carlyon et al., 2025 for extensive discussion of these issues). This likely creates additional challenges for perceiving prosody in the voices of some women and children with high F0 s. While our talker's F0 often peaked above the 300 Hz limit, their median F0 was likely low enough to allow CI listeners to hear the rising and falling edges of the pitch contour, whether through periodic amplitude modulations or through the crossing of the lowest harmonic from one channel into another. The ability of visual cues to provide additional support when prosody perception is challenged by noise or talkers with high F0 should be investigated in future research.
Interpretation of the Prosody Transplant Conditions
Some of the key results in this study came from prosody transplant conditions, in which auditory and visual stimuli were combined from prosodically different utterances of the same words. The goal of these conditions was to isolate the contributions of word focus cues in the visual modality while holding cues in the auditory modality at a constant, uninformative level (broad focus). Although such decoupling of auditory and visual prosody gestures would be atypical in natural speech, there is no physiological restriction that visual gestures must accompany spoken prosody or vice versa (i.e., it is possible to produce prosodic focus acoustically without corresponding gestures of the head or eyebrows). This is in contrast to explicitly illusory paradigms like the McGurk effect (McGurk & Macdonald, 1976), in which the participant must reconcile physiologically incompatible auditory and visual speech signals. There is growing awareness that such illusory paradigms are limited in their ability to generalize to communication in real life, and as such should not be used as a stand-in for audio-visual speech perception at large (Alsius et al., 2018; Van Engen et al., 2022).
Although the prosody transplant conditions in our study were artificially constructed, we also found evidence that they were related to visual cue usage under more natural conditions. Specifically, participants with CIs who were more influenced by visual gestures in the Aud-Broad + Vis-Focused condition (i.e., those who translated visual gestures into acoustic prosody) tended to benefit more from complementary visual gestures in the natural audio-visual recordings (Figure 8B). In other words, effects of transplanted visual gestures in the Aud-Broad + Vis-Focused condition seem to tap into an individual's general ability or willingness to rely on visual prosody cues, which predicts the capacity of those visual cues to improve prosody perception.
Vocal Mimicry as a Tool to Assess Prosody Perception
The vocal mimicry task has several properties that make it an appealing tool for prosody perception research. For one, mimicked responses are not bounded by explicit floor or ceiling effects, as the task generally does not require the participant to approach the upper or lower limits of acoustics they can produce (F0, intensity, etc.). In the present study, this advantage allowed us to use stimuli with naturalistic prosody cues, rather than artificially constraining the auditory or visual cues available to avoid ceiling effects in forced-choice tasks. While our data still indicate some practical ceiling effects—for instance, visual cues do not enhance prosody perception for TH listeners who can already perceive it clearly—this reflects the genuine limit of visual cue utility, rather than a ceiling effect imposed by the ability of the task to detect subtle auditory or visual cues in repeated stimuli.
Vocal mimicry produces graded outcome measures, which allow for nuanced analyses that are not possible with all-or-nothing responses. For example, a listener might perceive some degree of prosodic focus on multiple words (based on either auditory or visual cues), which would not be captured by a task that requires the participant to select only the most focused word. This perceptual competition might cause temporary confusion that would be disruptive in everyday communication but not reflected in categorical responses. Perhaps more importantly, granular responses enable the exploration of whether a listener is sensitive to slight variations in prosodic expression. In the current study, there were graded correlations between the degree of prosodic focus in the stimuli and in the mimicked responses. A similar result was reported by Wheeler and Winn (2025), in which participants heard sentences with one of the words spoken with contrastive focus, then used a continuous slider scale to rate the degree of focus they perceived on one or more words. In that study, there was a correlation between the height of the F0 peak on a focused word in the stimulus and the amount by which participants raised the slider in response to that word, for TH but not CI listeners. The correlation between stimulus and participant response was stronger in the current mimicry study (and significant for CI listeners), perhaps suggesting that the translation of auditory perception to a hand-guided slider response places an extra barrier between perception and response compared to speech mimicry. Nonetheless, both methods provide granular measures of prosody perception, and the interface used by Wheeler and Winn produces data that are simpler to collect and analyze.
Finally, the challenge of measuring prosody perception via mimicked F0 contours must be contextualized by previous observations of reduced variability in voice pitch among CI users (Hawthorne, 2024). Although this could have potentially complicated the current results if the CI group expressed smaller or equal influence of visual cues compared to the TH group, the actual results showed greater change in F0 expressed in the CI group. The potential for individual differences in prosody production ability highlights the importance of prioritizing within-subject comparisons when using vocal mimicry as an outcome measure.
Conclusions
Naturally occurring gestures of the talker's head and eyebrows contribute directly to prosody perception for listeners who use CIs. These participants mapped perception of time-locked visual gestures onto stronger productions of acoustic prosodic focus when mimicking speech. Given the availability of these visual cues in many everyday situations, this result indicates that CI users’ prosody perception cannot be fully understood without considering the joint contributions of auditory and visual cues. Additionally, the CI listeners whose mimicry was most influenced by visual gestures were generally ineffective at mimicking nuanced acoustics of the stimulus prosody. This suggests that visual gestures might be more important for worse-performing CI users, or perhaps in adverse listening conditions. Finally, this study demonstrates the feasibility of using vocal mimicry to obtain objective, granular measures of prosody perception.
Supplemental Material
sj-docx-1-tia-10.1177_23312165261437901 - Supplemental material for Visual Gestures of the Head and Eyebrows Support Prosody Perception for Individuals with Cochlear Implants
Supplemental material, sj-docx-1-tia-10.1177_23312165261437901 for Visual Gestures of the Head and Eyebrows Support Prosody Perception for Individuals with Cochlear Implants by Justin T. Fleming, Harley J. Wheeler and Matthew B. Winn in Trends in Hearing
Footnotes
Funding
The authors disclosed receipt of the following financial support for the research, authorship, and/or publication of this article: This work was supported by the National Institute on Deafness and Other Communication Disorders, (grant number F32DC021847, R01DC017114, R21DC021495).
Declaration of Conflicting Interests
The authors declared no potential conflicts of interest with respect to the research, authorship, and/or publication of this article.
Data Availability
Processed data, analysis code,scripts for generating figures, and a corresponding README guide are available in the Open ScienceFramework (OSF) repository for this project. It can be found at https://doi.org/10.17605/OSF.IO/74M2U (Fleming, 2025).
Supplemental Material
Supplemental material for this article is available online.