
Abstract
Implicit learning is thought to play an important role in speech recognition under challenging conditions. However, auditory deprivation has been proposed to influence implicit learning, including in the visual modality, although evidence in adults with post-lingual deafness is limited. Therefore, we investigated implicit visual learning and its associations with speech recognition in adults with post-lingual deafness who use cochlear implants (CIs). Thus, this study focuses on the effects of late auditory deprivation rather than on the effects of early deprivation associated with congenital deafness. Adult CI users (n = 30) and a group of individuals with normal hearing (NH, n = 36) completed two implicit visual learning tasks (statistical and perceptual), a battery of challenging speech recognition tests and cognitive measures (vocabulary, working memory, attention, and verbal processing speed). NH listeners demonstrated significant visual statistical learning, whereas CI users showed a similar but nonsignificant pattern. In the visual perceptual learning task, both groups exhibited comparable learning effects. In CI users, visual statistical learning contributed to the recognition of speech in noise (words and sentences). Visual perceptual learning only contributed to the recognition of words in noise. The current findings are inconsistent with the idea that auditory deprivation beyond the sensitive period interferes with visual learning. Rather, in CI users, visual implicit learning contributes to the recognition of challenging speech. Therefore, future work might investigate whether visual learning in CI candidates is predictive of postimplantation milestones.
Keywords
Introduction
Implicit learning is a process that leads to the development of nondeclarative memories and occurs automatically and unintentionally across sensory modalities (Pisoni & McLennan, 2016; Squire & Dede, 2015). It has been proposed to contribute to speech recognition in challenging listening conditions among individuals with normal hearing (NH) by affording predictions of upcoming speech input based on long-term knowledge about the statistical structure of speech and online learning of the current input (Conway et al., 2010; Khayr et al., 2023; Neger et al., 2014). For example, implicit statistical learning (SL) of a visual color sequence and of an auditory nonword sequence were found to correlate with the recognition of degraded sentences. This was true even after controlling for sources of variance associated with intelligence, working memory, attention, inhibition, and knowledge of vocabulary and syntax (Conway et al., 2010). Likewise, Neger et al. (2014) demonstrated a relationship between visual SL (assessed with an artificial grammar learning serial reaction time paradigm) and individual differences in the recognition of vocoded speech. In the current study we ask whether implicit visual learning can explain individual differences in speech recognition in cochlear implant (CI) users.
Perceptual learning, a form of implicit learning, is defined as a lasting improvement in the ability to extract information from the environment as a result of experience or practice (Green et al., 2018). Of interest to the current study is task irrelevant visual perceptual learning (TIPL). This type of learning occurs when training on a specific task leads to improved processing of an unrelated stimulus, one that was not consciously attended during the training phase (Seitz & Watanabe, 2005). One method to induce this type of learning is by presenting two streams of stimuli simultaneously and directing participants to focus on and respond only to targets in one stream. The learning is reflected in enhanced recognition of unattended items from the other stream that were presented at the same time as the attended targets (Protopapas et al., 2017). In individuals with NH, this type of learning is associated with various aspects of language, such as language acquisition, non-native speech learning, orthographic processing (Hulstijn, 2013; Protopapas et al., 2017; Saffran et al., 1997), as well as with speech processing and recognition (Khayr et al., 2023; Vlahou et al., 2012).
Visual SL is another form of implicit learning that supports learning of patterns and sequences. It reflects the ability to learn to extract regularities across stimuli by detecting the probabilities with which properties co-occur with no explicit awareness of those regularities and with no instruction to learn (Misyak & Christiansen, 2012). In common SL paradigms participants are passively exposed to strings generated by artificial grammar or continuous sequences of nonwords from an artificial lexicon. Following this brief exposure participants can incidentally acquire knowledge about the predictive relations embedded within the stimuli (Gómez & Gerken, 2000; Saffran, 2003). SL occurs beyond individual stimuli and plays a role in speech recognition (Conway et al., 2007). This sensitivity to predictive relations is thought to support speech recognition by enabling listeners to anticipate upcoming linguistic input based on learned regularities, particularly when the auditory signal is degraded (Conway et al., 2007). A number of studies showed that individual differences in SL are associated with individual differences in speech recognition in listeners with NH (Conway et al., 2010; Misyak & Christiansen, 2012; Misyak et al., 2010; Theodore et al., 2020).
Visual Implicit Learning, Auditory Deprivation, and Cross-Modal Plasticity in CI Users
Within the CI population, visual implicit learning has primarily been investigated in deaf-born children (Arfé et al., 2017; Fastelli et al., 2021; Hall et al., 2018; Klein et al., 2019; Von Koss Torkildsen et al., 2018). It has been hypothesized that early auditory deprivation due to deafness has an adverse impact on SL, even in the visual modality (Conway et al., 2011b; Conway et al., 2009). According to this Auditory Scaffolding hypothesis, early exposure to sound plays a crucial role in the development of domain-general neurocognitive systems responsible for encoding, maintaining, and retrieving temporal and sequential data from the environment (Conway et al., 2009). Consequently, auditory deprivation in infancy can have far-reaching impacts on the maturation of these neurocognitive networks, potentially affecting the ability to process information beyond the auditory domain (Kral et al., 2016). Some studies showed impairments in sequence learning and processing and disruptions in motor sequencing among deaf children with CIs (Conway et al., 2011a; Conway et al., 2011b; Gremp et al., 2019; Ulanet et al., 2014), and in children with peripheral hearing loss (Studer-Eichenberger et al., 2016). In adults, only one study documented impaired sequence learning in both pre-lingual deaf adults with and without hearing aids and post-lingual CI users (Lévesque et al., 2014). Nevertheless, a series of studies challenged the Auditory Scaffolding Hypothesis by showing that deaf children with CIs do not differ from typically hearing children in their implicit learning of regularities (Arfé et al., 2017; Fastelli et al., 2021; Hall et al., 2018; Klein et al., 2019; Von Koss Torkildsen et al., 2018). Similar findings were also evidenced in pre-lingual deaf adult signers (Giustolisi & Emmorey, 2018; Iversen et al., 2015).
Although the literature on the impact of auditory deprivation on visual implicit learning primarily centers on early auditory deprivation, post-lingually deaf individuals constitute an increasingly growing portion of those seeking cochlear implantation (Stropahl et al., 2017). Furthermore, many of those individuals have been losing their hearing gradually, suffering from a prolonged period of (partial) auditory deprivation before being diagnosed. While there is no direct research on the effects of late auditory deprivation on visual implicit learning, research have been directed toward studying cortical changes following late auditory deprivation and the restoration of hearing through cochlear implantation (Chen et al., 2016; Fullerton et al., 2023; Stropahl et al., 2017). Sensory deprivation can induce cross-modal cortical alterations (Chen et al., 2002; Kral & Sharma, 2012). Cross-modal plasticity refers to the process where neurons adapt by shifting their responses from a deprived sensory modality to a nondeprived one. In the auditory system, this phenomenon occurs in varying levels of auditory deprivation and may sometimes reverse in cases of hearing loss that develops in adulthood (Kral & Sharma, 2023). However, the dynamics of cross-modal plasticity in individuals experiencing late-onset auditory deprivation remains uncertain, and its potential impact on speech recognition after cochlear implantation is unclear (Anderson et al., 2017; Fullerton et al., 2023; Gransier et al., 2020; Luke et al., 2015; Stropahl et al., 2017).
Speech Recognition and Visual Implicit Learning in CI Users
The few studies on the connections between cross-modal plasticity and speech recognition in post-lingual CI users reported various patterns of associations (Stropahl et al., 2017). On the one hand, some studies have observed a correlation between increased cross-modal activity with visual stimuli and decreased speech recognition in post lingual CI users (Chen et al., 2016; Sandmann et al., 2012). This association could imply that the visual dominance over the auditory cortex after hearing loss might hinder the potential for functional improvement following implantation (Stropahl et al., 2017). On the other hand, other studies revealed positive correlation between cross-modal activity in the auditory cortex with visual stimuli and speech recognition in post-lingual CI users (Fullerton et al., 2023; Stropahl et al., 2015). As communication in everyday situations frequently involves the integration of multiple senses, it's possible that CI users experience enhanced speech recognition through the engagement of visual areas or by utilizing the auditory cortex for aspects of nonverbal communication (Stropahl et al., 2017).
Many post-lingual CI users rapidly adapt to their implants and achieve high levels of speech recognition (Blamey et al., 2012; Holden et al., 2013; Moberly et al., 2016), despite the inherent impact of hearing loss on the integrity of their auditory pathways and the reduced signal quality due to CI technology limitations (Wilson, 2015). While the assessment of brain activation falls beyond the scope of this study, the positive correlation between cross-modal activity in the auditory cortex with visual stimuli and speech recognition in post-lingual CI users, as observed in certain studies (Fullerton et al., 2023; Stropahl et al., 2015), is consistent with our hypothesis regarding the involvement of visual implicit learning in the recognition of challenging speech among this population. Thus, CI users who display better speech recognition abilities are also expected to demonstrate higher visual implicit learning skills.
SL has been proposed to afford the predictions that are central to speech recognition, particularly under challenging listening conditions (Conway et al., 2010; Misyak & Christiansen, 2012). Because speech perception relies on the ability to anticipate upcoming linguistic information based on previously encountered regularities, SL may facilitate recognition when the auditory signal is degraded and less reliable (Conway et al., 2010). This framework is especially relevant for CI users, who must recognize speech based on a degraded auditory signal. While the role of predictive mechanisms in speech recognition has been demonstrated in listeners with NH (Conway et al., 2010; Theodore et al., 2020), it remains unclear whether implicit learning abilities, assessed here using visual statistical and perceptual learning tasks, contribute to individual differences in speech recognition outcomes in post-lingual CI users.
Aims of the Study
Given the hypothesis that late auditory deprivation might influence visual implicit learning, which has been associated with speech recognition in the hearing population, in this study we targeted implicit visual learning in post-lingual deaf CI users and addressed two key issues. First, we sought to characterize implicit visual learning in post-lingual deaf CI users in comparison to participants with typical hearing. For this purpose, we included an age-matched NH group for comparison. We hypothesized that, even if post-lingually deaf CI users would exhibit implicit visual learning, this learning could be influenced by their history of late auditory deprivation. If late auditory deprivation affects implicit visual learning, CI users would exhibit reduced learning compared to NH listeners; if it does not, no group differences would be expected. Second, SL has been proposed to support predictive processing mechanisms that are central to language comprehension. Because speech perception relies on the ability to anticipate upcoming linguistic information (Conway et al., 2010), particularly in degraded listening situations such as those experienced by CI users, individuals with stronger SL abilities may be better equipped to generate predictions that facilitate comprehension. Whether this is the case in CI users is unclear. Nevertheless, some post-lingual CI users achieve high levels of speech recognition despite a period of late auditory deprivation and the constraints induced by hearing loss and the CI technology. Therefore, we examined the relationship between implicit visual learning and speech recognition in post-lingual CI users. Listeners with typical hearing were not included in this analysis because the speech tests were selected for CI users and ceiling effects were expected in NH listeners. Based on the literature on cross-modal plasticity a positive association was expected.
From a theoretical standpoint, exploring the contribution of visual implicit learning to the recognition of degraded speech in CI recipients will help us better understand the processes CI recipients apply when recognizing degraded speech. From a clinical standpoint, understanding the contribution of visual implicit learning to speech recognition will lead the way toward possible integration of a visual implicit learning index in the pre-implantation evaluation. This is turn could serve as a method for establishing postimplantation rehabilitation goals and benchmarks for CI candidates expected to benefit from postimplantation support.
Materials and Methods
Participants
Participants (the same as in Khayr et al., 2024) were 72 adult Hebrew speaking participants, 36 CI users and 36 NH individuals who met the following criteria. (a) High school education or higher, (b) Hebrew as first or primary language, (c) neurologically intact, and (d) normal or corrected to normal visual acuity and color vision. All participants in both groups were naïve to the purposes of the study. All aspects of the study were approved by the ethics committee (419/19) and the Institutional Review Board (0094-19-BNZ). NH participants (11 men, 25 women; age range 36–77 years, M = 52 ± 11) were recruited through social media and were required to have NH thresholds (mean 4 frequency 0.5, 1,2, and 4 kHz pure tone average, PTA, in both ears ≤ 25 dB HL). The NH group served as a comparison group for the visual implicit learning tasks, allowing us to assess whether CI users demonstrated preserved learning relative to individuals with typical hearing. NH speech recognition data were collected to confirm that the speech materials were appropriately challenging for CI users and were expected to yield ceiling performance in NH listeners; therefore, no between-group hypotheses were formulated for speech outcomes. CI users were recruited from the Cochlear Implant Program at Bnai-Zion Medical Center, Haifa, Israel, and met the following inclusion criteria (1) post-lingual onset of hearing loss, (2) a score greater than 60% in the Hebrew version of the AzBio sentences in quiet, and (3) a minimum of 6 months of CI usage following implantation.
Six CI users were excluded from the study as they did not meet the inclusion criteria due to pre-lingual onset of hearing loss. The final study CI group included 30 participants (12 men, 18 women; age range 35–77 years, M = 55 ± 13) who met all inclusion criteria. They had varying underlying etiologies of hearing loss and ages of implantation. The mean age at onset of hearing loss was 23 years (SD = 14). All CI recipients reported onset of hearing loss after the age of 3 years, meaning they were post-lingually deaf and had relatively normal language development prior to the onset of hearing loss. All participants experienced early hearing aid intervention and auditory-only language development during childhood, were mainstreamed in education, and experienced progressive hearing losses into adulthood. All participants received their implants at or after the age of 24 years, with a mean age at implantation of 49 years (SD = 13). Mean duration of hearing loss (computed as age at first CI minus self-reported age at onset of hearing loss) was 26 years (SD = 13). All had used their implants for at least 6 months, with a mean duration of CI use of 7 years (SD = 5). Of the 30 participants, 14 were bilateral, 15 were bimodal, and only 1 participant had a unilateral CI with unaided contralateral ear. Mean unaided better-ear pure tone average (PTA, 0.5, 1, 2, and 4 kHz) in the unilateral and bimodal recipients was 88 dB HL (SD = 16). Ten participants were implanted with the Advanced Bionic device, 14 with Cochlear and 6 with Med-El. Participants had CI-aided thresholds that were better than 30 dB HL at 0.25, 0.5, 1, and 2 kHz, as measured by clinical audiologist at the beginning of the study.
Study Administration
Participants who met the inclusion criteria in both groups received a brief explanation about the procedure, signed a written informed consent and completed a short background questionnaire. Participants then completed, in one testing session with two short breaks, the test battery that included speech recognition tests in challenging conditions, cognitive measures, and two visual learning tests (statistical and perceptual). The tests were administered in random order and participants were compensated for their time. For CI users, all tests were administered in the participant's best aided condition; implant in one ear and a hearing aid on the other (bimodal recipients), two CIs (bilateral recipients) or with only a CI in one ear (unilateral recipients). Speech recognition testing and the rapid auditory perceptual learning test were conducted in a double walled sound booth. Participants were seated in the center of the room and loudspeaker was placed at head-level at a distance of 1 m from the center. Speech and noise were both presented from the front. The presentation level of speech and noise was set to 65- and 60-dB SPL, respectively (SNR = + 5 dB). For the NH individuals, participants were tested in a quiet room. During speech recognition testing and the rapid auditory perceptual learning test, participants were tested with headphones and were instructed to adjust the level of speech presentation to their comfortable level. This was done with a list of three sentences not otherwise used in the study.
Test Battery
Participants completed a test battery consisting of challenging speech recognition tests, cognitive assessments, and two visual learning tasks (statistical and perceptual). They were compensated for their time.
Hearing
At the beginning of the study, participants in both groups underwent an audiometry testing for both ears. For CI users, aided and unaided audiometric thresholds were measured in both ears at 250, 500, 1000, 2000, 3000, and 4000 Hz.
Speech Recognition
Open-set format was used for all speech recognition tests and the tests were presented in sequence. After each stimulus, participants were instructed to repeat the speech material they have heard as accurately as possible before proceeding to the next one. No practice trials were administered.
Monosyllabic words—HAB (Boothroyd, 1968): This Hebrew version of the Arthur Boothroyd (AB) word list contains 15 equally difficult lists of words, each comprising 10 one-syllable meaningful words (Kishon-Rabin et al., 1999
The Hebrew version of the Oldenburg sentence test (OLSA)
The Hebrew version of the AzBio sentences—HeBio sentences
Natural fast (NF) speech sentences: Participants were presented with a list of 30 different Hebrew sentences, each consisting of five to six words and following a common subject–verb–object grammatical structure. These sentences, adapted from Prior and Bentin (2006), had been utilized in previous studies. The sentences were recorded by a female speaker at a speech rate of 180 words per minute (SD = 14). To produce the natural-fast recordings, the speaker was instructed to speak as quickly as possible without omitting any parts of the words. Each sentence was recorded three times, and the clearest version of each was selected by two native Hebrew speakers who reviewed all the recordings. All sentences were recorded and sampled at 44 kHz using a standard microphone and PC soundcard.
Scoring of the speech recognition tests. In the monosyllabic word test, the number of correct words per list was counted for each participant and condition separately. The proportion of correctly recognized words in the sentence tests was used for analysis. For each participant and test condition—OLSA-SSN, OLSA-BN, HebBio-Quiet, Hebio-BN, and NF, we computed the proportion of correctly recognized words in each sentence by dividing the number of correctly recognized words by the total number of words in the sentence. These proportions were then utilized for statistical modeling.
Cognitive Measures
Digit span and Vocabulary subtests from the Wechsler Adult Intelligence Scale-III (Hebrew version) (Goodman, 2001) were used in live voice. Digit span was used to assess working memory; Vocabulary was used to assess verbal knowledge and word comprehension. Both tests were administered and scored in accordance with the test manual. Since no validated visual versions of these tests are available in Hebrew, they were conducted in auditory mode with full lip-reading cues permitted. Standardized, age-corrected scores (as specified in the test manual) and raw scores were reported for descriptive statistics (Table 1), while scaled raw scores were used for statistical analysis.
Demographics, Cognition, Speech Recognition and Learning in the CI and NH Groups.

Note. Standardized scores are reported for convenience. As explained in the Method section, we scaled the raw scores in R prior to statistical modeling. CI= cochlear implants; IQR=interquartile range; NH=normal hearing; OLSA= Oldenburg sentence test; RT= reaction times; SSN=speech shaped noise.
Selective attention was measured using a computerized version of the flanker test (Eriksen & Eriksen, 1974). The task was created in SuperLab 5 based on Scharenborg et al. (2015). Participants were asked to identify the direction of a central target arrow while ignoring surrounding flanker stimuli. The task included congruent, incongruent, and neutral trials, presented in random order for a total of 72 trials. Reaction times (RT) and response accuracy were recorded. Selective attention was assessed using the flanker cost, calculated as the mean logRT of the correct responses in the incongruent trials divided by the mean logRT of the correct responses in the neutral trials. A higher flanker cost (>1) indicated poorer selective attention.
Verbal processing speed was assessed using a visual lexical decision test adapted from Picou et al. (2013). A computerized version was created in SuperLab 5. During the test, participants were presented with a string of Hebrew letters and were asked to indicate whether the letters form a real word, by pressing either “yes” or “no” on a keyboard as quickly as possible. For example, the string of consonants “gvvl” represents a real word in Hebrew (Hebrew typically omits vowels in the orthographic representation) whereas the string “zvvl” does not. Stimuli were orthographic representations of 50 common Hebrew monosyllable words and 50 nonwords. Nonwords were formed by changing one letter in each of 50 real words. During testing, stimuli were presented on a black computer screen and remained visible until a response was made. Interstimulus interval was 1000 ms. Participants were tested sequentially using two lists of 50 stimuli for a total of 100 presentations. Reaction time in ms, defined as the time between the word presentation to the subsequent response, was recorded and saved in a designated file. For each participant, verbal processing speed was determined by calculating the logRT for each response and averaging it across all responses, both correct and incorrect (Picou et al., 2013) with lower reaction times denoting higher verbal processing speed.
Visual Learning Tasks
Visual Statistical Learning
The serial reaction time artificial grammar learning task (Figure 1) used by Neger et al. (2014) was adapted and coded in Visual Studio to assess implicit sequence learning. The task required participants to identify and click as quickly as possible on target shapes, marked with a small filled red cross, from a set of eight visual stimuli (triangle, hexagon, star, square, arrow, circle, heart, and cross) displayed in a 2 × 2 grid in a computer screen. Participants were instructed to click on two consecutive targets. The second target appeared after the first was selected and could be predicted based on grammatical rules (e.g., a triangle was always followed by a star or a square but never a heart). Participants could not make errors, as the experiment continued only when the correct target shape was selected. The task included five practice trials, followed by 20 blocks of eight trials each: (a) 16 exposure blocks featuring repeated grammatical combinations (128 trials in total), (b) two test blocks with ungrammatical combinations, and (c) a recovery phase with two additional grammatical blocks. A short break was given after each block to prevent fatigue, and the entire task took approximately 20 min to complete.

Structure of the serial reaction time artificial grammar learning task. The first target is always displayed on the left side of the screen and the second target is always displayed on the right side of the screen.
Scoring
Visual Perceptual Learning
Visual perceptual learning was assessed with the TIPL paradigm (Protopapas et al., 2017). The task was adapted and coded in Visual Studio (see Figure 2). The task involved 10 pairs of Hebrew words and 270 black-and-white line drawings, which formed “word training sequences” consisting of 10 items (two words and eight images). One word was designated as the “target word” (nonattended) in blue, while the other, the “nontarget word” (attended), appeared in red. Participants were asked to closely observe the quickly flashing sequence and press the right Ctrl key on the keyboard as soon as they noticed something red. Both the reaction time and the accuracy of the response (hit or miss) were recorded and stored in a designated file. As soon as target detection sequence ended, a screen displayed the question “Did you see the following picture in this run?” followed by an image centered on the screen. Participants were instructed to press the right or the left Ctrl key for positive and negative response, respectively. The image was either from the training sequence or not. Each participant was required to undergo a training run that consisted of four blocks with 50 trials each (total of 200-word training sequences). During training, participants’ awareness of the words was minimized, as they were not instructed to process them, and the role of the words was not mentioned. After completing the training run, 40 words (10 pairs that were presented throughout the practice and another 10 new pairs) were randomly presented on the screen and participants were instructed to indicate for each word whether it has been included in the training run or not by pressing a button. In both the training run and the subsequent word identification task, participants’ reaction times and response accuracy (hit/miss) were recorded and saved. The entire task took approximately 20 min to complete.
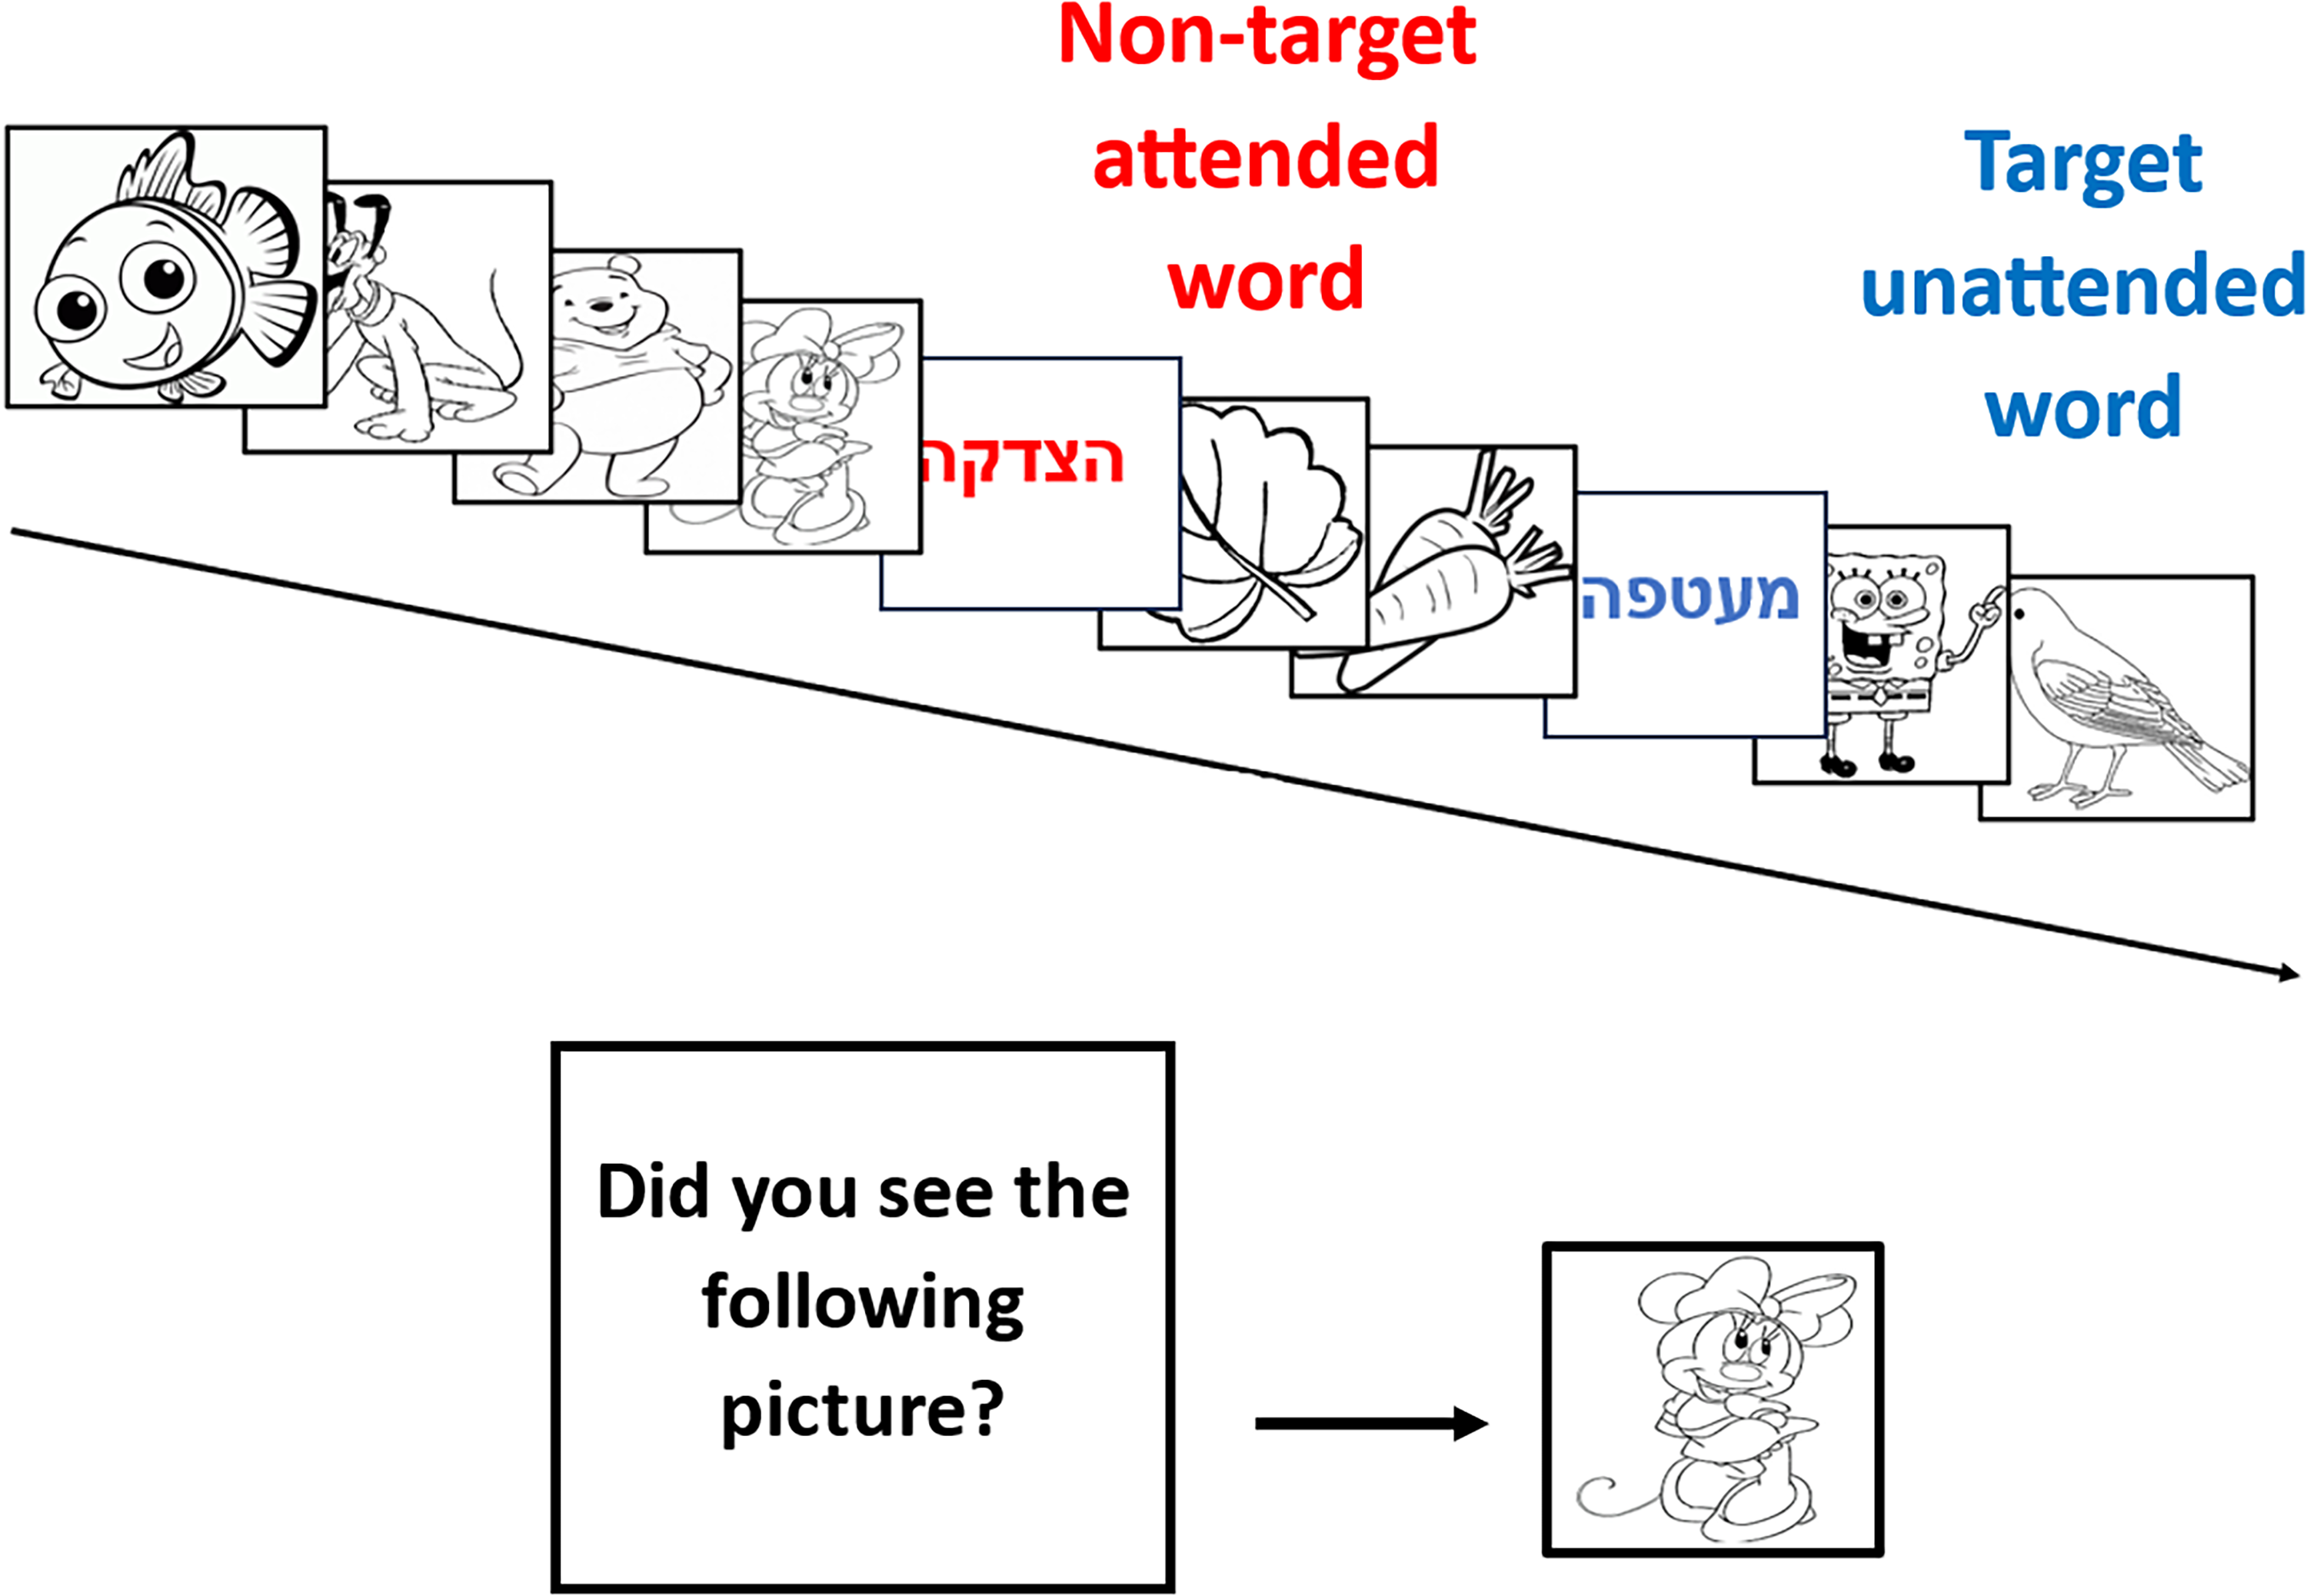
Schematic representation of the training run of the task-irrelevant perceptual learning paradigm. In each trial two words (“target word”—red, “nontarget word”—blue) and eight images were presented. After each trial, the question “Did you see the following picture in this run?” was displayed on the screen followed by an image centered on the screen.
Scoring
Learning was calculated as the difference in the proportion of recognized nonattended target words and attended nontarget words. Following the definition of “visual perceptual learning” presented in a previous section, visual perceptual learning results in relatively better recognition of nonattended items (words defined as target words and presented in blue font) compared with the recognition of attended items (words defined as nontargets and presented in red). Thus, greater positive values indicate more visual perceptual learning.
Data Analysis
A series of generalized linear mixed models was implemented using the lme4 package version 1.1-26 (Bates et al., 2014) in R version 3.6.3 (R Core Team, 2020). For creating the figures, ggplot2 package was used. As in our previous work (Khayr et al., 2023, 2024), binomial regressions were used to analyze the proportion responses of the different speech tasks. Modeling focused on the unique additional contribution of each learning index to speech recognition. Modeling was performed in stages, thus, if a later model fits the data significantly better than a previous one, the predictor(s) entered at the later stage has a unique contribution to speech recognition when all previously included predictors are considered.
Random effects included random intercepts for participant and random slopes for participant by sentence. Predictors (fixed effects) were centered and scaled. Four models were constructed. The first model, model 0, included only the random effects. Thereafter, each subsequent model added additional predictor or predictors sequentially. Model 1 included all the variables in model 0 as well as the cognitive factors (working memory, attention, vocabulary, and verbal processing speed). Model 2 included all the variables in model 1 and the visual SL index, and model 3 included all variables in model 3 and the visual perceptual learning index. To determine whether the more complex models capture the data better than the simpler ones, the fits of each two successive models were compared with χ2 tests using the anova () function. If the comparison was statistically significant (p < .05), we determined that the more complex model fits the data better than the simpler one, and therefore that the last entered variable(s) has a significant contribution to performance on the speech tests.
The ordering of predictor entry was theory driven. Cognitive measures were entered first as domain-general abilities known to support speech recognition. The visual SL index was added next based on our primary hypothesis, followed by the visual perceptual learning index as a more specific learning measure. Although moderate associations among cognitive and learning measures are expected due to shared reliance on general cognitive resources, entering predictors hierarchically reduces the risk of multicollinearity by separating conceptually related predictors across different steps. Furthermore, inspection of model stability and residual patterns did not indicate problems typically associated with multicollinearity (e.g., inflated standard errors or convergence issues).
Within a given model, the magnitude of contribution of each predictor to speech recognition was determined based on the odds ratio (OR) of each predictor while all other predictors in the model are kept constant. An OR > 1 suggests that as the predictor variable increases the odds of accurate speech recognition also increase. Conversely, an OR < 1 suggests that as the predictor variable increases, the odds of accurate speech recognition decrease. However, for attention and verbal processing speed, which are measured in reaction times, an OR < 1 indicates improved odds because lower RTs are associated with better performance.
In all models, we verified that the statistical assumptions of the Generalized Linear Mixed Models (GLMMs) were met. Model diagnostics included visual inspection of residuals, Q–Q plots for the random effects, and checks for overdispersion. These diagnostics did not indicate violations of assumptions for any of the models.
Results
Descriptive Statistics
The two groups had similar ages and education and displayed comparable scores on the cognitive tests (Table 1). In the speech recognition tests, the most challenging speech tests (lower scores) for the CI group were NF, monosyllabic words in SSN and OLSA sentences in babble noise (Table 2). On the other hand, the NH group had a ceiling effect in all speech recognition tests. Of all speech tests, the lower scores were observed in the NF test (M = 0.90).
Descriptive Statistics in Visual Statistical Learning and Visual Perceptual Learning in the CI and NH Groups.

Note. CI= cochlear implants; IQR=interquartile range; NH=normal hearing.
Learning
Visual Statistical Learning
Twenty out of 30 CI users and 24 out of 36 NH participants exhibited drops in their facilitation scores from the end of the exposure phase (blocks 13–16) to the test phase (17–18) reflecting a numerically positive learning-like pattern. This pattern is consistent with implicit learning mechanisms, whereby changes in the underlying structure during the test phase lead to longer reaction times and therefore a decreased facilitation score. The average difference in the facilitation score between the end of the exposure phase and the test phase in the CI group (M = 0.03, SD = 0.10) was similar to the NH group (M = 0.04, SD = 0.11) (Table 2A and Figure 3A), and an independent-samples t-test confirmed that the group difference was not significant (t(64) = −0.38, p > .05). To directly assess whether the learning scores differed from zero at the group level, one-sample tests were conducted for each group. NH listeners showed statistically significant learning (t(29) = 2.56, p = .016), whereas CI users exhibited a positive but nonsignificant trend (t(29) = 1.81, p = .080). Thus, while the CI group showed a numerically positive learning pattern, SL did not reach significance at the group level in this cohort. Likewise, learning did not differ significantly between the two groups when only learners were considered (CI users: M = 0.08, SD = 0.06; NH group: M = 0.09, SD = 0.10; t(42) = −0.21, p > .05).
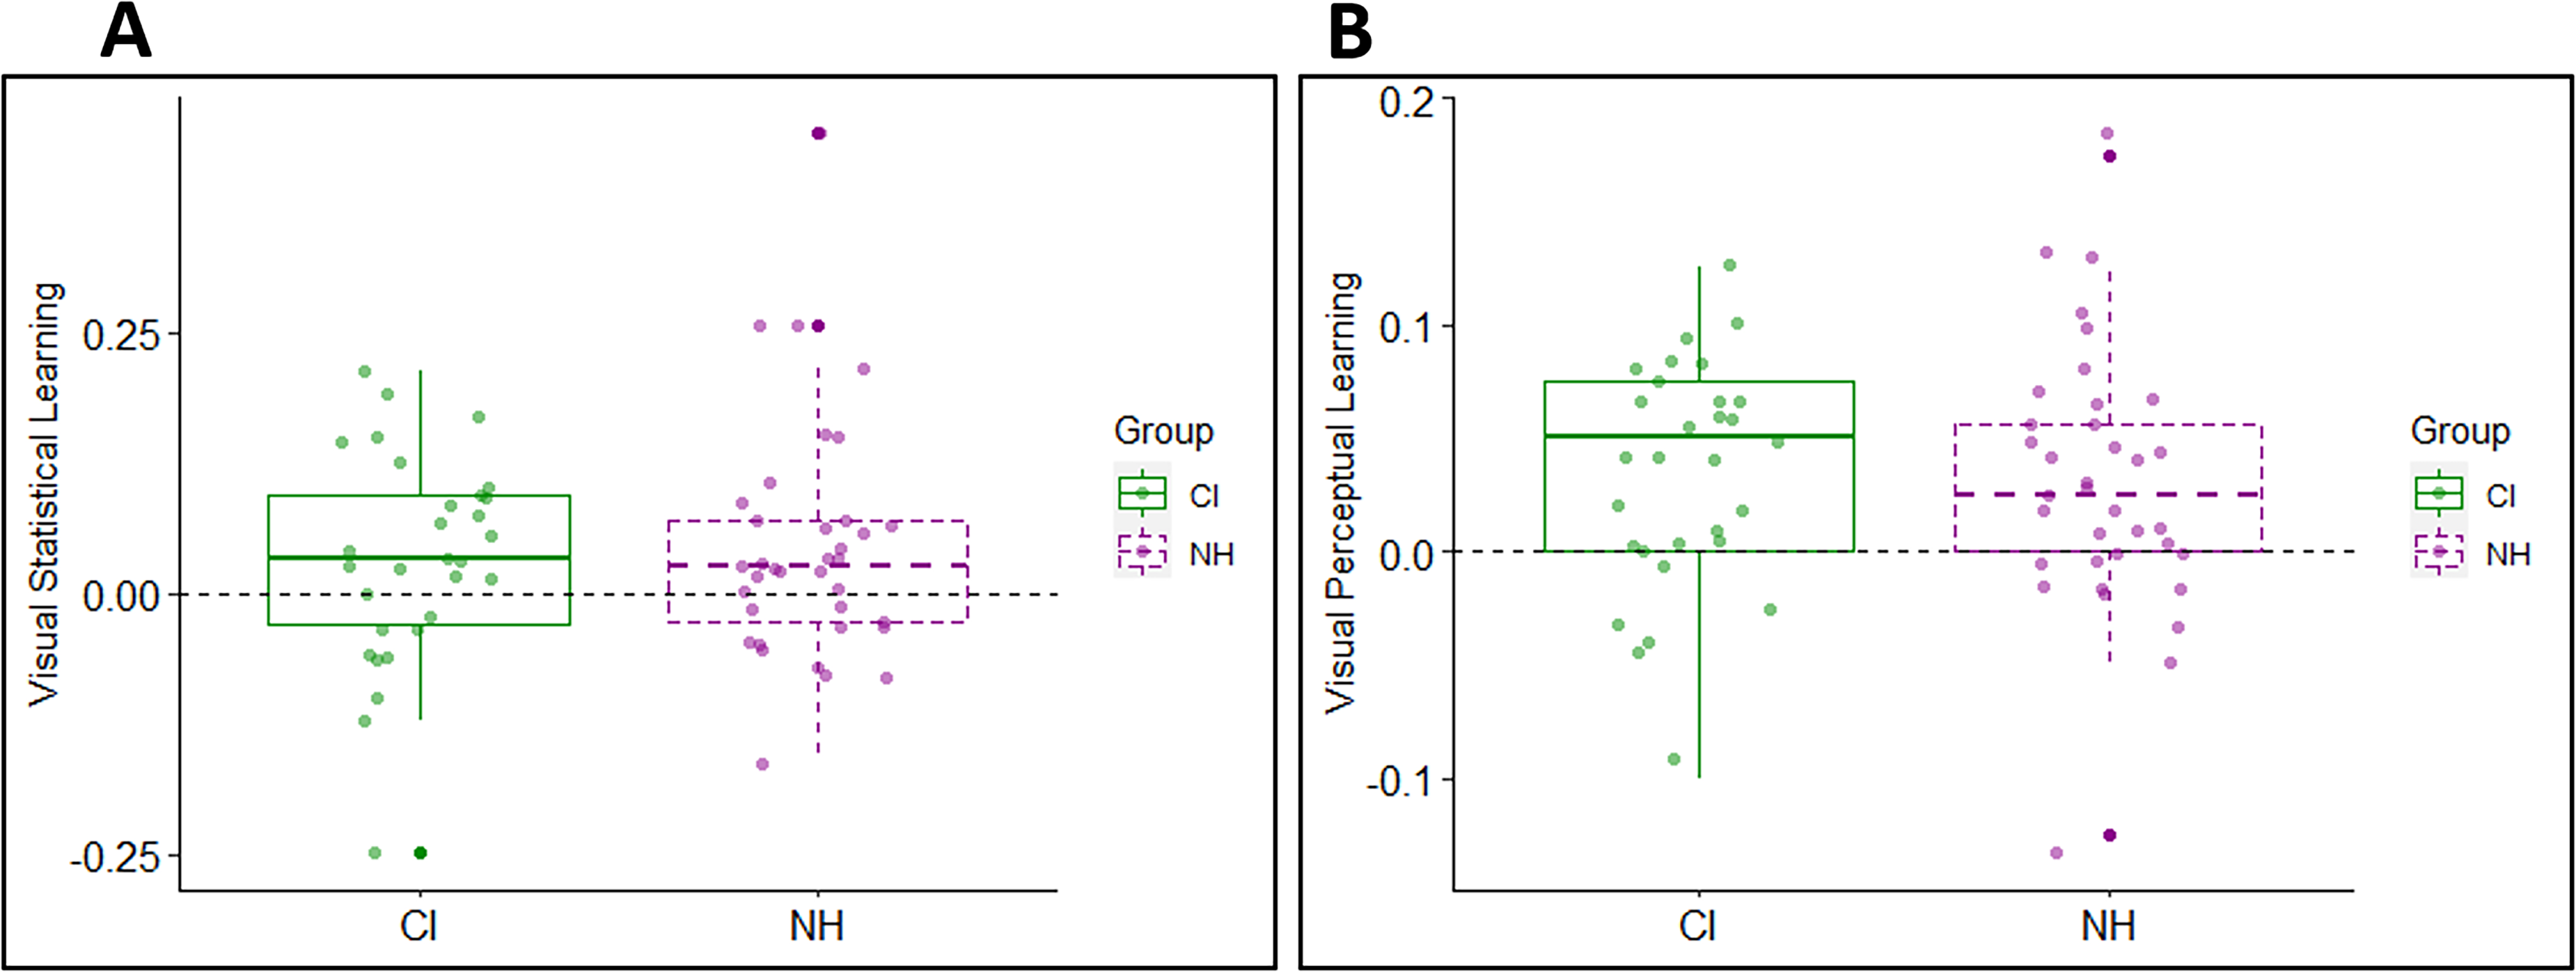
Learning in the CI group versus the NH group in each of the learning tasks. (A) Visual statistical learning (the difference in facilitation score between the end of the exposure phase and the test phase). (B) Visual perceptual learning (the difference in proportion between the recognized target vs. nontarget words). Each boxplot summarizes the data in one learning task. Across tasks, larger y-axis values indicate more learning than lower ones. Box edges mark the interquartile range (25th–75th percentile); the thick line within each box marks the median and the whiskers represent variability outside the upper and lower quartiles. Dots show individual data. CI= cochlear implants; NH=normal hearing.
Visual Perceptual Learning
In the visual perceptual learning task, better identification of the nonattended target words (presented in blue font) than attended nontarget words (presented in red font) indicated learning. At the individual level, 19 out of 30 CI users and 21 out of 36 NH participants presented visual perceptual learning. As shown in Table 2B and Figure 3B the performance of both groups was quite similar. The mean visual perceptual learning was 0.03 (SD = 0.05) for both groups with no statistically significant difference based on a two-sample t-test (t(64) = 0.20, p > .05). When only learners were considered, mean learning was not significantly different in the CI group (M = 0.06, SD =0.02) compared to the NH group (M = 0.06, SD =0.03, t(36) = −0.03, p > .05).
Speech Recognition as a Function of Implicit Learning
The NH group had high and nearly uniform performance across all speech recognition tasks, with little variability (see Table 1). Thus, the statistical modeling focused on the CI group, particularly on the most challenging speech tasks as a function of each index of learning as well as other cognitive functions.
The model comparisons indicated that each subsequent model up to model 2 provided a better fit to the data (Table 3). The inclusion of visual perceptual learning (model 3) did not improve the fit to the NF speech and sentences in noise data. The best fitting model for each type of sentences, model 2, is presented in Tables 4 and 5. These suggest that when all other variables are held constant, individuals with better visual SL have an advantage compared to those with poorer visual SL skills in the recognition of sentences in noise. Thus, for individuals with similar demographic, audiological and cognitive factors, an increase in 1 SD in the visual SL is associated with ∼55% increase in the odds of correctly recognizing OLSA-BN. The model comparison in the monosyllabic words in noise indicated that each subsequent model up to model 3 provided a better fit to the data (Table 3). The best fitting model, model 3 (see Table 6), suggests that when all other variables are held constant, individuals with better visual statistical and perceptual learning, have an advantage compared to those with poorer learning skills in the recognition of monosyllabic words in noise. Thus, for individuals with similar demographic, audiological, and cognitive factors, an increase of 1 SD in the visual statistical and perceptual learning is associated with ∼44% increase in the odds of correctly recognizing monosyllabic words in noise.
Model Comparisons for the CI Group: Natural Fast Speech, OLSA Sentences in Babble Noise, and Monosyllabic Words in Speech–Noise.

Note. CI= cochlear implants; OLSA=Oldenburg sentence test; AIC=Akaike Information Criterion.
Estimates of Natural Fast Speech Recognition in the CI Group from the Best Fitting Model.
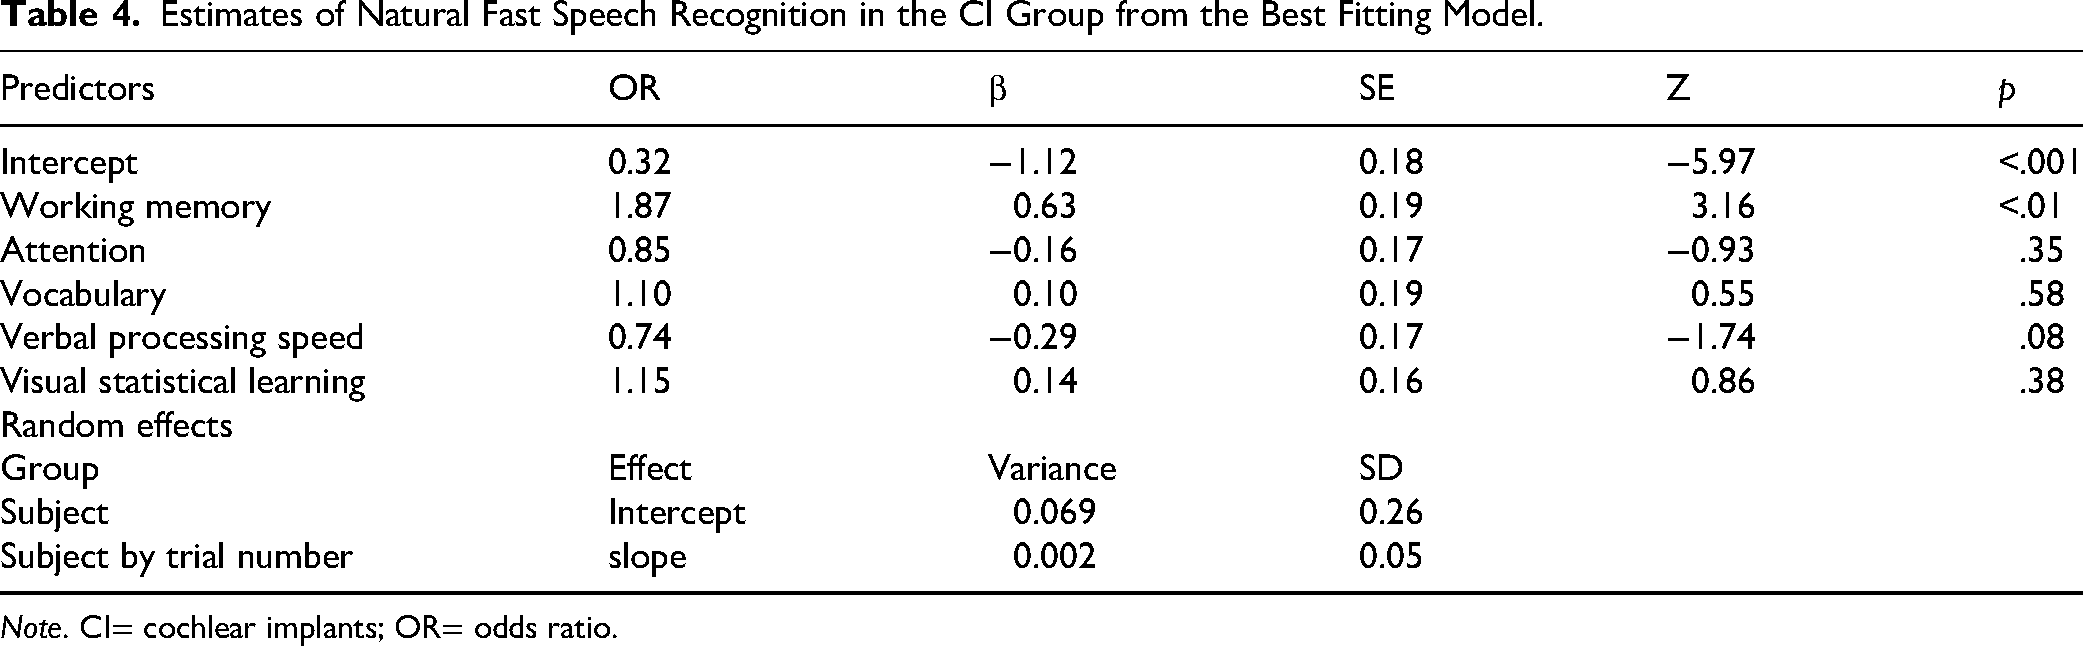
Note. CI= cochlear implants; OR= odds ratio.
Estimates of OLSA Sentences in Babble Noise Recognition in the CI Group from the Best Fitting Model.

Note. CI= cochlear implants; OLSA= Oldenburg sentence test; OR= odds ratio.
Estimates of Monosyllabic Words in Speech–Noise in the CI Group From the Best Fitting Model.

Note. CI= cochlear implants
Of the cognitive variables considered in the analysis, working memory was a significant predictor of the recognition of NF speech and OLSA-BN. Attention was not a significant predictor of any of the speech recognition tests. Verbal processing speed made a negative contribution to the recognition of monosyllabic words in noise.
Discussion
In this study we investigated implicit visual learning and examined the relationship between implicit visual learning and speech recognition in two groups of post lingual adult CI users and NH control group. In the CI group visual SL contributed to the recognition of sentences and words in noise. Visual perceptual learning only contributed to the recognition of monosyllabic words. These findings align with theoretical accounts that view speech recognition as a predictive process. SL supports the extraction of regularities that allow listeners to anticipate upcoming linguistic input, a mechanism that becomes especially important when the speech signal is degraded (Conway et al., 2010; Misyak & Christiansen, 2012). The observed associations between visual SL and speech recognition in CI users therefore suggest that individuals who are more efficient at detecting and using statistical regularities have better speech recognition. This predictive processing perspective provides a coherent framework for understanding how implicit learning abilities contribute to variability in speech recognition outcomes among CI recipients. Consistent with previous studies, some cognitive factors also contributed to the recognition of challenging speech in CI users.
In the current study, NH listeners exhibited significant visual SL at the group level, whereas CI users showed a numerically positive but nonsignificant learning pattern. The direction and magnitude of the learning effects were nonetheless comparable across groups, and a substantial proportion of CI individuals demonstrated learning-like effects. It is worth noting that the TIPL paradigm typically produces subtle learning effects, as it measures incidental learning of unattended regularities. Although the observed effect in our study was small (M = 0.03), both groups nonetheless demonstrated evidence of perceptual learning. This indicates that the task was sensitive enough to capture learning in both CI and NH participants. Therefore, it seems unlikely that the null effect between groups stems from insufficient task sensitivity.
It should be noted that our CI and NH groups were relatively well-matched in cognitive measures (Table 1), and that the CI participants were higher-performing individuals in terms of speech recognition. This similarity in cognitive abilities may have contributed to the absence of a significant difference in visual implicit learning between the groups, as implicit learning can be influenced by cognitive factors such as attention, working memory, and processing speed. Therefore, preserved implicit learning observed in our CI sample may not generalize to CI users with lower cognitive or speech recognition performance. Our findings are inconsistent with those presented by Lévesque et al. (2014), who documented impaired sequence learning in their cohort of nine post-lingual CI users. Given the importance of implicit learning of regularities for many aspects of life and linguistic development (Fastelli et al., 2021), as well as the recognized role of SL as a learning mechanism involved in almost every cognitive process and language (Perruchet & Pacton, 2006), it is encouraging that it is independent of hearing status.
In the CI group, visual SL had a unique contribution to the recognition of two challenging speech tests: OLSA-BN and monosyllabic words in noise. Visual perceptual learning, on the other hand, contributed only to the recognition of monosyllabic words in noise. In addition, the magnitude of the contribution of each visual implicit learning index to speech recognition varied between the different challenging speech recognition tests. This observation is not exclusive to CI users; it was previously observed in NH young adults as well, where the contribution of the visual statistical and perceptual learning on the recognition of challenging speech varied depending on the speech task. Additionally, the magnitude of the contribution of each learning index also varied depending on the specific speech task (Khayr et al., 2023). To our knowledge, there have been no previous studies exploring the role of visual implicit learning on the recognition of challenging speech in CI users. While direct comparison is constrained by differences in methodology, age, and hearing status, the contribution of visual implicit learning to recognition of challenging speech is in line with previous works with NH individuals (Conway et al., 2010; Khayr et al., 2023).
Participants in our study did not undergo brain activation measurement during the visual implicit learning task to check for cross-modal plasticity. However, our findings suggest that post-lingual CI users with better visual implicit learning abilities perform better in challenging speech tasks. This is consistent with findings from studies that observed a positive correlation between cross-modal activity in the auditory cortex in response to visual stimuli and speech recognition in post-lingual CI users (Fullerton et al., 2023; Stropahl et al., 2015). These observations might suggest that CI users effectively utilize both visual and auditory modalities to enhance communication.
Regarding the study's limitations, 2 limitations are noteworthy. First, the speech tasks posed relatively low challenge for the NH individuals who demonstrated uniformly high performance in the speech tasks, which were intentionally designed to be manageable to CI users. However, our selection may not have been optimal for investigating adult individuals with NH. On the other hand, using different conditions for each group poses its own challenges because in such study each group would need to be modeled separately. Second, we included only post-lingual CI recipients who scored greater than 60% in sentence recognition. It is important to determine whether learning occurs when speech recognition is limited even in quiet listening environments both for a better understanding of the constraints on the learning process itself and for its utility in CI recipients.
Together, these results suggest that SL may support predictive processes that facilitate speech recognition in CI users, particularly under challenging listening conditions.
In summary, our study shows that post-lingual CI users exhibit implicit learning in the visual modality, and this learning is comparable to NH individuals. This finding implies that implicit visual learning does not seem to be affected by hearing loss. The findings that learning in the visual modality contributed to speech recognition in CI users suggest that the predictive power of pre-implant visual learning indices should be further studied longitudinally to determine if it could serve to establish postimplantation rehabilitation goals and benchmarks for CI candidates expected to benefit from postimplantation support.
Footnotes
Funding
The authors disclosed receipt of the following financial support for the research, authorship, and/or publication of this article: This work was supported by the Israel Science Foundation, (grant number 106/18).
Declaration of Conflicting Interests
The authors declared no potential conflicts of interest with respect to the research, authorship, and/or publication of this article.