
Abstract
Different from normal-hearing (NH) listeners, speech recognition thresholds (SRTs) in cochlear implant (CI) users are typically poorer with dynamic maskers than with speech-spectrum noise (SSN). The effectiveness of different masker types may depend on their acoustic and linguistic characteristics. The goal of the present study was to evaluate the effectiveness of different masker types with varying acoustic and linguistic properties in CI and NH listeners. SRTs were measured with nine maskers, including SSN, dynamic nonspeech maskers, and speech maskers with or without lexical content. Results showed that CI users performed significantly poorer than NH listeners with all maskers. NH listeners were much more sensitive to masker type than were CI users. Relative to SSN, NH listeners experienced significant masking release for most maskers, which could be well explained by the glimpse proportion, especially for maskers containing similar cues related to fundamental frequency or lexical content. In contrast, CI users generally experienced negative masking release. There was significant intercorrelation among the maskers for CI users’ SRTs but much less so for NH listeners’ SRTs. Principal component analysis showed that one factor explained 72% of the variance in CI users’ SRTs but only 55% in NH listeners’ SRTs across all maskers. Taken together, the results suggest that SRTs in SSN largely accounted for the variability in CI users’ SRTs with dynamic maskers. Different from NH listeners, CI users appear to be more susceptible to energetic masking and do not experience a release from masking with dynamic envelopes or speech maskers.
Introduction
Recognition of target speech generally becomes more difficult in the presence of interfering sounds for human listeners. While speech understanding in quiet is often quite good for cochlear implant (CI) users, speech understanding in noise is generally difficult, more so than in normal-hearing (NH) listeners. CI users’ difficulties with masked speech are most likely due to poor spectrotemporal resolution (e.g., Shannon et al., 2004). Interference with target speech may be due to energetic masking, envelope masking, and/or informational masking. Energetic masking reflects interference between targets and maskers at the periphery (e.g., overlapping frequency regions) and is limited by the frequency and intensity of the masker (Kidd et al., 2019). Informational masking is another type of interference at more central levels of auditory processing (i.e., attention, memory, and linguistic processing) that inhibits speech segregation and is thought to occur when masking sounds are highly variable or are perceptually similar to target sounds (Durlach et al., 2003; Kidd & Colburn, 2017; Leek et al., 1991; Scott et al., 2004). Informational masking is not caused by physical interactions between the target and masker and/or overlap at the auditory periphery (Kidd & Colburn, 2017). Envelope masking reflects interference between target and masker temporal envelopes, even when spectral overlap (energetic masking) is reduced (e.g., Bronkhorst, 2015; Conroy & Kidd, 2021; Conroy et al., 2023; Fogerty et al., 2016; Jennings & Chen, 2020; Stone & Canavan, 2016). Conroy and Kidd (2021) found that uncertainty regarding masker modulation frequency could have adversely affected the detection of target modulations. Conroy et al. (2023) further found that reducing the masker-frequency uncertainty by providing a pretrial cue to the masker modulation frequency significantly improved modulation detection performance. They classified such uncertainty-related effects as “envelope informational masking” (i.e., a particular type of informational masking).
Speech-spectrum noise (SSN) has been widely used to assess masked speech recognition in NH listeners and CI users (Cullington & Zeng 2008; Fu & Nogaki, 2005; Shi et al., 2018). While SSN is often regarded as a purely energetic masker, recent studies from Stone and colleagues showed that the random temporal envelope fluctuations in SSN can produce appreciable amounts of envelope masking (e.g., Stone et al., 2011, 2012; Stone & Moore, 2014). Uncertainty regarding the masker modulation frequency in dynamic non-speech sounds may introduce additional envelope masking compared to SSN, depending on the spectral and/or temporal characteristics (e.g., temporal interference with the speech envelope region between 3 Hz and 8 Hz; Drullman et al., 1994). Compared to SSN, speech maskers typically contain substantial envelope and informational masking, especially when the competing speech has a similar speaking rate and fundamental frequency (F0) as the target speech and also contains meaningful lexical content (e.g., Brungart, 2001; Brungart et al., 2001; Kidd et al., 2016). The effects of informational masking also depend on attentional factors, listener expectations, and uncertainty about the acoustic characteristics of interfering sounds (Oxenham et al., 2003).
Additionally, the available spectrotemporal resolution may determine the effectiveness of energetic and/or informational masking, as listeners must use spectrotemporal properties (e.g., voice pitch, timbre and/or timing cues) to segregate and stream the target speech. The broad current spread associated with electrical stimulation limits CI users’ ability to segregate and stream simple stimuli even when large pitch differences are available (Chatterjee et al., 2006; Hong & Turner, 2006; Oxenham, 2008). With dynamic maskers, NH listeners can take advantage of favorable signal-to-noise ratios (SNRs) in the spectrotemporal dips to hear out the target. Due to limited spectrotemporal resolution, CI users seem unable to take advantage of such “dip-listening” with dynamic maskers such as gated noise (Fu & Nogaki, 2005; Nelson et al., 2003), multitalker speech babble (Croghan & Smith, 2018; Shi et al., 2018), and 1-talker speech masker (Cullington & Zeng, 2008; Tao et al., 2018).
The effectiveness of speech maskers may also depend on the number of maskers and the vocal characteristics of the maskers (Chen et al., 2020; Cullington & Zeng, 2008; Thomas et al., 2021). For example, NH listeners may experience considerable masking release (compared to SSN) with a 1-talker masker due to dip-listening. However, with a 2-talker masker, dip-listening is less available due to the smoothed masker envelope. NH listeners may be less able to segregate the target from the speech maskers due to increased informational masking, especially when the maskers’ F0s are similar to that of the target and are lexically meaningful (Kidd et al., 2016). Different from NH listeners, CI users seem unable to use large differences in F0, timbre, or timing to segregate and stream competing talkers (Stickney et al., 2004), again due to poor spectrotemporal resolution. One clear difference between NH listeners and CI users is the susceptibility to the number of speech maskers. NH listeners are highly susceptible to an increasing number of speech maskers. Previous studies have shown that NH listeners' speech reception thresholds (SRTS) can worsen by approximately 10 dB as the number of speech maskers increases from 1 to 2, beyond which SRTs do not change or even slightly improve (Chen et al., 2020; Cullington & Zeng 2008; Thomas et al., 2021). Contrary to NH listeners, no significant effect of the number of masker talkers has been observed on CI users' SRTs (Cullington & Zeng 2008).
While reduced spectrotemporal resolution undoubtedly limits masked speech recognition for all masker types, CI users’ susceptibility to maskers may highly depend on the type of interference inherent in the different maskers (i.e., energetic, envelope, and/or informational masking). Oxenham and Kreft (2014) measured sentence recognition in CI users for three types of maskers (Gaussian noise, noise-modulated tones, and pure tones). They found little difference in performance across masker conditions and suggested that the coarse spectrotemporal resolution in CIs effectively smoothed the inherent fluctuations in noise; however, they did not measure the effects of speech maskers (i.e., lexical content) or speech masker envelopes. Croghan and Smith (2018) measured SRTs in SSN, four-talker babble, multitone noise, and a 1-talker masker with a different sex from the target in CI users and NH participants listening to CI simulations with different degrees of spectral resolution. They also measured spectral modulation detection to estimate “functional” spectral resolution (i.e., the perceptual limit rather than the number of electrodes/channels). They found a significant correlation between spectral modulation detection thresholds and SRTs for both groups. For CI users, they found that SRTs with the 1-talker masker were most sensitive to the functional spectral resolution. Some CI users even experienced a release from masking with the 1-talker masker, relative to SSN; masking release was significantly correlated with spectral modulation detection thresholds. They suggested that different masker types may be differently sensitive to the functional spectrotemporal resolution in CI users. However, only one speech masker was used in that study (1-talker speech with a different sex from that of the target). Previous studies have shown that SRTs may depend on the acoustic and linguistic characteristics in both NH listeners and CI users, and the susceptibility to these speech maskers varies differently between NH listeners and CI users (e.g., Chen et al., 2020; Cullington & Zeng 2008; Fu & Nogaki, 2005; Nelson et al., 2003; Stickney et al., 2004; Tao et al., 2018; Thomas et al., 2021). Due to differences in test materials, it can be difficult to compare masker effectiveness of various masker types across studies. Also, it is unclear whether masking effects may be interrelated across different masker types, or how the very different spectrotemporal resolution between CI and NH listeners might affect interrelation among maskers.
The goal of the present study was to evaluate the effectiveness of different maskers with different acoustic and linguistic characteristics on SRTs in NH listeners and CI users. In this study, SRTs were measured with nine maskers that were broadly grouped into three categories according to the available acoustic and lexical cues: (1) No F0/no lexical cues: SSN, gated noise, noise modulated by speech envelope, and 6-talker babble, (2) F0/no lexical cues: 1-talker reversed speech, 2-talker reversed speech, and (3) F0/lexical cues:1-talker forward speech, 2-talker forward speech, combined 1-talker forward speech and 1-talker reversed speech. We hypothesized that different from NH listeners, CI users would be unable to make use of F0 cues due to the limited spectro-temporal resolution. We expected limited or no release from masking with dynamic maskers, regardless of F0 cues (i.e., no “dip-listening”), consistent with previous findings (Cullington and Zeng, 2008; Fu & Nogaki, 2005; Shi et al., 2018; Tao et al., 2018). We further expected that SRTs with SSN would be correlated with SRTs with other masker types, consistent with Croghan and Smith (2018), who reported significant correlations between spectral modulation detection thresholds and SRTs with various masker types.
Methods
Participants
Fifteen Mandarin-speaking Chinese CI users participated in the study (eight males and seven females). The mean age at testing was 20.5 ± 5.8 yrs, the mean duration of auditory deprivation was 4.0 ± 3.7 yrs, and the mean CI experience was 7.7 ± 6.5 yrs. CI subject demographic information is shown in Table 1. Ten NH listeners (six males and four females; mean age = 25.0 ± 1.6 yrs) served as experimental controls. All NH subjects had pure tone thresholds <20 dB HL at all audiometric frequencies between 125 Hz and 8000 Hz. All CI and NH participants were native speakers of Mandarin. In compliance with ethical standards for human subjects, written informed consent was obtained from all participants before proceeding with any of the study procedures. This study was approved by the Institutional Review Board in Beijing Tongren Hospital, Capital Medical University.
Demographic Information for CI Listeners.

Dur deaf = duration of deafness between onset and CI; CI exp = CI experience between age at CI and age at test; CI = cochlear implant.
Test Materials
The Closed-set Mandarin Speech (CMS; Tao et al., 2017) test materials were used to test speech understanding in the presence of different maskers. The CMS test materials consist of familiar words selected to represent the natural distribution of vowels, consonants, and lexical tones found in Mandarin Chinese. Ten keywords in each of five categories (Name, Verb, Number, Color, and Fruit) were produced by a native male Mandarin talker (mean F0 across all words = 139 Hz), resulting in a total of 50 words that can be combined to produce 100,000 unique sentences.
SRTs, defined as the SNR that produced 50% correct word recognition, were adaptively measured using a modified coordinate response matrix (CRM) test (Brungart et al., 2001; Tao et al., 2017, 2018). Similar to CRM tests, two target keywords (randomly selected from the Number and Color categories) were embedded in a five-word carrier sentence uttered by the Mandarin-speaking male target talker. The first word in the target sentence was always the Name “Xiaowang,” followed by randomly selected words from the remaining categories. Thus, the target sentence could be (in Mandarin) “
Similar to the target sentence, masker sentences were randomly generated for each test trial; words were randomly selected from each category, excluding the words used in the target sentence. Thus, the Chinese masker could be “Xiaozhang saw Two Blue kumquats,” “Xiaodeng took Eight Green papayas,” etc. (competing keywords in italics). The maskers were male talkers who were different from the target talker (mean F0 across all words = 143 and 178 Hz, respectively). The duration of the words used to generate the target and masker sentence varied slightly across categories and talkers. As such, after generating the target and masker sentences, the masker sentence duration was normalized in real-time to have the same duration as the target without affecting pitch using SoundTouch software (https://codeberg.org/soundtouch/soundtouch).
Recognition of target keywords was measured in the presence of nine different maskers, which differed in terms of spectrotemporal properties and in terms of lexical meaningfulness. Maskers included:
No F0/no lexical cues
(1) SSN: Speech spectrum noise. SSN was spectrally matched to the average spectrum across all 50 words from the target talker. (2) 4HZ: SSN gated at 4 Hz interruption rate. Gating was implemented using a 50% duty cycle and 100% modulation depth with no ramping or damping applied. (3) ENV: Envelope masker. For each trial, after generating a masker sentence, the temporal envelope of the masker sentence was extracted in real-time by using half-wave rectification and lowpass filtering at 500 Hz with a slope of 24 dB/octave. The envelope was used to modulate SSN, and the long-term root-mean-square (RMS) amplitude was equalized to be the same as the source masker sentence. (4) BAB: 6-talker speech babble (Dreschler et al., 2001). The babble masker does not contain lexical cues, distinct F0 information, or harmonic structure, but does preserve the temporal characteristics of speech (Stronks et al., 2020). (5) REV: One time-reversed male speech masker different from the male target talker (mean F0 across all words = 143 Hz). For each trial, before generating the masker sentence, each of the words was time-reversed. (6) REV-REV: Two time-reversed male speech maskers that are different from the male target talker. For each trial, before generating each masker sentence, each of the words in each masker sentence was time-reversed. (7) FOR: One time-forward speech masker different from the male target talker. (8) FOR-FOR: Two time-forward speech maskers that are different from the male target talker. (9) FOR-REV: One time-forward male masker and one time-reversed male masker. For each trial, for the reversed speech masker, before generating the masker sentence, each of the words in the masker sentence was time-reversed.
F0/no lexical cues
F0/lexical cues
The SSN masker was spectrally matched to the average spectrum across all 50 words from the target talker and was thus expected to produce maximal energetic masking. The 4HZ and ENV maskers had the same average spectrum as the SSN masker, but contained temporal fluctuations. The average spectrum of the remaining maskers (BAB, REV, REV-REV, FOR, FOR-FOR, FOR-REV) overlapped the spectrum of the SSN masker. The long-term spectral envelope of the target sentence and all maskers are shown in Figure 1.

The long-term spectral envelope for the target and all maskers.
The maskers differed in terms of long-term temporal envelope properties. Figure 2 shows the waveforms mixed at 0 dB long-term SNR for the target (red) and different maskers.

Examples of the waveforms mixed at 0 dB SNR for the target (red) and different maskers (black); the spectrograms for the different maskers are shown at right.
Glimpse Model
To quantify the amount of glimpsing available for the different maskers, the glimpse proportion was estimated by using the local SNR as the glimpse detection criterion (Cooke, 2006). Glimpses were estimated using the ideal time-frequency segregation (ITFS) method (Brungart et al., 2006), which is based on an ideal binary mask (Wang, 2005). The local SNR with each time-frequency unit was calculated as the RMS difference between the target and masker for 10-ms windows across 128 frequency channels using the short-time Fourier transform (Li & Loizou, 2008). Time-frequency units with a local SNR higher than a local criterion (in dB) were defined as target-dominated units, while others were defined as masker-dominated units. In the present study, the local criterion was set to 0 dB (i.e., the long-term SNR between target and masker signal), so glimpses were simply defined as the proportion of time-frequency units in which the local SNRs were higher than the long-term SNR.
For each masker, the mean glimpse proportion was estimated by averaging the glimpse proportion across 20 sentences. Figure 3 shows boxplots of glimpse proportion as a function of masker type. The SSN masker had the least glimpsing (16%). The 4HZ masker had regular temporal dips within which to glimpse the target, allowing for the most glimpsing (51%). A one-way analysis of variance (ANOVA) was performed on the mean glimpse proportion values shown in Figure 3, with masker type (SSN, 4HZ, ENV, BAB, REV, REV-REV, FOR, FOR-REV, FOR-FOR) as the within-subject factor. Results showed a significant effect for masker type (F8,179 = 411.0, p < .001). Post-hoc Bonferroni pairwise comparisons showed significant differences among all maskers (p < .001), except among the 4HZ, FOR, REV maskers and the REV-REV, FOR-REV, and FOR-FOR maskers.

Boxplot of glimpse proportion for the different maskers. The boxes show the 25th and 75th percentiles, the error bars show the 10th and 90th percentiles, the black horizontal line shows the median, the red horizontal line shows the mean, and the black circles show outliers.
Test Protocols
Due to the expected wide range in SRTs, a fixed overall presentation level was used instead of a fixed target level or a fixed masker level to avoid overly loud sounds for some experimental conditions. After the target and maskers were combined at the designated TMR, the overall level was further adjusted to have the same RMS amplitude for all trials and test runs. For the 2-talker maskers, the long-term RMS amplitude was equalized between the two maskers before calculating the designated TMR. All stimuli were presented in the sound field at 65 dBA via a single loudspeaker; participants were seated directly facing the loudspeaker at a 1-m distance. All CI users were unilaterally implanted with little residual hearing in the nonimplanted ear. CI users were tested using their clinical speech processors and settings. Volume and sensitivity were set for comfortably loud conversation levels (i.e., everyday settings); once set, these were not changed during testing. No plugging or muffing was applied to the nonimplanted ear.
During each test trial, a sentence was presented at the designated TMR; the initial TMR was 10 dB for CI users and 0 dB for NH listeners. For the SSN, 4HZ, and BAB maskers, the onset of the SSN masker was 500 ms before the target sentence presentation and the offset of noise was 500 ms after the end of the target sentence presentation. For the ENV, REV, REV-REV, FOR, FOR-FOR, and FOR-REV maskers, the onset and offset were the same as the target sentence. Participants were instructed to listen to the target sentence (produced by the male target talker and beginning with the name “Xiaowang”) and then click on one of the 10 response choices for each of the Number and Color categories; no selections could be made from the remaining categories, which were greyed out. If both keywords were correctly identified, the TMR was reduced by 4 dB (initial step size); if not, the TMR was increased by 4 dB. After two reversals, the step size was reduced to 2 dB. The SRT was calculated by averaging the last six reversals in TMR. If there were fewer than six reversals with the 2-dB step size within 20 trials, the test run was discarded and another run was executed. 2–3 test runs were completed for each condition and the SRT was averaged across runs. The masker conditions and test runs were randomized within and across subjects.
Results
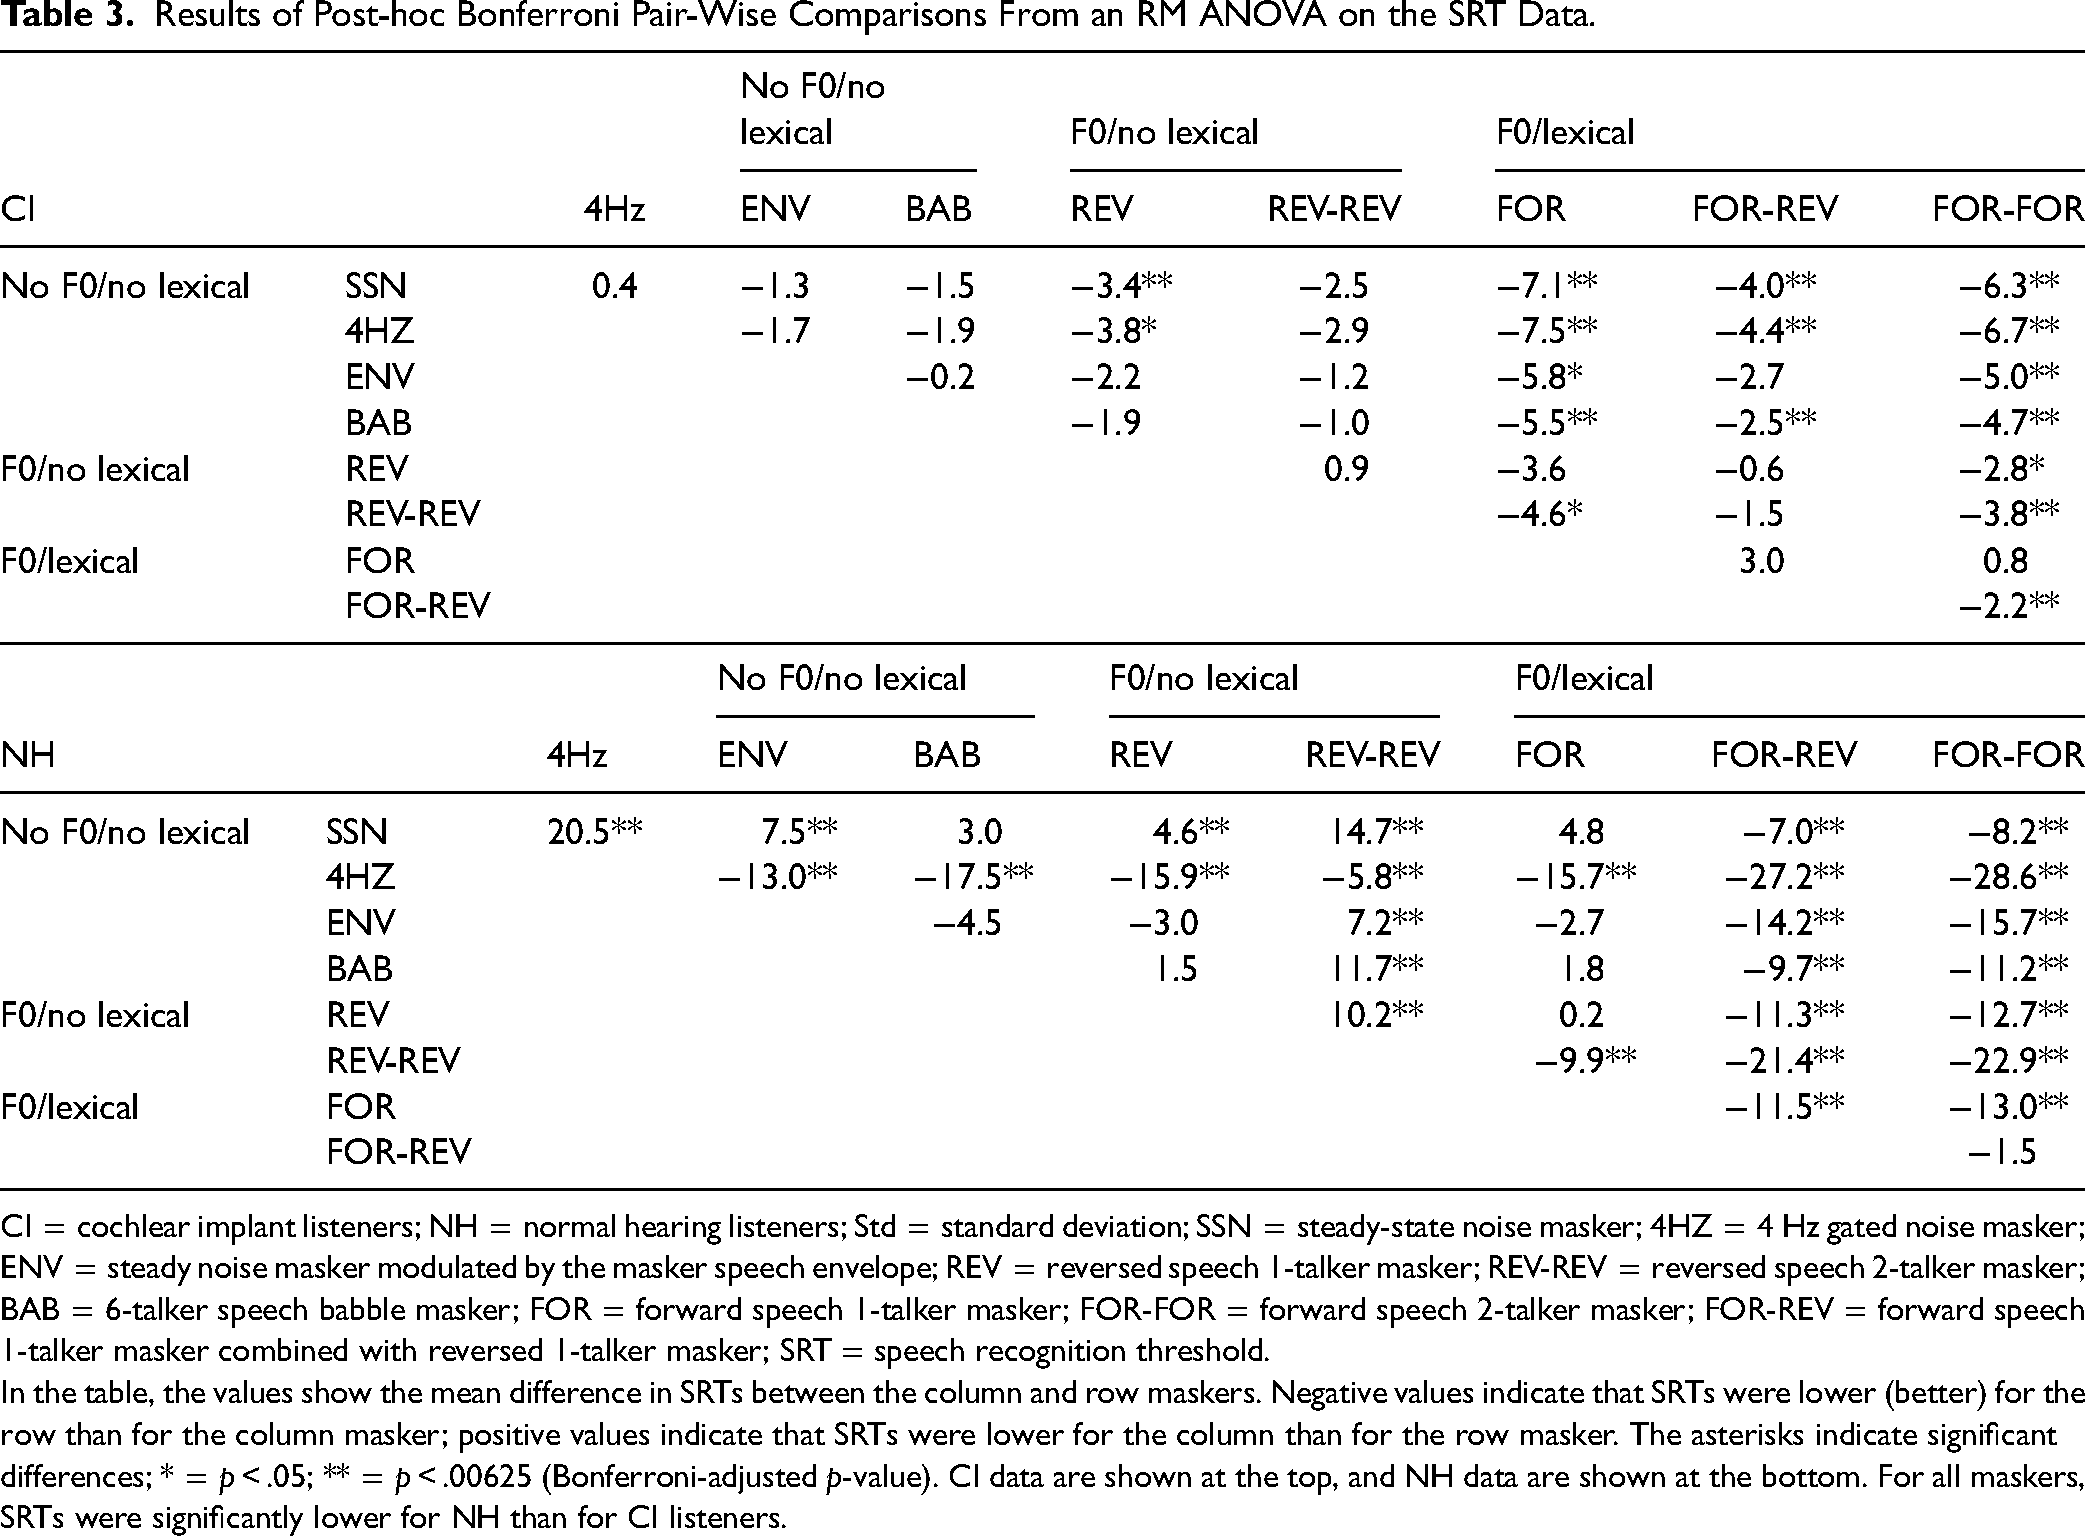
Figure 4 shows boxplots of SRTs for the different masker type for CI users and NH listeners; mean data are shown in Table 2. Mean SRTs were considerably lower (better) for the NH group than for the CI group for all masker types. For the NH group, mean SRTs were best with the 4HZ masker ( − 32.2 ± 2.1 dB) and worst ( − 3.5 ± 1.3 dB) for the FOR-FOR masker. Note that SRTs for the 4HZ maskers may have been more limited by audibility than by background noise as a fixed overall presentation level was used to accommodate extremely low SNRs when measuring SRTs. For the CI group, SRTs were best for the 4 HZ masker ( − 2.4 ± 5.0 dB) and worst for the FOR masker (5.1 ± 2.7 dB). A two-way repeated measures (RM) ANOVA was performed on the SRT data shown in Figure 3, with masker type (SSN, 4HZ, ENV, BAB, REV, REV-REV, FOR, FOR-REV, FOR-FOR) as the within-subject factor and group (NH, CI) as the across-subject factor. Results showed significant effects for masker type (F8, 184 = 109.8, p < 0.001, ηp2 = .8) and listener group (F1, 23 = 238.6, p < .001, ηp2 = .9); there was a significant interaction (F8, 184 = 62.4, p < .001, ηp2 = .7). Post-hoc Bonferroni pairwise comparisons showed that SRTs were lower (better) for the NH than for the CI groups for all maskers (p < .05 for all comparisons). Table 3 shows the difference in SRTs and the results of post-hoc Bonferroni-adjusted pairwise comparisons among maskers within the CI and NH groups.

Boxplot of SRTs with the different maskers for CI (green) and NH listeners (white). The boxes show the 25th and 75th percentiles, the error bars show the 10th and 90th percentiles, the black horizontal line shows the median, the red horizontal line shows the mean, and the black circles show outliers. SRT = speech recognition threshold; CI = cochlear implant; NH = normal hearing.
Mean SRTs, Standard Deviation (Std), minimum (Min) SRTs, maximum (Max) SRTs, and SRT Range (all in dB TMR) for the Different Maskers in CI and NH Listeners.
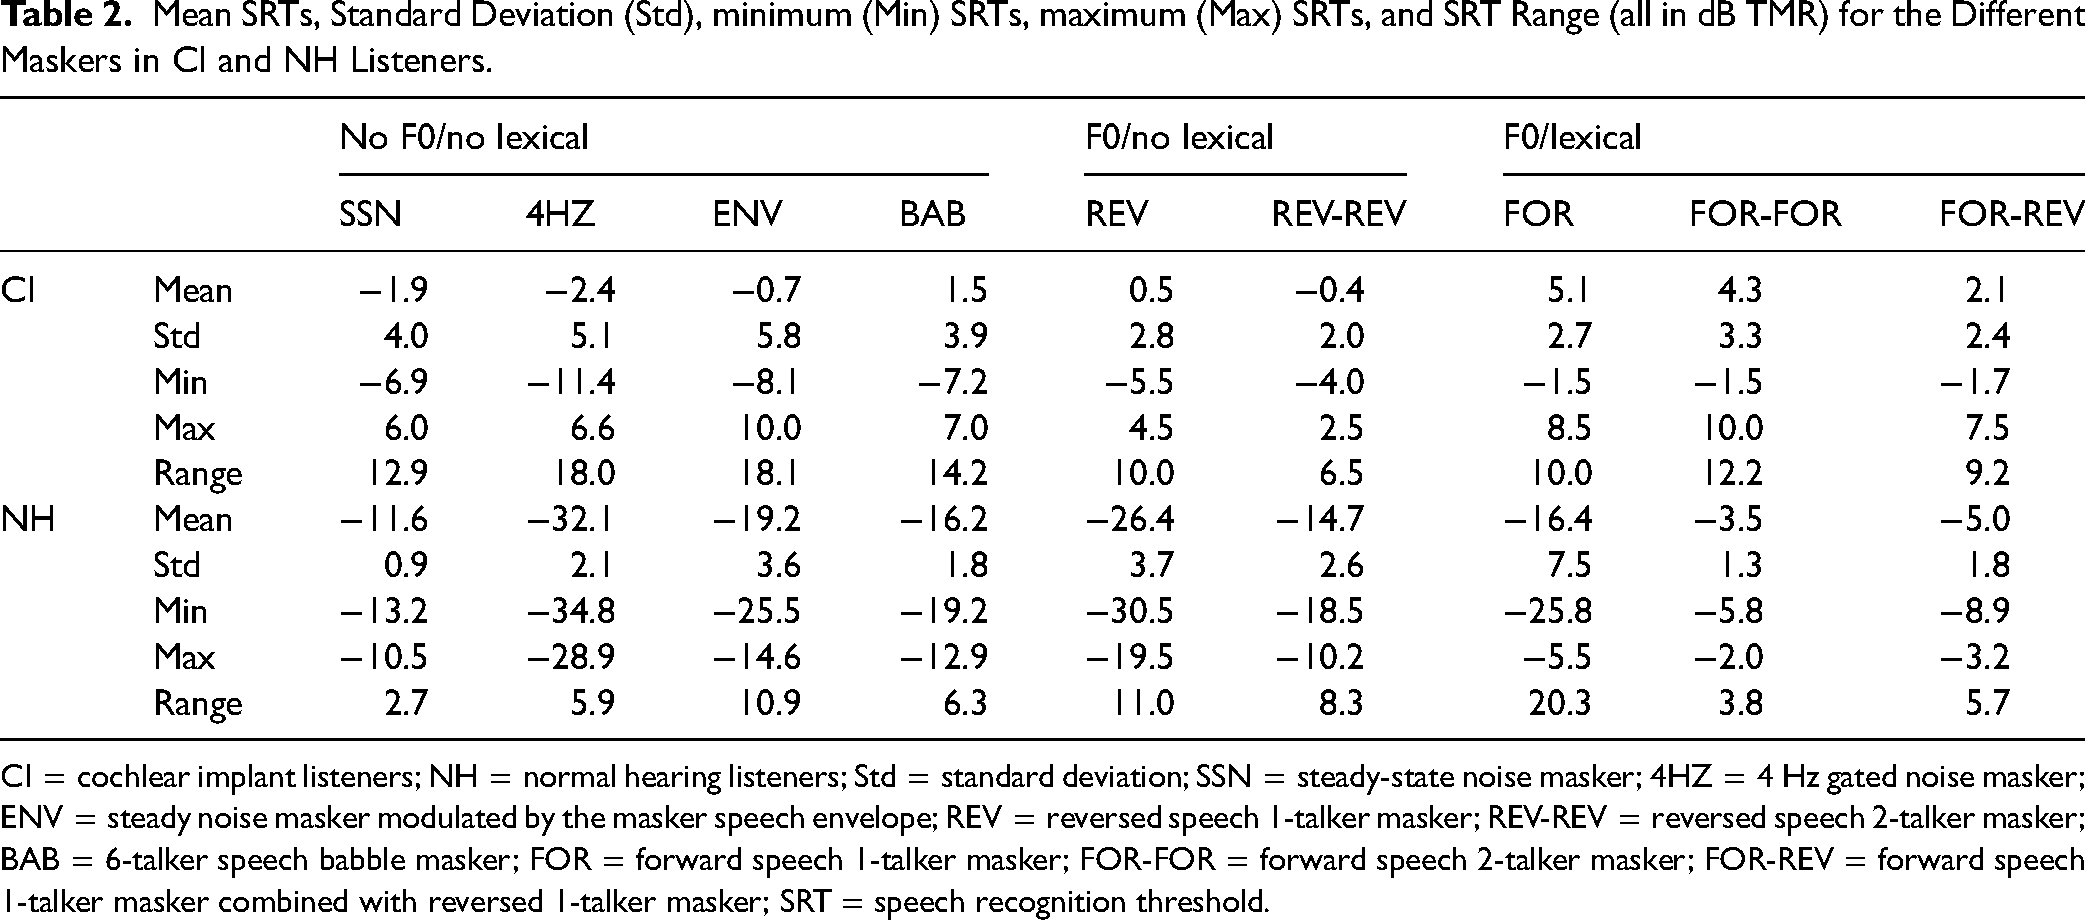
CI = cochlear implant listeners; NH = normal hearing listeners; Std = standard deviation; SSN = steady-state noise masker; 4HZ = 4 Hz gated noise masker; ENV = steady noise masker modulated by the masker speech envelope; REV = reversed speech 1-talker masker; REV-REV = reversed speech 2-talker masker; BAB = 6-talker speech babble masker; FOR = forward speech 1-talker masker; FOR-FOR = forward speech 2-talker masker; FOR-REV = forward speech 1-talker masker combined with reversed 1-talker masker; SRT = speech recognition threshold.
Results of Post-hoc Bonferroni Pair-Wise Comparisons From an RM ANOVA on the SRT Data.
CI = cochlear implant listeners; NH = normal hearing listeners; Std = standard deviation; SSN = steady-state noise masker; 4HZ = 4 Hz gated noise masker; ENV = steady noise masker modulated by the masker speech envelope; REV = reversed speech 1-talker masker; REV-REV = reversed speech 2-talker masker; BAB = 6-talker speech babble masker; FOR = forward speech 1-talker masker; FOR-FOR = forward speech 2-talker masker; FOR-REV = forward speech 1-talker masker combined with reversed 1-talker masker; SRT = speech recognition threshold.
In the table, the values show the mean difference in SRTs between the column and row maskers. Negative values indicate that SRTs were lower (better) for the row than for the column masker; positive values indicate that SRTs were lower for the column than for the row masker. The asterisks indicate significant differences; * = p < .05; ** = p < .00625 (Bonferroni-adjusted p-value). CI data are shown at the top, and NH data are shown at the bottom. For all maskers, SRTs were significantly lower for NH than for CI listeners.
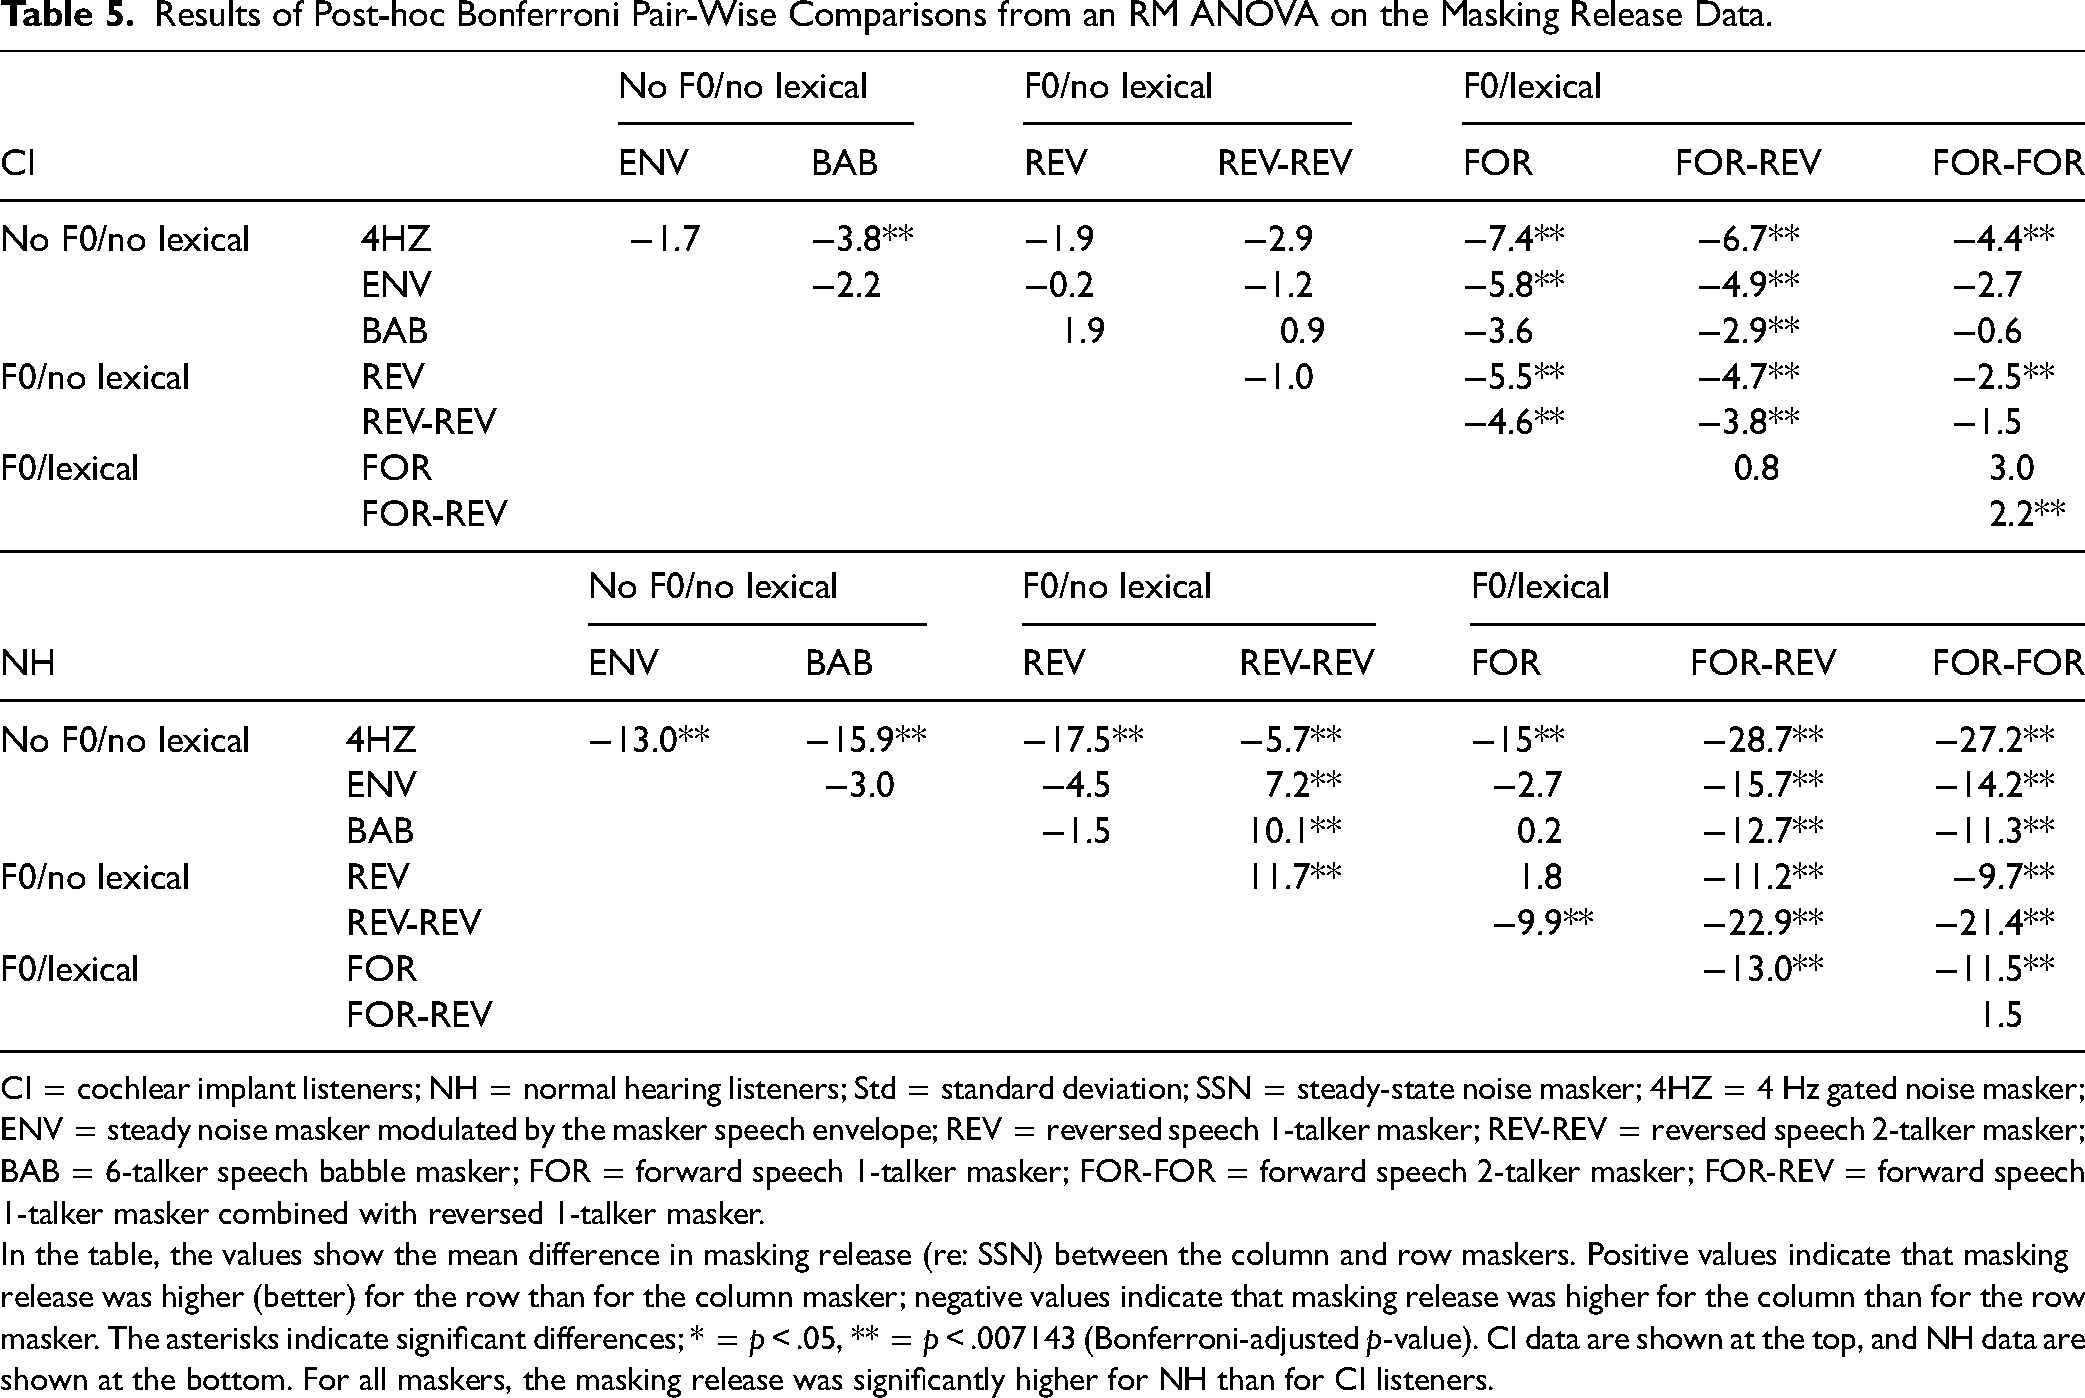
Figure 5 shows masking release for the different maskers relative to SRTs with SSN for CI users and NH listeners; mean data are shown in Table 4. Positive values indicate masking release; negative values indicate additional masking. For the CI group, there was nearly no masking release. The mean masking release was greatest with the 4HZ masker (0.4 ± 3.6 dB); the mean additional masking was greatest with the FOR masker ( − 7.1 ± 3.1 dB). NH listeners experienced masking release for all maskers except for the FOR-REV and FOR-FOR maskers. The mean masking release was greatest with the 4 HZ masker (20.5 ± 2.2 dB); the mean additional masking was greatest with the FOR-FOR masker ( − 8.2 ± 1.1 dB). A two-way RM ANOVA was performed on the data shown in Figure 4, with masker type (4HZ, ENV, BAB, REV, REV-REV, FOR, FOR-REV, FOR-FOR) as the within-subject factor and group (NH, CI) as the across-subject factor. Results showed significant effects for masker type (F7, 161 = 117.8, p < .001, ηp2 = .8) and listener group (F1, 23 = 100.1, p < .001, ηp2 = .8); there was a significant interaction (F7, 161 = 59.5, p < .001, ηp2 = .7). Post-hoc Bonferroni pairwise comparisons showed that masking release was higher (better) for the NH than for the CI groups for all maskers (p < .05 for all comparisons). Table 5 shows the difference in masking release and the results of post-hoc Bonferroni-adjusted pairwise comparisons among maskers within the CI and NH groups.

Boxplot of the difference in SRTs with the different maskers relative to SSN, for CI (green) and NH listeners (white). Data above 0 dB indicates masking release; data below 0 dB indicates additional masking. The boxes show the 25th and 75th percentiles, the error bars show the 10th and 90th percentiles, the black horizontal line shows the median, the red horizontal line shows the mean, and the black circles show outliers. SRT = speech recognition threshold; CI = cochlear implant; NH = normal hearing; SSN = speech-spectrum noise.
Mean Masking Release and Standard Deviation for the Different Maskers Relative to SSN for CI and NH Listeners.
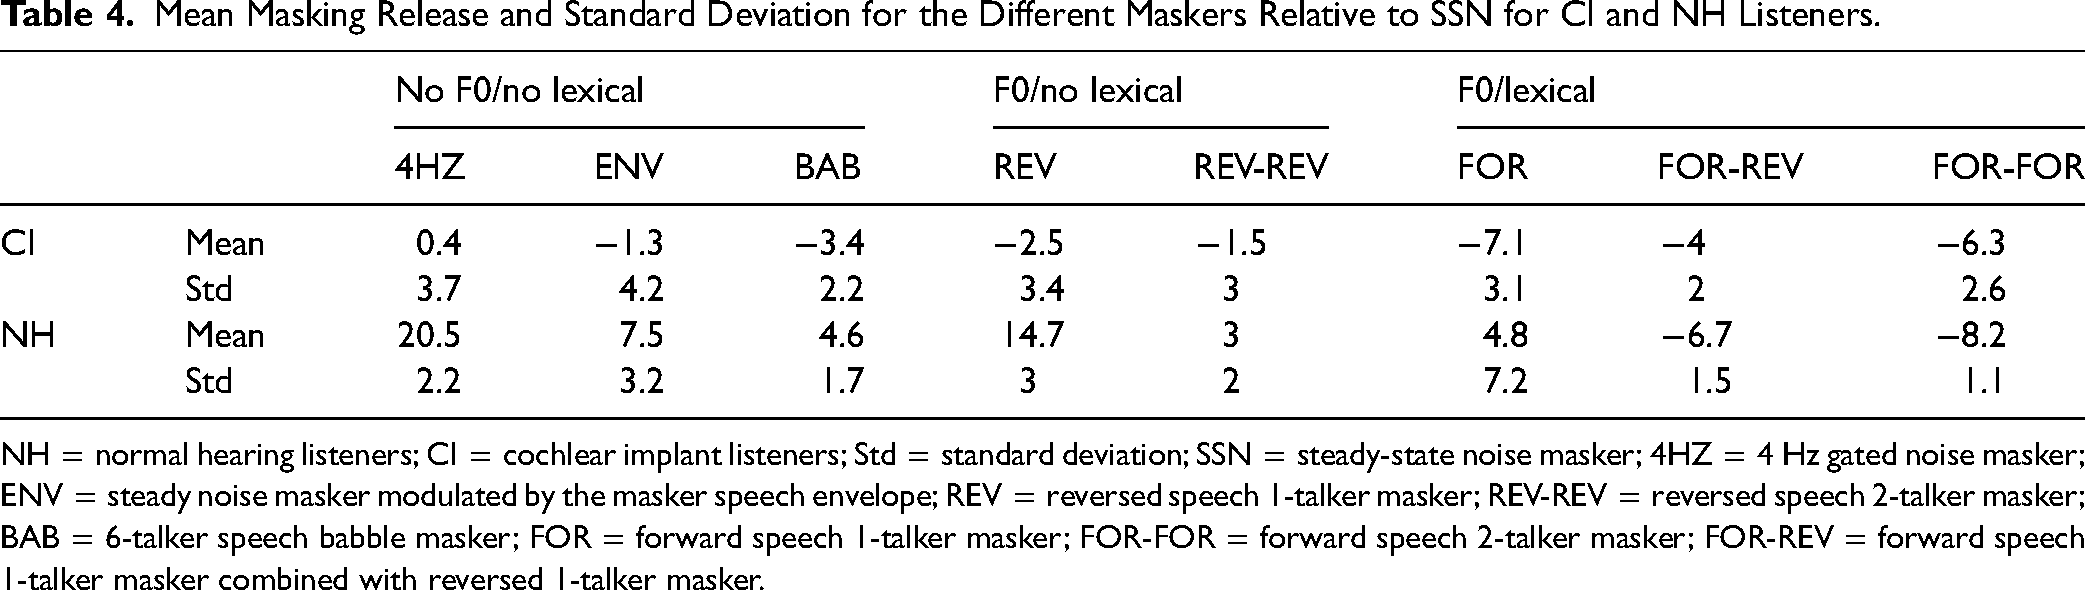
NH = normal hearing listeners; CI = cochlear implant listeners; Std = standard deviation; SSN = steady-state noise masker; 4HZ = 4 Hz gated noise masker; ENV = steady noise masker modulated by the masker speech envelope; REV = reversed speech 1-talker masker; REV-REV = reversed speech 2-talker masker; BAB = 6-talker speech babble masker; FOR = forward speech 1-talker masker; FOR-FOR = forward speech 2-talker masker; FOR-REV = forward speech 1-talker masker combined with reversed 1-talker masker.
Results of Post-hoc Bonferroni Pair-Wise Comparisons from an RM ANOVA on the Masking Release Data.
CI = cochlear implant listeners; NH = normal hearing listeners; Std = standard deviation; SSN = steady-state noise masker; 4HZ = 4 Hz gated noise masker; ENV = steady noise masker modulated by the masker speech envelope; REV = reversed speech 1-talker masker; REV-REV = reversed speech 2-talker masker; BAB = 6-talker speech babble masker; FOR = forward speech 1-talker masker; FOR-FOR = forward speech 2-talker masker; FOR-REV = forward speech 1-talker masker combined with reversed 1-talker masker.
In the table, the values show the mean difference in masking release (re: SSN) between the column and row maskers. Positive values indicate that masking release was higher (better) for the row than for the column masker; negative values indicate that masking release was higher for the column than for the row masker. The asterisks indicate significant differences; * = p < .05, ** = p < .007143 (Bonferroni-adjusted p-value). CI data are shown at the top, and NH data are shown at the bottom. For all maskers, the masking release was significantly higher for NH than for CI listeners.
The pattern of results for CI users showed little differentiation in SRTs among the different maskers, possibly due to inter-correlations of SRT data among the maskers. Table 6 shows the results of correlation analyses of CI and NH listeners’ SRT data with the different maskers. For CI listeners, significant correlations were observed for 34 out of 36 comparisons (p < .05), suggesting great inter-correlation. After Bonferroni correction for multiple comparisons (adjusted p = .00625), significant correlations persisted for 20 out of 36 comparisons. After controlling for SSN and after Bonferroni correction for multiple comparisons (adjusted p = .007143), no significant correlations were observed. For NH listeners, significant correlations were observed for only 11 out of 36 comparisons (p < .05), much less than observed in CI listeners. After Bonferroni correction for multiple comparisons (adjusted p = .00625), only one significant correlation remained (SSN vs. REV). After controlling for SSN, no significant correlations were observed.
Results of Correlation Analyses of CI (Top) and NH Listeners’ SRT Data (Bottom) Among the Different Maskers.

CI = cochlear implant listeners; NH = normal hearing listeners; SSN = steady-state noise masker; 4HZ = 4 Hz gated noise masker; ENV = steady noise masker modulated by the masker speech envelope; REV = reversed speech 1-talker masker; REV-REV = reversed speech 2-talker masker; BAB = 6-talker speech babble masker; FOR = forward speech 1-talker masker; FOR-FOR = forward speech 2-talker masker; FOR-REV = forward speech 1-talker masker combined with reversed 1-talker masker; SRT = speech recognition threshold.
For each group of listeners, the top panel shows correlation coefficients for Pearson correlations. The bottom panels show partial correlation coefficients after controlling for SSN, asterisks indicate significant associations; * = p < .05; ** = p < α after Bonferroni correction for multiple comparisons.
Figure 6 shows mean SRTs as a function of glimpse proportion with the different maskers for NH and CI listeners. NH SRTs were well-explained by differences in glimpse proportion among maskers within the three subgroups (maskers with No F0/no lexical cues, maskers with F0/no lexical cue, and maskers with F0/lexical cues). For CI listeners, there was little association between glimpsing and SRTs.

Mean SRTs as a function of glimpsing proportion with the different maskers for NH (Panel A) and CI listeners (Panel B). The filled circles show data from maskers with No F0/no lexical cues. The open circles show data from maskers with F0/no lexical cues. The filled triangles show data from maskers with F0/lexical cues. The lines represent the best fit to the data. SRT = speech recognition threshold; CI = cochlear implant; NH = normal hearing
Principal components analysis (PCA) was used to further probe sources of variability in SRTs across all maskers in CI and NH listeners. Figure 7 shows Eigen values and the percent of variance explained for the components extracted by the PCA. For CI listeners, 72% of the variability was accounted for by a single component, with Eigen values <1 for the remaining eight components. For NH listeners, 82% of the variability was accounted for by three components, with Eigen values <1 for the remaining six components.

PCA analysis of SRT data from CI (black) and NH listeners (red). The dashed line shows the cutoff Eigen value (1) to determine significant contributing factors. The left axis shows Eigen values, and the right axis shows the percent of variance explained by each component. The x-axis shows the component number. SRT = speech recognition threshold; CI = cochlear implant; NH = normal hearing; PCA = principal components analysis.
Discussion
Consistent with many previous studies (Cullington & Zeng, 2008; El Boghdady et al., 2019; Fu & Nogaki, 2005; Meister et al., 2020; Nelson et al., 2003; Stickney et al., 2004; Tao et al., 2018), masked speech understanding was poorer for CI users than for NH listeners. For CI users, maskers with dynamic spectrotemporal properties produced additional masking relative to energetic masking with SSN (Figure 5). In contrast, NH listeners often experienced a release from masking with dynamic maskers, relative to SSN.
Effect of Masker Type
The present maskers had different amounts of energetic, envelope, and/or informational masking. Compared to SSN, NH SRTs were significantly lower (better) for dynamic maskers with no lexical informational masking (4HZ, ENV, BAB, REV, REV-REV) but significantly higher (poorer) for 2-talker maskers with lexical informational masking (FOR-FOR, FOR-REV). For CI users, there was little differentiation in SRTs among the maskers. Across all SRTs for all maskers, the standard deviation (SD) for CI users was 4.4 dB, much smaller than the SD observed for NH listeners (9.3 dB). Different from NH listeners, where the highest (poorest) SRT was observed with the FOR-FOR masker ( − 3.5 ± 1.8 dB), CI users’ poorest SRT was observed with the FOR masker (5.1 ± 2.7 dB). However, the variability in SRTs with the FOR masker was much larger for NH listeners (SD = 7.5; range = −27.8 to −5.5 dB) than for CI users (SD = 2.7; range = −1.5 to 8.5 dB). The smaller variability may have been driven by smaller spectrotemporal dips due to channel interaction and compressive amplitude mapping (e.g., Fu & Nogaki, 2005). As such, the target and masker were less differentiated for CI users than for NH listeners.
While CI SRTs were poorer with several of the maskers (BAB, FOR, FOR-REV, FOR-FOR) than with the SSN masker, no SRTs were significantly lower than SSN (Table 3). For the SSN masker, the mean difference in SRTs between CI and NH listeners was 9.7 dB, generally consistent with previous studies (Cullington & Zeng, 2008; Fu & Nogaki, 2005). The largest SRT difference between CI and NH listeners was observed for the 4HZ masker (29.8 dB), and the smallest difference (5.0 dB) was observed for the FOR-FOR masker. Indeed, large differences in mean SRTs (9.7 to 29.7 dB) between CI and NH listeners were observed for all maskers except for the 2-talker maskers with lexical cues (FOR-FOR: 7.8 dB; FOR-REV: 7.1 dB). Again, the pattern of results was driven by the much larger variability in SRTs across masker types for NH listeners, compared to the relatively unchanging SRTs for CI users. Lutfi et al. (2021) found that energetic masking was associated with smaller intersubject variability in speech performance, while informational masking was associated with larger intersubject variability. In the present study, the smaller intersubject variability for CI users across masker types suggests that energetic masking dominated CI performance, whereas envelope and/or informational masking dominated NH performance.
Effects of Envelope and Lexical Informational Masking
Due to the temporal envelope fluctuations in dynamic maskers, NH listeners can take advantage of favorable SNRs in the spectrotemporal dips to hear out the target. As shown in Figure 3, the 4HZ masker has regular temporal dips within which to glimpse the target, allowing for the most glimpsing (51%) while the SSN masker allowed for the least glimpsing (16%). The effects of glimpsing on SRTs depended on the acoustic and lexical properties of the maskers. For maskers with no F0 or lexical cues (SSN, 4HZ, ENV, BAB), NH SRTs improved with increasing glimpse proportion and were well-predicted by glimpse proportion. The slope was −0.59 dB per % of glimpse proportion, suggesting that an increase of 1% in glimpse proportion resulted in a reduction in SRT of 0.59 dB, with an excellent fit (r2 = 0.99, p < .001). Note that these four maskers differed significantly in terms of modulation depth (SSN: small vs. 4HZ: large) and modulation frequency (4HZ: fixed vs. ENV: random). The excellent fit supports previous findings that the random temporal envelope fluctuations in SSN can produce comparable amounts of envelope masking (e.g., Stone et al., 2011, 2012; Stone & Moore, 2014) as other dynamic nonspeech maskers (e.g., ENV, BAB in the present study). The present data also suggest that masking release with the dynamic nonspeech maskers could be simply explained by differences in the glimpse proportion. Of course, energetic masking is reduced with increasing glimpse proportion, so the pattern of NH results with the dynamic nonspeech maskers reflects both energetic and envelope masking.
For maskers with F0 cues but no lexical cues (REV, REV-REV), the mean glimpse proportion for the REV masker (48%) was generally comparable to that of the 4HZ masker (51%). If the REV masker followed the same trends as the maskers with no F0 or lexical cues, the predicted mean SRT would be −30.8 dB, 4.4 dB lower than the measured mean SRT ( −26.4 dB). This difference was likely due to increased envelope masking, as there was no lexical informational masking in the REV masker. When the number of masker talkers increased, the mean glimpse proportion for the REV-REV masker was reduced to 40%. The mean SRT worsened from −26.4 dB with the REV masker to −14.7 dB SNR with the REV-REV masker. The estimated SRT for the REV masker would be −30.8 dB if glimpsing had the same effect as observed for the no F0/no lexical maskers. In general, the REV masker had a similar envelope as the ENV masker. The difference between the measured and estimated mean SRT for the REV masker was 4.4 dB, likely driven by the similarity in acoustic properties between the target and maskers, such as F0 and harmonic components. Similarly, the difference between the measured and estimated mean SRT was 10.9 dB for the REV-REV masker, substantially larger than that observed for the REV-masker. These results suggest that poorer performance observed in the reversed maskers was likely driven by the informational masking (e.g., similar F0 and harmonic components between target and maskers). The additional deficit with the REV-REV masker was likely driven by increased informational masking due to the increase in the number of maskers, similar to that observed with the forward speech maskers.
The time-forward and time-reversed maskers both contained F0 cues. The temporal envelope may differ to some degree between time-forward and time-reversed maskers. However, the time-forward and time-reversed maskers were associated with similar glimpse proportions for the 1-talker (FOR: 49%; REV: 48%) and 2-talker maskers (FOR-FOR: 39%; FOR-REV: 39%; REV-REV: 40%). Similar glimpse proportions but different SRTs could be due to either envelope or informational masking. The forward and reversed maskers likely produced comparable amounts of energetic and envelope masking. The SRT difference between the forward and reversed maskers was likely driven by the amounts of informational masking in terms of lexical interference. Mean NH SRTs were 9.9 dB poorer with the FOR than with the REV masker, and 11.2 dB poorer with the FOR-FOR than with the REV-REV masker, suggesting a similar effect of lexical interference on SRTs for both 1-talker and 2-talker speech maskers. The data are generally consistent with English-speaking NH listeners in Thomas et al. (2021), who reported that mean SRTs were 8.8 dB poorer with 1-talker forward than reversed speech maskers, and 11.8 dB poorer with 2-talker forward than reversed speech maskers. Interestingly, the slope for the maskers with both F0 and lexical cues (FOR, FOR-REV, FOR-FOR; −1.22 dB per % glimpse proportion) was nearly twice as steep as that for the maskers with no F0 or lexical cues (SSN, 4HZ, ENV, BAB; −0.59 dB per % glimpse proportion).
Mean CI SRTs were 9.7 poorer than NH SRTs with the SSN masker, and 29 dB poorer with the 4HZ masker. These performance deficits are generally comparable to those reported in Fu and Nogaki (2005; SSN: 14.6 dB, 4HZ: 34.2 dB). Different from NH listeners, the availability of F0 cues had no effect on CI SRTs. The data are not surprising as most CIs do not preserve F0 cues. Similar to NH listeners, CI users benefitted from the reduced lexical informational masking with the reversed speech maskers. Relative to the FOR masker, CI SRTs with the REV masker improved by 4.6 dB; similarly, relative to the FOR-FOR masker, CI SRTs with the REV-REV masker improved by 4.7 dB.
Effect of the Number of Masker Talkers
Compared to the FOR masker, the FOR-FOR masker allowed for fewer glimpses of the target speech in the spectro-temporal dips of the maskers (Figure 2); similarly, the REV-REV masker allowed for fewer glimpses than did the REV masker. The FOR-FOR masker also produced greater informational masking due to uncertainty among the three competing talkers. Mean NH SRTs were 13.0 dB poorer with the FOR-FOR than with the FOR masker, generally consistent with previous NH studies (e.g., Chen et al., 2020; Cullington & Zeng, 2008; Freyman et al., 2007; Iyer et al., 2010; Thomas et al., 2021). A similar pattern was observed with the reversed speech maskers, with mean NH SRTs 11.7 dB poorer with the REV-REV than with the REV masker. Doubling the number of masker talkers similarly affected SRTs with forward or reversed speech.
The glimpse analysis may provide some interesting insights about the trade-off between envelope and informational masking on SRTs. Doubling the number of masker talkers similarly reduced the glimpse proportion for forward and reversed speech. For reversed speech, doubling the number of masker talkers does not affect masker intelligibility. For forward speech, doubling the number of masker talkers may negatively affect masker intelligibility, especially when the target and masker have the same sex. This uncertainty likely increases the effect of informational masking (Brungart et al., 2001; Durlach et al., 2003; Kidd et al., 2016).
For CI listeners, there was no significant difference in SRTs between the FOR and FOR-FOR maskers, consistent with previous findings in Mandarin-speaking CI users (Chen et al., 2020), but not in English-speaking CI users (Cullington & Zeng, 2008). There was also no significant difference in SRTs between the REV and REV-REV maskers. Thus, while NH listeners experienced a multimasker penalty on SRTs, CI listeners did not. One of the conditions for multimasker penalty in Iyer et al. (2010) is that the TMR should be less than 0 dB. For CI listeners, mean SRTs were ≥ −0.4 dB with 1- or 2-talker maskers, which may have precluded a multimasker penalty. The lack of multimasker penalty in CI listeners may also be due to poor spectrotemporal resolution. In general, CI listeners seem unable to utilize large differences in pitch, timbre or timing to segregate and stream competing talkers (Stickney et al., 2004). The similar difficulty in segregating target speech from 1- or 2-talker masker speech may have been due to difficulties in spectrotemporal dip-listening as well as similar lexical interference from the 1- or 2-talker maskers (i.e., uncertainty regarding the target talker).
Inter-Relatedness Among Maskers
As shown in Table 6, there was great intercorrelation among the maskers for CI listeners, but not for NH listeners. This suggests that NH listeners were more sensitive to differences in the acoustic properties and lexical content among the maskers than were CI listeners. After controlling for SSN, there was no significant intercorrelation among the remaining maskers. This suggests that SSN (i.e., energetic masking) explained most of the variability in SRTs across maskers in CI listeners. The interrelatedness among maskers in CI users was confirmed by the PCA (Figure 5), where one component alone could explain 72% of the variance in CI SRTs, compared to 55% of the variance in NH SRTs. The PCA and correlation data suggest that for CIs, the impaired auditory system likely reduced the masking properties of dynamic maskers in terms of the similarity with the masking properties of SSNs. An additional component, possibly related to a more statistically structured pattern (i.e., not random), accounted for 8% of the variance. As shown in Table 6, after controlling for SSN, significant correlations remained among some maskers (4HZ vs ENV, 4HZ vs REV, FOR-FOR vs FOR-REV, and FOR-FOR vs. REV-REV). The commonality for these masker pairs may be the similarity in an envelope. The third component was likely driven by lexical informational masking, which accounted for an additional 7% of the variance.
For CI listeners, it appears that susceptibility to SSN explained the variability in susceptibility to dynamic maskers. The variability in CI SRTs among the dynamic maskers could not be explained by the availability of F0 cues in the acoustic signal or interference by lexical content. Hence, there was little differentiation in CI SRTs among the maskers, although some significant differences were observed (e.g., SRTs were often significantly poorer when lexical information was available).
Effects of Spectrotemporal Resolution on the Glimpse Model
In contrast to the large difference in SRTs between the SSN and 4HZ maskers observed in NH listeners, no significant difference was observed for the CI listeners. The data were generally consistent with previous findings (Fu & Nogaki, 2005; Nelson et al., 2003), suggesting that CI users seem unable to take advantage of the “dip-listening” with dynamic maskers even though the 4HZ masker provided substantially more glimpses (51% mean glimpse proportion) than the SSN masker (15% mean glimpse proportion).
The lack of a relationship between glimpse proportion and SRTs for CI users (Figure 6B) suggests that the computational glimpses do not reflect the glimpses that are available to CI users. In the present study, glimpses were estimated using an ITFS method. The local SNR with each time-frequency unit was calculated in terms of the RMS difference between the target signal and masker signal for 10-ms windows across 128 frequency channels using a short-time Fourier transform (Li & Loizou, 2008). The criterion of 0 dB simply indicates the percentage of short spectrotemporal segments that provide a relatively favorable SNR when compared to the long-term RMS difference between the target and maskers. While there may be such glimpsing advantages from an acoustical point of view, they may not exist for CI users from a perceptual point of view. An underlying assumption for the IFTS method is that listeners can segregate and identify the target stream from the masking streams perfectly, and any advantage in local SNR may lead to some improvement in SRTs. Due to the poor spectrotemporal resolution, CI users may not be able to correctly identify the target speech, especially at relatively low or negative SNRs. If the target stream cannot be correctly identified, any improvement in local SNR may not lead to an improvement in SRTs, resulting in the lack of an association between glimpse proportion and SRTs. A similar issue also existed in Cooke's (2006) model in which the detection criterion was set to 3 dB with an assumption that all time-frequency units whose local SNR exceeds 3 dB are detectable. Again, such an assumption may not hold for CI users, where the poor spectrotemporal resolution limits the ability to segregate and identify the target stream form the masking streams. As such, the present glimpsing analysis for competing speech may be relevant for NH listeners, but not CI users. Also, a linear-frequency analysis was used as the input to the present glimpse model, as opposed to the perceptually based spectrotemporal excitation pattern used in Cooke's (2006). As such, the model did not mimic perceptual abilities, which would diminish the impact of the glimpse analysis.
Another possible explanation for the lack of association between glimpse proportion and SRTs in CI users is that CI users may be much more susceptible to envelope masking than NH listeners, due to envelope-based CI speech processing strategies and amplitude compression in the speech processor. The increased envelope masking may limit the opportunities for dip-listening, resulting in the lack of release of masking with dynamic non-speech maskers for CI users.
Clinical Implications
The intercorrelation data suggest that SRTs with SSN may be used to predict SRTs with dynamic maskers in CI listeners. However, after controlling for SSN, SRTs with the dynamic maskers could not be predicted by the maskers’ acoustic properties and/or lexical content. Sensitivity to these acoustic and lexical properties in dynamic properties may be better predicted by CI listeners’ functional spectral resolution (e.g., Croghan & Smith, 2018; Fu & Nogaki, 2005; Shannon et al., 2004). As such, while susceptibility to masking by SSN may predict CI listeners’ susceptibility to dynamic maskers, it may not predict segregation of competing speech according to the acoustic properties (e.g., number of masker talkers) or the intelligibility of the maskers.
The present findings may be somewhat idiosyncratic to the stimuli and methods used in this study. The matrix-styled CMS test materials were used in the present study vs. commonly used sentence test materials (e.g., HINT sentences; Nilsson et al., 1994). Similarly, the test protocol (closed-set vs. open-set), contextual cues (no vs. high), and number of keywords (2 vs. 3–5), differed between the present and some previous studies. While absolute SRTs may differ between the present CRM and previous HINT tests (e.g., Cullington & Zeng, 2008), the relative performance difference is quite comparable. For example, the SRT difference between CI users and NH listeners was 8.0 dB (SSN), 21.0 dB (FOR), and 8.3 dB (FOR-FOR) with HINT (Cullington & Zeng, 2008), comparable to the 9.7 dB, 21.5 dB, and 7.8 dB difference with the CRM in the present study. The performance difference between different maskers was also comparable. For example, the SRT difference between SSN and FOR maskers in CI listeners was 6.4 dB for HINT (Cullington & Zeng, 2008) and 7.0 for CRM in the present study. Such data may be driven by the similar psychometric function between the CRM and HINT tests. MacPherson and Akeroyd (2014) found that the type and number of maskers used strongly affected the slope of the psychometric function, while target predictability, target corpus, and target/masker similarity had relatively minor effects. In their study, the mean slope for speech maskers was 3.8%/dB for both the CRM and HINT tests. Similarly, the mean slope for SSN maskers was 10.4%/dB and 10.1%/dB for CRM and HINT, respectively. Nevertheless, it remains possible the present findings may not transfer to other open-set speech materials. Further studies with open-set speech materials may be necessary to confirm the present findings.
Conclusions
Consistent with previous studies, masked SRTs were significantly poorer in CI than in NH listeners; NH listeners experienced significant masking release with the dynamic maskers relative to SSN, while CI listeners did not and often experienced increased masking with the dynamic maskers. For NH listeners, the amount of masking release could be well-explained by the glimpsing opportunities, especially for maskers containing similar cues related to F0 or lexical content. NH listeners were highly sensitive to F0 or lexical cues in the maskers, while CI users were only sensitive to lexical cues. There was great inter-correlation among the maskers in CI listeners, but not in NH listeners. After controlling for SRTs with SSN, there was no significant inter-correlation among the dynamic maskers in CI listeners. This suggests that susceptibility to SSN is predictive of CI listeners’ susceptibility to dynamic maskers, but that the acoustic and/or lexical properties of the dynamic maskers may not explain the variance in SRTs with the dynamic maskers.
Footnotes
Acknowledgments
We are grateful to all research participants for their considerable time spent in this experiment. This work was partly supported by the National Natural Science Foundation of China (Grant number 81870716), the Beijing Natural Science Foundation (Grant number 7212015), and Beijing Tongren Hospital (Grant number 2021-YJJ-ZZL-038).
Declaration of Conflicting Interests
The authors declared no potential conflicts of interest with respect to the research, authorship, and/or publication of this article.
Funding
The authors received no financial support for the research, authorship, and/or publication of this article.