
Abstract
Difficulty recognizing speech in noise is a common complaint among those with sensorineural hearing loss. Yet the degree of difficulty differs widely among individuals, often unrelated to the clinical gold standard for evaluating hearing, the pure-tone audiogram. Research has isolated both auditory and nonauditory factors responsible for these differences, but these factors do not operate in isolation. In the present work, a generic computational model involving simultaneous cue sensitivity, cue reliance, and decision noise provided an integrative framework for identifying sources of between-listener variance not accounted for by the audiogram. The framework was applied to performance differences within and between normal-hearing (NH) and hearing-impaired (HI) groups in the processing of linguistic, acoustic, and statistical cues supporting speech recognition in noise. The primary source of performance differences between groups was differences in sensitivity for the subtle, but largely stationary acoustic cues required for speech recognition. The overwhelming source of performance differences within groups was differences in decision noise associated with more salient, but highly variable statistical cues for speech separation. For speech separation, HI listeners placed far greater reliance than NH listeners on the one cue for which they were most sensitive. HI listeners, but not NH listeners, benefitted by shifting all acoustic information to this most relied on cue. The results provide preliminary support for the feasibility of integrative modeling as a means of evaluating the collective influence of factors affecting speech recognition in noise.
Introduction
Difficulty understanding speech in noise is a serious problem for those with hearing loss, affecting work, social interaction, and the quality of life (ASHA task force, 1996; Katz, 1994; Keilman et al., 2007; Keith, 1990). New hearing aid technologies promise major advances in treating the problem using artificial intelligence (AI) and machine learning to reduce the impact of the noise (Nielsen, 2024), but that promise depends on the quality of the data these technologies have regarding the individualized nature of the problem they are designed to treat (Sanchez-Lopez et al., 2020). So far, that data has come by-and-large from standard clinical diagnostics, which have not kept pace with modern research on difficulties listening in noise (Mealings et al., 2020; Pang et al., 2019). The audiogram, the clinical gold-standard for assessing hearing loss, is not a reliable predictor of who will have difficulty listening in noise (Fitzgerald et al., 2023; Smith et al., 2024), even when hearing levels are well within normal limits (Humes, 2019, 2021; Shinn-Cunningham, 2017; Tremblay et al., 2015). Of patients presenting in the clinic with this complaint, 9% to 15% are evaluated to have normal hearing (Kumar et al., 2007; Zhao & Stephens, 2007), while many who meet clinical criteria for hearing loss, perform as well as, or better than, their normal-hearing (NH) cohorts listening in noise (e.g., Alexander & Lutfi, 2004).
Research has identified a host of possible reasons for these differences (Pienkowski, 2017). Animal studies reveal a type of cochlear synaptopathy affecting hearing in noise that is not detected by conventional audiometry. The pathology is thought possibly to be widespread among humans (Kobel et al., 2017; Kujawa & Liberman, 2009; Plack & Léger, 2016). Elevations in threshold resulting from cochlear hair cell loss can be missed if measured only at the audiometric frequencies (Lee & Long, 2012), and even at the audiometric frequencies, there is wide variation in normal thresholds reflecting differences in hair cell health that could affect listening in noise (Plack et al., 2014). At the behavioral level, some listeners may compensate for the effects of a hearing loss by regularly using linguistic information to infer segments of a spoken message obscured or made inaudible by the noise (Brouwer et al., 2012; Calandruccio et al., 2014, 2017; Lutfi et al., 2021). Other listeners will leverage expectations regarding the statistical properties of speech to arrive at decisions regarding who is talking and what was said (Alexander & Lutfi, 2004; Chang et al., 2016; Cherry, 1953; Kidd et al., 2008; Lutfi et al., 2013, 2021), and still others may effectively switch their reliance on acoustic cues to compensate for cues lost to or distorted by their hearing loss (Calandruccio & Doherty, 2008; Doherty & Lutfi, 1996; Jesteadt et al., 2014; Lentz & Leek, 2002; Roverud et al., 2020, 2021; Souza et al., 2015, 2020; Thrailkill et al.). Working memory (Conway et al., 2005), lapses in attention (Bidelman & Yoo, 2020; Brungart & Simpson, 2007), and cognitive changes with age (Helfer et al., 2020) can alternatively influence listening in noise in ways that can be mistaken for a hearing loss. Also, in real-world listening, speech and noise are not static. Unlike the pure tones used in audiometry, voices modulate widely in level and pitch, topics of conversation change abruptly, and different talkers speak unpredictably from different locations at different times. The uncertainty created by such moment-by-moment variation can cause both NH and hearing-impaired (HI) listeners to have great difficulty following the speech of a conversation partner; this is the lesson learned from studies of informational masking (Kidd et al., 2008, 2016; Lutfi et al., 2013). Finally, speech recognition in noise is not one problem, but two. To recognize the speech in noise the listener must also separate the speech from the noise. The separation problem, popularly known as the cocktail-party problem, has a long history of study dating back to Cherry (1953). A defining feature of this work is huge individual differences in performance for both NH and HI listeners (Kidd & Colburn, 2017; Shinn-Cunningham, 2017; Shinn-Cunningham & Best, 2008).
The above narrative underscores the complex and multifaceted nature of the problem of understanding individual differences recognizing speech in noise that are not accounted for by the audiogram. Progress has been made identifying relevant factors, but the problem is unlikely to be reduced to any one or even combination of these factors. Different scenarios pose different challenges, different individuals respond differently to these challenges, and different factors take on different significance when all are simultaneously in play. The goal of the present study was to evaluate the feasibility of developing a generic model that could be applied generally in such cases to evaluate the source of individual difficulties listening in noise not accounted for by the audiogram. Three questions were posed: (a) Can what is known about the individual factors affecting speech recognition in noise be used to model their collective influence in a typical speech-in-noise recognition task, (b) can the model be used to quantify the relative impact and interaction of these factors for individual listeners in this task, and (c) can the information obtained be used to provide a benefit for HI listeners?
The approach required trading specificity for generality. We recognized that to model the specific action of every factor implicated would be too large an undertaking. Instead, we leveraged the fact that different factors often have a common effect on behavior associated with a particular stage of speech processing. By grouping factors in terms of their common behavioral effect, the problem might be reduced to a few general factors that would easily lend themselves to evaluation. This integrative approach was applied here to conditions involving the processing of three major speech cues supporting speech recognition in noise (linguistic, acoustic, and statistical) for both HI and NH listeners. The work is described in four parts. The first covers the development of the model and how its parameters are tied to specific sources of listener variance in the data. The second describes the methods involved in parameter estimation. The third describes results wherein the model is applied to the partitioning of the variance in speech separation and its relation to speech recognition. The fourth describes an interaction between stages of processing that is exploited to provide a benefit in the task for individual HI listeners.
The Integrative Model
The model is designed to evaluate the collective impact of factors on the coordinated function of different stages of auditory processing. Known factors affecting performance, those that were described in the introduction, are assigned to one of three stages of processing determined by whether their primary effect is on cue sensitivity (transduction), cue reliance (selective attention), or decision noise (decision processes). The relative impact of these stages on behavior and the interaction among them is then determined from their ties to specific sources of listener variance in the data. The focus is on the listener variance rather than the mean differences between conditions. In practice, the listener variance is partitioned into three parts using a general linear model, GLM (see Lutfi et al., 2021 for the analytic development). The GLM includes a listener fixed effect, which carries over from one condition to the next, a random effect, responsible for the error in replication of conditions, and a conditional effect, representing the unusual difficulty a particular listener may have with a particular condition or conditions. The parameters of the integrative model at each stage are then selected to capture the three sources of listener variance in the GLM recovered from the data.
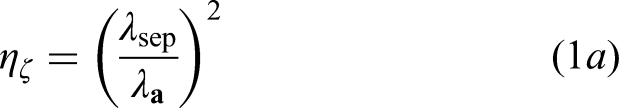
Figure 1 shows the stages of the integrative model and their computational formulas. The computational formulas are intended to represent generally accepted views of the behavior of each stage (Common physiological processes associated with different behaviors are neither necessary nor implied). The input

Schematic of generic integrative model with computational formulas for each stage (see text for details).
Model Application and Simulation
For the present application of the model, an important consideration is that experimental conditions involve the manipulation of speech cues (linguistic, acoustic, and statistical) having different units of measure. This means that common metrics of listener performance (e.g., d′, threshold signal-to-noise ratio [SNR], or percent correct) do not allow for equivalent comparisons from one condition to the next. To permit equivalent comparisons, a measure of performance efficiency (0 ≤ η ≤ 1), specifically intended for this purpose, is adopted from signal detection theory (Tanner & Birdsall, 1958). This measure expresses performance relative to that of an ideal observer, one that optimizes decisions based on the likelihood ratio of speech signal-to-noise specific to each condition (Green & Swets, 1966). This measure is used both to evaluate the overall performance of listeners and to evaluate the different stages of processing across different conditions. For the different stages, η is computed using as input to each stage the output O of the previous stage.
Before data collection, model simulations were performed for a group of 11 NH and 11 HI hypothetical listeners with all conditions exactly as described in the General Methods section. Simulations are useful in support of comparisons to listener results, at least to show measurable expected differences in possible outcomes. The same software programs used to collect and analyze the data from listeners were used to perform the simulations. The section of the code that represented the responses from listeners was simply replaced with code representing the model. Realistic values of model parameters were selected based on previous studies (Lutfi et al., 2020, 2021, 2023) so that the dominant source of between-listener variability would be differences in (A) decision noise, ζ, (B) cue reliance,


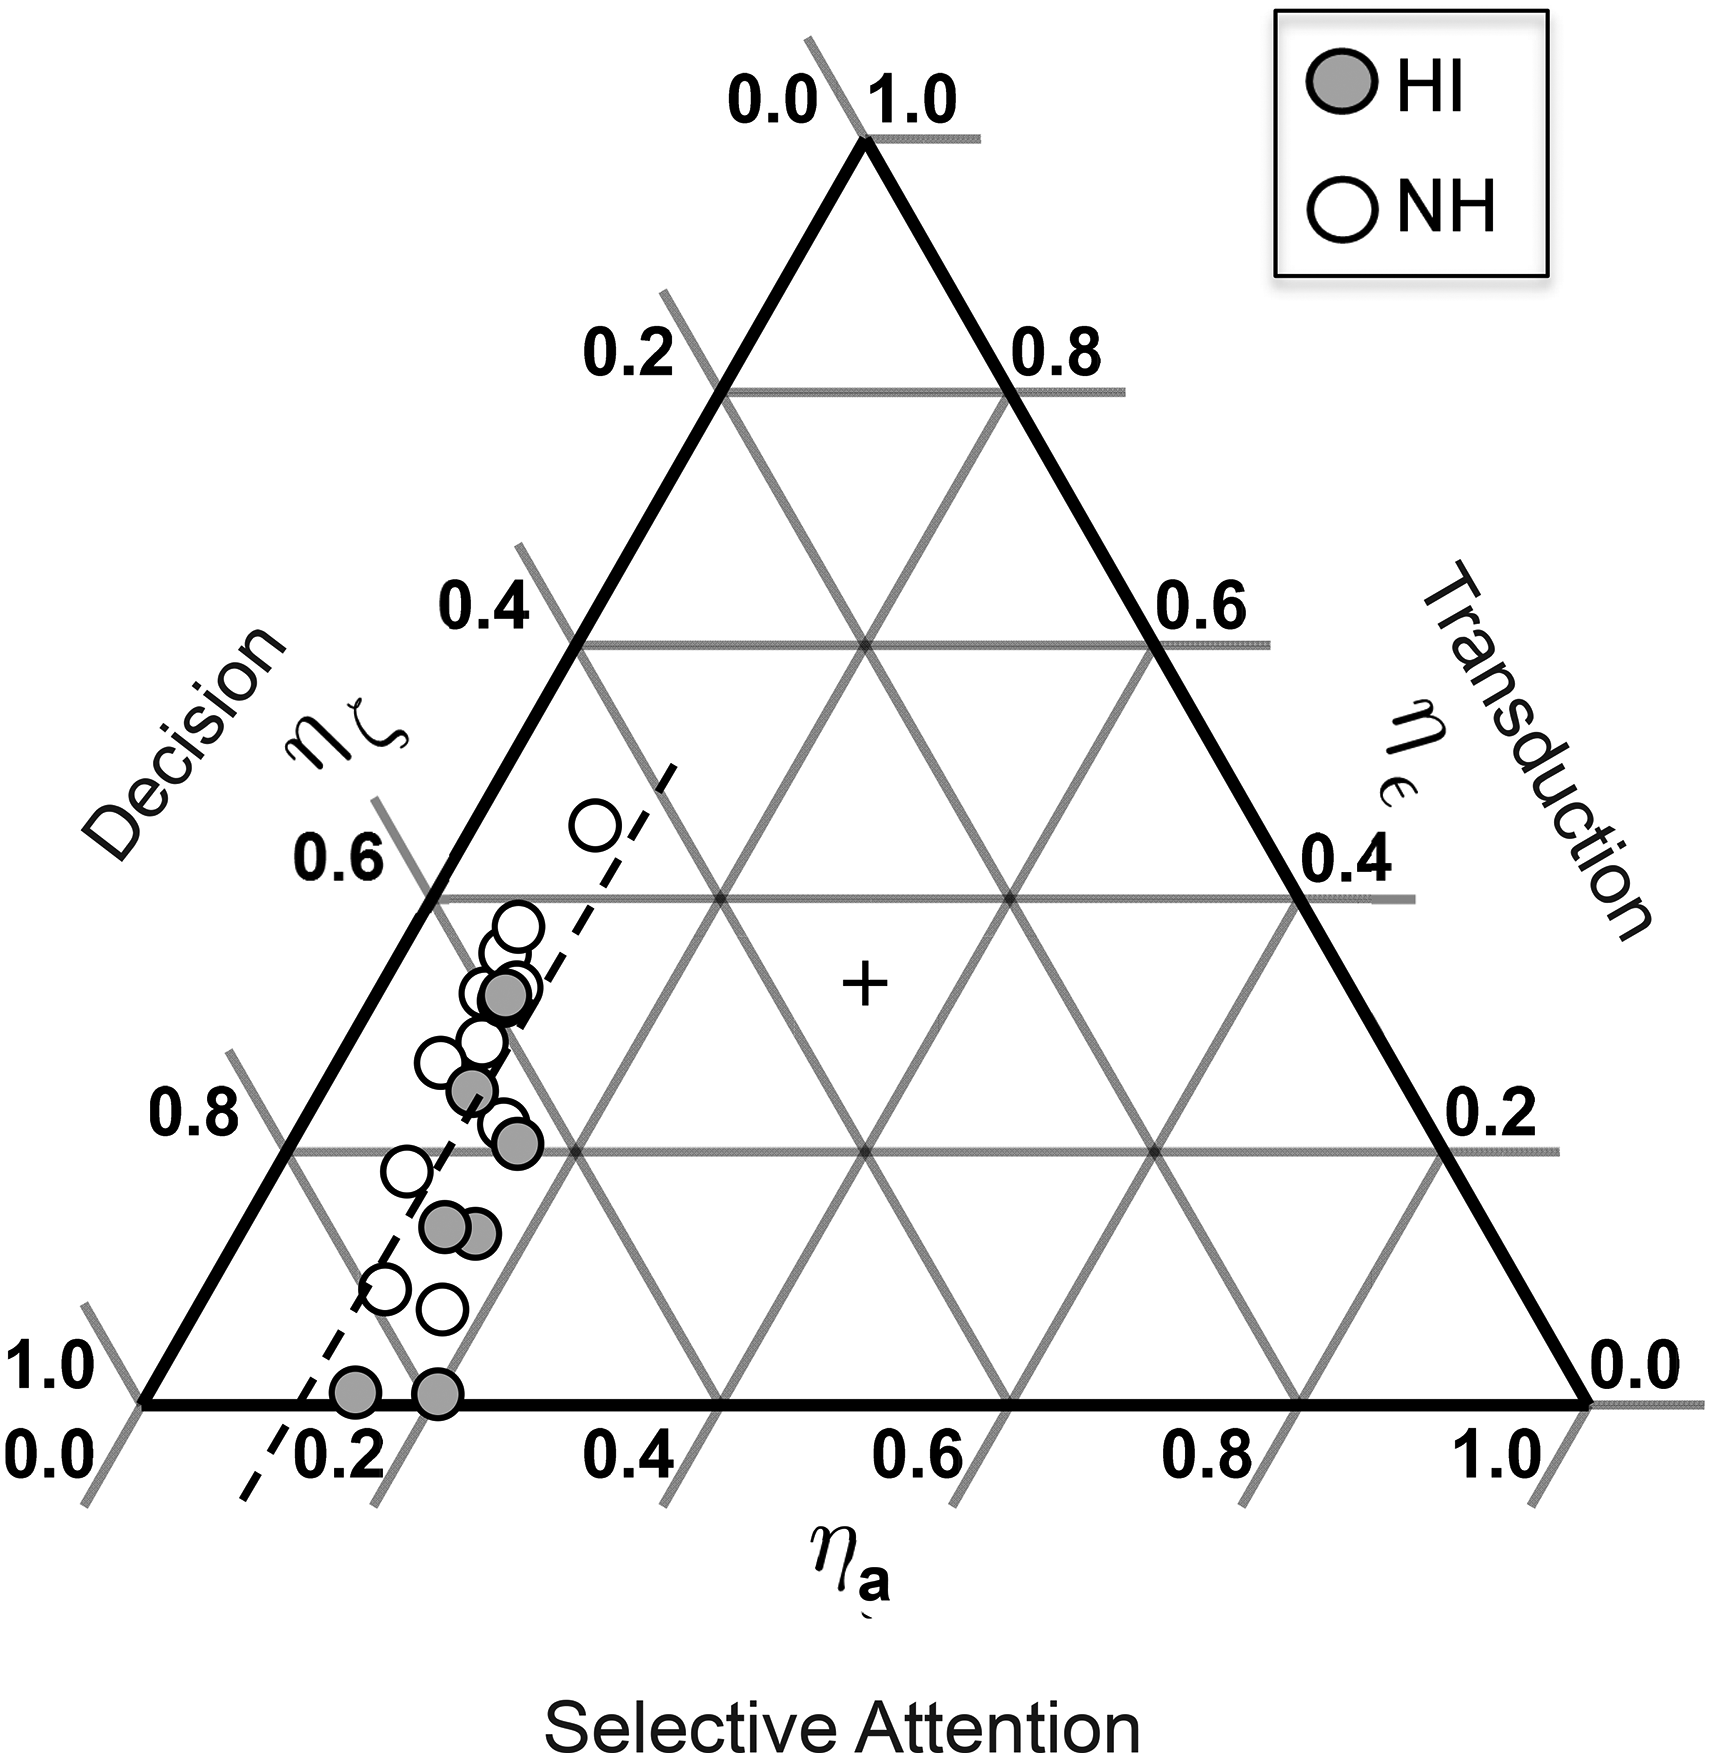
Ternary plots of Figure 2 show the results of the simulation where the values of η at each stage are expressed relative to the other stages. Simulated NH and HI listeners are represented by unfilled and filled symbols, respectively. In these plots the degree to which each stage contributes to the variance among listeners is given by the degree to which the data fall parallel to each axis. For example, in panel A of Figure 2, where the dominant source of listener variance is decision noise ζ, the data fall parallel to the decision access and variance in η

Model simulations. Ternary plots give relative performance efficiency η of each stage for three model scenarios: (A) variance due to decision process, (B) variance due to selective attention, and (C) variance due to transduction. Results for simulated HI and NH listeners given by filled and unfilled symbols, respectively. (see text for further details).
General Methods/ Parameter Estimation
The general methods are in principle the same as those of Lutfi et al. (2021, 2023); specific details regarding stimulus generation and procedure are repeated here. Like many speech-in-noise recognition studies, we focused on two major voice cues for the speech separation task - differences in voice fundamental frequency, F0, and azimuthal location, θ, of talkers (Bronkhorst, 2000, 2015; Kidd et al., 2008). For physical reasons alone, these two cues are most diagnostic for separating natural sound sources including speech (Lutfi, 2008). The speech stimuli were recordings of 200 naturally spoken, grammatically correct, English sentences (Zhou et al., 2021) ranging 1.6 to 2.5 s in duration. Sentence exemplars were from a single native speaker of English whose average F0, using an autocorrelation-based tracker (de Cheveigné & Kawahara, 2002), was estimated to be 170 Hz, which is roughly midway between an average male and female adult speaker. This talker was identified as “Pat”. The original sentences associated with Pat were then processed to produce the sentences of “Jon” and “Jen” differing in F0 (using MATLAB code solaf; Hejna & Musicus, 1991) and θ (using KEMAR head-related transfer functions; Gardner & Martin, 1995). This ensured that only differences in F0 and θ were viable cues for the separation task. Random, independent, and normally distributed trial-by-trial perturbations in F0 and θ for each listener were selected to simulate natural variation in voice pitch (σF0 = 7 Hz after Horii, 1975) and talker location (σθ = 7°). Note, differences in θ may have resulted in a better SNR for HI listeners in one ear. Whether HI listeners use the information in this way does not impact our estimate of the reliance weight for θ as a measure of selective attention to θ. As in real-world listening, talkers never spoke from exactly the same position with the same F0, or spoke the same sentence at the same time. Sentences were played at a 44100-Hz sampling rate with 16-bit resolution using an RME Fireface UCX audio interface. They were delivered to listeners seated in a double-wall, sound-attenuation chamber listening over Beyerdynamic DT990 headphones. Average sound level calibrated at the headphones was 72 dB SPL for both HI and NH listeners.
Listeners were presented with a series of trials in which they heard two of the three talkers speaking simultaneously. One of the talkers was always Pat, the other was equally likely to be Jon or Jen. Pat had a nominal voice pitch (F0) intermediate between Jon and Jen and was located center/front of the listener (θ = 0). Jon had a lower voice pitch than Pat (ΔF0 = -14 Hz) and was located to the left of Pat (Δθ = −14°). Jen had a higher voice pitch than Pat (ΔF0 = + 14 Hz) and was located to the right of Pat (Δθ = + 14°). These values and the random perturbations added (σF0 = 7 Hz and σθ = 7 Hz) were selected to represent typical listening situations where for both NH and HI listeners difficulties arise in recognizing speech in noise (Bronkhorst, 2000, 2015; Kidd & Colburn, 2017). In the speech separation task, listeners were instructed to ignore Pat and identify by button press on each trial whether the other talker was Jon or Jen using the voice pitch and location of Jon and Jen. Listener differences in speech separation were investigated for three major properties of the sentences; linguistic (sentences played forward or reversed), acoustic (F0 vs. θ as the only separation cue), and statistical (increase in Δ vs. decrease in σ for same signal likelihood, same
Listeners underwent a three-step voice (re)familiarization routine before each experimental block of trials. In step 1, they listened passively to a sequence of 20 trials where Jon and Jen alternately spoke a random sentence without perturbation in F0 and θ. Corresponding left-right cartoon images of Jon and Jen were projected synchronously as they spoke on the listener's monitor. In step 2, 20 trials were repeated with different spoken sentences and with projected images fixed throughout. Jon and Jen spoke in random order and listeners identified with feedback who was speaking on each trial. In step 3, task 2 was repeated with Pat added, again without perturbation in F0 and θ for any of the voices. Listeners always performed perfectly or near perfectly on practice trials. For experimental trials, perturbations in F0 and θ were added. Fixed left and right images of Jon and Jen with corresponding location and pitch labels remained projected on the listener's monitor throughout experimental trials. Data were collected in eight blocks of 50 trials per block. Each trial block corresponded to the datum for a single condition and took typically 45 to 60 minutes to complete. Listeners were allowed at their choosing to take breaks between trial blocks.
Altogether 19 NH listeners (ages 19–24 years) and 14 HI listeners (ages 23–83 years) participated in the study. Fourteen of the 19 NH listeners and all 14 HI listeners participated in the separation task. Twelve of the 19 NH listeners and 10 of the 14 HI listeners participated in the recognition task. HI listeners having a unilateral loss (S500, S513, and S514) were not included in the recognition task because of the potential to recognize sentences using their good ear alone. Hearing loss was identified as a pure-tone average (PTA) hearing level (HL) of 20 dB or greater from 0.5 to 4.0 kHz in at least one ear. Given the focus on difficulty listening in noise, 20 dB HL was chosen as the beginning of functional hearing loss rather than the more common 25 dB HL (see Humes, 2019). Averaged audiograms for each group of listeners for each ear are shown with error bars in Figure 3. All listeners presented normal tympanograms and no history of middle ear disease or surgery. All were compensated for their participation with gift cards. Informed consent was obtained from all listeners, and all procedures were followed in accordance with University of South Florida internal review board (IRB) approval.

Averaged audiograms of study participants by ear and hearing status.
Results
Partitioning of Variance
Performance for the speech separation task

Speech separation performance
The first and most notable feature of the data is that for most listeners the properties of the speech have little if any impact on performance. The individual PFs account for 80% or more of the variance across conditions for all but a few listeners, 97% of the variance averaged across NH listeners, and 94% of the variance averaged across HI listeners. The clearly largest effect in the data is the fixed effect of individual listeners across conditions on the slope λsep of the PF, nearly doubling in value from the poorest to the best performing NH listener, and more than doubling in value from the poorest to the best performing HI listener. Most of the remaining variance can be attributed to a few listeners for whom a particular condition posed unusual difficulty. These conditional effects are evident for the two poorest performing NH listeners (S181 and S184) who appear to rely heavily on linguistic cues to perform the task (cf. filled and unfilled circles). Conditional effects are also evident for two HI listeners (S506 and S514) who show greater sensitivity for the location cue alone (cf. filled and unfilled triangles). Curiously, S514 is one of the three HI listeners having a unilateral hearing loss, S500 and S513 being the other two. Notwithstanding these conditional effects, the data show that when equivalent comparisons across conditions are made by expressing listener performance relative to an ideal observer, the largest source of variance in the data is not the different properties of the speech but the fixed effect of listeners on the slopes of the PFs for the different properties of the speech.
Figure 5 next shows the relation between the slopes of the PFs and the PTA thresholds for NH and HI listeners, left and right ears (panels). PTA thresholds show, at best, a weak relation to the slopes within or between groups (unfilled and filled symbols) for either ear (left and right panels). An F-TOST test fell short of supporting equivalence of the within-group variances (±25% bounds, p > 0.5), not surprising given the small number of listeners, but the similarity of these variances suggest they may have a common source. The similarity of these results for NH and HI listeners is not entirely surprising. In real-world cocktail-party listening, as simulated here, differences among talkers in voice pitch (F0) and location (θ) are large and mostly conveyed by harmonicity and interaural time differences at low frequencies (Ritsma, 1967; Stevens & Newman, 1936). This is where most of the audiometric thresholds of our HI listeners fall in the normal range (cf. Figure 3). Hence, while the speech itself for these listeners may be somewhat distorted, even unrecognizable, differences in F0 and θ between talkers are still apparently often heard.

Listener fixed effect on slope λsep of the PF relating
Having identified the listener fixed effect in these conditions as the primary source of listener variance unrelated to the audiogram, we consider next its contribution to the variance in the speech recognition task. Some contribution is naturally expected as speech separation is required for speech recognition, but that contribution may be small given the very different cues for recognition and the different impact hearing loss has on those cues. The question was addressed by determining the shared variance in the slopes of the PFs for the speech separation and recognition tasks using a regression analysis. Figure 6 shows the results where the slopes for the recognition task λrcc are plotted against those for speech separation task λsep for NH and HI listeners. For both groups the variance between tasks is indeed largely shared, a linear regression (dashed line) accounting for 88% of the variance within and between groups. The slope of the regression curve is greater than 1.0 such that the small effect of hearing loss evident in the mean difference between groups for separation is scaled up in the mean difference for recognition (dotted lines). To the authors’ knowledge, these data are the first to establish a direct functional relation between speech separation and speech recognition in noise for the same listeners, same stimuli, under identical listening conditions (cf. Guo et al., 2025; Holmes & Griffiths, 2023; Wasiuk, 2022). They could have turned out differently given the fundamentally different cues and processes involved in speech separation and recognition. Taken together, the results of Figures 4 to 6 suggest that the variance in speech recognition in these conditions is in large measure due to the common problem both NH and HI listeners have with speech separation.

Relation between PF slopes λ for speech in noise recognition and speech separation, NH and HI listener data represented by unfilled and filled symbols, respectively. Dotted lines show that the small effect of hearing loss evident in the mean difference between groups for separation is scaled up in the mean difference for recognition.
Having now the values of λsep and λrec, and λ
Obtained relative performance efficiency η of each stage of the integrative model plotted as in Figure 2.
Interaction: cue Sensitivity and Reliance
This section next provides evidence for an interaction between stages. Figure 7 showed cue reliance to have little impact on the NH and HI group difference in performance, but subsequent analyses showed a fundamental difference in the reliance weights for the two groups. Figure 8 gives these weights as relative values

Relative cue reliance plotted against relative cue sensitivity for NH and HI listeners, unfilled and filled symbols, respectively. See text for details.
This brings us to question 3 of the study. Can the information provided by the model be used to deliver a benefit for HI listeners in the task? There are two ways the information in Figure 8 might be used to make this happen, by enhancing the cue the HI listeners rely on most or by enhancing the cue they rely on least (e.g., Richardson et al., 2025). The two approaches were tested by using the single cue data of Figure 4 (filled and unfilled triangles of Figure 4). These two conditions represent the two extreme cases where ‘enhancement’ corresponds to all acoustic information for the task being shifted to either the most or least relied on cue as previously determined from the estimated reliance weights. Figure 9 shows the results of this test using the data from all 28 participants in Figure 4. The abscissa gives the values of λsep for the linguistic cues present condition where both F0 and θ served as equally viable cues (filled circles in Figure 4). The ordinate gives the values of λsep for the single cue conditions where filled and unfilled symbols give, respectively, the values for the least and most relied on cue. Note that the data are given as λ values, so if neither condition provides a benefit or a cost the data should fall on the diagonal of Figure 9. For the NH listeners (left panel) the results are mixed, the two conditions equally often producing a benefit or a cost. By comparison all but 3 of the 14 HI listeners derive a benefit when information is shifted to the preferred cue and no HI listener receives a benefit when the information is shifted to the least preferred cue, most experience a cost.

Cost/benefit for HI (left panel) and NH (right panel) listeners in the speech separation task of shifting information to the least (filled symbols) vs. most (unfilled symbols) relied on cue. See text for details.
Discussion
The present study addressed a fundamental problem in audiology: identifying why many difficulties recognizing speech in noise go undetected by the audiogram. Research over the past two decades has identified likely contributing factors but has yet to offer a means for breaking down the collective influence of these factors where, as in natural listening situations, each plays some role. The goal of the present study was to provide an initial test of the feasibility of an integrative model that could serve this purpose in different listening scenarios. The results offered preliminary support. Across tasks involving the processing of the linguistic, acoustic, and statistical properties of speech, the largest source of listener variability not accounted for by the audiogram was a listener fixed effect on speech separation. A significant 88% of this variability was shared with speech recognition. The fixed effect was tied in the model to differences in the ability of listeners at a late decision stage to separate signals based on their different statistical properties. Cue reliance associated with selective attention in the model had the greatest impact overall on performance but contributed little to the individual differences in performance. Evidence for an interaction between selective attention and transduction was also found wherein HI listeners placed greater reliance on the cue for which they were most sensitive. The interaction contributed little to performance differences between HI and NH listeners, but when information was shifted to the most relied on cue HI listeners received a benefit for speech separation, NH listeners did not.
Speech separation has long been acknowledged to be an essential component of speech recognition in noise, as has the statistical properties of speech for speech separation. Cherry (1953) gave the problem its modern name, the ‘cocktail-party problem’ and described it fundamentally as a “statistical separation”. Nowadays, accounts more often appeal to principles of perceptual organization (common fate, similarity, continuity, and the like) than statistics, but these principles too can be shown to have statistical representations in computational approaches to the problem. In computational approaches source separation is accomplished by maximizing the statistical independence of the internal representation of signals (Bell & Sejnowski, 1995). This provides a framework for how listeners might achieve optimal decision-making, the basis of the present approach to integrative modeling. An opposite example applied to human source separation is the information divergence hypothesis (Lutfi, 2023; Lutfi et al., 2013). Information divergence, otherwise known as Kullback–Leibler divergence, DKL, forms the basis for many objective functions used to maximize statistical independence (Kullback & Leibler, 1951). Where signal distributions are equal-variance Gaussian, as they are in the present study,
Until now, no clear functional link had been established between speech separation and speech recognition in noise using the same listeners, procedures, and stimuli (cf. Guo et al., 2025; Holmes & Griffiths, 2023; Wasiuk, 2022). No theoretical framework, moreover, had been offered for quantifying the relative impact of factors operating collectively. This study did both for a common speech-in-noise recognition task to identify the fixed effect for speech separation as the primary source of variability within diagnostic groups. Lutfi et al. (2021) reported early evidence of a listener fixed effect among NH listeners for conditions similar to the present study, although they did not model it or try to determine its relation to the audiogram. The stimuli were ABA sequences of synthesized vowels rather than the spoken sentences used here; the separation task was also different for all but one condition. Overlapping PFs for the two manipulations of each speech property were found, as well as for two different versions of the separation task. Four-point PFs also showed the random effect of replications (associated with the residual noise ζ in the present model) to be quite small compared to the fixed effect. The study did not attempt to establish a relation to speech recognition and the evidence for the fixed effect was not as compelling as different listeners participated in different conditions. The study did however replicate the failure of reliance weights to account for performance differences among listeners, a result that has now been widely documented in other studies involving different tasks and procedures for both speech and nonspeech stimuli (Lutfi et al., 2020, 2022, 2023; Lutfi & Liu, 2007).
The strong relation between cue sensitivity and cue reliance observed here for the HI listeners (Figure 7) is another new result but should come as no surprise. The HI listeners are behaving as they should, like ideal observers they are placing greatest reliance on the cue for which they are most sensitive. The consequential result is that shifting information to the most relied on cue provides a benefit in speech separation only for the HI listeners (Figure 9). This outcome could have implications for the clinic. Directional microphones in hearing aids are commonly used to improve SNR, but they can also result in tunnel hearing (Best et al., 2018; Neher et al., 2017; Rallapalli et al., 2021). The benefits are highly varied, and it is not clear whether the SNR improvement alone is sufficient for the listeners, or if they would benefit from the added spatial cues, particularly in high background noise levels (Kidd et al., 2020). Real differences in reliance weights can be determined in relatively few trials (Lutfi, 1995) and might be practically used in the clinic to identify these listeners for targeted treatment.
This was a first attempt at integrative modeling. The results are considered positive given the many possible outcomes that might have rendered the approach impractical. Future tests will be required to evaluate the ultimate utility of the approach. The present test was one case, cocktail-party listening, where stimulus uncertainty σ was high, a condition that would favor a dominant fixed effect (Kidd & Colburn, 2017, Figure2A). A different outcome would be expected if there were less stimulus uncertainty, smaller σ, or if a listener had unusually poor STR, a factor shown to be strongly correlated with speech recognition in noise (Bernstein et al., 2013). What is the relative impact of these factors, how might they interact, and how might their role change for different listeners in different listening scenarios? Integrative modeling can potentially answer these questions through the partitioning of variance associated with factors, individual correlations will not. This is the incentive for an integrative approach.
Footnotes
Acknowledgements
The authors would like to thank Gabriella Brown, Angelina Natalie, Reagan Huynh, and Alberta Tran for their assistance in collecting the data. Dr. Bernhard Laback and two anonymous reviewers provided helpful comments on an earlier version of the manuscript. This research was supported by NIDCD grant R01 DC001262-30.
Data Availability Statement
The data that support the findings of this study are available from the corresponding author upon request.
Funding
The authors disclosed receipt of the following financial support for the research, authorship, and/or publication of this article: This work was supported by the National Institute for Deafness and Other Comm (grant number NIH R01 DC001262-32).
Declaration of Conflicting Interests
The authors declared no potential conflicts of interest with respect to the research, authorship, and/or publication of this article.