
Abstract
This study investigated differences in auditory brainstem responses (ABRs) using the paired-click paradigm between young adults frequently exposed to loud sounds and those not. Young adults with normal hearing were divided into two groups: an exposed group (n = 23), who were frequently exposed to loud sounds through music practice, and a control group (n = 21). Sound exposure levels (measured via smartwatch), hearing thresholds (0.125–16 kHz), distortion product otoacoustic emission (DPOAE) magnitudes, word intelligibility, and ABRs to single and paired clicks were obtained. For paired-click ABRs, root mean square values for the post-wave I response delayed from the wave I peak (RMSpost-w1) were calculated for second-click responses. The exposed group exhibited higher sound exposure levels than the control group. Despite similar hearing thresholds, DPOAE magnitudes, wave I peak amplitudes and wave I/V amplitude ratio, the exposed group showed significantly lower RMSpost-w1 values for second-click responses than the control group. No significant group difference was observed in word intelligibility. The results showed that frequent loud sound exposure may induce peripheral auditory changes consistent with cochlear synaptopathy (CS). This suggests that the paired-click stimulation paradigm may offer a way of detecting noise-induced CS.
Keywords
Introduction
Hearing loss has become a global issue (Wilson & Tucci, 2021). The World Health Organization (WHO) has estimated that over 1.5 billion people currently experience some degree of hearing loss, which could increase to 2.5 billion by 2050 (WHO, 2021). Although hearing loss can be caused by various factors, noise exposure is a major contributor. Occupational noise exposure has long been recognized as a major risk factor for hearing loss. However, in recent years, recreational sound exposure (e.g., listening to music loudly and attending music events) has also come to be considered a significant contributor to hearing loss (Natarajan et al., 2023; Sliwinska-Kowalska & Davis, 2012). According to WHO estimates in 2015, 1.1 billion young adults are at risk of hearing loss due to prolonged and excessive exposure to loud sounds, including music listened to through personal audio devices (WHO, 2015). A more recent review reported that 1.3 billion young adults are at risk of permanent, avoidable hearing loss, primarily due to unsafe listening practices (e.g., amplified music) (Dillard et al., 2022). As auditory damage is typically irreversible, it is essential to implement effective preventive strategies before hearing loss occurs.
Recent animal studies have reported that noise exposure induces the loss of ribbon synapses between inner hair cells and auditory nerve fibers (ANFs), a condition referred to as cochlear synaptopathy (CS). (Furman et al., 2013; Jensen et al., 2015; Kujawa & Liberman, 2009; Lin et al., 2011; Maison et al., 2013; Valero et al., 2017). In addition to noise exposure, CS has been associated with aging (Altschuler et al., 2015; Gleich et al., 2016; Liberman et al., 2014; Möhrle et al., 2016; Sergeyenko et al., 2013) and drug exposure (Bourien et al., 2014; Liu et al., 2015). Since CS is regarded as the initial sign of lesion in the development of hearing loss (Fernandez et al., 2020), its detection may serve as a key to the early diagnosis of hearing loss.
The ANFs are categorized into three subtypes based on their spontaneous firing rates: low-, medium-, and high-spontaneous rate (SR) fibers (Kim & Molnar, 1979; Liberman, 1978; Schmiedt, 1989). Low- and medium-SR fibers are often collectively referred to as low-SR fibers. High-SR fibers primarily mediate sound detection in quiet conditions and contribute to hearing thresholds. In contrast, low-SR fibers play a crucial role in encoding suprathreshold acoustic signals, particularly under noisy conditions, and more effectively represent envelope timing cues at comfortable listening levels (Bharadwaj et al., 2014; Costalupes et al., 1984; Joris & Yin, 1992; Liberman, 1978). Previous studies have shown that CS could preferentially affect low-SR fibers more than high-SR fibers (guinea pigs: Furman et al., 2013; gerbils: Schmiedt et al., 1996). In contrast, a study in mice reported that CS affected both fiber types, suggesting that the nature of noise-induced CS differs across species (Suthakar & Liberman, 2021). Although the characteristics of CS in humans remain to be fully understood, the selective vulnerability observed in several animal models may suggest a similar tendency in humans. Such a possibility could account for hearing difficulties experienced in situations with background noise and/or reverberation despite normal hearing thresholds, a condition referred to as hidden hearing loss (Schaette & McAlpine, 2011).
Studies investigating CS in humans have typically utilized the auditory brainstem response (ABR) as an index that could reflect CS. The first and second peaks of the ABR (waves I and II) are believed to be generated by the distal and proximal ends of the ANFs, respectively (Eggermont, 2019; Møller et al., 1988; Parkkonen et al., 2009). Several studies have provided evidence that wave I peak amplitude decreases with age, consistent with age-related CS in humans (Bramhall et al., 2015; Carcagno & Plack, 2020; Grant et al., 2020; Johannesen et al., 2019; Konrad-Martin et al., 2012). In contrast, findings regarding noise-induced CS in humans remain controversial. While some studies have shown a relationship between ABR measurements and noise exposure (Bramhall et al., 2018; Çıldır & Tokgöz-Yılmaz, 2024; Kikidis et al., 2020; Liberman et al., 2016; Wang et al., 2021), others have failed to observe such a relationship (Fulbright et al., 2017; Grinn et al., 2017; Pinsonnault-Skvarenina et al., 2022; Prendergast et al., 2017a; Washnik et al., 2023). This discrepancy may be attributed to variability in participant characteristics, experimental design, and statistical methodology, as suggested in a recent review (Dias et al., 2024). Moreover, several studies have suggested that ABR measures may not be sensitive enough to detect CS (Bramhall et al., 2021; Guest et al., 2018). Notably, it is likely that the wave I peak amplitude mainly reflects the activity of high-SR fibers and not low-SR fibers (Bourien et al., 2014). Therefore, assuming that CS preferentially affects low-SR fibers in humans, it may be difficult to detect CS using wave I amplitude measurements.
We have focused on the characteristics of ANFs and proposed that ABRs measured using a paired-click stimulation paradigm (i.e., two successive clicks separated by a defined inter-click interval [ICI]) may serve as an index reflecting CS (Fujihira et al., 2024). This paradigm has been used to objectively evaluate temporal resolution (Bidelman & Khaja, 2014; Henry et al., 2011; Ohashi et al., 2005). In general, the responses of ANFs to the second click of paired clicks are weaker than those to the first click, but they gradually recover as the ICI increases, which is thought to reflect adaptation at the cochlear synapse (Chimento & Schreiner, 1991; Eggermont & Spoor, 1973, 1974) as well as ANF refractoriness (Gaumond et al., 1982; Lütkenhoner et al., 1980; Parham et al., 1996). An earlier animal study utilizing this paradigm demonstrated that low-SR fibers showed a shorter recovery time than high-SR fibers (Parham et al., 1996). This implies a reduced influence of high-SR fibers on the ABR elicited by the second click, which may enhance the relative contribution of the low-SR fiber activity. Based on this rationale, we adopted a paired-click stimulation paradigm for ABR measurements. Furthermore, in analyzing the ABRs, we focused on the response magnitude in a range delayed from the wave I peak. This is because the firing of low-SR fibers is delayed from the wave I peak and has a broad temporal distribution predominantly approximately 0.5–2 ms afterward, as shown in Figure 6 of Bourien et al. (2014). Using these methods, we have shown that the responses to second clicks significantly decrease with increasing age and declining word intelligibility scores in degraded listening conditions (Fujihira et al., 2024). However, it remains unclear whether ABRs using a paired-click stimulation paradigm can reflect noise-induced CS.
This study aimed to assess ABRs using the paired-click stimulation paradigm in young adults who were either likely or unlikely to have been exposed to loud sounds that could induce CS. This approach involved comparing young adults with normal hearing thresholds who were frequently exposed to loud sounds through music practice with those who were not. We hypothesized that young adults who engaged in frequent music practice would exhibit reduced responses to the second click relative to the adults in our control group.
Methods
Participants
Two groups of young adults with normal hearing thresholds were recruited for this study: one whose members reported being currently and frequently exposed to loud sounds through music practice (exposed group), and a second, age-matched group with no history of such exposure (control group). All participants met the inclusion criteria of having audiometric air conduction thresholds of ≤20 dB HL across the frequency range of 0.125–8 kHz at both ears and no history of otological or neurological disorders. One control adult was excluded because of abnormal ABR wave I latency (> 3 ms). The final participants included 23 exposed adults (aged 18–24 years; six females) and 21 control adults (aged 19–24 years; six females). Table 1 provides an overview of the types of instruments played, practice frequency, and duration of musical experience among the exposed adults.
The Types of Instruments Played, Practice Frequency, and Duration of Musical Experience Among the Exposed Adults.

All experimental procedures were approved by the Institutional Review Board of Kyushu University and were conducted in accordance with the Declaration of Helsinki. Written informed consent was obtained from all participants, who received monetary compensation for their participation in the study.
Sound Exposure Levels
To compare the levels of sound exposure experienced by the two groups in daily life, we obtained data on headphone audio levels and environmental noise levels using the iPhone Health application (Apple Inc., Cupertino, CA, USA). Headphone audio levels were recorded when participants listened to music via earphones or headphones connected to their iPhones with version 8 or later, or 2nd generation SE. To assess environmental noise exposure, participants were provided with an Apple Watch Series 2, which continuously recorded sound levels for 1 week before the experimental session. For the exposed adults, this recording period included at least one session of music practice. Participants were instructed to wear the smartwatch as consistently as possible because data collection occurred only when the device was worn on the wrist. To minimize data loss, participants were advised to charge the smartwatch during sleep. Each smartwatch was paired with the participants’ iPhones. Participants exported their exposure data through the iPhone Health application on their paired smartphones and subsequently emailed the data to us as attachments. No personal information other than sound exposure data were included in the analysis.
The equivalent continuous A-weighted sound pressure levels (LAeq) were calculated to quantify sound exposure. LAeq is defined as the average A-weighted sound pressure level of noise fluctuating over time. Because the smartwatch did not provide samples at regular time intervals, the cumulative noise exposure, 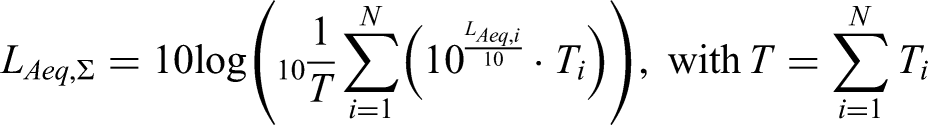
The sound exposure level data included the audio levels of the headphones and environmental noise levels. When the participants listened to music through earphones or headphones connected to their iPhones while wearing a smartwatch, both levels were recorded simultaneously. In such cases, headphone audio levels were prioritized in the calculation of LAeq based on the assumption that participants were actively listening to music rather than environmental sounds.
Hearing Thresholds
Pure-tone air conduction thresholds were measured at octave frequencies (0.125–8 kHz). Extended high-frequency (EHF) air conduction thresholds were obtained at six frequencies (9, 10, 11.2, 12.5, 14, and 16 kHz). Thresholds were assessed using an audiometer (AD629, Interacoustics) with circumaural headphones (DD450, RadioEar).
Distortion Product Otoacoustic Emissions
To assess outer hair cell function, distortion product otoacoustic emissions (DPOAEs) were measured for each participant. Measurements were performed using an OAE screener (ER-60, RION). DPOAEs were elicited by presenting simultaneously two pure tones of different frequencies (F1 and F2) to the test ear (right ear) with an F2/F1 ratio of 1.2. The F2 tones were varied at 1.5, 2, 3, 4, 5, and 6 kHz. The stimulus levels were set at 65 dB SPL and 55 dB SPL for F1 and F2 tones, respectively. The levels of DPOAEs at a frequency of 2F1–F2 and the corresponding noise floor were recorded as a function of F2. Stimulus duration (2–30 s) depended on the measurement environment due to the use of a protocol minimizing ambient and participant-related noise. DPOAE magnitudes (signal-to-noise ratios [SNRs] in dB) were obtained by subtracting the noise floor from the DPOAE levels.
Word Intelligibility Performance Task
The methods adopted for this assessment were based on those described by Fujihira et al. (2024). Test words were selected from the Japanese Familiarity-Controlled Word Lists 2007 (FW07) within a minimum familiarity range of 1.0–2.5 (Kondo et al., 2008). Each word consisted of four morae. A list of 20 words was presented under each of five experimental conditions: (1) original audio, (2) the presence of a multi-talker noise masker (Yonemoto et al., 1989) at 0-dB SNR, or (3) the same but at −5-dB SNR, or (4) the words convolved with an impulse response for a reverberation time of 2.08 s (station concourse) (SMILE2004, Architectural institute of Japan) in the presence of the multi-talker noise masker at 0-dB SNR, or (5) the same but at −5-dB SNR. Stimuli were delivered monaurally to the test ear (right ear) via circumaural headphones (HDA200, Sennheiser) at 65 dB LAeq. The participants were instructed to write down each word they perceived using Japanese Kana or Katakana orthography. Word intelligibility scores were calculated as the percentage of morae written down correctly. In the statistical correlation analyses, the averaged-scores for the word intelligibility score under conditions (2)–(5) were used as the scores for word intelligibility under degraded listening conditions.
ABR Measurement
The stimulus consisted of paired clicks, each comprising two successive monophasic square pulses with a duration of 104.2 μs per pulse. The ICIs were set at either 2 ms or 0 ms, where the 0 ms condition represents a single click stimulus. As shown in Figure 7 of Parham et al. (1996), at an ICI of 2 ms, the responses to the second clicks recovered to approximately 60% in low-SR fibers but only about 40% in high-SR fibers. Therefore, the responses to the second clicks at this ICI are considered to mainly reflect low-SR fiber activity. Furthermore, responses to the second clicks at this ICI showed significant correlations with age and word intelligibility scores (Fujihira et al., 2024). For these reasons, the 2-ms condition was adopted in the present study. All stimuli were generated using MATLAB R2021b (MathWorks, Inc., Natick, MA, USA) at a sampling frequency of 48 kHz.
Stimuli were presented to the right ear using Audacity software (http://audacity.sourceforge.net/) via an AD/DA converter (Fireface UCX, RME) and an insert earphone (3A ABR, 3 M Company, Indianapolis, IN, USA) at an intensity of 105.1 dB peSPL (73 dB nHL). Each stimulus polarity (condensation and rarefaction) was presented for 5,000 sweeps, resulting in a total of 10,000 sweeps per ICI condition. Paired-click stimuli were presented randomly with interstimulus intervals of 90 ms. The participants were positioned supine on a comfortable flat chair within an acoustically and electrically shielded booth. They were instructed to relax, refrain from moving, and sleep as much as possible.
The methods adopted here were largely as reported by Fujihira et al. (2024). All recordings were performed using a Biosemi Active Two system with an ABR module (BioSemi, Amsterdam, Netherlands). Responses were measured at the high forehead (Fz), as specified in the international 10–20 system (Jasper, 1958), referenced to the right ear canal (using an electrode custom-made from a BioSemi electrode that was connected to a gold-foil Tiptrode), with the forehead as the ground. The ear canal to Fz electrode montage has been reported to be sensitive to the evoked potentials generated by the auditory nerve (Parthasarathy et al., 2020). The sampling frequency was 16,384 Hz. The offsets of the active electrodes and the Tiptrode electrode were kept below 20 and 240 mV, respectively, at the start of the measurement. The measurement data were recorded as a BDF file.
The continuous recordings were analyzed using MATLAB R2021b (MathWorks, Inc., Natick, MA, USA). Upon loading the BDF files, the data were divided by 2048 to restore the original recorded values. Subsequently, the bandpass-filtering was performed between 70 and 3,000 Hz using a 6th-order Butterworth filter, and any artifacts were rejected (±30 μV). After this rejection, at least 9,666 responses for each ICI condition were used in subsequent analyses. The responses were averaged with a time window from −5 to 15 ms relative to the stimulus onset at 0 ms, with a baseline correction from −5 to 0 ms.
The response to the second click overlapped with that to the first click when the ICI was set at 2 ms. Following past studies using the paired-click stimulation paradigm (Bidelman & Khaja, 2014; Fujihira et al., 2024; Henry et al., 2011; Lee et al., 2021), we extracted the second-click responses by subtracting the response for the 0 ms ICI (single-click response) from that for the 2 ms ICI (paired-click response). The resulting responses were considered to primarily reflect those to the second click.
Studies investigating CS in humans have used the wave I peak amplitude (Bramhall et al., 2015, 2018; Carcagno & Plack, 2020; Çıldır & Tokgöz-Yılmaz, 2024; Fulbright et al., 2017; Grant et al., 2020; Johannesen et al., 2019; Kikidis et al., 2020; Konrad-Martin et al., 2012; Pinsonnault-Skvarenina et al., 2022; Prendergast et al., 2017a; Wang et al., 2021; Washnik et al., 2023) or the wave I/V amplitude ratio (Grose et al., 2017; Pinsonnault-Skvarenina et al., 2022; Schaette & MaAlpine, 2011) as an index that could reflect CS. In the present study, these measures were obtained from the single-click and second-click responses. Regarding the single-click responses, peaks corresponding to waves I and V were automatically selected as the largest peaks within the time windows of 1.0–2.5 and 5–6.5 ms, respectively. Subsequently, the peak latencies and amplitudes were visually verified by two of the authors. For six participants, wave IV had initially been selected instead of wave V, and the wave V peak was manually identified. For the second-click responses, waves I and V were automatically selected as the largest peaks within a −0.5 to 1.0 ms time window around the expected peak timing. The expected timings were estimated by adding the wave I and V peak latencies obtained from the single-click responses to the onset time of the second click. That is, these timings refer to the time points at which the wave I and V peaks would appear for the second click. Subsequently, the peak latencies and amplitudes were visually verified by two of the authors. For one participant, the wave I peak was manually identified.
Low-SR fibers are characterized by delayed and temporally dispersed firing relative to the wave I peak (Bourien et al., 2014). Additionally, they exhibit a faster recovery from adaptation in response to the second stimulus than high-SR fibers (Parham et al., 1996). Similar to Fujihira et al. (2024), therefore, the present study obtained the magnitude for the second-click response in a time range delayed from the wave I peak. This response is referred to as a post-wave I response. Root mean square values for the post-wave-I response (RMSpost-w1) were calculated as an index of response magnitude, which is considered to reflect the number of firing neurons and/or the synchrony of their activity. The RMS value was calculated using the following equation based on N response data points (X) within the time range described below.
The time range for deriving the RMSpost-w1 was determined for each participant as follows. First, the wave I peak latency for the single-click response was measured as described above. Next, the expected wave-I-peak timing for the second-click response was estimated by adding the wave I peak latency obtained from the single-click responses to the onset time of the second click. Finally, we calculated the RMSpost-w1 using an analysis window starting 0.5 ms after the expected wave-I-peak timing and extending over a 1.5-ms interval. This time window was set somewhat arbitrarily by referring to the results of Figure 6 in Bourien et al. (2014), as the period starting from the time when the activity of low-SR fibers begins to increase and not including the wave III peak. Figure 1 shows an example of RMSpost-w1 calculation for a control adult.
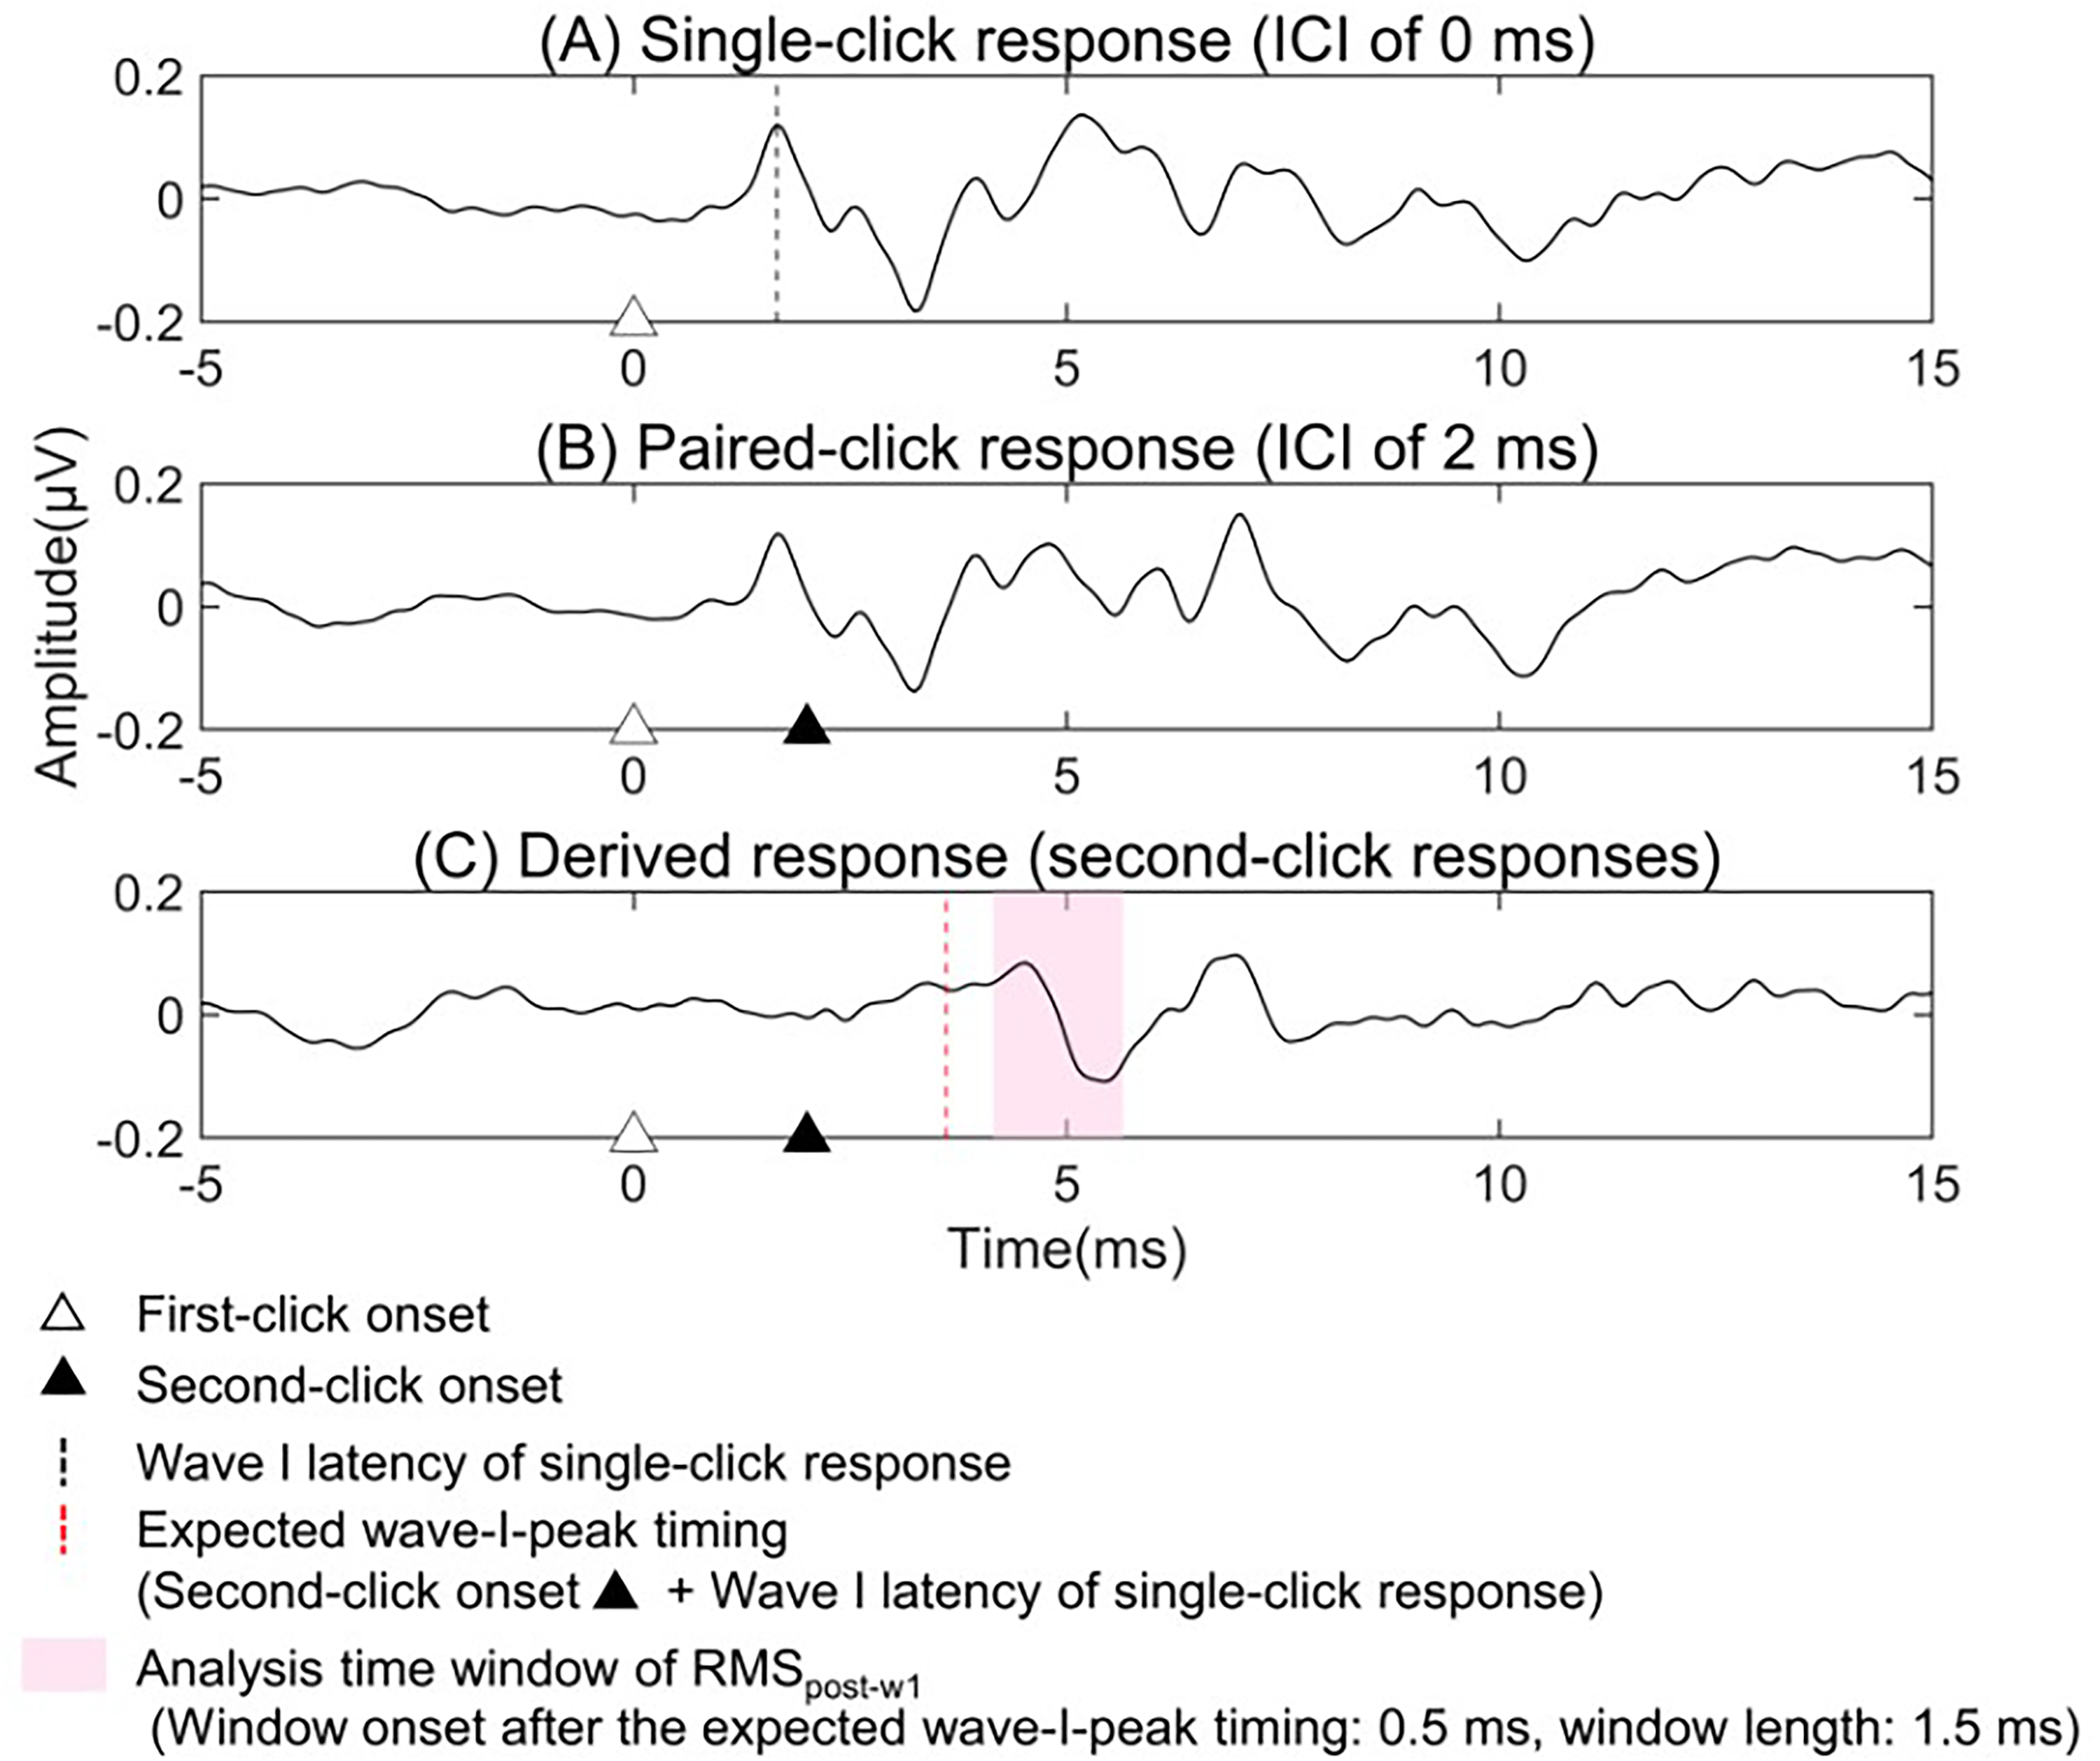
An example of RMSpost-w1 calculation for a control group adult. The second-click response (C) was derived by subtracting the single-click response (A) from the paired-click response (B). The RMSpost-w1 was calculated from amplitude values within the latency window (pink region) between 0.5 and 2 ms after the expected wave-I-peak timing in the second-click response.
To examine the extent to which the choice of analysis window parameters would impact the group difference, we compared the RMSpost-w1 for the exposed and control groups for the various analysis intervals in the present study, following the analytical approach employed by Fujihira et al. (2024). For this analysis, the window onset was varied from −1 to 2 ms in 0.1 ms steps relative to the expected wave-I-peak timing (0 ms for the window onset indicates the point in time where the wave I peak for the second click would appear). The window length was varied from 0.1 to 2 ms in 0.1 ms steps.
Statistical Analyses
Statistical analyses were performed using SPSS version 23 (SPSS Inc., Chicago, IL, USA) and MATLAB R2023b (MathWorks, Natick, MA, USA). Welch's t-test was applied to sound exposure levels and the recording time of sound exposure levels. Fisher's exact test was used to assess group differences in sex. Student's t-test was performed for age and the RMSpost-w1 value. A two-way mixed-design analysis of variance (ANOVA) with group and frequency as main factors was conducted over the hearing thresholds and the DPOAE magnitudes. A two-way mixed-design ANOVA with group and listening condition as main factors was conducted on the word intelligibility scores. Greenhouse-Geisser corrections were applied when the sphericity assumption was violated. For wave I and V peak amplitudes, latencies, and the I/V amplitude ratio, a two-way mixed-design ANOVA with group and click condition (single-click response vs. second-click response) as main factors was performed. ABR data exceeding ±3 standard deviation (SD) from the respective means were identified as outliers and excluded from the analysis. One participant in the exposed group was excluded for the wave I peak amplitude; and three participants in the exposed group and three participants in the control group were excluded for the I/V amplitude ratio. Pearson correlation coefficients were calculated to examine the relationships between sound exposure levels and word intelligibility performance under degraded listening conditions, as well as between ABR measures and sound exposure levels or word intelligibility performance under degraded listening conditions.
Results
Sound Exposure Levels
Sound exposure levels were evaluated using headphone audio and environmental noise data obtained from the iPhone Health application. Figure 2 shows the LAeq values for the exposed and control groups. A significant difference was found between the two groups, with the exposed group exhibiting higher values than the control group (t(37.6) = 6.176, p < .001).
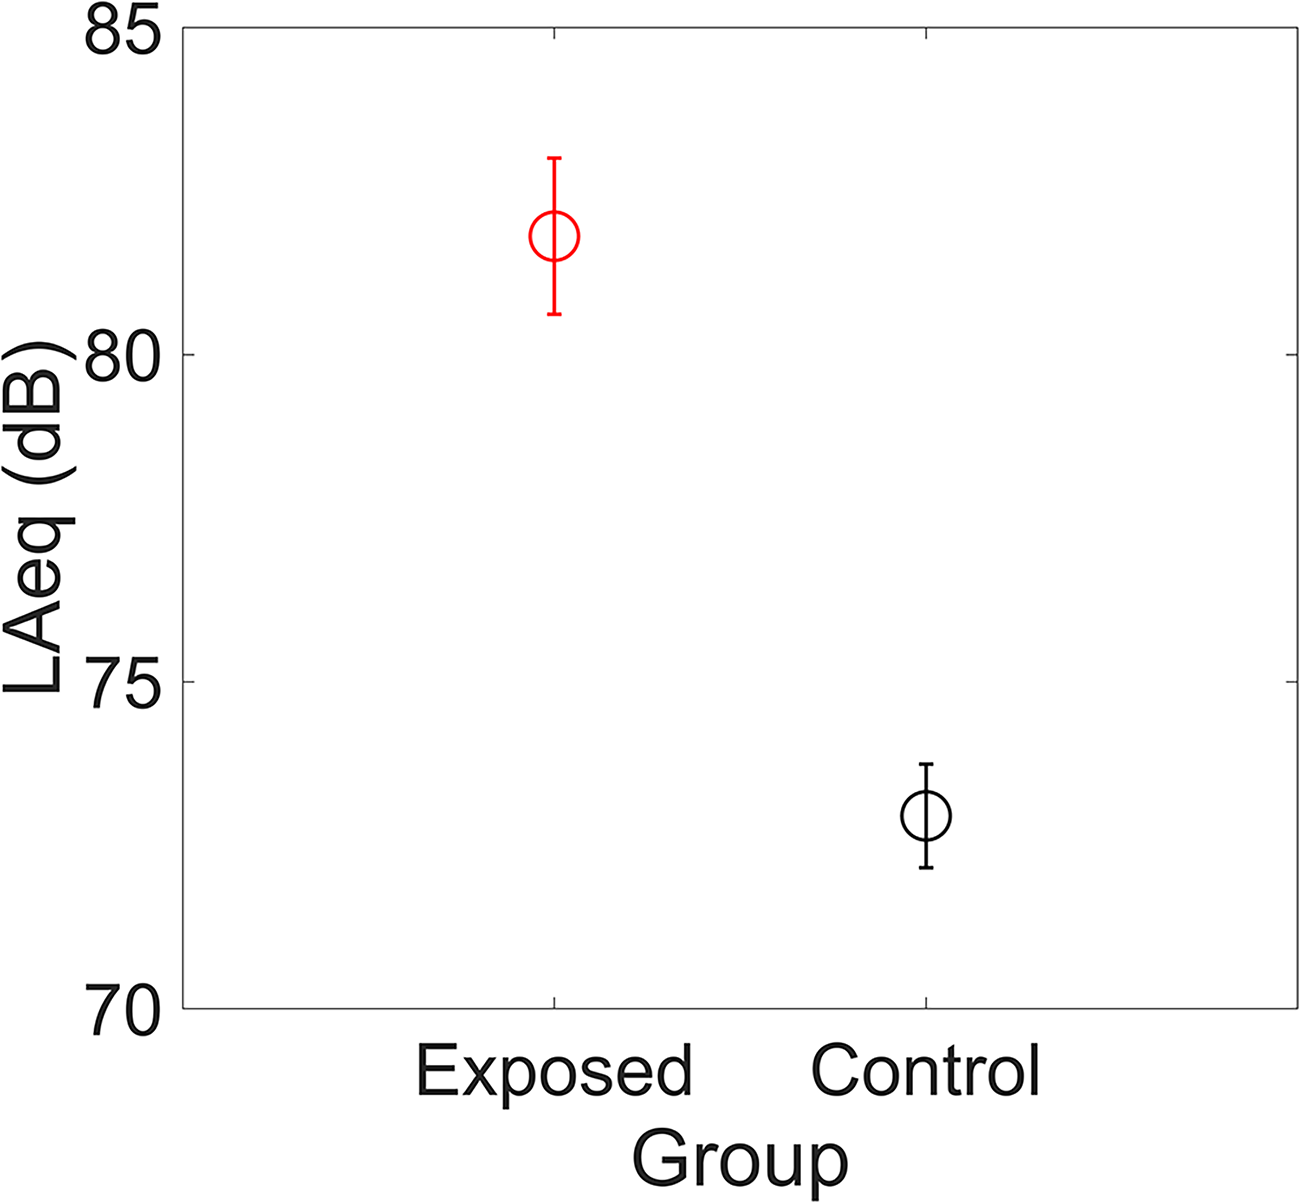
Means of the LAeq values for the exposed and control groups. Error bars indicate the SEs across participants.
The mean daily recording time was 12.4 ± 0.5 h for the exposed group and 14.2 ± 0.8 h for the control group. The values are expressed as mean ± standard error (SE). No significant difference in the recording time was found between the groups (t(33.7) = −1.875, p = .070).
Age and Sex, Hearing Thresholds
Participant characteristics and hearing thresholds were comparable between the groups. No significant group difference was found in age (t(42) = −1.516, p = .137) and sex (Fisher's exact test, p = 1.000). The standard pure-tone hearing thresholds (0.5–8 kHz) for the right ear (test ear) are shown in Figure 3A. A two-way ANOVA revealed no significant main effects of group (F(1, 42) = 0.762, p = .388) or frequency (F(4.19, 175.88) = 0.920, p = .457, Greenhouse-Geisser corrected). The group × frequency interaction was also not significant (F(4.19, 175.88) = 0.304, p = .882, Greenhouse-Geisser corrected). In line with the results for standard pure-tone hearing thresholds, a two-way ANOVA for the EHF hearing thresholds revealed no significant main effect of group (F(1, 42) = 0.017, p = .895) and no significant interaction between group and frequency (F(2.03, 85.17) = 0.112, p = .896), as shown in Figure 3B. However, there was a significant main effect of frequency (F(2.03, 85.17) = 7.238, p = .001, Greenhouse-Geisser corrected).

Means and SEs of standard pure-tone hearing thresholds (A) and EHF hearing thresholds (B) in the exposed and control groups.
DPOAEs
DPOAEs were measured to examine outer hair cell function. Figure 4 shows the DPOAE magnitudes (SNR in dB) for each group. A two-way ANOVA for the DPOAE magnitudes showed no significant main effect of group (F(1, 42) = 0.805, p = .375) and no significant group × frequency interaction (F(3.93, 164.87) = 0.456, p = .764, Greenhouse-Geisser corrected). There is however a significant main effect of frequency (F(3.93, 164.87) = 11.911, p < .001, Greenhouse-Geisser corrected).
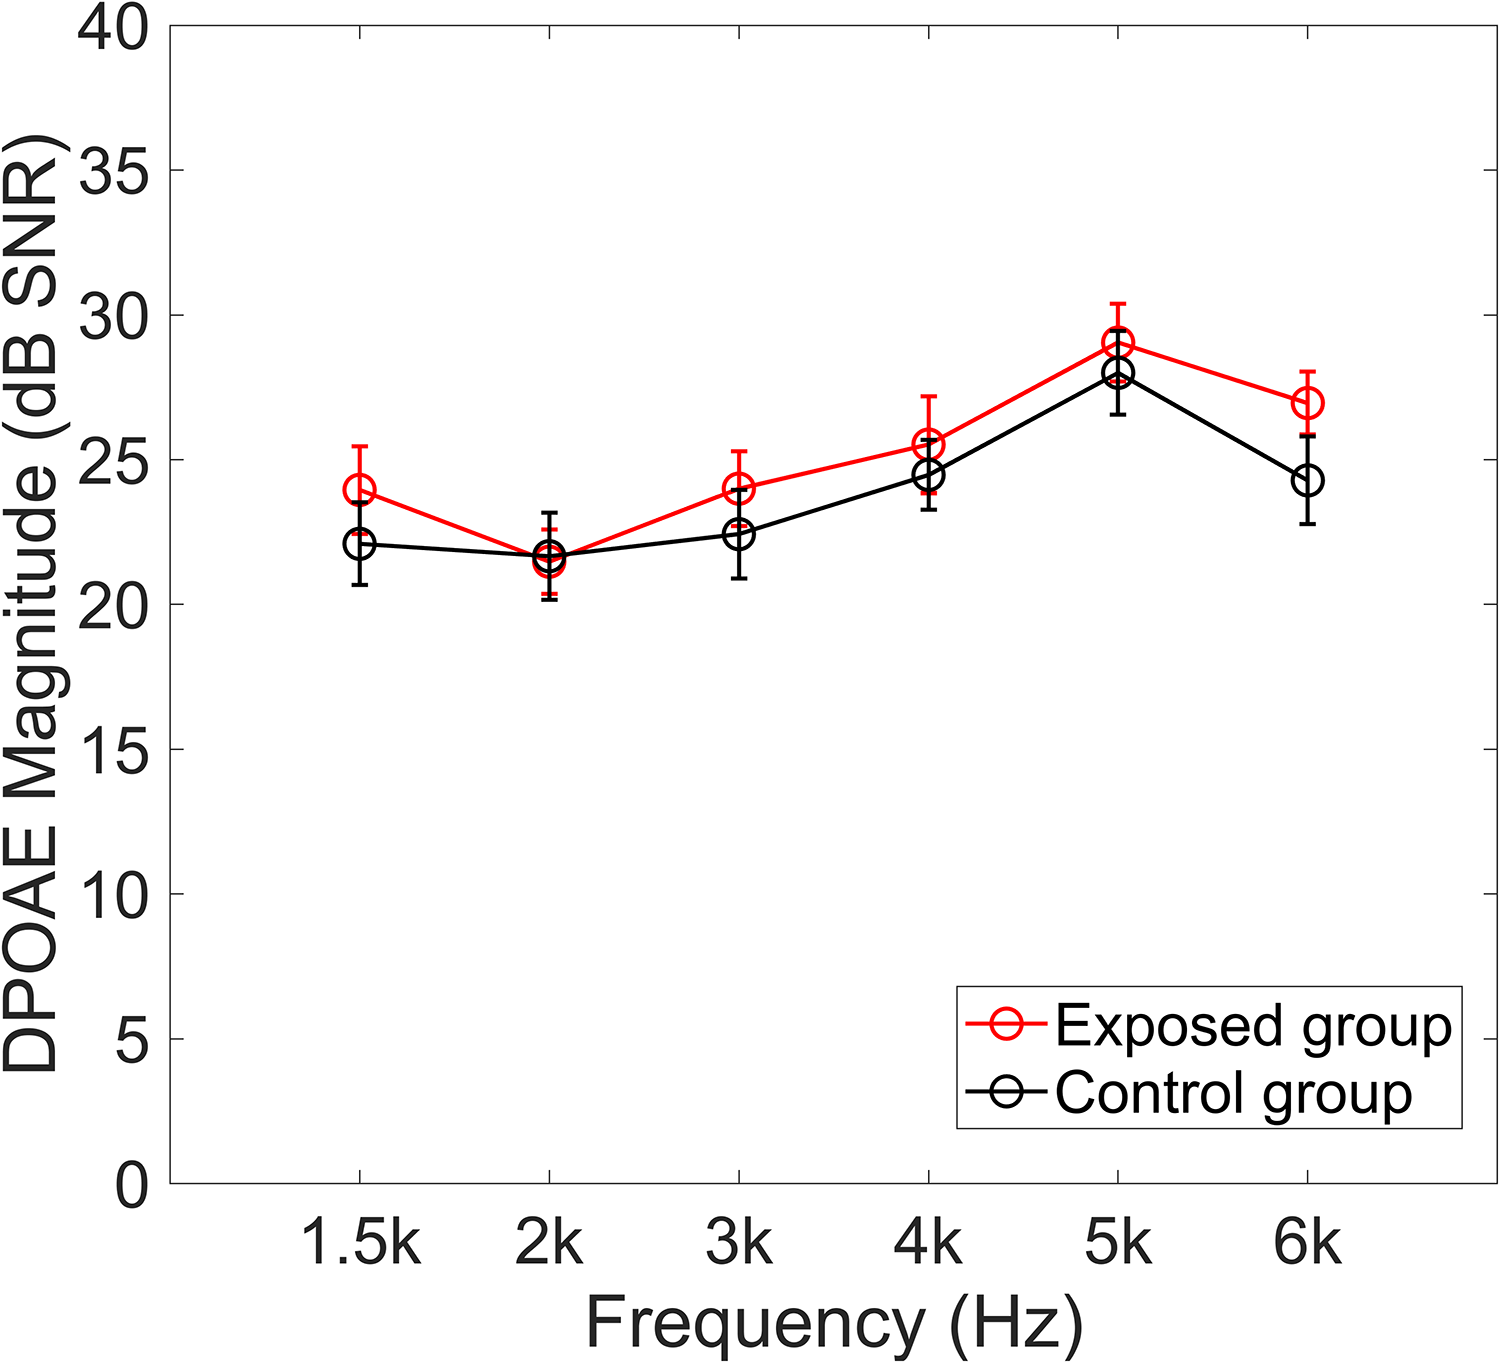
Means and SEs of the DPOAE magnitudes from 1.5 to 6 kHz for the exposed and control groups.
Word Intelligibility Performance
The word intelligibility scores for each listening condition are shown in Figure 5. A two-way ANOVA revealed a significant main effect of the listening condition (F(2.48, 104.30) = 670.978, p < .001, Greenhouse-Geisser corrected). However, there was no significant main effect of group (F(1, 42) = 0.258, p = .614), nor a significant group × frequency interaction (F(2.48, 104.30) = 1.065, p = .359, Greenhouse-Geisser corrected).
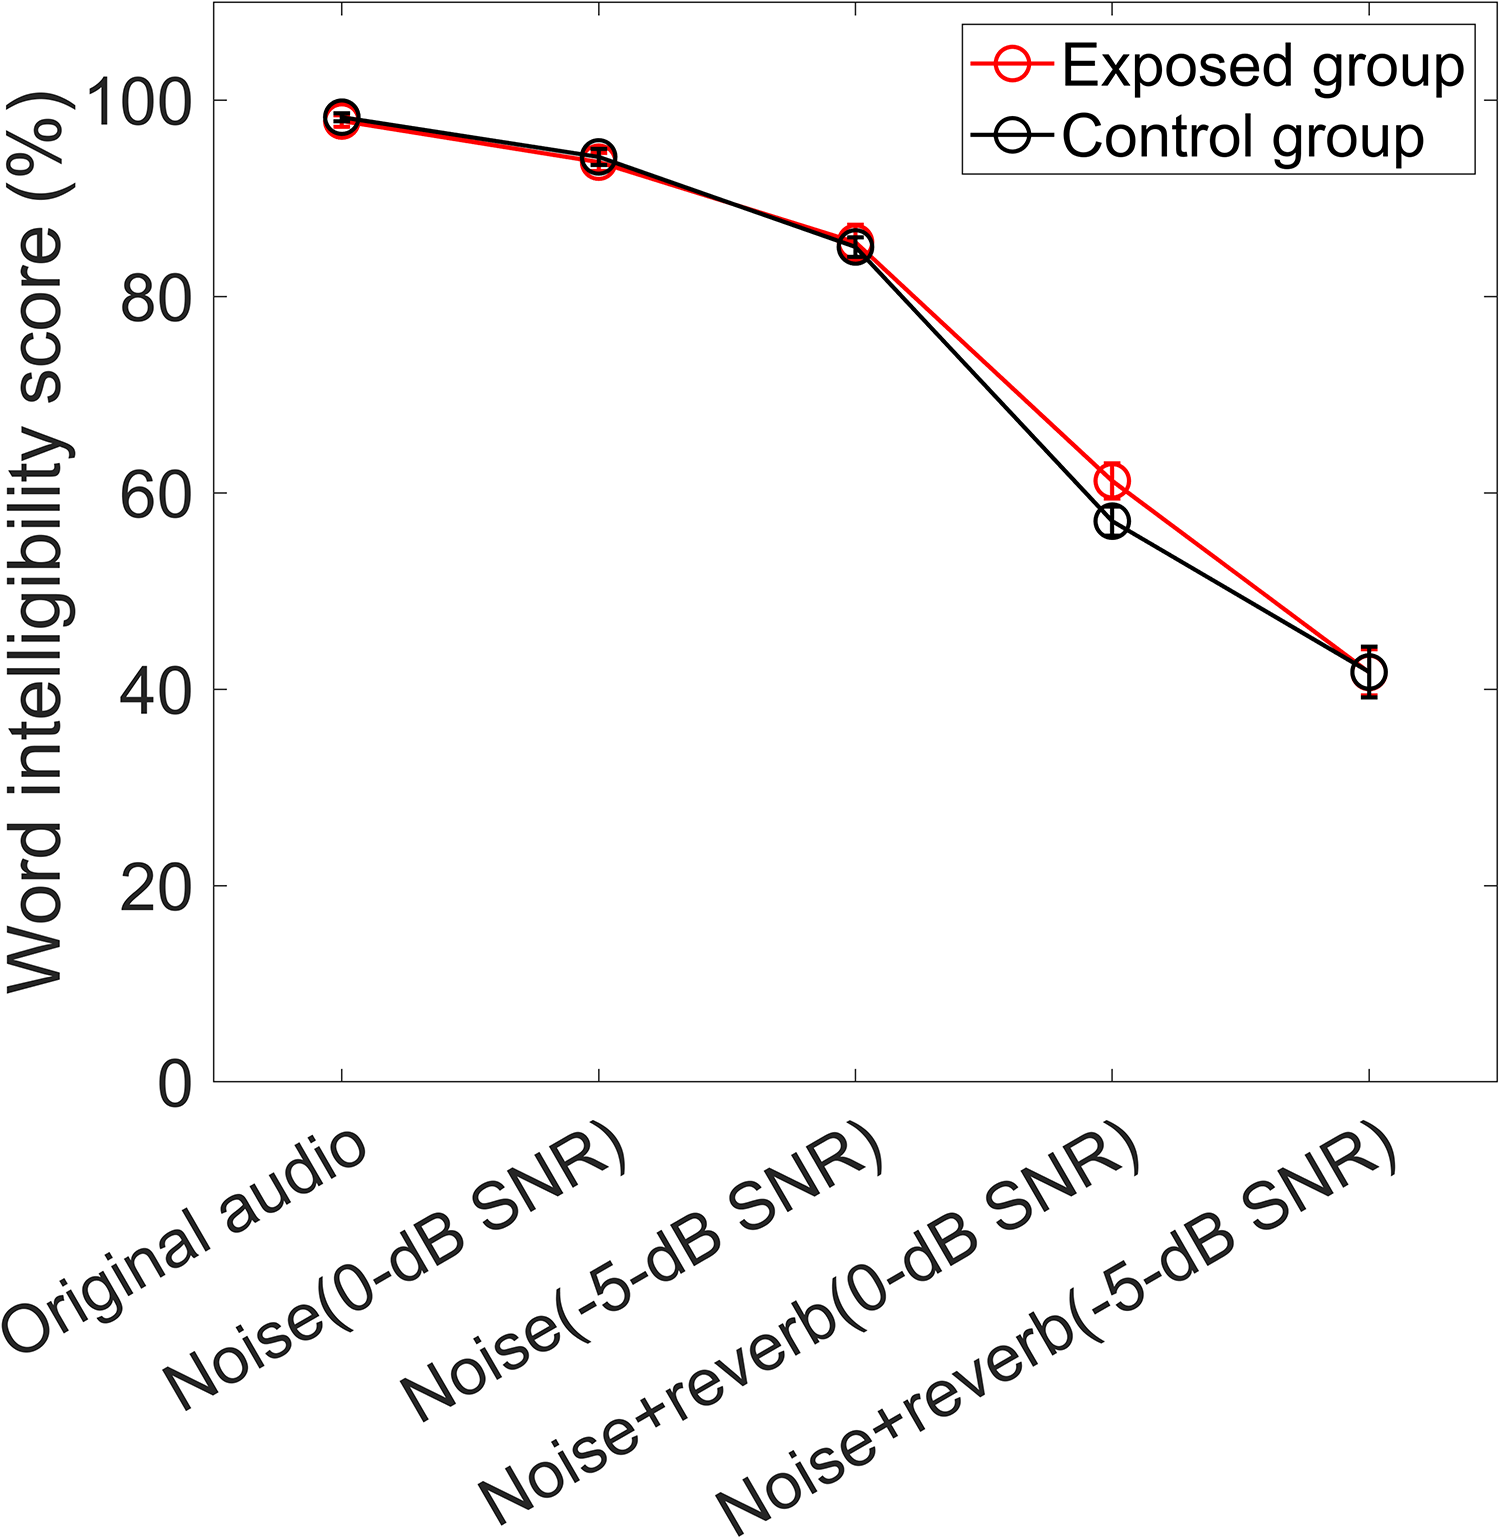
Means and SEs of the word intelligibility scores for each listening condition for both groups.
Relationship Between Sound Exposure Levels and Word Intelligibility Performance
Pearson correlation coefficients were calculated to examine the relationship between sound exposure levels and word intelligibility performance under degraded listening conditions. The average scores for word intelligibility under conditions (2)–(5) were used to represent performance in degraded listening conditions. No significant correlation was observed between sound exposure levels and word intelligibility (r = 0.226, p = .140).
ABRs: Wave I and V Peak Amplitudes, Latencies, and I/V Amplitude Ratio
Figure 6 shows individual single-click and second-click responses in the exposed (A, B) and control (C, D) groups, respectively. The second-click responses were derived by subtracting the single-click responses from the paired-click responses, as shown in Figure 1. To compare the wave I and V peak latencies between the single-click and second-click responses, the grand-averaged responses for each group were aligned to the stimulus onset, as shown in Figure 7. Means, SEs, and p-values from the ANOVA for wave I and V peak amplitudes and latencies, as well as the I/V amplitude ratio, are presented in Table 2. No significant group differences were found for any measures. However, relative to the single-click responses, the second-click responses exhibited significantly reduced peak amplitudes, increased I/V amplitude ratios, and prolonged peak latencies.

Individual single-click and second-click responses in the exposed (A, B) and control (C, D) groups, respectively. Individual RMSpost-w1 values were calculated using the pink analysis windows, which started 0.5 ms after the expected wave-I peak and extended for 1.5 ms. Because the analysis window differed across participants, the shaded regions appear overlaid.

Grand-averaged single-click (A) and second-click (B) responses for each group, aligned to stimulus onset. Note that 0 ms indicates the onset of both single and second clicks. The analysis windows used to calculate RMSpost-w1 scores are overlaid in pink.
Means, SEs, and p-Values Related to the ANOVA for Two Group Comparisons.
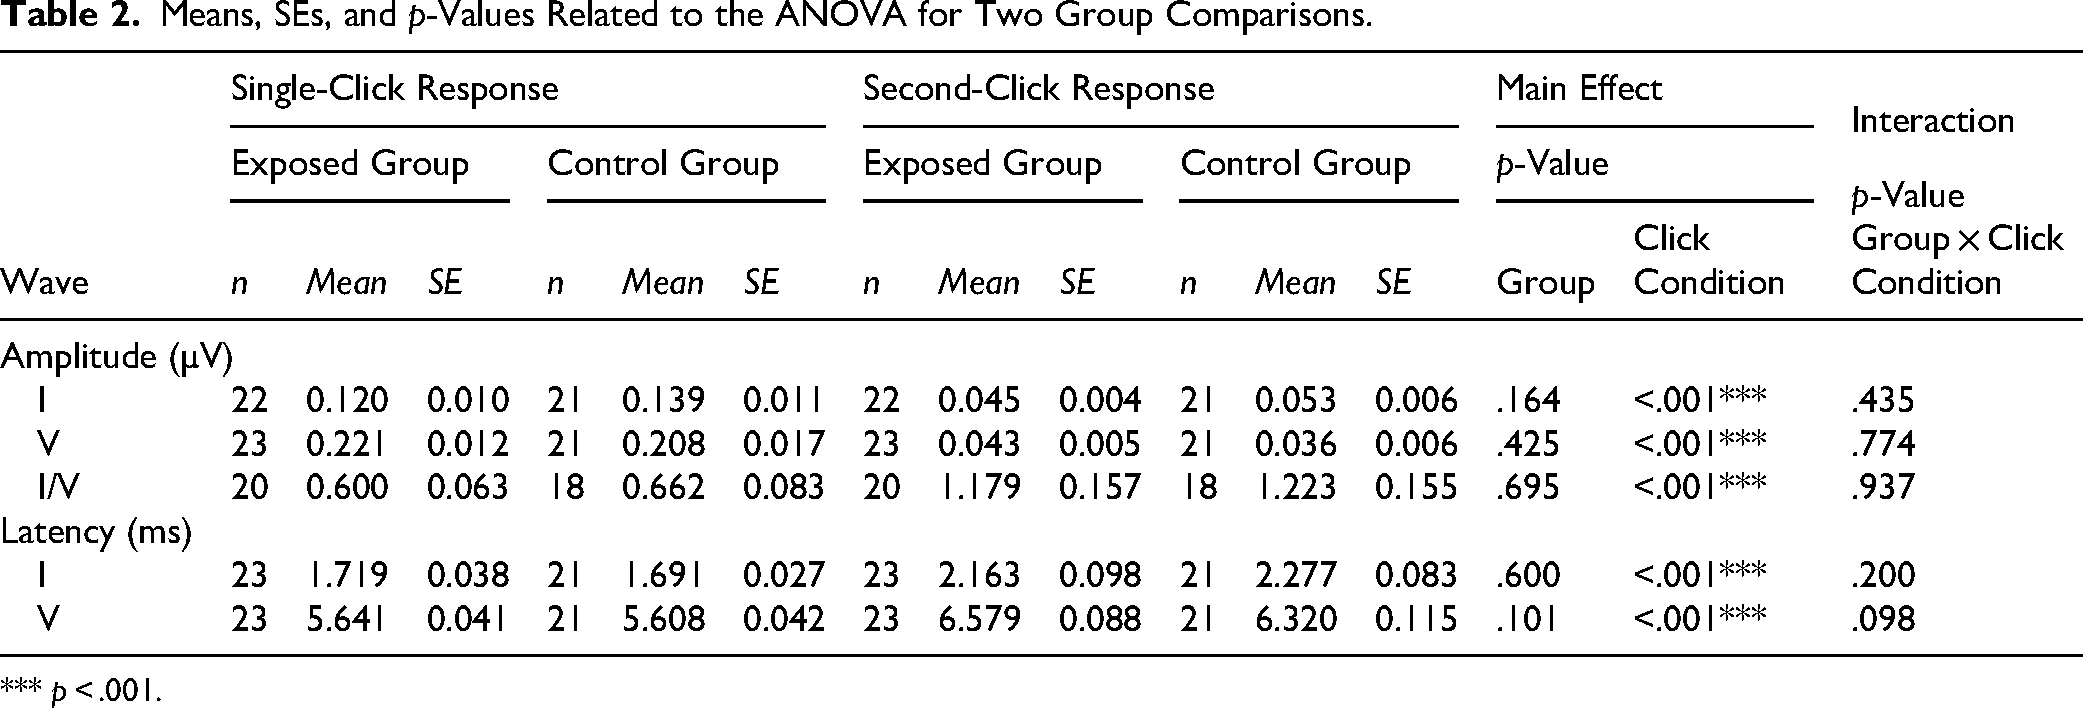
*** p < .001.
ABRs: RMSpost-w1 Values
The RMSpost-w1 values were calculated in the latency range from 0.5 to 2 ms after the expected wave-I-peak timing for the second-click responses. The means of the RMSpost-w1 values are shown in Figure 8. The exposed group exhibited significantly lower RMSpost-w1 values than the control group (t(42) = −2.645, p = .011).

Means and SEs of the RMSpost-w1 values for the second-click responses. A significant difference between groups was observed. The analysis windows used to calculate RMSpost-w1 scores are overlaid in pink.
ABRs: Relationship Between the ABR Measures and Sound Exposure Levels
The Pearson correlation coefficients between the ABR measures and sound exposure levels were calculated and are shown in Table 3. No significant correlations were found in any of the relationships after Bonferroni correction, and the correlation coefficients were relatively low.
Pearson Correlation Coefficients of the ABR Measurements With Sound Exposure Levels.

P-values have been adjusted using the Bonferroni correction (adjusted p-value = p-value × 11).
ABRs: Relationship Between the ABR Measures and Word Intelligibility Scores
Table 4 shows the Pearson correlation coefficients of the ABR measures with word intelligibility scores in degraded listening conditions (the averaged scores of 4 conditions with noise and reverberation) for all participants. There were no significant correlations in any of the relationships after Bonferroni correction, and the correlation coefficients were low.
Pearson Correlation Coefficients of the ABR Measurements With Word Intelligibility Scores Under Degraded Listening Condition.

P-values have been adjusted using the Bonferroni correction (adjusted p-value = p-value × 11).
ABRs: Sensitivity to the Choice of Time Range for the RMSpost-w1 Calculation
In earlier analyses, the RMSpost-w1 values were calculated for the post-wave-I response following the analytical approach employed by Fujihira et al. (2024). In this section, we examined the extent to which the choice of the analysis window parameters could have impacted the group differences. Figure 9A and B exhibit p-values of .05 or less in the Student's t-test for the RMSpost-w1 values for each combination of window onset and length (ordinate and abscissa, respectively) for single-click and second-click responses. There was no significant group difference in the RMSpost-w1 values for the single-click responses when the ICI was set at 0 ms, for all combinations of window onset and length. Significant group differences, however, were found in the RMSpost-w1 values for the second-click responses when the ICI was set at 2 ms, for some combinations of window onset and length. Relatively low p-values were found in the region starting from around 1.5–2 ms onset and 0.1 ms length and extending to 0.5 ms onset and 2 ms length. This region included a combination of 0.5 ms onset and 1.5 ms length, which was adopted in earlier analyses.

Distributions of p-values below .05 in the Student's t-test for the RMSpost-w1 values for various window parameters for the single-click responses (A) and second-click responses (B).
Discussion
The purpose of the present study was to investigate possible differences in ABRs using a paired-click stimulation paradigm between young adults who are frequently exposed to loud sounds through music practice and those who are not. We found that the exposed group showed significantly lower RMSpost-w1 values for the second-click responses than the control group, despite no significant differences between the groups in hearing thresholds or DPOAE magnitudes. Importantly, we directly measured the actual sound levels to which participants were exposed in their daily lives, and found significant group differences in these exposure levels. Additionally, the participants were relatively young and within a narrow age range, likely minimizing the confounding influence of age on the ABR measurements. Taken together, these results suggest that the observed ABR differences are more likely attributable to differences in sound exposure rather than to age or peripheral hearing sensitivity.
Although a significant group difference was observed in the RMSpost-w1 values, the RMSpost-w1 values were not significantly correlated with sound exposure levels. Sound exposure was quantified using a smartwatch. A previous study reported that the difference in sound levels measured by the smartwatch and a handheld sound level meter was only 0.5 dBA, indicating that the smartwatch provides sufficiently accurate and reliable sound assessment for exploratory clinical research (Fischer et al., 2022). Thus, using a smartwatch for assessment was considered appropriate for this study, as it minimized participant burden and was generally convenient. It should be noted, however, that the recorded sound levels did not reflect all the sound conditions experienced by the participants throughout their lifetime. In the present study, data were recorded for only 1 week. Moreover, participants were instructed to charge their smartwatches while sleeping. Therefore, the recorded data likely reflected sound levels primarily during daytime activities, which may have resulted in relatively elevated levels. This limitation could explain why no significant relationship was observed between the RMSpost-w1 values and LAeq values. Further studies are required to estimate lifetime sound exposure using questionnaires to assess the effects of noise exposure on the RMSpost-w1 values.
It should also be noted that the exposed group not only had greater sound exposure but also more extensive musical experience. Musical training is well known to enhance cortical neuroplasticity (for a review, see Olszewska et al., 2021). Regarding neuroplasticity in the brainstem, several studies have reported that musical training enhances the frequency-following response (FFR) (Bidelman & Krishnan, 2010; Musacchia et al., 2008; Parbery-Clark et al., 2009). However, a recent large-scale multi-site study has shown no association between FFRs and musical training (Whiteford et al., 2025). Whether musical experience influences peripheral auditory function has yet to be established, and its potential contribution to the group differences observed in the present study is unknown.
There was no significant group difference in the word intelligibility scores for all listening conditions. Furthermore, word intelligibility scores under degraded listening conditions were not correlated with either sound exposure levels or the RMSpost-w1 values. Consistent with our findings, several recent studies have failed to reveal a significant association between noise exposure and speech perception performance in humans (Fulbright et al., 2017; Grinn et al., 2017; Grose et al., 2017; Guest et al., 2018; Prendergast et al., 2017b; Yeend et al., 2017). This suggests that noise exposure does not necessarily impair speech perception in young adults with low cumulative exposure. In contrast, some previous studies have reported worse results for speech perception in noise (Liberman et al., 2016; Pinsonnault-Skvarenia et al., 2022). However, it has been suggested that these findings may reflect differences in the EHF hearing thresholds or cognitive factors. Overall, the current evidence remains insufficient to confirm that noise exposure causes hidden hearing loss in humans. Nevertheless, because CS can accelerate cochlear aging (Fernandez et al., 2015), noise-exposed individuals might experience speech perception difficulties earlier in life.
Previous studies investigating noise-induced CS in humans have primarily used the wave I peak amplitude (Bramhall et al., 2015, 2018; Carcagno & Plack, 2020; Çıldır & Tokgöz-Yılmaz, 2024; Fulbright et al., 2017; Grant et al., 2020; Johannesen et al., 2019; Kikidis et al., 2020; Konrad-Martin et al., 2012; Pinsonnault-Skvarenina et al., 2022; Prendergast et al., 2017a; Wang et al., 2021; Washnik et al., 2023) or the wave I/V amplitude ratio (Grose et al., 2017; Pinsonnault-Skvarenina et al., 2022; Schaette & MaAlpine, 2011) as an index of CS. In the present study, no significant group differences were found in any ABR measures, including wave I and V peak amplitudes, latencies, or the I/V amplitude ratio. These findings suggest that conventional ABR measures may be insufficient to detect subtle peripheral auditory changes in young adults with loud sound exposure, although such changes could be detected using the RMSpost-w1 values. To further verify this possibility, longitudinal studies that monitor temporal changes would be effective.
Regarding the wave I peak, its peak amplitude has been reported to mainly reflect the activity of high-SR fibers (Bourien et al., 2014). As several animal studies have reported (Furman et al., 2013; Schmiedt et al., 1996), assuming that CS also preferentially affects low-SR fibers in humans, the wave I peak amplitude may not be suitable for detecting CS. Supporting this, Fujihira et al. (2024) reported that the RMSpost-w1 values for second-click responses, but not the wave I peak amplitude, were associated with age and word intelligibility scores in degraded listening conditions, suggesting that these values may serve as markers of age-related CS and hidden hearing loss. Taken together, the findings of the present study suggest that the RMSpost-w1 values could reflect CS induced by loud sound exposure.
On the other hand, the absence of a significant group difference in wave I peak amplitude in the present study could reflect compensatory changes in ANFs following loud sound exposure. Previous studies have reported that gerbils exposed to loud noise (Jeffers et al., 2021) or treated with kainic acid (KA) (Diuba et al., 2025) exhibited a transient decrease in the compound action potential amplitudes corresponding to ABR wave I, followed by complete recovery. Diuba et al. (2025) further reported that, following KA-induced excitotoxicity, the SR of ANFs did not change, but low-SR fibers exhibited sound-driven activity similar to that of control high-SR fibers. These findings suggest that this phenotypic shift may explain the complete recovery of compound action potential amplitudes. Assuming that similar compensatory mechanisms occur in humans, the lack of a significant group difference in wave I amplitude observed in the present study could also be explained. Furthermore, this finding may indicate reduced sound-driven activity of low-SR fibers, which could account for the decreased RMSpost-w1 values observed in the exposed group.
In order to examine the extent to which the choice of the window parameters would impact the group difference, we calculated the RMSpost-w1 values for a variety of time windows. As shown in Figure 9, significant group differences in the RMSpost-w1 values were observed for second-click responses when the ICI was set at 2 ms in certain time windows, whereas no significant group difference was found for single-click responses when the ICI was set at 0 ms across any time window. This result may be explained by previous findings that low-SR fibers recover more quickly than high-SR fibers (Parham et al., 1996). The contribution of high-SR fibers to the second-click response may be diminished due to their slower recovery, resulting in a response more reflective of low-SR fiber activity.
In the second-click response, significant group differences in the RMSpost-w1 values were observed in the region starting from around 1.5–2 ms onset and 0.1 ms length and extending to 0.5 ms onset and 2 ms length, encompassing the window used in our main analyses. It should be noted that this region correspond closely to those previously identified by Fujihira et al. (2024) as being highly correlated with age and word intelligibility scores. Accordingly, our findings suggest that this time window is optimal for the analysis to detect not only age-related CS or hidden hearing loss but also noise-induced CS.
Several limitations of the present study should be noted. The participants were young adults within a narrow age range, which helped minimize age-related variability. Future studies including participants with a broader age range and diverse sound exposure histories are needed to clarify how age interacts with noise exposure in influencing ABR measures. In addition, although the RMSpost-w1 values successfully detected group differences, the physiological origin of this measure remains unclear. Further animal and computational modeling studies are required to determine whether this index primarily reflects the activity of low-SR fibers or is associated with other neural mechanisms.
Conclusion
This study examined ABRs using a paired-click paradigm in young adults with and without frequent musical sound exposure. While the hearing thresholds, DPOAEs, and conventional ABR measures did not differ between groups, the exposed group showed significantly lower RMSpost-w1 values for second-click responses. Our results suggest that frequent music practice may induce CS, even in young adults with normal hearing thresholds. Furthermore, ABRs using a paired-click paradigm show promise as a diagnostic tool for detecting CS and may play an important role in the early detection and prevention of noise-induced hearing loss.
Footnotes
Acknowledgments
The authors gratefully acknowledge the support of the Japan Society for the Promotion of Science. They would like to express their gratitude to all the participants for their cooperation in this study.
Ethical Approval and Informed Consent
The study was approved by the Institutional Review Board of Kyushu University. All participants signed an informed consent document prior to any study procedures.
Funding
The authors disclosed receipt of the following financial support for the research, authorship, and/or publication of this article: This research was supported by a Grant-in-Aid for Early-Career Scientists No. 22K17924 from the Japan Society for the Promotion of Science.
Declaration of Conflicting Interests
The authors declared no potential conflicts of interest with respect to the research, authorship, and/or publication of this article.
Data Availability
The datasets generated during and/or analyzed during the current study are available from the corresponding author on reasonable request (Fujihira et al., 2024).