
Abstract
The past decade has seen a wealth of research dedicated to determining which and how morphological changes in the auditory periphery contribute to people experiencing hearing difficulties in noise despite having clinically normal audiometric thresholds in quiet. Evidence from animal studies suggests that cochlear synaptopathy in the inner ear might lead to auditory nerve deafferentation, resulting in impoverished signal transmission to the brain. Here, we quantify the likely perceptual consequences of auditory deafferentation in humans via a physiologically inspired encoding–decoding model. The encoding stage simulates the processing of an acoustic input stimulus (e.g., speech) at the auditory periphery, while the decoding stage is trained to optimally regenerate the input stimulus from the simulated auditory nerve firing data. This allowed us to quantify the effect of different degrees of auditory deafferentation by measuring the extent to which the decoded signal supported the identification of speech in quiet and in noise. In a series of experiments, speech perception thresholds in quiet and in noise increased (worsened) significantly as a function of the degree of auditory deafferentation for modeled deafferentation greater than 90%. Importantly, this effect was significantly stronger in a noisy than in a quiet background. The encoding–decoding model thus captured the hallmark symptom of degraded speech perception in noise together with normal speech perception in quiet. As such, the model might function as a quantitative guide to evaluating the degree of auditory deafferentation in human listeners.
Introduction
Hearing loss is estimated to affect about 18% of the worldwide population, with the aged population being especially vulnerable. Nearly half of people who are 75 years or older suffer from some degree of hearing loss (Wilson et al., 2019). In clinical settings, hearing loss is typically assessed via pure-tone audiometry, which determines the lowest sound level required for pure tones of different frequencies to be heard in quiet. However, pure-tone audiometry does not capture the full range of hearing difficulties experienced by patients (Chambers et al., 2016; Kujawa & Liberman, 2009; Resnik & Polley, 2021; Sergeyenko et al., 2013; Wu et al., 2020). Particularly for more complex hearing environments, individuals might have demonstrable hearing difficulties in noise, but normal audiometry in quiet. More than one-tenth of patients seeking help in audiology clinics complain about decreased hearing abilities in noise, despite having normal audiometric thresholds (Parthasarathy et al., 2020).
The combination of hearing difficulties in noise with clinically normal audiometric thresholds (in quiet) has been described using various terms, such as obscure auditory dysfunction (Saunders & Haggard, 1989), hidden hearing loss (Liberman, 2015; Schaette & McAlpine, 2011), or hidden hearing disorder (Moore et al., 2019). One of the potential causes of hearing difficulties in noise despite the presence of clinically normal hearing thresholds is the loss of synapses that connect the inner hair cells (IHCs) in the cochlea with the auditory nerve fibers (ANFs) of the VIII cranial nerve (Kujawa & Liberman, 2009; Resnik & Polley, 2021). With aging or noise exposure, these IHC-ANF synapses are the most vulnerable structures in the inner ear (Fernandez et al., 2020; Kujawa & Liberman, 2009; Sergeyenko et al., 2013; Wu et al., 2019). In mice, ototoxic-drug-induced synapse loss has been shown to lead to elevated behavioral detection thresholds for tones in noise, despite normal thresholds in quiet (Resnik & Polley, 2021). The relationship between aging or noise exposure and IHC-ANF synapse loss has been established in multiple animal species, as has the relationship between IHC-ANF synapse loss and many physiological measures (Fernandez et al., 2020; Henry & Abrams, 2021; Liberman & Liberman, 2015; Sergeyenko et al., 2013; Valero et al., 2017). However, the perceptual cost of auditory deafferentation (i.e., the loss of afferents due to IHC-ANF synapse loss) for speech perception in humans remains unknown.
Some studies have attempted to shed light on the perceptual cost of auditory deafferentation by drawing on computational models. For example, a signal-detection-theory-based computational model suggested that auditory detection is relatively resilient in the presence of auditory deafferentation, such that 90% auditory deafferentation would likely result in detection threshold increases of only about 5 dB in quiet and in noise (Oxenham, 2016). However, the model's focus on simple signal detection limits its utility for investigating more complex auditory processing such as speech perception. The stochastic undersampling model of Lopez-Poveda and Barrios (2013) was intended to improve understanding of the degradation of speech perception as a function of auditory deafferentation. The model simulates ANFs as samplers of the input sound and then combines the output of a population of ANFs to reconstruct the input sound. Like Oxenham (2016), Lopez-Poveda and Barrios (2013) also found that there is considerable redundancy in how the auditory system encodes incoming information. However, the Lopez-Poveda and Barrios (2013) model did not fully capture some potentially important quantitative and physiological features of the afferents in the auditory nerve (e.g., the actual number of ANFs, or the different subtypes of ANFs). Additionally, the model requires the reintroduction of the input signal at the reconstruction stage and therefore does not represent a “pure” form of reconstruction of the sound input from the ANF output (Lopez-Poveda & Barrios, 2013). Recent work by Grange and Culling (2020) also investigated the effect of auditory deafferentation with a design in which sounds were reconstructed from deafferented modeled auditory nerve responses. The authors also found evidence for substantial redundancy within the auditory system. However, they did not investigate whether auditory deafferentation affects speech perception in noise differently from speech perception in quiet. Taken together, the abovementioned studies did not completely address the quantitative relationship between the degree of auditory deafferentation and its likely associated perceptual difficulties in noise versus in quiet.
In the current work, we investigated the quantitative impact of auditory deafferentation by implementing the stochastic undersampling principle (Lopez-Poveda & Barrios, 2013) within an encoding-decoding model framework. We expanded the stochastic undersampling model by adjusting the number of ANFs and their firing characteristics to match physiological properties more closely. We then used a machine learning algorithm to reconstruct the input solely from the ANF output. This physiologically more realistic model allowed us to simulate different degrees of auditory deafferentation in the encoding stage and to then test their perceptual consequences on the reconstructed, or decoded sounds (see Figure 1A for a detailed schematic, and Figure 1B for an example). We found that this encoding–decoding approach was able to demonstrate that, with increasing degrees of modeled auditory deafferentation, speech perception deteriorated disproportionally in noisy compared to quiet listening environments.

The encoding–decoding model. (A) Schematic diagram of the encoding–decoding model. The input to the model is a soundwave. The encoding model is shown in blue hues and the decoding model is shown in green hues. The output of the encoding model is a PSTH, which is then provided to the decoding model. The decoding model is a neural network, which converts the PSTH to sound features. The WORLD synthesizer uses these reconstructed sound features to synthesize a soundwave (shown in orange hues). RMS matching is used to control the sound level of the output sound. f0: fundamental frequency. (B) Illustration of an input sound (a recording of the spoken word “coffee”) as it is processed through the model. The left column shows the input sound waveform. The middle column shows three PSTHs, from top to bottom, for 0% ANF loss, 90% ANF loss, and 95% ANF loss, that are then used as the input to the decoding model. The right column shows the reconstructed waveform for each corresponding PSTH. ANF = auditory nerve fiber; PSTH = peri-stimulus time histogram; RMS = root mean square.
Materials and Methods
Participants
In-Person Participants
Participants were recruited from the Duke University community and provided written informed consent in accordance with the Duke University Institutional Review Board. Of the 105 recruited participants, six were excluded due to incomplete data collection (e.g., data were not recorded by the script or audiometric thresholds were missing for one or more frequencies), and two participants were excluded due to elevated audiometric thresholds (> 40 dB HL for at least one frequency), yielding a total of 97 participants (66 women, mean age = 20.1 years).
Online Participants
We recruited online participants via the Amazon Mechanical Turk (MTurk) platform. MTurk participants were restricted to be located in North America, to have completed at least 100 MTurk tasks, and to have an approval rate (percentage of completed tasks that other MTurk requesters/experimenters accepted) greater than 98%. We recruited 163 participants (84 women, mean age = 37.4 years).
Stimuli
Encoding Model
The encoding model was based on the stochastic undersampling model of Lopez-Poveda and Barrios (2013). We implemented some modifications in the encoding stage to better capture the physiological properties and quantitative features of ANFs. The function of the basilar membrane was modeled using a dual resonance nonlinear filter bank (DRNL) (Lopez-Poveda & Meddis, 2001) instead of a gammatone filter bank. The DRNL filter bank consisted of 128 frequency channels, logarithmically distributed within the range [50, 16,000] Hz. A total of 32,000 ANFs were modeled for a healthy ear (Nadol, 1988). The auditory nerve fibers were divided into three subtypes: low-spontaneous rate (SR), medium-SR, and high-SR fibers (Liberman, 1978), making up 60%, 25%, and 15% of the ANF population. The firing threshold (in dB) of each ANF in a given SR-subtype was drawn from a Gaussian distribution within the subtype; the mean and standard deviation (STD) of the Gaussian distribution were estimated from the rate-level functions of empirical data from gerbils (Huet et al., 2016) to result in means and standard deviations of firing thresholds for low-, medium-, and high-SR fibers of [55, 22, 12] dB SPL (sound pressure level) and [11, 5, 3] dB SPL, respectively. Additionally, an absolute refractory period was applied to all fibers to match the experimental maximum rate of firing of each fiber type (Figure 2). The refractory periods were 2, 2.5, and 2.5 ms for low-, medium-, and high-SR fibers, respectively. Each ANF was modeled with a spike onset delay relative to the time that the stimulus level surpassed the threshold of the ANF. The onset delay was drawn from a uniform distribution with bounds 0 and half of the corresponding refractory period. The model did not include spontaneous activity for simplicity. Finally, the response from individual fibers was summed within each frequency band and ANF subtype, yielding an output peri-stimulus time histogram (PSTH) of 128 frequency bands × 3 ANF subtypes = 384 rows. The PSTH was initially sampled at 32,000 Hz, the same as the input sound. To reduce the size of the input to the decoding model (see below), the PSTH was then down-sampled by a factor of 10 and epoched into 5 ms windows, leading to 16 time points per 5 ms window, that is, a sampling rate of 3200 Hz. A sampling rate of 3200 Hz allowed phase locking with a highest frequency of 3200 Hz. This sampling rate allowed phase locking up to ∼3200 Hz, which approximately matches the limit of phase locking in the human auditory nerve (Verschooten et al., 2018). This resulted in an encoding model output matrix of a 16 × 384 PSTH for each 5 ms of sound. The PSTH was then normalized based on the number of fibers in this subgroup and frequency band to account for the large magnitude differences of PSTH with different degrees of ANF loss.
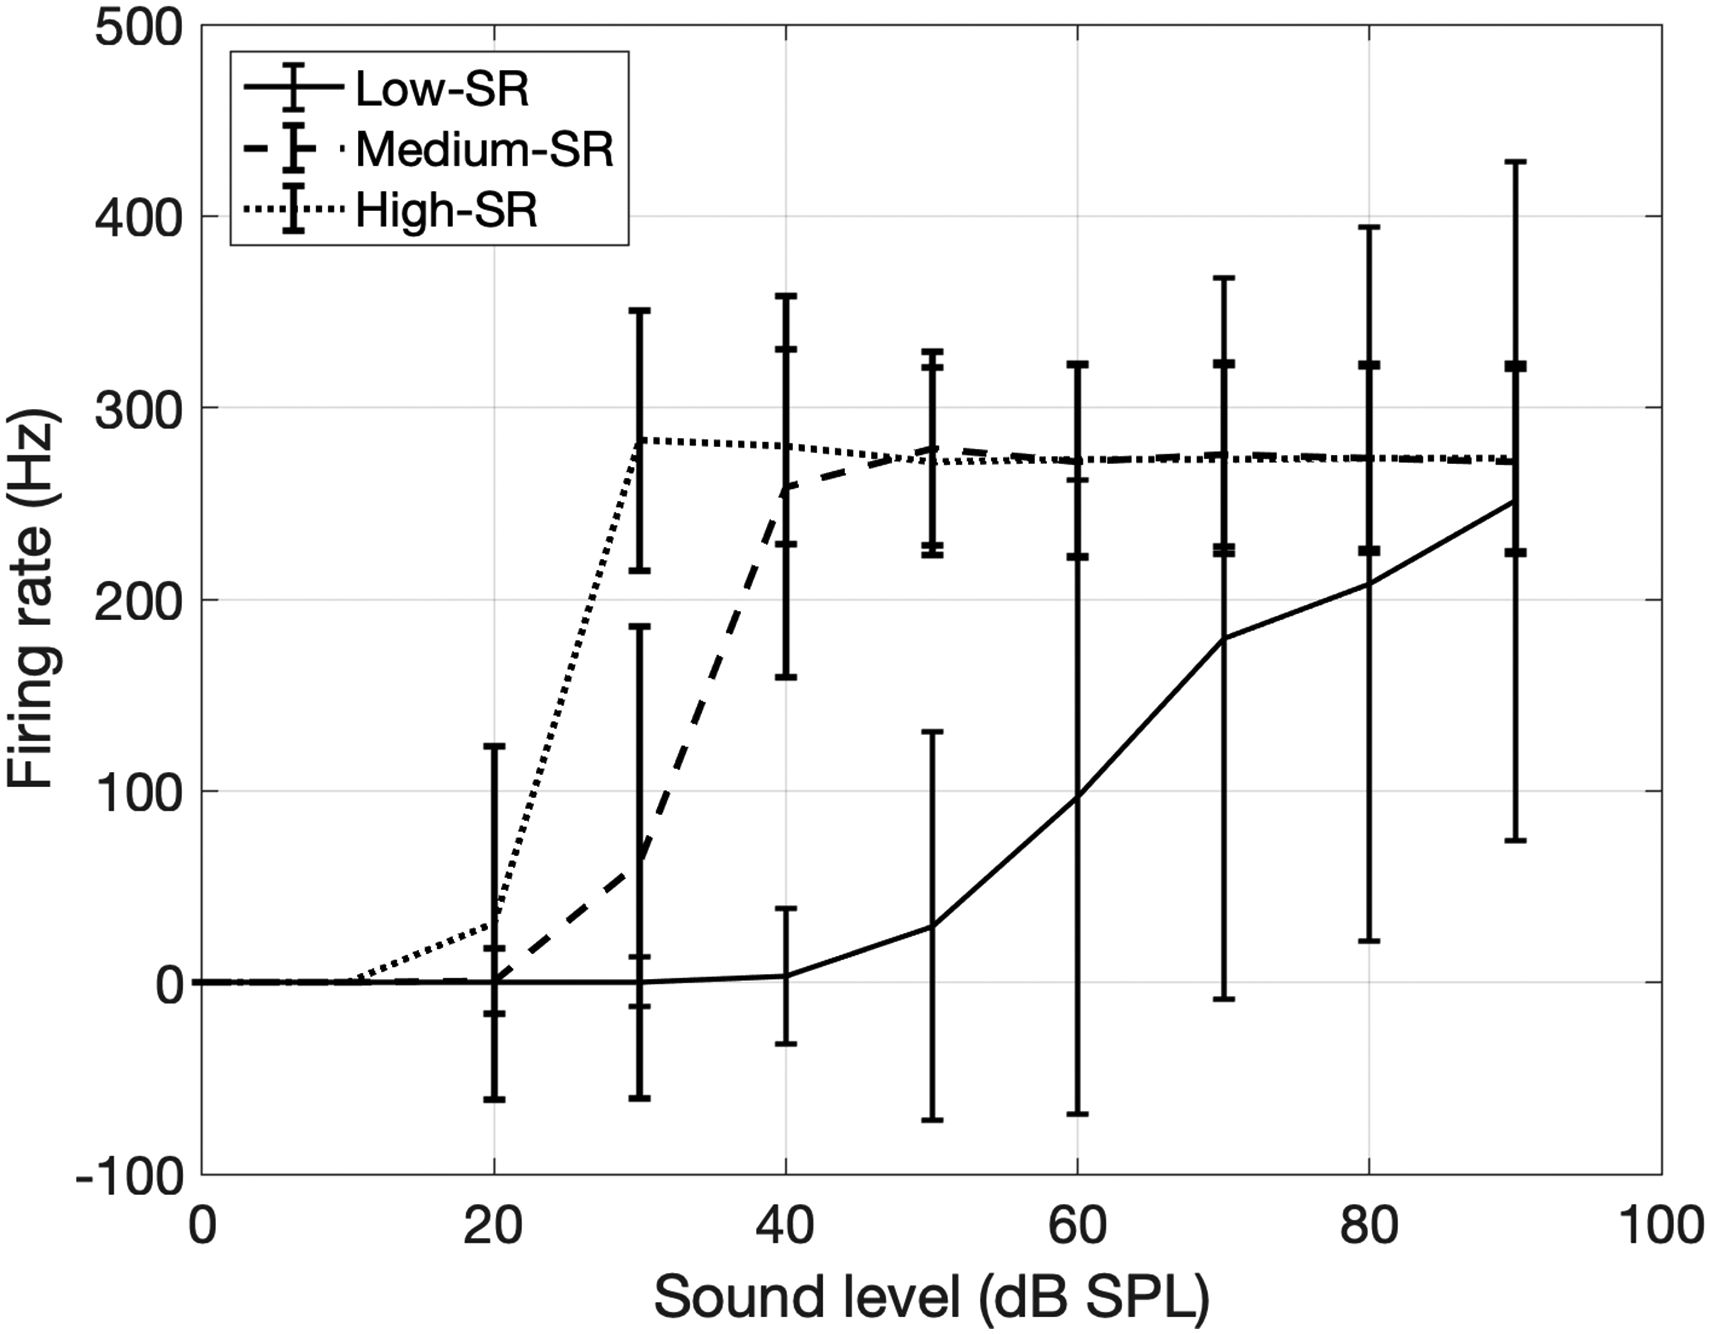
Rate-level functions of modeled ANF subtypes. The sound level of the stimulus is denoted on the x-axis, and the firing rates of three subtypes of ANFs are shown by solid, dashed, and dotted lines. Error bars represent the standard deviations of the firing rate over 1000 simulations. ANF = auditory nerve fiber.
The effect of auditory deafferentation was simulated by reducing the number of ANFs in the encoding model. For example, to simulate the effect of auditory deafferentation caused by a loss of 90% of the IHC-ANF synapses, we reduced the number of ANFs in the encoding stage by 90% from 32,000 to 3,200 ANFs. The loss was uniformly applied across frequency bands and ANF subtypes. Zero percent auditory deafferentation describes an intact auditory system with 32,000 IHC-ANF synapses.
Decoding Model
The decoding networks were based on the decoding model of Akbari et al. (2019), which implemented and trained a neural network to decode the speech input from electrocorticography recordings in humans. In our case, the input to the decoding model was the PSTH from the encoding stage. We built one decoding network for each of the three sound features of the WORLD vocoder (see below): (1) spectrogram, (2) aperiodicity, and (3) fundamental frequency (f0). Each network contained a feature extraction network and a feature summation network. The structure of the decoding network for each feature was similar across the three networks (see Appendix), but the hyperparameters and parameters for each network were optimized separately based on each corresponding sound feature. We used the WORLD vocoder (Morise et al., 2016) to synthesize the sounds from the feature networks. The WORLD vocoder consists of two stages: the analysis stage converts a sound wave into three sound features (spectrogram, aperiodicity, and fundamental frequency), while the synthesis stage converts these sound features into a sound wave. We provided the output of the feature networks as input to the WORLD vocoder synthesis stage, which converted them into a sound wave.
The training dataset was the same for all three feature networks and consisted of a set of 198 IEEE sentences spoken by 33 speakers (sentences were recorded in quiet). The sound files were taken from the University of Washington/Northwestern University (UW/NU) Corpus 2.0 (Panfili et al., 2017). The training input material consisted of the PSTHs generated by the encoding model, based on a healthy ear with all 32,000 ANFs, in response to each of the 198 IEEE sentences. As the training target, we calculated the three sound features (spectrum, aperiodicity, or fundamental frequency) from the original IEEE sentences using the analysis stage of the WORLD vocoder (Morise et al., 2016). Going forward, we refer to the prediction target that was directly derived from the original sound as the ground truth sound features. For one-third of the sentences, steady noise of various levels was added (resulting in signal to noise ratios (SNRs) between −30 to 30 dB), while the other two-thirds of the sentences remained unchanged (i.e., in quiet); this ensured a variety of background levels for the training dataset. For the validation dataset, we used hearing in noise test (HINT) sentences (Nilsson et al., 1994), and the trained network was used to predict sound features from the PSTHs of these new HINT sentences. The validation stage used 10 HINT sentences, each sentence with two different SNRs; we did not provide all HINT sentences in the validation set to avoid overfitting. Noise was added to the validation set HINT stimuli so that the validation performance best captured the actual testing performance in noise. The auditory deafferentation level for the HINT validation stimuli was randomly assigned to be 0%, 90%, or 95%.
The training of the decoding model consisted of two stages, the hyperparameter tuning stage, and the actual training stage. For the former, we used the KerasTuner (O’Malley et al., 2019) to optimize the hyperparameters of the feature networks, that is, the number of layers in each network, and the number of nodes in each layer. Ten hyperparameter tuning trials were run, each with a different set of hyperparameters, and the hyperparameters were optimized with a built-in Bayesian optimizer in KerasTuner (O’Malley et al., 2019). In each hyperparameter tuning trial, three-fold cross-validation was used to ensure the stability of the training process, so that the network performance was not highly dependent on a subset of the training material. More specifically, within each optimized set of hyperparameters, the training model was trained three times, or folds, each time on a random two-thirds portion of the training material. Each time, the number of training epochs (the number of iterations that the model is optimized on the training set) was determined by an early stopping strategy with a patience parameter of 3 (in other words, training was terminated if the model did not improve for three consecutive epochs), which provides a robust solution while also preventing overfitting during the training stage (Montavon et al., 2012; Yao et al., 2007). For each fold, a validation error was calculated as the root mean square (RMS) error between the ground truth sound features and the predicted sound features from the model. Performance was quantified as the average validation error of all three folds. After the completion of all 10 hyperparameter tuning trials, the hyperparameter set with the overall smallest RMS error was chosen and subsequently used to construct the network for the actual training stage. During the training stage, the model was trained on the whole training set, and the early stopping strategy was used to determine the number of epochs for training. After this final training, the model was saved for reconstructing sound features from the PSTH of new sounds. The exact hyperparameters of the network for each sound feature are included in the Appendix.
Baseline Condition Stimuli
To measure participants’ baseline speech-in-noise perception, that is, without deafferentation, and to account for potential effects of the synthesis stage of the WORLD vocoder, we created baseline speech stimuli by processing sentences through the analysis and synthesis stages of the WORLD vocoder. Specifically, the original American English Matrix Test (AMT) sentences (Kollmeier et al., 2015) (with different levels of speech-shaped noise) were provided as input to the analysis stage of the WORLD synthesizer to extract their sound features (spectrum, aperiodicity, f0), and these sound features were then provided to the synthesis stage of the WORLD vocoder to recreate the original input sentence. Thus, this process did not consist of any stochastic undersampling processing and instead was included to account for the effect of the WORLD synthesizer.
Procedure
In-Person Data Collection Procedure
Pure-tone audiometry was conducted for each participant with a Grason Stadler GSI 18 audiometer. The audiogram was recorded for [0.125, 0.25, 0.5, 0.75, 1, 1.5, 2, 3, 4, 6, 8] kHz frequencies (participants raised their hand to indicate that they had heard a sound). The initial sound level was 30 dB HL, and the initial decreasing step in sound level was 10 dB. Once a tone was not reported, the sound level was increased in 5-dB steps until the participant reported hearing the tone again. The threshold was recorded as the final sound level at this frequency.
For the HINT task, each participant was randomly assigned to one of the five auditory deafferentation levels (see below) and completed two sessions of speech HINT perception, one in noise, and one in quiet. Baseline speech perception was assessed with stimuli from the AMT (Kollmeier et al., 2015) (see Baseline Condition Stimuli above). A summary of the procedure is shown in Table 1.
Summary of Tasks and Procedures for In-Person and Online Participants.
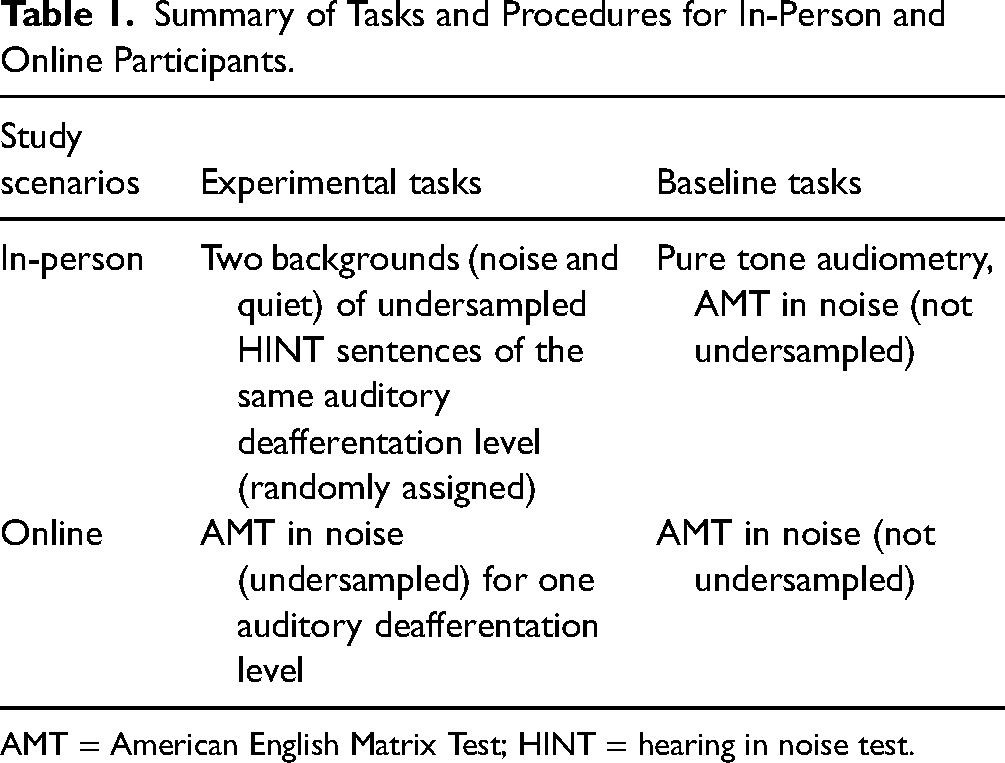
AMT = American English Matrix Test; HINT = hearing in noise test.
The speech stimuli were presented in a sound-attenuated room via a Fireface UC sound card and Sennheiser HD 380 Pro headphones at 32 kHz sampling rate and 16-bit resolution.
Online Data Collection Procedure
Online experiments using audio signals suffer from limited control over sound presentation equipment (e.g., Woods et al., 2017) and sound levels because participants are able to adjust the volume during a task. We implemented several tests to minimize this lack of control. We used a headphone screening test at the beginning of the task that only allowed participants who were wearing headphones to proceed (Woods et al., 2017). In addition, we played two tones (1 kHz, 250 ms duration, 5 dB difference in SPL) and asked participants to adjust the sound volume on their devices until they could only hear the louder tone, in order to obtain an approximate calibration of sensation level. For a typical participant with normal hearing using a consumer-grade device, this procedure resulted in a sound volume setting that typically fell at 70% to 80% of the maximum volume (this would have been higher for participants completing this calibration task in a nonquiet environment). It is worth noting that the main task (see below) followed an adaptive tracking procedure, such that only the initial few trials were presented at a comparatively high sound level, while the majority of trials were presented at or near threshold for speech in quiet. For speech in noise, the majority of the trials were presented around the fixed level of the background noise. We did not receive any complaints about the stimuli being too loud.
In-Person Speech Perception Tasks
The in-person data collection used HINT sentences (Nilsson et al., 1994). We refer to this as the “HINT task” going forward, even though it consists of speech-in-noise and speech-in-quiet conditions. In this task, each participant was tested in noise and in quiet for one auditory deafferentation level (one from 0%, 50%, 90%, 95%, and 97.5%), which was randomly assigned to each participant. The order of the background conditions (quiet or noise) was randomized. A block with each condition consisted of 30 trials. In each trial, a participant listened to a sentence and then typed what they heard on the keyboard. A sentence similarity score was generated by comparing the typed response with the transcript of the sentence, using an open-source NodeJS sentence similarity package (Loverich, 2019) that calculated the similarity score based on spelling, while also accounting for subtle differences in spelling. The similarity score ranges between 0 and 1, where two identical words in spelling yield a score of 1, and two totally unrelated words yield a score of 0. For two similar words, the similarity score falls between 0 and 1: the similarity score between “this” and “these” is 0.91, and the similarity score between “to” and “two” is 0.325. We used a one-down-one-up adaptive tracking paradigm with an overall similarity score threshold of 0.5 for each sentence. Note that this method is different from typical audiology tests where the patient usually verbally reports back what they heard, but this method allowed us to test speech intelligibility automatically with JavaScript in a web browser. It should also be noted that it penalizes “bad spellers.” For the speech-in-noise condition, the initial SNR for the five auditory deafferentation levels was 26, 18, 26, 30, and 18 dB, respectively. Note that we acquired data for the 0%, 90%, and 95% auditory deafferentation conditions first, and only added the 50% and 97.5% auditory deafferentation conditions at a later stage of data acquisition. Despite the discrepancy in initial SNRs between these conditions, the adaptive tracks all converged to a threshold toward the end of the test (trial #30). The range of possible SNRs was −10 to 32 dB for 0%, 50%, 90%, and 97.5% auditory deafferentation levels, and −6 to 36 dB for the 95% auditory deafferentation level. The noise level was fixed at 65 dB SPL. For the speech-in-quiet condition, the initial sound level for all five auditory deafferentation levels was 75 dB SPL. The range of possible sound levels was 39 to 81 dB SPL. The step size for the adaptive tracks was 2 dB for both backgrounds. The final threshold was calculated based on the average SNR (noisy background condition) or SPL (quiet background condition) at the last five reversals in the adaptive track.
American English Matrix Test
Sentences in the AMT (Kollmeier et al., 2015) have a fixed structure of “subject verb number adjective object” (e.g., “William sold two green sofas”). Each of these five word categories has a pool of 10 words, for a total of 50 possible words for a five-word sentence. While listening to a sentence, participants viewed the matrix of all 50 words on the computer screen and then had the option to either click on the words they heard or type their response on a keyboard. This latter option was included to reduce the task's working memory demands. A participant's response was used to calculate the sentence similarity score (Loverich, 2019). Since the clicked responses were coded as either 0 (wrong) or 1 (correct), we applied the same principle to the typed responses: the score between the target word and the typed word was coded as 1 only when the two words matched perfectly, and otherwise coded as 0. Each participant completed two runs, one with stimuli from the experimental condition with a specific auditory deafferentation level, and the other with stimuli from the baseline condition (i.e., no deafferentation, just the two stages of the WORLD vocoder). The noise that was added to each sentence was speech-shaped noise that had the same long-term spectrum as the AMT sentences. The noise level was fixed at 65 dB SL and the sentence level varied with SNR. The same one-down-one-up adaptive tracking paradigm with an average similarity score threshold of 0.5 was used, and the final speech perception threshold was calculated based on the average SNR at the last five reversal points in the adaptive track.
Data Analyses
Data were analyzed with SPSS Statistics 26 (IBM SPSS Statistics, 2019), using both general linear model (GLM) and mixed linear model methods.
For in-person HINT data, we first investigated whether Overall pure-tone average thresholds (mean thresholds across audiometric frequencies between 0.125 and 8 kHz and across two ears) and “Speech range” thresholds (mean thresholds across audiometric frequencies between 2 and 6 kHz, see Wilson, 2011) can predict speech perception in noise. This involved a GLM with factors Overall threshold, Speech range threshold, and Age, with Baseline AMT speech perception being the dependent variable.
Subsequently, we used a mixed linear model with factors Background (within-participant factor) and Auditory deafferentation level (between-participant factor), with HINT speech perception threshold (measured one-down-one-up with 0.5 similarity score) treated as the dependent variable; Age, Speech range threshold, and Baseline AMT speech were included as continuous covariates. To investigate whether speech perception is more affected by auditory deafferentation in noise than in quiet, the HINT speech perception thresholds were normalized by subtracting the mean value for the 0% Auditory deafferentation level from that for the experimental Auditory deafferentation level because the magnitude of thresholds in both cases varied greatly. For the mixed linear model, the Satterthwaite approximation was used to estimate degrees of freedom (IBM SPSS Statistics, 2019). All post hoc pairwise comparisons were Bonferroni adjusted for multiple comparisons.
The online AMT results were analyzed with a GLM, with factors Age and Auditory deafferentation level, with the AMT Speech perception threshold (measured with a one-down-one-up adaptive track with a 0.5 similarity score) treated as the dependent variable. All post hoc pairwise comparisons were Bonferroni adjusted for multiple comparisons.
Results
In-Person HINT Task
In-person participants performed three tasks (see Table 1): audiometry, baseline speech perception in noise using sentences from the AMT (processed with the WORLD vocoder, see Methods), and speech perception (in noise and quiet) with deafferentation using HINT sentences.
Figure 3A displays hearing thresholds in quiet, Figure 3B shows the distribution of participants’ ages. The pure tone thresholds of some participants exceeded the clinical 25 dB HL threshold typically used to diagnose mild hearing loss for some of the frequencies tested. We therefore tested whether Overall thresholds (0.125–8 kHz), as well as “Speech range” thresholds (2–6 kHz), predicted Baseline AMT speech perception in noise. Neither Overall thresholds nor Speech range thresholds predicted Baseline AMT speech perception [F(1,95) = 1.238, p = .269; and F(1,95) = 1.677, p = .199, respectively], so we decided not to exclude data from participants with elevated audiometric thresholds. AMT baseline speech perception thresholds (mean = −10.0 dB SNR; STD = 1.25 dB SNR) were similar to the published reference threshold (mean = −8.8 dB SNR; STD = 0.7 dB SNR) (Kollmeier et al., 2015; Zokoll et al., 2013).
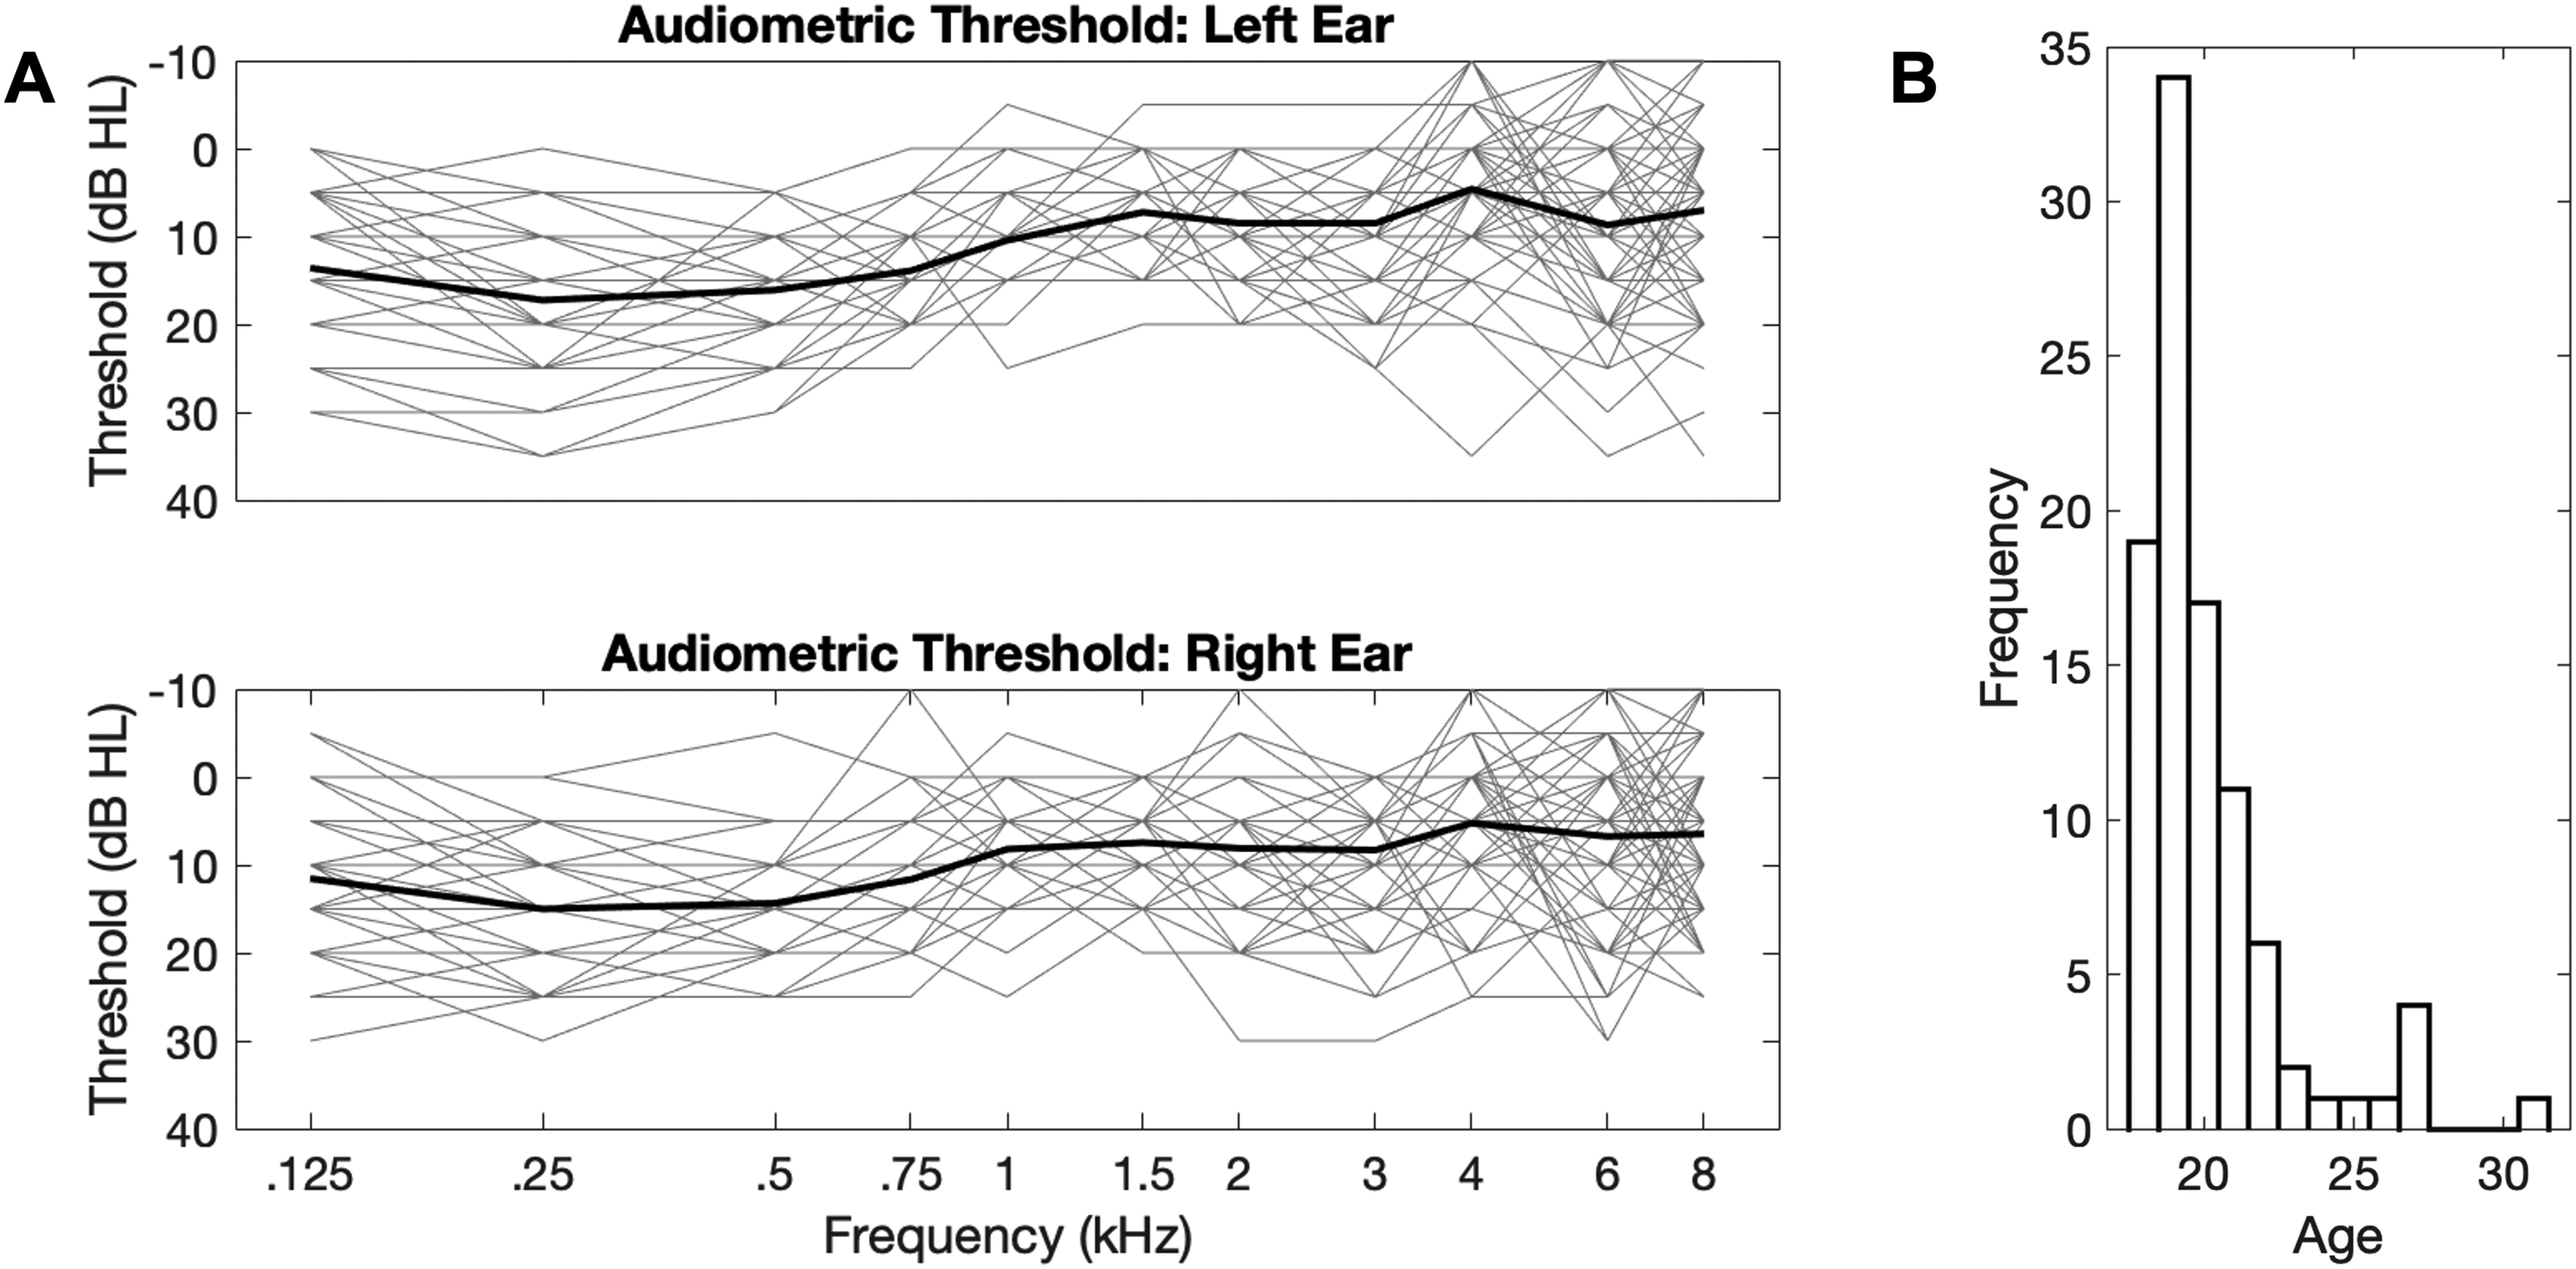
(A) Audiograms for in-person participants. The thin gray traces represent the data from individual participants for left (top) and right (bottom) ears; the thick black traces represent the mean audiometry threshold across participants. (B) Age distribution histogram of in-person participants.
Five auditory deafferentation levels were used: 0%, 50%, 90%, 95%, and 97.5% (with n = 20, 20, 19, 19, and 19 participants, respectively). Each participant completed one block with each background (noise and quiet) at one randomly assigned auditory deafferentation level. Figure 4 shows HINT speech perception thresholds as a function of Auditory deafferentation level and Background. A mixed model with factors Auditory deafferentation (between-participant factor) and Background (within-participant factor) revealed main effects of both factors as well as an interaction between Auditory deafferentation and Background for HINT speech perception thresholds [F(4,179.69) = 50.812, p < .001; F(1,179.28) = 8.574, p = .004; and F(4,179.28) = 2.722, p = .031, respectively]. Neither Age nor Speech range threshold had significant effects on the HINT speech perception thresholds [F(1,179.16) = 0.01, p = .977, and F(1,179.16) = 2.394, p = .124, respectively]. However, the Baseline AMT speech perception threshold in noise was a significant predictor of HINT speech perception thresholds in both backgrounds [F(1,179.16) = 4.864, p = .013]. Post hoc pairwise comparisons with the 0% auditory deafferentation level revealed significantly worse HINT speech perception thresholds in noise for the 95% and 97.5% Auditory deafferentation levels (p < .001, Bonferroni adjusted, for both auditory deafferentation levels). In quiet, only the HINT speech perception threshold in the 97.5% deafferentation condition differed significantly from that for 0% deafferentation (p < .001, Bonferroni adjusted). Importantly, the HINT speech perception thresholds in noise were more affected by deafferentation levels than in quiet for the 95% and 97.5% deafferentation levels (p < .001 and p = .023, Bonferroni adjusted, respectively).

In-person speech perception results. The x-axis shows the tested levels of auditory deafferentation; the left y-axis shows the speech perception threshold in noise, in dB SNR (with the noise fixed at 65 dB SPL); the right y-axis shows the speech perception threshold in quiet, in dB SPL. Data in blue hues show speech perception thresholds in noise, and data in red hues show speech perception thresholds in quiet; open circles indicate the median thresholds, grey vertical bars the interquartile ranges, and colored horizontal bars the means. The thick-colored horizontal bars and asterisks above and below the violin plots denote significantly elevated pairwise comparison thresholds with respect to 0% auditory deafferentation. The black asterisks denote a significantly higher threshold for speech perception in noise than in quiet for a given auditory deafferentation level. Data are displayed such that median values for noisy and quiet backgrounds align for the 0% auditory deafferentation condition (in other words, the left and right y axes were aligned based on 0% auditory deafferentation results) to better visualize the effect of auditory deafferentation on speech perception in noise versus in quiet.
Online AMT Task
Matrix tests provide less semantic information for speech perception but have a more predictable structure. Even though it remains debated whether matrix tests are more sensitive or less sensitive to auditory deafferentation than open-set tests (DiNino et al., 2022; Lunner et al., 2012), we used AMT to further investigate the effect of modeled auditory deafferentation. Each participant completed the baseline condition (processed with the WORLD vocoder only, see Methods section) and one of the five experimental conditions (0%, 50%, 90%, 95%, or 97.5% auditory deafferentation, N = 33, 31, 35, 35, 32, respectively). A GLM with factor Auditory deafferentation and covariate Age revealed that speech perception thresholds worsened with increasing deafferentation level (Figure 5) [F(4,160) = 35.358, p < .001]. Post hoc pairwise comparisons revealed significant differential threshold elevations at 90% auditory deafferentation and above (p = .025, p < .001, and p < .001 for 90%, 95%, and 97.5%, respectively, all Bonferroni adjusted). Age did not explain AMT speech perception thresholds [F(1,160) = 0.126, p = .723].

Online American English matrix test results. The x-axis shows the tested levels of auditory deafferentation; the y-axis shows the speech perception threshold in noise, in dB SNR (with the noise fixed at 65 dB SL). The purple violin plot shows speech in noise perception in the baseline condition (for which sentences in steady state noise were processed by the WORLD vocoder), while violin plots in blue hues show speech perception in noise thresholds for the different deafferentation conditions; open circles indicate the median threshold, grey vertical bars the interquartile range, and horizontal bars the mean. The colored horizontal bars and asterisks above the violin plots denote significantly elevated thresholds compared to the baseline condition.
To control for individual differences in speech-in-noise perception, we normalized the speech perception thresholds by subtracting a participant's Baseline speech comprehension threshold from their speech perception threshold (Figure 6). A GLM with factor Auditory deafferentation and covariate Age revealed a main effect on the differential, normalized thresholds [F(4,160) = 636.068, p < .001]. Post hoc pairwise comparisons revealed significant differential threshold elevations at 90% auditory deafferentation and above (p = .009, p < .001, and p < .001 for 90%, 95%, and 97.5%, respectively, all Bonferroni corrected). Age as a covariate did not explain the differential thresholds [F(1,160) = 1.037, p = .310].
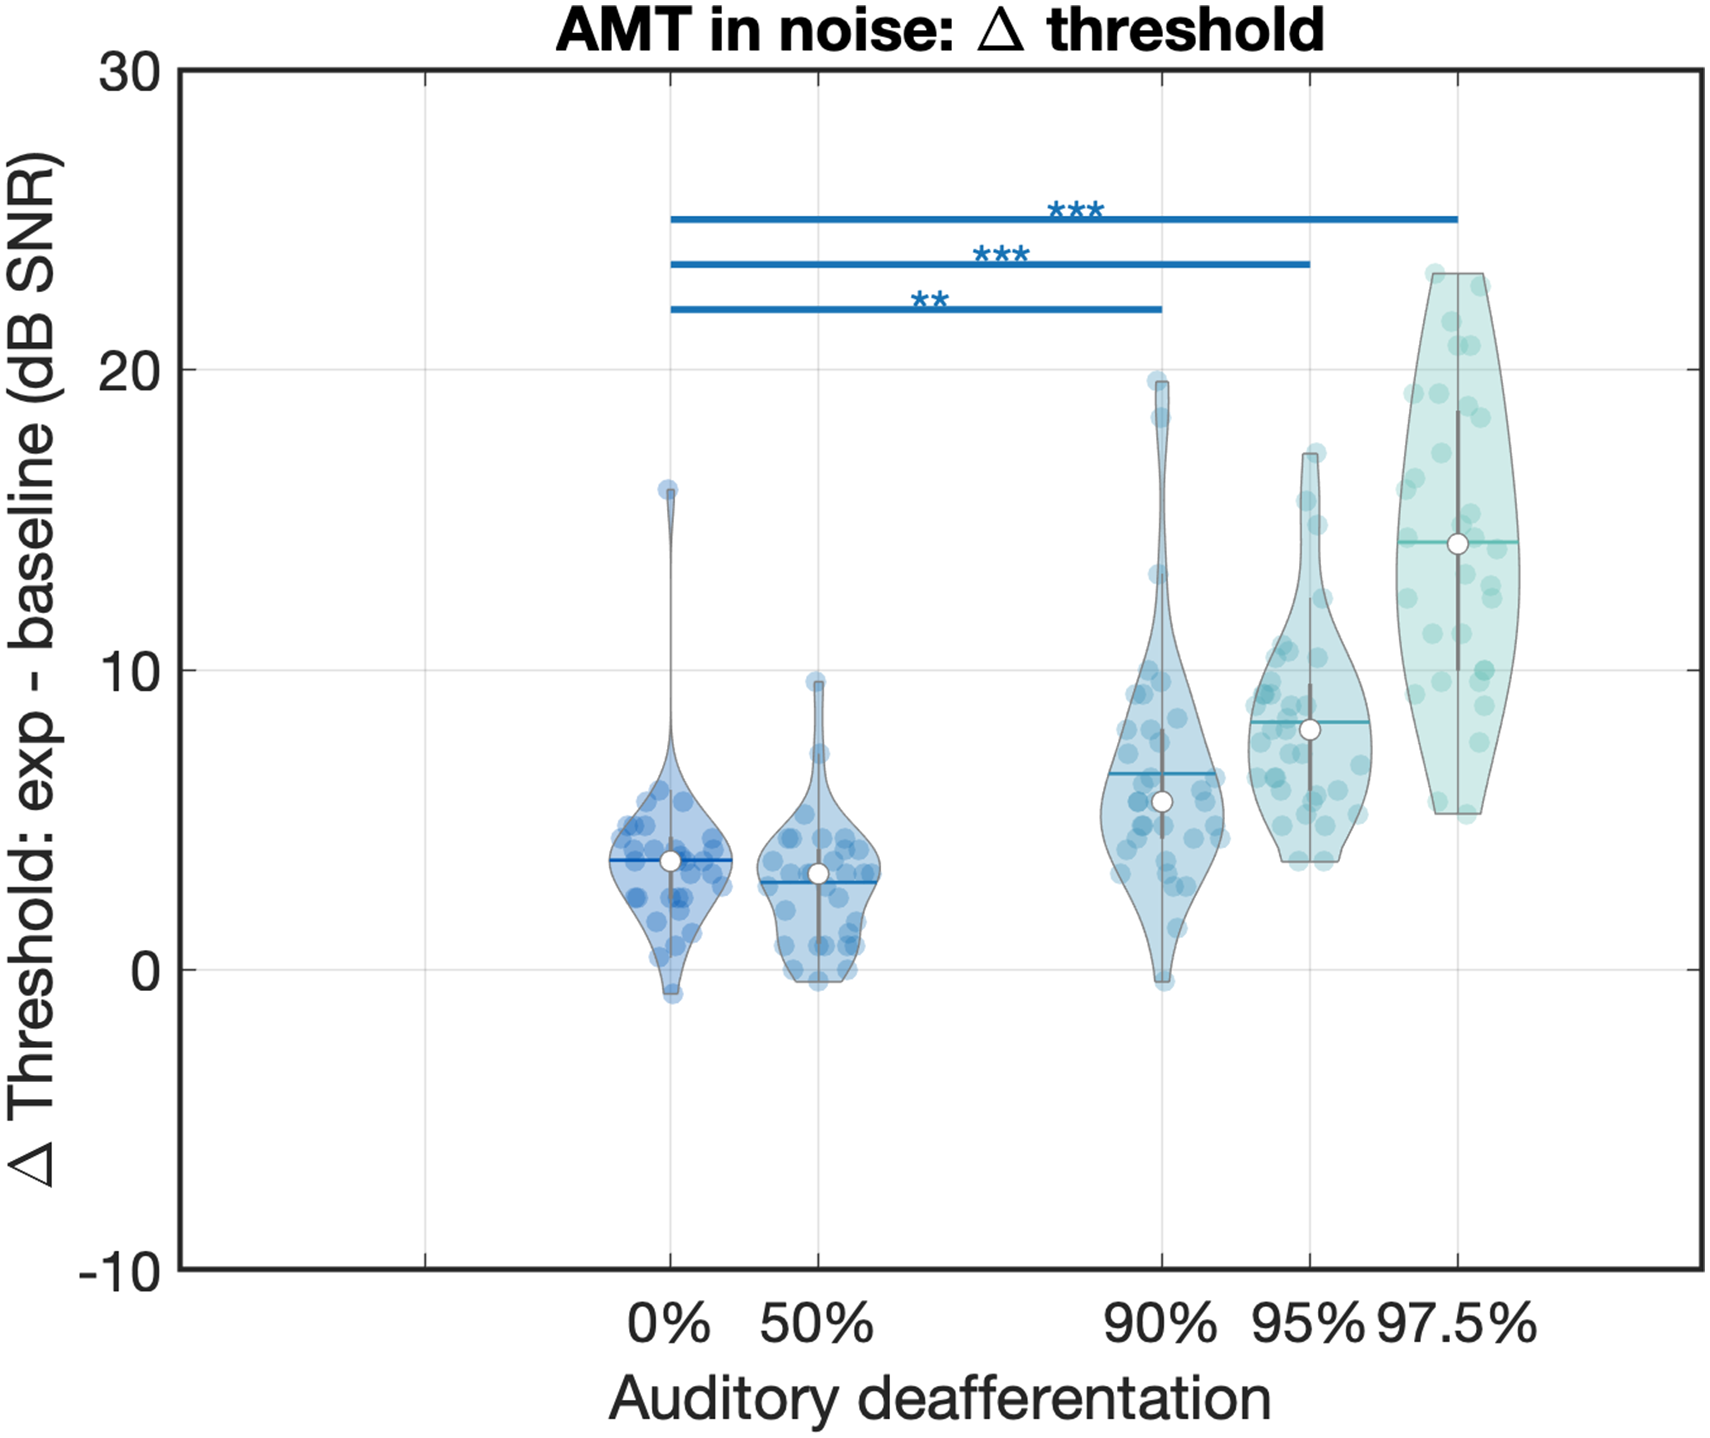
Normalized speech in noise perception thresholds in the online AMT task. The x-axis shows the tested levels of auditory deafferentation and the y-axis shows the speech in noise perception threshold in the experimental conditions minus the speech in noise perception threshold in the baseline condition, in dB SNR (with the noise fixed at 65 dB SL, sensation level). Violin plots show the individual data, where open circles indicate the median threshold, grey vertical bars the interquartile range, and horizontal bars the mean. The colored horizontal bars and asterisks above the violin plots denote significant changes in threshold compared to the 0% auditory deafferentation condition. AMT = American English Matrix Test.
Discussion
While physiological and behavioral changes related to auditory deafferentation are increasingly well understood in animal models (Chambers et al., 2016; Fernandez et al., 2020; Henry & Abrams, 2021; Resnik & Polley, 2021; Sergeyenko et al., 2013), their perceptual consequences in humans have remained relatively unclear. In an effort to determine the quantitative relationship between auditory deafferentation and speech perception, we simulated the impact of afferent loss on speech perception via an encoding-decoding model. The results show (1) that sounds can indeed be intelligibly reconstructed solely from simulated auditory nerve fiber firing data and (2) that deficits in speech perception in noise in combination with normal speech perception in quiet first become apparent for auditory deafferentation levels of around 90% to 95%.
Behavioral perception thresholds of decoded sentences worsened significantly for the conditions that included at least 90% auditory deafferentation, and this degradation in speech perception was more pronounced in noisy than in quiet backgrounds. These results are consistent with previous research suggesting a large degree of redundancy in the auditory pathway, whereby substantial degradation of peripheral, or afferent input has only a small impact on perception (Chambers et al., 2016; Oxenham, 2016; Resnik & Polley, 2021). Specifically, our results suggest that speech perception difficulties in noise with normal speech perception in quiet occur only for auditory deafferentation levels above 90%. Auditory deafferentation levels below 90% had no differential effect on speech perception in noise versus in quiet, while extreme levels of more than 95% auditory deafferentation affected speech perception in both noisy and quiet backgrounds. During normal aging, humans lose about one-third to two-thirds of ANFs over the course of a 100-year-long lifetime (Makary et al., 2011; Wu et al., 2019). This loss is much smaller than what our model and behavioral results suggest is needed for synaptopathy or deafferentation to affect speech intelligibility in noise. This could therefore explain why some authors have reported that even though synaptopathy occurs naturally with aging, it is not sufficient to affect speech-in-noise perception (Bramhall et al., 2019; Gómez-Álvarez et al., 2023; Johannesen et al., 2019).
Computational modeling of the auditory periphery has contributed significantly to our understanding of different aspects of auditory processing. Recent work by Grange and Culling (2020) used a similar encoding–decoding structure to study the effect of auditory deafferentation, but with a reconstruction process that implemented an inverted function of the modeled nonlinear auditory responses. In our work, we used a neural network to reconstruct input sounds, which is a highly nonlinear reconstruction method. Despite the different implementations in the encoding–decoding framework, Grange and Culling (2020) also found that more than 95% of auditory deafferentation was needed to reveal a statistically significant effect on speech perception in noise. However, the absolute values of the threshold change with auditory deafferentation differed slightly: in the current study, the speech perception threshold in noise with 95% auditory deafferentation was elevated by 5 dB compared to the 0% auditory deafferentation condition, while it was only 1.5 dB between 95% and 0% auditory deafferentation in Grange and Culling (2020). This difference in thresholds might be due to the different reconstruction methods, or due to task differences: Grange and Culling (2020) used a digit triplet task to estimate the speech reception threshold, while here we used HINT and AMT tasks.
There are other well-established computational models of the auditory periphery. For example, the computational model built and maintained by Carney and colleagues has been applied in many studies, including an investigation of the relationship between suprathreshold hearing and auditory peripheral coding (Carney, 2018; Zilany et al., 2014). Similarly, the model of Verhulst and colleagues has been used to investigate upstream physiological changes as a result of auditory deafferentation (Vasilkov et al., 2021; Verhulst et al., 2018). Our encoding model of the early auditory pathway is less complex than these models (e.g., it does not model higher-level efferent components). Nevertheless, in this work, we showed that a neural network approach can be applied to decode speech from modeled ANF responses. This decoding method can be expanded to any of the already established models to study how perception would be affected by, for example, the loss of efferents in the auditory pathway (Farhadi et al., 2022; Zilany et al., 2014).
There are some limitations to our approach. First, in our model, we assumed that the reconstruction stage optimally processed the degraded ANF PSTH to abstract the sound features and that this does not change with auditory deafferentation. However, this assumption might result in an underestimate of the speech perception deficit caused by auditory deafferentation because (1) the brain does not process the afferent signal optimally (Delgutte, 1996), and (2) auditory deafferentation also leads to upstream effects on the central nervous system. For example, it was recently shown that the loss of afferent information leads to hyper-synchronization of neurons in the primary auditory cortex, as seen in mice with ∼70% synaptic loss (Resnik & Polley, 2021). This hyper-synchronization was found to be correlated with behavioral tone detection performance, occurring only for miss trials in noise (but not for miss trials in quiet, or for hit trials in either background). Such hyper-synchronization could arise from an impoverished representation of the input sound, which might then lead to an over-representation of, or a hypersensitivity to the stimulus; alternatively, it might be viewed as a form of “internal noise,” which is caused by the deafferentation and persists in the auditory cortex. Either way, this deafferentation-induced hyper-synchronization may impede sound processing at higher-order auditory processing levels. This could cause our estimate of the deafferentation level to be higher than the actual deafferentation level needed for a deficit in speech perception.
Second, here we focused on measuring speech perception performance, which is only one of several aspects of hearing difficulties in noise. For example, the same level of perception can be based on different degrees of listening effort (Winn & Teece, 2021). As such, the difficulties that people experience when listening in noise might not only manifest in elevated speech perception thresholds but also in increased listening effort. In the current work, we measured speech perception difficulties only via speech perception thresholds, which might not fully capture the experienced hearing difficulties of those who have hearing difficulties in noise with clinically normal hearing thresholds.
Third, we used characteristics of gerbil ANFs in the model rather than those of nonhuman primates. This choice was mainly one of necessity, since the statistics and characteristics of gerbil ANFs, such as their rate-level function and proportions of SR types, are much better described in the literature (Huet et al., 2016) than those for nonhuman primate ANFs (Joris et al., 2011). However, since the encoding–decoding model was relatively general, comparatively minor species differences in aspects such as rate-level function or SR properties likely would not result in substantive model output differences. Put differently, as long as the information about the stimulus is encoded in the PSTH, the reconstruction can decode such information from PSTHs. Nevertheless, it is possible that model input parametrization affects the model performance, and this could be an interesting avenue for future research.
Even though spontaneous activity is an inherent characteristic of neuronal processing, we did not include it in the encoding stage of the model. Spontaneous activity may act as an internal noise that could affect performance on certain tasks (see discussion in Eggermont, 2015). In addition, changes in spontaneous activity may also be informative. For example, for a low-level low-frequency tone, phase locking may manifest at levels below the firing threshold in the presence of spontaneous activity (Heil & Peterson, 2017). Consequently, spontaneous activity might reveal a heightened sensitivity to such sounds when compared to a purely stimulus-driven change in firing rate. However, our approach focuses on speech perception (stimuli were complete sentences), and we are unaware of evidence that spontaneous activity affects complex processes such as speech perception.
Due to the COVID-19 pandemic, we had to perform parts of this study online. Converting auditory tasks to an online setting that is much less standardized and controlled is not without challenges. We were able to address some of the effects of variability in audio equipment by ensuring that participants had roughly equal sound level settings in sensation level and were wearing headphones (Woods et al., 2017; see also Milne et al., 2021). In addition, we adjusted how participants’ responses were recorded and evaluated: instead of participants verbally reporting what they heard (which is common for in-person speech perception tasks), we recorded their typed words and evaluated their responses using an online JavaScript-based spell-checker. While this procedure could lead to bad spellers having incorrectly high speech perception thresholds, it yielded comparable speech perception thresholds to those previously reported (Kollmeier et al., 2015). Despite our attempts to ensure that participants had approximately equal sound level settings, we did not feel confident enough to include speech-in-quiet conditions, since they can be easily influenced by simply increasing sound level midway through the adaptive task; instead, we only included tasks for which we surmised that increasing sound level volume would not greatly affect the performance, such as speech-in-noise tasks, where the SNR remains the same irrespective of overall sound level. In addition, we tested the 0% auditory deafferentation level for each participant with the combination of another auditory deafferentation level. This within-subject design ensured that the effect we saw could be attributed to our manipulation of auditory deafferentation. While there are challenges to running auditory psychophysics tasks in an online setting, one advantage is the ability to reach a larger and more diverse demographic sample.
One future step of this work will be to explore expansions to the encoding-decoding model that better allow the assessment of tone detection since this would allow a more direct comparison with animal behavior data (Henry, 2022; Resnik & Polley, 2021). Currently, the WORLD vocoder is optimized for complex, broadband speech signals, and does not reconstruct simple sinusoids or tones well. Consequently, a reconstruction method that is better suited to sounds other than speech is needed to broaden the investigation to tones and other comparatively simple sounds (e.g., frequency- or amplitude-modulated sounds [Johannesen et al., 2022] and gap detection stimuli).
Our model can be expanded further to study perceptual changes that are consequences of different types of impairments in the peripheral auditory system. For example, in the current model, we only considered the afferent system, while the efferent system also contributes significantly to hearing (Cooper & Guinan, 2006; Guinan et al., 2003; Mukerji et al., 2010). Recent progress in modeling the peripheral efferent system has enabled the investigation of how its degradation affects speech perception in noise (Farhadi et al., 2022; Grange et al., 2022). Moreover, with aging, a loss of afferent and efferent signals typically co-occurs (Fu et al., 2010; Liberman & Liberman, 2019; Zhu et al., 2007). Incorporating outer hair cell loss and efferent system loss (e.g., type II ANFs) into the model could therefore increase the accuracy with which the model can capture age-related deficits in hearing (Wu et al., 2019; Wu et al., 2020). Similarly, since aging or noise exposure often result in a frequency-specific loss of afferents (Valero et al., 2017; Wu et al., 2020), incorporating frequency-specific auditory deafferentation (e.g., high-frequency loss) might provide a better understanding of how speech perception is affected in natural aging.
In conclusion, this work enhances our understanding of auditory deafferentation and its putative influence on speech perception. By utilizing an encoding–decoding model to simulate afferent signal loss, we show that speech can be intelligibly reconstructed from simulated auditory nerve fiber spikes. Speech perception difficulty in noise with clinically normal speech perception in quiet was associated with modeled auditory deafferentation levels of approximately 90% to 95%. These results are consistent with previous studies showing a high degree of redundancy in the auditory pathway. Moreover, our approach offers opportunities for future research to expand the encoding–decoding framework and to further explore the broader impact of afferent (and efferent) signaling changes in the auditory system.
Footnotes
Declaration of Conflicting Interests
The authors declared no potential conflicts of interest with respect to the research, authorship, and/or publication of this article.
Funding
The authors disclosed receipt of the following financial support for the research, authorship, and/or publication of this article: This work was supported by the Charles Lafitte Foundation.
Appendix
Architectures of the optimized decoding models for the three sound features fundamental frequency, aperiodicity, and spectrum. For a detailed description of model architectures, see Akbari et al. (2019).
(1) Model architecture for decoding fundamental frequency
(2) Model architecture for decoding aperiodicity
(3) Model architecture for decoding spectrum