
Abstract
Single-sided deafness (SSD) is a typical condition of partial auditory deprivation. Total auditory deprivation triggers cross-modal neural reorganization, but in patients with partial hearing deprivation, how residual auditory function is balanced with the compensatory plasticity of other sensory modalities remains unclear. Previous studies have reported conflicting findings, potentially due to differences in study populations or task designs. Here, we investigated hierarchical neural processing in a homogeneous cohort of 37 congenital SSD patients (31.6 ± 6.5 years, 18 males) and 32 normal-hearing (NH) controls (30.6 ± 7.3 years, 14 males) using both auditory and visual oddball tasks with electroencephalography (EEG). In the auditory task, SSD patients presented reduced amplitudes of early exogenous components (N1, P2) and mismatch negativity (MMN), but preserved late endogenous components (N2, P3), compared with NH controls. Conversely, in the visual task, SSD patients presented increased early visual N1 amplitudes with intact visual mismatch negativity (vMMN) and endogenous components (N2, P3). No latency differences in the above components were observed. These results reveal a difference in plasticity between lower- and higher-level processing. Our findings indicate that functional plasticity in SSD patients occurs predominantly at sensory stages and is characterized by diminished auditory and compensatory elevated visual neural activity, whereas higher-level discrimination processing in either modality is largely unaffected. These findings clarify prior discrepancies, establish a hierarchical framework for understanding neuroplasticity in partial sensory deprivation, and have implications for rehabilitation strategies for SSD patients.
Introduction
Single-sided deafness (SSD), a typical condition of partial deprivation, not only impairs spatial sound-localization and speech-in-noise comprehension but also may alter the function of nonauditory sensory systems through cross-modal plasticity (Glick & Sharma, 2017; Kumpik & King, 2019; Rothpletz et al., 2012; Ruscetta et al., 2005; Shang et al., 2020, 2018). In individuals with bilateral deafness, widespread cross-modal reorganization is observed; this reorganization involves the recruitment of auditory cortices for visual processing and plasticity within the visual cortices and networks, leading to enhanced visual function (Bottari et al., 2011; Ding et al., 2015; Dye et al., 2009; Lomber et al., 2010). However, the situation in SSD individuals is more complex, as their auditory cortex is not entirely idle.
Previous SSD studies investigating functional or structural connectivity revealed significant alterations in the visual network, suggesting compensatory plasticity in the visual pathway (Liu et al., 2015; Wang et al., 2014, 2016; Zhang et al., 2016, 2018). Our prior EEG research using simple passively presented visual stimuli showed that congenital SSD patients exhibited stronger responses (Qiao et al., 2025), which aligns, to some extent, with a previous case study using high-density EEG that observed cross-modal recruitment of auditory areas for visual processing (Sharma et al., 2016). In contrast, a functional MRI (fMRI) study including mainly long-term acquired SSD patients revealed reduced activation of both the auditory and visual cortices during higher-order visuospatial memory tasks (Qiao et al., 2019). The discrepancy among these findings may be attributed to differences in the onset time of deafness, the type of task (lower-level vs. higher-level), or whether active participation in the experiment was needed. However, research on the brain's response to visual stimuli in SSD patients remains very limited, and many aspects remain unclear.
Previous studies in bilateral deafness suggest that reduced auditory input is associated with greater cross-modal activation of the auditory cortex. For example, an fMRI study using a visuospatial working memory task revealed that the amplitudes of cross-modal activation in the auditory cortex were positively correlated with the age of onset of hearing aid use, and negatively correlated with the percentage of lifetime hearing aid use (Ding et al., 2015). Using a similar task, the aforementioned fMRI study observed an activation alteration in SSD patients in the opposite direction to those in bilaterally deafness (Qiao et al., 2019). In conjunction with findings from multimodal neuroimaging studies using auditory stimuli in SSD children, which revealed stronger representation of the better-hearing ear in the auditory pathway (Calmels et al., 2022; Gordon et al., 2015; Lee et al., 2020; Schmithorst et al., 2014; Sharma et al., 2005), the authors speculated that the increased auditory processing load caused by reduced auditory input was likely the reason for this phenomenon, but this hypothesis has not been confirmed due to the lack of studies involving simultaneous auditory tasks. The previous study investigated the early cortical response to simple auditory and visual stimuli in the same group of SSD patients (Qiao et al., 2025). However, using simple passive stimuli seems insufficient to illustrate the resource reallocation between the two pathways during higher-level processing. Existing research remains limited by analyzing isolated sensory modalities (e.g., auditory or visual only) or processing hierarchies (e.g., lower- or higher-level), while population heterogeneity (e.g., congenital vs. acquired SSD) further obscures consistent conclusions. To our knowledge, no study has synchronously explored lower- and high-level processing mechanisms in both auditory and visual modalities within the same SSD cohort.
EEG can record brain activity with millisecond-level temporal resolution. Analysis of different event-related potentials (ERP) components allows the separation of early perceptual bottom-up processing from later high-level top-down processing, involving attention, memory, and other cognitive functions (Duncan et al., 2009; Getz & Toscano, 2021). To fill the aforementioned knowledge gap, the present study conducted EEG experiments using both visual and auditory oddball tasks in the same group of congenital SSD individuals, and made comparisons with normal-hearing (NH) individuals. By analyzing changes in exogenous ERP components such as N1, P1, and mismatch negativity (MMN), as well as in endogenous components such as N2 and P3, we sought to elucidate the effects of partial auditory deprivation on both lower- and higher-level processing in the two sensory modalities. We hypothesized that SSD patients may exhibit significant alterations in neural activity in both pathways and that ERP alterations in components reflecting different stages of processing may differ.
Materials and Methods
Participants
Thirty-seven adults with congenital SSD were recruited from the clinic at the Department of Otorhinolaryngology of Peking Union Medical College Hospital. SSD was defined as profound sensorineural hearing loss on the deaf side with average pure tone audiometry (PTA) thresholds ranging from 0.5 to 4 kHz > 90 dB HL and normal hearing on the other side with average PTA thresholds <25 dB HL. Of these patients, 19 had left SSD, and 18 had right SSD. None of the SSD patients reported any history of hearing aid usage. Thirty-two NH individuals were enrolled as controls and were matched by sex, age, and years of education (Table 1). All participants were right-handed with normal or corrected-to-normal vision and had no history of neurological disorders, psychiatric disorders, significant head trauma, or ear diseases (specifically, the normal control group had no auditory conditions, whereas the SSD group exhibited no otologic pathologies beyond congenital hearing loss). All the participants completed the experiment. Data from seven controls and three SSD participants in the auditory task and from five NH controls and six SSD participants in the visual task were excluded because of high-level background noise and physiological artifacts. This study was approved by the Ethics Committee. All participants provided written informed consent prior to enrollment in the study. This research was conducted ethically in accordance with the World Medical Association Declaration of Helsinki.
Demographic Data of Patients with SSD and NH Controls.

Note. SSD = single-sided deafness; NH = normal hearing; SD = standard deviation; PTA = pure tone audiometry.
Experimental Paradigm
The participants sat comfortably in a dimly lit, electrically shielded, soundproof booth in front of a 19-inch computer monitor (1,280 × 1,024 pixels, 60 Hz frame rate) at a 100-cm viewing distance. The stimuli were presented using E-Prime 3.0 (Psychology Software Tools, Inc., Pittsburgh, PA, USA). The audio system included an audiometer (GSI 61) and insert earphones (ER3A).
The participants performed oddball tasks under both auditory and visual conditions. The auditory stimulus consisted of a discrimination task with the monosyllables “/di/” and “/da/” as standard and deviant stimuli. The sounds were recorded from real human voices and calibrated to ensure standardized speech quality. Each syllable was presented binaurally for 170 ms at an intensity of 65 dB SPL, with a pseudorandom interval of 1,330–1,530 ms. Binaural presentation was adopted to approximate real-life listening conditions and to maintain consistency between groups, although the deaf ear in the SSD group received negligible auditory input. During stimulus presentation, the participants were required to maintain fixation on a central point (0.2° × 0.2°). The visual stimulus consisted of a word discrimination task with “8” and “2” as standard and deviant stimuli, respectively. Each word was presented for 100 ms in the middle of the screen, with a pseudorandom interval of 1,200–1,400 ms. The stimuli were selected to ensure clear perceptual distinction in both auditory and visual modalities. Both “/di/” – “/da/” and “2” – “8” were familiar and easily distinguishable for native Mandarin Chinese speakers. There were four blocks in each condition, and each block contained 50 trials. In each condition, the probabilities of the standard and deviant stimuli were .80 and .20, respectively. The participants were instructed to respond to each presented stimulus by pressing the corresponding key: key “1” for the syllable “/di/” and key “2” for “/da/” in the auditory task, key “1” for the digit “8” and key “2” for the digit “2” in the visual task. Reaction times (RTs) and accuracy rates were recorded simultaneously during both tasks. RT was defined as the interval from stimulus onset to key press, and the RT of each subject was the average RT for valid responses. The accuracy rate was calculated as the percentage of correct responses across all valid trials.
EEG Recording
EEG data were recorded using 64 Ag-AgCl scalp electrodes placed according to the extended 10–20 system (Neuroscan, SynAmps2 8050, Compumedics, Australia) with CURRY 8 EEG software. The EEG data were amplified and bandpass-filtered online at 0.01–100 Hz and digitized at a sampling rate of 1,000 Hz. The impedance of all electrodes was checked before the start of each block to ensure that it remained below 10 kΩ during data acquisition.
EEG Preprocessing
The EEG signals were preprocessed in MATLAB (MathWorks, Inc., Natick, MA, USA) using the EEGLAB toolbox. The data were rereferenced to the average of the bilateral mastoids and bandpass filtered between 1 and 30 Hz. The filtered data were then epoched using a time window of 1,000 ms, ranging from −100 ms to 900 ms relative to the onset of the stimulus. Each epoch underwent baseline correction based on the prestimulus interval. Channels exhibiting significant artifacts were eliminated through visual inspection, and further rejection of data that were affected by muscle artifacts and eye movements was performed using independent component analysis (ICA).
ERP Analysis
The average ERP for each subject in both the auditory and visual oddball tasks was recorded. Early exogenous components were analyzed in frequent standard stimulus trials, whereas late endogenous components were analyzed in rare deviant stimulus trials (Kestens et al., 2023). For auditory tasks, N1 and P2 were measured in standard stimulus trials at the Fz channel, and N2 and P3 were measured in deviant stimulus trials at the Pz channel, which showed the largest deflections in the grand average waveforms (Polich, 2007; Scanlon et al., 2019). The MMN component was also observed in the deviant-minus-standard difference wave at the Cz channel (Kong et al., 2025, 2024; Yang et al., 2024). The time windows for peak detection were defined on the basis of the grand average waveform of all participants as follows: N1: 50–100 ms, P2: 150–300 ms, MMN: 100–210 ms, N2: 230–320 ms, and P3: 200–500 ms. For visual tasks, N1 was measured standard stimulus trials at the Oz channel (Di Russo et al., 2007), and N2 and P3 were measured in deviant stimulus trials at the Fz and Pz channels (Folstein & Van Petten, 2008; Polich, 2007). The vMMN component was also observed in the difference wave at the Oz channel (Czigler & Kojouharova, 2021). The time windows for peak detection were defined as follows: N1: 100–160 ms, vMMN: 200–300 ms, N2: 160–250 ms, and P3: 250–600 ms. Fractional area latency was calculated using a 50% fractional area within the time window. The amplitude was defined as the average amplitude within a 20 ms window centered around the peak in the measurement window.
Global Mean Field Power Analysis
To provide a spatially unbiased representation of neural activity across the scalp, we additionally calculated the global mean field power (GMFP) for each condition and participant. The GMFP reflects the standard deviation of the voltage across all electrodes at each time point, representing the overall strength of the electric field independent of reference and electrode selection.
Statistics
Statistical analysis was conducted using IBM SPSS Statistics version 26. The chi-square test was used to assess sex differences between the two groups. The Mann–Whitney U-test was applied to compare intergroup differences in years of education. Independent sample t-tests were used to evaluate intergroup differences in age and PTA thresholds for normal hearing ears. One-sample t-tests were performed to assess whether the difference wave was significantly elicited. Differences in the amplitudes and latencies of the ERP components between the two groups were analyzed using general linear models (GLM), with age, sex, and the average PTA thresholds of the normal-hearing ear included as covariates. Effect sizes were reported as partial η2 alongside F and p values. In addition, within-group analyses were conducted in the SSD cohort to examine the potential effects of the deaf-ear side and the average PTA thresholds of the normal ear.
Results
Behavioral Data
No significant difference was found in the PTA thresholds of the normal ears between SSD patients and NH controls (Table 1). In both the auditory and visual experiments, the RTs and the accuracy of the tasks were also measured, and no significant differences were found between the two groups.
Auditory Stimulus
The GMFP waveforms and grand-averaged ERP waveforms in SSD patients and NH controls in the auditory oddball task are displayed in Figure 1. Both exogenous and endogenous components can be observed in both groups. We compared the amplitudes and the latencies of both exogenous and endogenous components, including N1, P2, MMN, N2, and P3, between SSD patients and NH controls (Figure 2 and Table 2).

Responses evoked by the auditory oddball task in the SSD and NH groups. (A) GMFP waveforms for both groups, depicting the overall brain response strength over time. (B) Topographic maps corresponding to the peak latencies identified from the GMFP waveforms. (C) Grand-averaged ERP waveforms at the midline electrodes Fz, Cz, Pz, and Oz. The shaded regions represent the SEM, indicating inter-individual variability within each group. ERP = event-related potential; SSD = single-sided deafness; NH = normal hearing; GMFP = global mean field power; SEM = standard error of the mean.

ERP responses evoked by the auditory oddball task in SSD and NH groups. (A) Grand-average waveforms for standard stimuli (N1/P2 at Fz), deviant stimuli (N2 at Fz; P3 at Pz), and deviant-standard difference wave (MMN at Cz) in the auditory oddball task. (B) Intergroup comparisons of component amplitudes (20-ms peri-peak windows) and latency. (C) Topographic maps illustrate voltage distributions within ±20 ms of component peaks. The shaded regions represent the SEM, indicating inter-individual variability within each group. Error bars represent the standard error of the mean. ERP = event-related potential; SSD = single-sided deafness; NH = normal hearing; MMN = mismatch negativity; SEM = standard error of the mean. *p < .05.
Amplitude and Latency of Auditory Task Components in Patients with SSD and NH Controls.

Note. ERP = event-related potential; SSD = single-sided deafness; NH = normal hearing; MMN = mismatch negativity; SD = standard deviation. *p < .05.
A significant reduction in the amplitude of early exogenous components, that is, N1, F(1, 54) = 8.161, p = .006, ηp2 = 0.131, and P2, F(1, 54) = 4.42, p = .040, ηp2 = 0.076, at the Fz electrode was observed in SSD patients, compared with the control group. No significant latency difference was observed for either the N1, F(1, 54) = 2.469, p = .122, ηp2 = 0.044, or the P2, F(1, 54) = 2.207, p = .143, ηp2 = 0.039, component. One sample t-test for deviant-minus-standard difference waves indicated that a reliable MMN component was elicited at the Cz electrode in both the NH group, t(24) = −6.47, p < .001, and the SSD group, t(33) = −5.12, p < .001, and comparisons between groups revealed a significant reduction in amplitudes in the SSD group, F(1, 54) = 4.786, p = .033, ηp2 = 0.081, but no difference in latencies, F(1, 54) = 2.202, p = .144, ηp2 = 0.039.
In contrast to the significant differences observed in early exogenous components, no significant differences between SSD patients and NH controls were found in the amplitudes of late endogenous components, including N2, F(1, 54) = 0.028, p = .868, ηp2 = 0.001, and P3, F(1, 54) = 0.243, p = .624, ηp2 = 0.004. Similarly, latency measures for both N2, F(1, 54) = 0.062, p = .805, ηp2 = 0.001, and P3, F(1, 54) = 0.078, p = .781, ηp2 = 0.001, showed no statistically significant group differences.
In addition, the GLM analysis conducted within the SSD group revealed that the average PTA thresholds of the normal-hearing ear significantly affected auditory N1 amplitude after controlling for deafness side, F(1, 31) = 7.095, p = .012, ηp2 = 0.184, while no significant effect of deaf-ear side was observed (Supplemental Material Part 1). The grand-averaged waveforms for the LSSD and RSSD subgroups are shown in Supplementary Figure 1.
Visual Stimulus
The visual GMFP and grand-averaged ERP waveforms for the two participant groups (SSD and NH) are shown in Figure 3. Both exogenous and endogenous components were also observed in both groups. The N1, vMMN, N2, and P3 components were measured and compared between the two groups (Figure 4 and Table 3).

Responses evoked by the visual oddball task in SSD and NH groups. (A) GMFP waveforms for both groups, depicting the overall brain response strength over time. (B) Topographic maps corresponding to the peak latencies identified from the GMFP waveforms. (C) Grand-averaged ERP waveforms at the midline electrodes Fz, Cz, Pz, and Oz. The shaded regions represent the SEM, indicating inter-individual variability within each group. ERP = event-related potential; SSD = single-sided deafness; NH = normal hearing; GMFP = global mean field power; SEM = standard error of the mean.
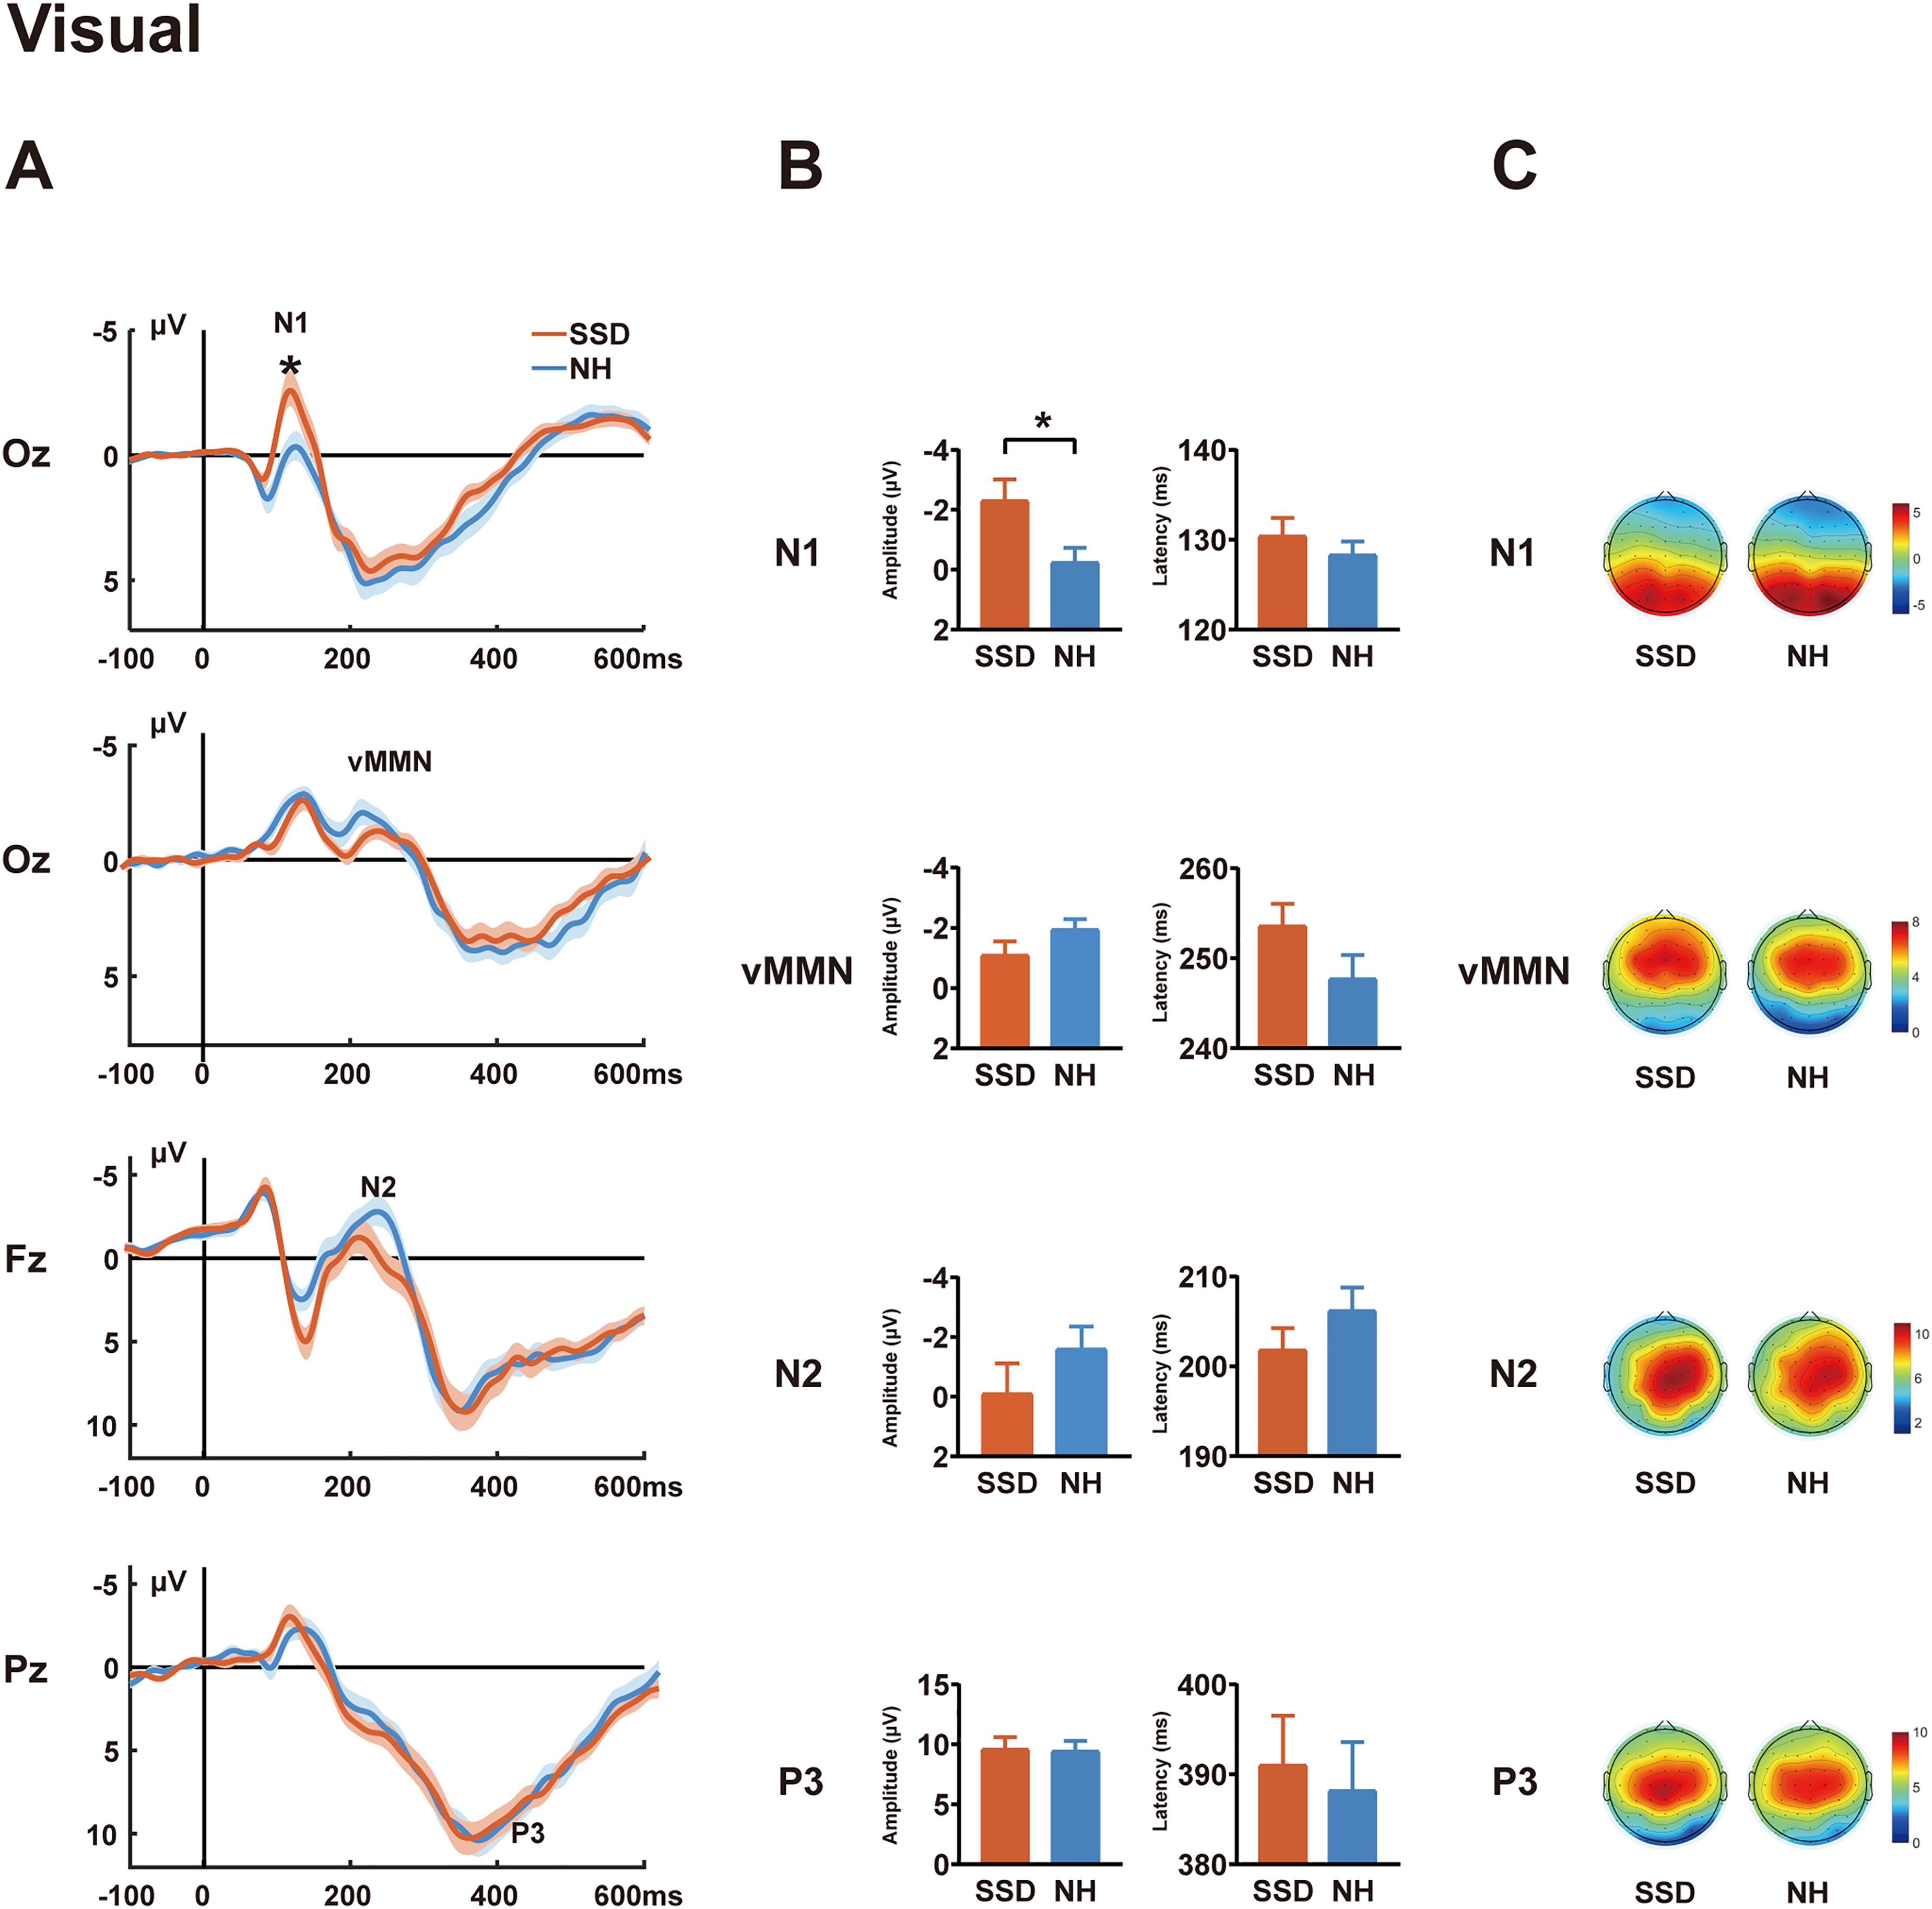
ERP responses evoked by the visual oddball task in SSD and NH groups. (A) Grand-average waveforms for standard (N1 at Oz), deviant (N2 at Fz; P3 at Pz), and deviant-standard difference wave (vMMN at Oz) in visual oddball task. (B) Intergroup comparisons of component amplitudes (20-ms peri-peak windows) and latency. (C) Topographic maps illustrate voltage distributions within ±20 ms of component peaks. The shaded regions represent the SEM, indicating inter-individual variability within each group. Error bars represent the standard error of the mean. ERP = event-related potential; SSD = single-sided deafness; NH = normal hearing; vMMN = visual mismatch negativity; SEM = standard error of the mean; *p < .05.
Amplitude and Latency of Visual Task Components in Patients with SSD and NH Controls.

Note. ERP = event-related potential; SSD = single-sided deafness; NH = normal hearing; vMMN = visual mismatch negativity; SD = standard deviation. *p < .05.
The N1 amplitudes at the Oz electrode were significantly greater in SSD patients than in NH controls, F(1, 53) = 4.138, p = .047, ηp2 = 0.072, although no group differences were observed in N1 latencies, F(1, 53) = 0.990, p = .324, ηp2 = 0.018. One sample t-test for deviant-minus-standard difference waves indicated that a reliable vMMN component was elicited at the Oz electrode in both the NH group, t(26) = −3.90, p = .001, and the SSD group, t(30) = −3.28, p = .003, subsequent ANCOVA showed no significant group differences in either amplitude, F(1, 53) = 1.631, p = .207, ηp2 = 0.030, or latency, F(1, 53) = 1.432, p = .237, ηp2 = 0.026. A comparison of later endogenous components revealed no significant differences in either amplitude: N2: F(1, 53) = 1.427, p = .238, ηp2 = 0.026; P3: F(1, 53) = 0.001, p = .976, ηp2 = 0.000, or latency; N2: F(1, 53) = 0.556, p = .459, ηp2 = 0.010; P3: F(1, 53) = 0.560, p = .457, ηp2 = 0.010.
Furthermore, GLM analysis conducted within the SSD group indicated no significant effects of deaf-ear side or the average PTA thresholds of the normal-hearing ear (Supplemental Material Part 1). Supplementary Figure 1 presents the grand-average waveforms for the LSSD and RSSD subgroups in the visual oddball task.
Discussion
In this study, we conducted a comprehensive investigation of multiple ERP components in SSD patients using auditory and visual oddball tasks. These patients exhibited significant attenuation of the exogenous auditory ERP components (N1, P2, MMN), whereas the early visual N1 component was increased. Moreover, despite partial auditory deprivation, SSD patients showed no significant alterations in endogenous ERP components (N2/P3) in either task, or in the vMMN difference wave.
In our auditory experiment, binaural stimulation was used to simulate real-life conditions, revealing significantly reduced N1 and P2 amplitudes in SSD patients compared to NH controls. The auditory N1 and P2 components, within 100–200 ms after stimulus onset, are typically classified as exogenous ERP components, reflecting early sensory responses of the primary auditory cortex to external stimuli and representing preattentive sound processing (Paiva et al., 2016). Binaural stimulation can induce cortical summation effects, enhancing early auditory components such as P1 and P2 due to increased bilateral neural recruitment and interhemispheric integration (Papesh et al., 2015). The reduced amplitude observed in SSD patients may, to some extent, reflect a decline in perceptual processing resulting from unilateral auditory deprivation and the absence of cortical summation effects. Prior studies of early auditory ERP responses in SSD patients primarily used monaural stimulation to assess lateralization changes, limiting their comparability with the present binaural-stimulation-based study (Khosla et al., 2003; Maslin et al., 2013; Ponton et al., 2001). The previous study (Qiao et al., 2025) compared SSD responses under monaural stimulation with NH responses under both monaural and binaural conditions. The comparison between SSD monaural and NH binaural responses was similar to the present study but revealed no significant differences in N1 or P2 amplitude, suggesting that although SSD patients have lost the binaural summation effect, they recruit more neural resources when processing signals from the only hearing ear, approaching the level of resources engaged by NH individuals during binaural processing. The previous study employed a passive task with auditory stimuli similar to the current study. Passive tasks required minimal attentional engagement, whereas the present categorical discrimination task necessitated active stimulus evaluation and classification, and top-down attentional allocation-cognitive processes known to modulate N1 and P2 generation (Crowley & Colrain, 2004; Näätänen & Picton, 1987). Thus, task differences likely account for the discrepancies. Additionally, the previous study revealed greater amplitudes in monaural SSD responses than in monaural NH responses (Qiao et al., 2025). In the Supplemental Material, we compared the amplitudes of N1 and P2 between the active task used in the present study and the passive task from our previous research in participants who completed both tasks. The results showed that in NH subjects, the P2 amplitude was significantly higher during the active task than during the passive task, whereas SSD patients showed no significant difference between the two tasks. These results suggest that SSD patients may have lower flexibility of auditory attention. Specifically, the cortical resources were chronically overtaxed in SSD patients and could no longer allocate comparable resources relative to NH subjects by attention to the auditory task. Future studies implementing both passive and active tasks simultaneously may further clarify this issue.
In contrast to the findings for auditory N1 and P2 components, the amplitude of the visual exogenous ERP component (N1) was found to be increased in SSD patients, across both frequent and infrequent stimuli, suggesting enhanced neural activity in the early stage of cortical visual processing. Using passive visual stimuli, previous study reported similar results (Qiao et al., 2025). Both results suggest that the reduction in auditory input likely prompted the brain to undergo adaptive adjustment of the visual system. Previous studies in patients and animal models with bilateral deafness suggest that possible mechanisms include increased recruitment of multimodal regions, cross-modal recruitment of the auditory cortex, or hypertrophy of the auditory cortex itself (Bavelier & Neville, 2002; Benetti et al., 2017; Bola et al., 2017; Liu et al., 2015; Vachon et al., 2013). However, since our study did not include a source analysis, it is difficult to determine the primary mechanism involved. Only a few studies investigated alterations in brain activation to visual stimuli in SSD patients. Using high-density EEG, a previous case study of a postlingual SSD patient revealed activation of auditory areas in superior and medial temporal gyri in response to simple visual stimuli (Sharma et al., 2015). The previous study revealed no significant alteration in the dipole strength of V1 in SSD patients; this contrasted with the significant increase in VEP amplitude at the sensor level, suggesting that increased recruitment of polymodal or auditory areas, rather than hypertrophy of V1, may be the primary mechanism (Qiao et al., 2025).
Both auditory and visual MMN components are regarded as indices of pre-attentive change detection, that indicate whether the brain can discriminate stimulus differences (Kremlacek et al., 2016; Näätänen et al., 2007). However, in the present study, divergent results were observed across auditory and visual tasks. Specifically, a significant attenuation in auditory MMN amplitude was observed in SSD patients, whereas no statistically significant alteration in vMMN was observed. The auditory MMN is considered to reflect the precision of the auditory system in differentiating low-level perceptual features of stimuli at sensory processing stages (Abrahamse et al., 2021). It requires no attention from the listener, although it may be modulated by attention. Our finding in auditory MMN aligns well with previous studies in patients with both bilateral and unilateral hearing loss, which also reveal decreased amplitudes and suggested impaired preattentional auditory change detection mechanisms (Cai et al., 2015; Chen et al., 2022; Fu et al., 2016). In contrast, the preservation of vMMN indicates that the visual automatic change detection system remains unaffected and not compensatorily influenced. A previous study (Deng et al., 2020) that investigated vMMN in deaf signers reported significant alterations for the lexical signs but not for nonsign signals; the latter result is to some extent in accordance with the present study. Taken together, these dissociative findings between auditory and visual MMN suggest that SSD patients may experience impairments in pre-attentive auditory change detection in daily noisy environments, whereas visual discrimination remains intact.
Regarding endogenous components, despite the fact that SSD patients experience auditory deprivation in one ear, we observed no significant alterations in the amplitudes or latencies of N2 and P3 components during either auditory or visual tasks. The N2 component is associated with attentional engagement and cognitive control and often exhibits increased amplitude in tasks involving response inhibition and conflict monitoring (Folstein & Van Petten, 2008). Prior research using the auditory oddball paradigm has shown that in bilateral hearing loss patients, N2 amplitude is significantly reduced and latency is prolonged, particularly among older adults, suggesting potential declines in associated cognitive regions (Bertoli et al., 2005; Oates et al., 2002). In contrast, we observed no significant changes in either auditory or visual N2 among SSD patients, implying that intact hearing in one ear may suffice for maintaining stable auditory cognitive processing and that the impact of SSD on visual attention and related cognitive control processes is likely minimal.
P3 reflects a higher-level cognitive process in which stimuli are compared to working memory models and updated when changes are detected; it requires both perceptual discrimination and attention (Polich, 2007). Previous studies of patients with hearing loss have suggested that the auditory P3 amplitude remains stable as long as the stimuli are discriminable (Amaral et al., 2022; Ghiselli et al., 2020). Furthermore, the auditory P3 is considered a physiological measure of the engagement of cognitive systems that contribute to listening effort, and its amplitude and latency increase when stimuli are near the hearing threshold or the signal-to-noise ratio decreases (Kestens et al., 2023). The preservation of auditory P3 suggests that with normal hearing preserved in one ear, SSD patients can effectively distinguish signal changes, and that no significant alterations in listening effort were observed because of the very simple task used in this study.
Few studies have investigated visual P3 in hearing loss patients. A study investigating visual sequential processing using the P3 component in children with cochlear implants (CIs) revealed longer P3 latencies, suggesting slower processing of sequential visual stimuli (Bharadwaj & Mehta, 2016). In another study, CI adolescents were exposed to alternating visual and auditory stimuli in an oddball paradigm with attention directed to either modality (Harris & Kamke, 2014). NH participants presented similar P3 amplitudes across tasks, whereas CI individuals presented prominent P3 only during visual attention, suggesting reduced processing of irrelevant visual deviants, likely due to increased cognitive demand during auditory tasks. However, using a simple visual oddball paradigm, our study revealed no differences between SSD patients and NH controls. This discrepancy from previous studies may result from preserved unilateral auditory input in SSD, leading to lower cognitive demand than in CI users, and the simplicity of our task, which may have limited sensitivity in detecting visual processing changes.
Taken together, our findings suggest that SSD patients exhibit functional reorganization in both auditory and visual pathways, with distinct plasticity patterns at lower versus higher processing levels. The altered early exogenous components and preserved late endogenous components suggest that SSD patients undergo plasticity at early perceptual stages while maintaining intact high-level cognitive processing in both modalities. In bilateral deafness patients, multiple studies using both lower- and higher-level tasks have confirmed that extra cortical resources—including the auditory cortex—are recruited for visual processing, suggesting an auditory-to-visual shift in cortical resources (Bola et al., 2017; Finney et al., 2001; Liang et al., 2017). Although studies of SSD patients using visual stimuli are limited, mixed findings were reported. Using a visual-spatial working memory task, the previous fMRI study revealed decreased activation in the auditory cortex (Qiao et al., 2019), whereas using simple passive visual stimuli, increased VEP amplitudes were observed (Qiao et al., 2025). Leveraging EEG temporal resolution, the present study demonstrated that visual processing alterations in SSD are stage-dependent—enhanced at early stages but not at higher-level stages, which helps explain the discrepancy in previous SSD studies. We speculate that SSD patients do not exhibit an auditory-to-visual cortical resource shift during higher-order visual processing because the intact auditory input on the hearing side still requires substantial auditory processing, leaving no extra resources available for visual processing.
This study provides further insight into central reorganization in patients with SSD. This bears substantial clinical relevance, not only because SSD has a high incidence rate (Kay-Rivest et al., 2022), but also because it represents an extreme case within a spectrum of partial hearing loss or partial hearing rehabilitation seen in many patients. Understanding the impact of SSD on the central nervous system offers critical guidance for determining optimal intervention timing and strategies for this entire population.
We recognize several limitations to this study. The present study only conducted ERP analysis and was unable to determine which cortical regions contributed to the amplitude changes of each component. Future studies incorporating source localization techniques or neuroimaging methods with higher spatial resolution, such as MEG and fMRI, may provide more detailed information. Additionally, the behavioral results of this study were limited to accuracy and RT, which may not fully reflect the functional implications of ERP alterations. Future research employing more complex tasks could better link neural markers to real-world functional outcomes. Moreover, the present study focused the analysis of each ERP component on its representative electrode (commonly the one with the greatest amplitude), rather than conducting a whole-brain analysis with multi-comparison correction, or even source analysis. Thus, future studies employing more comprehensive approaches may provide further information.
Conclusions
This study demonstrates that functional plasticity in patients with SSD primarily occurs at early stages of sensory processing. Specifically, early exogenous components in auditory tasks were reduced, while early exogenous components in visual tasks were enhanced, suggesting that cross-modal recruitment of the visual modality may serve as a compensatory mechanism. In contrast, late endogenous components remained stable across both auditory and visual tasks, indicating that partial auditory deprivation does not significantly affect higher-order discrimination and cognitive evaluation processes. These findings provide a hierarchical framework for understanding neural adaptation under partial sensory deprivation and help reconcile previous inconsistencies in the literature.
Supplemental Material
sj-docx-1-tia-10.1177_23312165251413850 - Supplemental material for Functional Plasticity in Auditory and Visual Discrimination Processing in Patients with Single-Sided Deafness: An EEG Study
Supplemental material, sj-docx-1-tia-10.1177_23312165251413850 for Functional Plasticity in Auditory and Visual Discrimination Processing in Patients with Single-Sided Deafness: An EEG Study by Qiaoyu Liu, Yufei Qiao, Min Zhu, Jiayan Yang, Wen Sun, Yaohan Chen, Saiyi Jiao, Hang Shen and Yingying Shang in Trends in Hearing
Footnotes
Acknowledgments
We would like to thank all participants, including the patients with single-sided deafness and normal hearing control volunteers.
Ethical Approval and Informed Consent Statements
This study was approved by the Ethics Committee of Peking Union Medical College Hospital (Ethics Code: I-24PJ0481) on March 05, 2024. All participants provided written informed consent prior to enrollment in the study. This research was conducted ethically in accordance with the World Medical Association Declaration of Helsinki.
Funding
The authors disclosed receipt of the following financial support for the research, authorship and/or publication of this article: This work was supported by the National Natural Science Foundation of China (Grant Nos. 82171156 and 32371051) and the Peking Union Medical College Hospital Talent Cultivation Program (Category C) No. UBJ10135 and the Fundamental Research Funds for the Central Universities (3332024010).
Declaration of Conflicting Interests
The authors declared no potential conflicts of interest with respect to the research, authorship, and/or publication of this article.
Data Availability Statement
The data and the code that support the findings of this study can be shared upon reasonable request. Researchers wishing to obtain access must contact the corresponding author and last author providing a concrete project outline on the use of the data. A formal data sharing agreement will be eventually arranged.
Supplemental Material
Supplemental material for this article is available online.
References
Supplementary Material
Please find the following supplemental material available below.
For Open Access articles published under a Creative Commons License, all supplemental material carries the same license as the article it is associated with.
For non-Open Access articles published, all supplemental material carries a non-exclusive license, and permission requests for re-use of supplemental material or any part of supplemental material shall be sent directly to the copyright owner as specified in the copyright notice associated with the article.