
Abstract
Cochlear-implant listeners show impaired pitch perception compared to normal-hearing listeners. One of the factors limiting pitch sensitivity in multi-electrode as compared to single-electrode stimulation can be intracochlear interactions of electrode signals (i.e., channels). We measured temporal-pitch discrimination sensitivity for loudness-balanced dual-electrode stimuli with various spatio-temporal configurations in listeners with MED-EL implants. We hypothesized a link between pitch sensitivity and tonotopic separation as well as (monaural) temporal electrode asynchrony, the latter resulting in various combinations of inter-pulse intervals in the compound stimuli received by the auditory nerve. Per-electrode stimulus types were high-rate (i.e., 1,000-pps) pulse trains with a 100-Hz amplitude modulation and both with and without additional pulses inserted with short inter-pulse intervals at modulation peaks. The temporal asynchrony had a detrimental effect for tonotopic separations below 2.2 mm but not for separations of 7.1 mm and more. This pattern was largely consistent across stimulus types and can be attributed to spectro-temporal channel interactions. When compared with sensitivity to unmodulated 100-pps pulse trains [Lindenbeck et al., Trends in Hearing, 28, Article 23312165241271340 (2024)], stimuli without short inter-pulse interval pulses yielded lower sensitivity while stimuli with short inter-pulse interval pulses approached low-rate sensitivity for some tonotopic separations. Despite lower sensitivity overall, high-rate pitch cues seemed to be integrated (i.e., improved) more across the two electrodes than low-rate pitch cues when compared to single-electrode stimulation. These results suggest that short inter-pulse interval pulses are beneficial for temporal-pitch sensitivity in dual-electrode configurations.
Keywords
Introduction
Pitch is the perceptual correlate of acoustic waveform periodicity and a ubiquitous part of everyday life. In normal hearing, pitch may be conveyed both via the tonotopic place of stimulation (i.e., the place code) and by means of phase-locked periodic auditory-nerve activity at a given place of stimulation (i.e., the temporal code). For a review, see, for example, Oxenham (2018). Even in basic tasks such as pure-tone frequency discrimination, normal-hearing listeners can discriminate tones differing in frequency by less than 1% (e.g., Dai & Micheyl, 2011).
Yet, pitch perception is rather different in cochlear-implant (CI) listeners. CIs are auditory prostheses originally designed to provide speech understanding in the profoundly deaf or hearing-impaired (see, e.g., Wilson & Dorman, 2008; Zeng, 2022). In frequency or rate discrimination, respectively, CI listeners perform much worse than their normal-hearing counterparts with just-noticeable differences around 6%, even when stimulating in a highly controlled manner with research interfaces instead of clinical processors and at a single intracochlear electrode only (e.g., Moore & Carlyon, 2005). The discrepancy between normal-hearing and single-electrode CI sensitivity is thought to be a result of poor place-pitch (i.e., spectral) sensitivity and CI listeners relying largely on temporal pitch cues similar to those derived from unresolved harmonics in normal hearing (Carlyon & Deeks, 2002; Carlyon et al., 2002; McKay & Carlyon, 1999; van Wieringen et al., 2003).
With CIs, pitch sensitivity is highest when stimulating at a single electrode only. The decrease in pitch sensitivity when stimulating with multiple electrodes is thought to be due to interactions between CI electrodes in the cochlea and remains incompletely understood to date. Early stimulation paradigms employed continuous electrical stimuli. With more than one stimulating electrode, these stimuli produced interactions of electric fields due to the broad spread of electric current in the cochlea (Boëx et al., 2003; de Balthasar et al., 2003; Eddington et al., 1978; Favre & Pelizzone, 1993), which severely limited spectral sensitivity. The switch from continuous to pulsatile stimulation avoided electric-field interactions. However, unwanted pulse interactions between electrodes still occur at the neural level (e.g., de Balthasar et al., 2003), degrading the highly precise neural response to single electric pulses (e.g., Hartmann et al., 1984; Van Den Honert & Stypulkowski, 1987) due to temporal effects such as refractoriness or facilitation (for a review, see Boulet et al., 2016). Such interactions are commonly referred to as channel interactions. The size and shape of channel interactions crucially depend on both the per-electrode pulse rate(s) and the distribution of pulses (or pulse rates) across electrodes. In particular, the amount of channel interactions should increase with increasing pulse rate and be high for groups of adjacent electrodes with high rates. Yet even most of today's clinically used CI stimulation paradigms employ rather high pulse rates to sufficiently sample the temporal envelope of speech (e.g., Arora et al., 2009; Friesen et al., 2005; Loizou et al., 2000), which has been shown to convey most of the relevant speech information (cf. Smith et al., 2002; but see Zeng et al., 2004). Figure 1A (left column) shows a schematic single-electrode version of an amplitude-modulated high-rate pulse train, resembling those produced by commonly used clinical CI stimulation strategies such as continuous interleaved sampling (Wilson et al., 1991).

Stimuli used in the experiment. Left column: Single-electrode stimuli (cf. Lindenbeck et al., 2020). Right column: Dual-electrode stimuli with the mTEA between the basal (solid line) and the apical (dashed line) electrode.
We developed an approach to improve temporal-cue sensitivity at high pulse rates by inserting extra pulses with short inter-pulse intervals (SIPI pulses) into high-rate pulse trains (cf. Figure 1B, left column). For the perception of interaural time differences (ITDs), discrimination performance with unmodulated 1,000-pps pulse trains and SIPI pulses inserted at a (SIPI) rate of 100 pps (i.e., after every tenth pulse) was similar to that with unmodulated 100-pps pulse trains (Srinivasan et al., 2018). The latter stimuli will be referred to as low-rate stimuli (cf. Figure 1C, left column). SIPI pulses also enhanced ITD sensitivity for 1,000-pps pulse trains with a low-rate amplitude modulation (AM; Srinivasan et al., 2020). Using unanesthetized rabbits, Buechel et al. (2018) linked the SIPI effect to neural facilitation. With respect to temporal pitch, Lindenbeck et al. (2020) showed SIPI sensitivity to be at par with low-rate sensitivity when AM and SIPI rates were consistent and at 125 and 250 Hz, irrespective of AM depth. Furthermore, for scenarios in which SIPI and AM rates were inconsistent (i.e., the SIPI rate was an integer sub-multiple of the AM rate, as in Srinivasan et al., 2020), Lindenbeck et al. (2023) showed that the SIPIs provide the dominant pitch cue as compared to the AM.
This study aimed to quantify the perceptual effects of interactions between two stimulating electrodes. Such interactions may occur, for example, when multiple voices with similar F0s are conveyed simultaneously by a CI processor or, even for a single voice, when different group delays of the processor bandpass filterbank are not compensated for. We investigated monaural temporal-pitch discrimination with one centrally fixed electrode (referred to as C1) and a second electrode varying across the array (referred to as C2, cf. Figure 2A) for high-rate pulse trains with and without SIPI pulses (referred to as SIPI and AM-only stimuli, respectively). Data for low-rate stimuli from Lindenbeck et al. (2024) are included as a “best-case” reference. We systematically manipulated monaural temporal electrode asynchrony (mTEA; cf. Lindenbeck et al., 2024) as a proportion of the pulse, AM, or SIPI period, respectively, and varied the tonotopic separation between C1 and C2. Large separations were selected based on forward-masked spatial tuning curves (Nelson et al., 2008, 2011). To disentangle dual-electrode interactions from baseline (i.e., single-electrode) sensitivity, we also measured single-electrode discrimination sensitivity for all stimulus types at all C1 and C2 electrodes. With this setup, we tested the following hypotheses:
H1: For small tonotopic separations (exciting overlapping auditory-nerve fiber populations), discrimination sensitivity worsens with increasing mTEA towards 50% of the pulse/AM period and then improves again towards the end of the period (i.e., u/v-shaped function of mTEA; cf. Lindenbeck et al., 2024). H2: For large tonotopic separations (exciting largely distinct fiber populations), sensitivity is unaffected by the mTEA. H3: The mTEA effect is larger for high-rate as compared to low-rate stimulation (due to their higher pulse rates and, hence, higher susceptibility to channel interactions).

Methods
Listeners
Five CI listeners (four females) participated in the experiments; see Table 1 for more details. All listeners were postlingually deafened and used 12-electrode implants manufactured by MED-EL GmbH (Innsbruck, Austria) with electrode spacings of either 2.1 or 2.4 mm. The bilateral CI listeners (i.e., CI24, CI114, and CI119) were asked to use their preferred ear. CI116 was a bimodal listener and CI118 was a listener with single-sided deafness. We tested only listeners having experience in CI testing in our lab and having at least 10 activated electrodes in their clinical fittings. All listeners were volunteers and were paid an hourly wage for their participation.
Details on the CI Listeners.

Note. All listeners used 12-electrode MED-EL CIs. If the onset of deafness could not be attributed to a specific date (e.g., in case of progressive hearing loss), “age at onset of deafness” may also refer to the onset of profound hearing loss. CI = cochlear implant.
In the experiments, we followed the European Charter of Fundamental Rights, worked along the guidelines of “Good Scientific Practice,” and fulfilled the ethical principles for research involving human subjects (Helsinki declaration). The research protocol was one of the ethics-approved standard protocols for CI research at the Acoustics Research Institute laboratory. All subjects were adults capable of giving informed consent in writing before the experiment. They were adequately informed of the aims, methods, sources of funding, possible conflicts of interest, institutional affiliations of the researchers, the anticipated benefits and potential risks and discomfort it may entail, poststudy support, and any other relevant aspects. They were informed of the right to refuse their participation or to withdraw consent to participate at any time without reprisal. When collecting data, we headed for proportionality and avoided collecting more data than necessary. Confidentiality of collected personal data was maintained by anonymization.
Stimuli and Apparatus
Figure 1 shows monophasic versions of the three types of biphasic stimuli used in the experiments. We used the parameter F0 to define across stimulus types the rate at which usable temporal-pitch information is conveyed. For high-rate stimuli, the F0 corresponded to the AM rate. For SIPI stimuli, the F0 furthermore corresponded to the SIPI rate (i.e., full-rate SIPIs; cf. Lindenbeck et al., 2020, 2023), and a SIPI pulse was always inserted 60 µs after and with the same amplitude as the preceding regular carrier pulse. For low-rate stimuli, the F0 corresponded to the pulse rate. The geometric mean (i.e., nominal) F0 was 100 Hz. For high-rate stimuli, the modulation shape was a full-wave rectified sinusoid, and the AM rate after rectification corresponded to the F0. The AM was applied proportionally to the dynamic range (DR), that is, the range between absolute threshold (THR) and maximum comfortable level (MCL, cf. top left panel). To ensure quantization of the AM peaks, F0s were integer sub-multiples of the 1,000-pps carrier pulse rate used for high-rate stimuli (cf. Lindenbeck et al., 2020; Srinivasan et al., 2020). This approach should have prevented beat-frequency distortion (cf. Goldsworthy et al., 2022) and, hence, maximized temporal-pitch sensitivity. The modulation depth was 0.3 to simulate the average depth occurring in clinical CI processors (see Srinivasan et al., 2020).
The dual-electrode stimuli (right column of Figure 1) were constructed by presenting the same pulse train at C1 and one of the four C2 electrodes. To introduce the mTEA, the more-apical stimulus was delayed by up to one AM or pulse period, that is, between 0% and 100%. Six mTEAs were selected: 3.96% (≈ 4%), 31.87% (≈ 32%), 47.82% (≈ 48%), 52.18 (≈ 52%), 68.13 (≈ 68%), and 96.04% (≈ 96%). These delays were symmetric around 50% and realizable for all stimulus types while avoiding simultaneous stimulation. Figure 2A shows the four dual-electrode conditions, that is, the four C1-C2 combinations (referred to as CCCs), which are named according to the relative position of C2 (i.e., large-apical [LA, data shown in Figure 2E], small-apical [SA, data shown in Figure 2C], small-basal [SB, data shown in Figure 2D], and large-basal [LB, data shown in Figure 2F]). In addition to these four CCCs, a fifth “pseudo-dual” electrode condition (called Z for “zero,” in blue, data shown in Figure 2B) was tested in which both C1 and C2 pulse trains were presented at the C1 electrode, simulating a tonotopic separation of zero (i.e., maximum interaction, cf. McKay & McDermott, 1996). The two largest CCCs LA and LB were selected in pretests based on spatial tuning curves (see Section “Forward-Masked Spatial Tuning Curves and C2-Electrode Selection”).
All stimuli were nominally 500 ms long, including linear 100-ms onset and offset ramps. The pulse duration (including both phases) was 55 µs; phase duration and inter-phase gap depended on the implant type (i.e., 0 µs for C40+ and 2.1 µs for Pulsar/Synchrony/Synchrony 2). The stimuli were generated on a personal computer and were sent directly to the implants via the Research Interface Box II (Institute of Ion Physics and Applied Physics, Leopold-Franzens-University, Innsbruck, Austria).
To avoid loudness confounds on F0 discrimination (e.g., Arnoldner et al., 2008; Vandali et al., 2013), all stimuli used for F0 discrimination were loudness-balanced using the method of adjustment (for more details, see Lindenbeck et al., 2024).
Electrode and Frequency-Difference Selection Pretests
We conducted a sequence of pretests to find, per CI listener, a suitable set of C1 and C2 electrodes as well as a single F0 difference (FD) used in all conditions of the main experiment. The protocol was largely similar to that in Lindenbeck et al. (2024). Listeners were allowed to take breaks at any time.
Electrode Fitting and C1-Electrode Selection
First, we fitted all electrodes for low-rate pulse trains by determining THR, MCL (cf. Figure 1), and comfortable level with unmodulated 500-ms 100-pps pulse trains without ramps using an informal adjustment procedure. Based on the fitting, we excluded electrodes inducing uncomfortable sensations and/or having an unexpectedly small DR as compared to the surrounding electrodes.
To obtain as many C2 candidate electrodes as possible, we aimed for a C1 electrode in the center of the 12-electrode array (cf. Figure 2A); that is, Electrode 6 was selected for all listeners.
Forward-Masked Spatial Tuning Curves and C2-Electrode Selection
Figure 2A shows the C2 electrode configurations. We aimed at selecting two types of C2 electrodes: C2s with a small tonotopic separation from C1 to induce maximum channel interactions and C2s with a large tonotopic separation from C1 to induce as little channel interactions as possible. As a marker of channel-interaction potential (i.e., across-electrode masking), we measured listener-specific forward-masked spatial tuning curves using the paradigm described in Nelson et al. (2008, 2011) and previously used in Lindenbeck et al. (2024).
Before measuring the tuning curves, we fitted all ears for the tuning-curve stimuli using the same procedure as in Section “Electrode Fitting and C1-Electrode Selection.” For the masker stimuli, we used unmodulated 160-ms 1,000-pps pulse trains without ramps on all available electrodes. For the target stimulus, we used unmodulated 10-ms 1,000-pps pulse trains without ramps on the target electrode only.
The tuning curves were measured in a three-interval, three-alternative, forced-choice (3I-3AFC) task. The listeners had to hear out the target that was played randomly in one of the three intervals 10 ms (CI24: 15 ms) after the offset of the masker that was played in all three intervals. Similar to Nelson et al. (2008), the target was presented at the target electrode with a level of 17.0 ± 5.7% (range = 10–25%) of the target DR. The target level was individually adjusted to avoid floor and ceiling effects due to task difficulty. The target levels should not have had an effect on the tuning-curve shapes (Nelson et al., 2008). Per masker electrode, the masker level was varied and masking thresholds were determined in an adaptive 2-up 1-down staircase procedure (Leek, 2001; Levitt, 1971) converging at 71% correct target identification. A masking threshold was calculated as the average of three staircase thresholds. The measured tuning curves are summarized in Figures S1 and S2 in the supplemental materials.
After having measured the tuning curves, the small-separation C2 electrode pair candidates (one or two neighboring electrodes of C1 on either side) were evaluated for sufficient masking on both ears by comparing the threshold to the on-channel threshold for the target/C1 electrode. For all listeners, the direct neighbors of C1 were selected (cf. Table 2).
Setup of the Main Experiment as Determined in the Pretests.

Per cochlear-implant (CI) listener: The C1 and four C2 electrodes defining the CCCs: large-apical (LA), small-apical (SA), zero (Z), small-basal (SB), and large-basal (LB), and the corresponding FDs. Statistics for electrode number (El. #) and distance (in millimeter) from the C1 electrode (defining the Z CCC). Electrodes are numbered from apex to base.
The large-separation C2 electrode pairs were selected based on two criteria. The first criterion was the presence of nearly no masking of C1, as indicated by diverging tuning-curve staircases or, at least, the largest masked thresholds on the respective side of C1. The second criterion was the tonotopic separation from C1: We estimated the extent of channel interactions by selecting the closest possible nonmasking C2. Table 2 summarizes the finally selected large-separation C2 electrodes. On average, large-separation C2s were separated from C1 by about 7 mm on the basal side and about 9 mm on the apical side.
After having selected the C2 electrodes, we fitted the C1 and C2 electrodes for SIPI and AM-only stimuli with unmodulated 500-ms 1,000-pps pulse trains without ramps using the same procedure as described in Section “Electrode Fitting and C1-Electrode Selection.”
Main Experiment: Listener-Specific Frequency Difference
To maximize the number of mTEA and CCC conditions in the main experiment, and to minimize floor and ceiling effects, the discrimination task was conducted with only one FD that was determined individually for each CI listener (e.g., Ihlefeld et al., 2015; Kong et al., 2009). Due to the quantization of the AM peak for high-rate stimuli, only a limited set of F0s was available and, hence, only a limited set of F0 pairs could be constituted. As each F0 pair has an associated FD, we predefined a set of FDs between 10% and 100% whose F0s were geometrically arranged around the nominal F0 of 100 Hz (cf. Kreft et al., 2010; Lindenbeck et al., 2020) and which were testable for all CI listeners.
To select suitable listener-specific FDs for the main experiment from this global set of possible FDs, an F0-discrimination sensitivity pretest was conducted using low-rate stimuli. We used a two-interval, two-alternative, forced-choice (2I-2AFC) task and the method of constant stimuli. The two stimuli in a trial were separated from each other by 400 ms. Per FD, both possible orders of F0s (low-high and high-low, respectively) were tested 25 times each but in randomized order. The loudness-balanced amplitudes were roved by 3% of the DR independently per interval. The listeners indicated whether the stimulus in the second interval had a higher or lower pitch than the stimulus in the first interval. Response feedback was provided after each trial. The collected percent-correct scores were converted to d′ scores, accounting for bias towards one order of F0s (Klein, 2001). Per listener, the FD yielding the most homogeneous sensitivity across target and flanker electrodes (d′ ≥ 1) while minimizing ceiling effects was selected. Single-electrode low-rate pitch sensitivity in the pretests was quite homogeneous across listeners. Hence, only two FDs were selected (see Table 2): 10% (91 Hz vs. 100 Hz) and 22% (91 Hz vs. 111 Hz).
In the main experiment, the F0-discrimination task and the listener instructions were identical to those used in the pretest. In dual-electrode conditions, level roving was applied similarly on both electrodes. The stimulus types were tested in blocks with the order balanced across listeners. Per stimulus type, to keep place cues constant within a block, the CCCs were tested block-wise. The CCC block order was balanced across listeners but different for each individual listener to (pseudo-)randomize block-order effects. Within each CCC block, the order of mTEAs was randomized. To disentangle interaction effects arising from dual-electrode stimulation from electrode-specific baseline sensitivity, single-electrode conditions corresponding to C1 and C2 of all dual-electrode conditions were measured before dual-electrode conditions within each CCC block. Finally, the entire stimulus type setup described above (i.e., both single- and dual-electrode conditions) was tested twice, each time with 50 repetitions per condition, resulting in 10,500 trials in total per listener.
Statistical Analysis
The aim of our statistical analysis was to dissociate both the presence and absence of an effect from measurement noise. That is, we aimed to collect evidence for both the null hypothesis (effect absent, cf. H2) and the alternative hypothesis (effect present, cf. H1 and H3). However, commonly used null-hypothesis significance testing (NHST) based on p-values only insufficiently tests the null hypothesis and has been extensively criticized (Amrhein et al., 2019; Cohen, 1994; Rouder et al., 2016). Thus, to collect null-hypothesis evidence but still retain a fixed Type I error rate and provide estimates of statistical power, we report our statistical results as Bayes-NHST hybrids (cf. Dienes & Mclatchie, 2018; Keysers et al., 2020). Bayesian and NHST results are reported together. For more details regarding this approach, see Lindenbeck et al. (2024).
Bayesian Hypothesis Testing
We used repeated-measures analyses of variance (rmANOVAs) for statistical analysis. In the Bayesian implementation (Keysers et al., 2020; cf. van den Bergh et al., 2020), the Bayes factor (BF; e.g., Kass & Raftery, 1995) is used to distinguish between relative “evidence of presence” (i.e., diagnostic data supporting the alternative hypothesis over the null hypothesis), “evidence of absence” (i.e., diagnostic data supporting the null hypothesis over the alternative hypothesis), and “absence of evidence” (i.e., nondiagnostic data that support neither hypothesis). We considered BFs > 3 as evidence of presence and used the inverse threshold (i.e., BF < 0.33) to establish evidence of absence. BFs between 0.33 and 3 were considered inconclusive (“absence of evidence”).
Bayesian statistical analyses were conducted with JASP 0.17.3 (JASP Team, 2023). In particular, we used Bayesian rmANOVAs (Rouder et al., 2012, 2016, 2017; van den Bergh et al., 2020, 2023; Wetzels et al., 2012) in the default JASP prior configuration. The output is the so-called BFincl that quantifies evidence for including an effect in the rmANOVA model over excluding it.
NHST and Confidence Intervals
To provide effect size estimates and well-known Type I error control, we conducted NHST rmANOVAs using MATLAB® R2022b (Mathworks, Inc.). The significance level was always 5%. To prevent inflation of Type I errors, we used the Huynh-Feldt correction (Huynh & Feldt, 1970) of p-values and F-test degrees of freedom (cf. Oberfeld & Franke, 2013).
As an effect-size metric, we used the generalized η2 (ηG2) (Bakeman, 2005; Lakens, 2013; Olejnik & Algina, 2003). It is comparable across within and between-subjects designs and classifies effect sizes as either small (ηG2 ≥ .02), medium ηG2 ≥ .13), or large (ηG2 ≥ .26) (Bakeman, 2005). The so-called exact analytical 90% “within-subjects” confidence intervals (i.e., the 5% to 95% range of ηG2, the F-test is one-sided) are reported in brackets. The confidence interval of a statistically significant effect excludes zero.
In case the assumptions required for NHST rmANOVAs (particularly, sphericity) were violated, the F-statistic and p-value reported are from an rmANOVA on aligned transformed ranks (ART-rmANOVA; Wobbrock et al., 2011), which is a nonparametric alternative for factorial NHST rmANOVAs. Note that Bayesian rmANOVAs do not require sphericity (e.g., Rouder et al., 2012). The ART-rmANOVA was performed in R 4.3.3 (R Core Team, 2024) using the ARTool package (Kay et al., 2021).
Results
In the following, we first analyze the single-electrode scores to establish baseline temporal-pitch sensitivity. We then move on to analyze the dual-electrode scores jointly for all stimulus types and finish the analysis with an examination of differences between stimulus types. In all analyses, the low-rate data are the same as those in Lindenbeck et al. (2024) and are here used to compare high-rate sensitivity to the currently assumed maximum possible temporal-pitch sensitivity.
Single-Electrode Stimulation
In Figure 2B–F, single-electrode listener-averaged d′ scores for the C2 electrode are denoted with an “S” on the abscissa of each panel. Markers distinguish stimulus types. The apex-to-base order of electrodes is LA-SA-Z-SB-LB (cf. Figure 2A). Figures S3 to S5 in the supplemental materials provide individual scores.
A two-way rmANOVA with factors Stimulus (AM-only, SIPI, and low-rate) and Electrode (LA, SA, Z, SB, and LB) revealed evidence for a large effect of Stimulus, ART-rmANOVA: BFincl = 3.22, F(2.0, 8.0) = 6.04, p = .025, ηG2 = .35 [.03, .55]. The effect of Electrode, BFincl = 0.69, F(2.8, 11.0) = 1.51, p = .266, ηG2 = .09 [.00, .20], as well as the interaction between Type and Electrode, was inconclusive, BFincl = 2.10, F(8.0, 32.0) = 2.52, p = .030, ηG2 = .06 [.01, .09]. Post hoc pairwise comparisons on aligned transformed ranks revealed significantly better low-rate compared to AM-only sensitivity (p = .026; other two comparisons p > .159; Bonferroni-Holm corrected).
Dual-Electrode Stimulation
Overview
Figure 2B–F shows the dual-electrode d′ scores as a function of mTEA, with separate panels for each CCC. For each CCC, markers distinguish stimulus types. Figures S3 to S5 in the supplemental materials provide individual scores.
First, a clear effect of the mTEA can be observed that is symmetric around 50%. Broadly speaking, low and high mTEAs (corresponding to minimal lead/lag of the apical compared to the basal electrode) show better temporal-pitch sensitivity than intermediate mTEAs (corresponding to a lead/lag of half the pulse or AM period, respectively). The mTEA effect further seemed to be moderated by the C2 electrode involved (i.e., the CCC). It reduced sensitivity mostly in conditions with no tonotopic separation (i.e., condition Z), a little less in conditions with a small tonotopic separation (i.e., conditions SA and SB), and hardly (or even showing slight increases) in conditions with a large tonotopic separation (i.e., conditions LA and LB). Second, the stimulus type seemed to have an overall effect like that found for single-electrode stimulation, possibly differing somewhat between CCCs.
To jointly assess the effects of all three experimental parameters, we conducted a three-way rmANOVA with the factors mTEA (4%, 32%, 48%, 52%, 68%, and 96%), CCC (LA, SA, Z, SB, and LB), and Stimulus (AM-only, SIPI, and low-rate). We found evidence for a small interaction between mTEA and CCC, BFincl = 126,346.17, F(4.9, 19.7) = 5.30, p = .003, ηG2 = .07 [.02, .10], as well as evidence for the absence of an interaction between mTEA and Stimulus, BFincl = 0.09, F(5.1, 20.4) = 1.59, p = .207, ηG2 = .01 [.00, .02]. The other interactions were inconclusive (see Table S1 in the supplemental materials). Furthermore, we found evidence for a small effect of mTEA, BFincl = 13.12, F(2.5, 10.1) = 5.80, p = .017, ηG2 = .06 [.01, .10], and a medium effect of CCC, BFincl = 42.16, F(3.4, 13.4) = 7.96, p = .002, ηG2 = .16 [.06, .24]. The evidence for a Stimulus effect was inconclusive (see Table S1 in the supplemental materials).
To further assess the interaction between mTEA and CCC, we investigated the mTEA effect separately for different tonotopic separations.
Large Tonotopic Separation
For the CCC's LA and LB, we hypothesized the absence of an mTEA effect (cf. H2). To this end, we conducted an rmANOVA with the effects mTEA and Stimulus as specified above as well as the effect of CCC (LA and LB only). The mTEA effect depended neither on CCC (evidence of absence for the mTEA × CCC interaction), BFincl = 0.08, F(2.7, 10.8) = 0.28, p = .819, ηG2 = .00 [.00, .00], nor Stimulus (evidence of absence for the mTEA × Stimulus interaction), BFincl = 0.16, F(4.7, 18.9) = 1.49, p = .243, ηG2 = .01 [.00, .02]. In fact, the mTEA effect was absent altogether, BFincl = 0.07, F(5.0, 20.0) = 0.75, p = .596, ηG2 = .00 [.00, .01]. All other main effects and interactions were inconclusive (see Table S2 in the supplemental materials).
In the right panel of Figure 3, the (absent) mTEA effects are visualized separately per CCC and based on simple-effects rmANOVAs with the factors mTEA and Stimulus (because the main effect of Stimulus and many interactions including it were inconclusive, see Table S2 in the supplemental materials). Table S3 in the supplemental materials summarizes their results.

Effect-size estimates ηG2 with 90% confidence intervals for the three tonotopic separations (panels) and corresponding CCCs (abscissa, cf. Figure 2A). The dashed line indicates an ηG2 of zero; effects whose confidence intervals do not touch this line are significant with p < .05. Dotted lines indicate threshold ηG2 for small, medium, and large effects, respectively. Bayes factors (BFs) in the gray ribbon indicate evidence for the presence of an mTEA effect (BF > 3) re evidence of its absence (BF < 0.33; cf. Section “Statistical Analysis”). CCCs = C1-C2 combinations; BF = Bayes factor; mTEA = monaural temporal electrode asynchrony.
Zero and Small Tonotopic Separations
For the CCC's Z, SA, and SB, we hypothesized the presence of an mTEA effect (cf. H1). To this end, we conducted an rmANOVA with the effects mTEA and Stimulus as specified above, as well as the effect of CCC (Z, SA, and SB only). The mTEA effect still depended on the CCC, BFincl = 7.84, F(10.0, 40.0) = 4.26, p < .001, ηG2 = .04 [.02, .05], and there was evidence for medium effects of mTEA, BFincl = 69.15, F(1.8, 7.3) = 7.31, p = .019, ηG2 = .17 [.04, .29], and CCC, BFincl = 4.87, F(1.3, 5.3) = 7.55, p = .034, ηG2 = .12 [.02, .23]. All other effects were inconclusive (see Table S4 in the supplemental materials).
To further assess this, we conducted simple-effects rmANOVAs separately per CCC with the factors mTEA and Stimulus. The mTEA effects across Stimuli (i.e., main effects of mTEA) are visualized in the left and middle panels of Figure 3 and summarized in Table S3 in the supplemental materials. An mTEA effect is present for all CCCs, however, larger for the Z and SA CCCs than for the SB CCC. Furthermore, for the SB CCC, the mTEA effect differed between Stimuli, ART-rmANOVA: BFincl = 5.08, F(10.0, 40.0) = 2.18, p = .040, ηG2 = .06 [.00, .09]. For the other two CCCs, the effect of Stimulus on the mTEA effect was inconclusive, yet, close to being absent, Z: BFincl = 0.35, F(9.9, 39.7) = 1.11, p = .379, ηG2 = .06 [.00, .07]; SA: BFincl = 0.38, F(10.0, 40.0) = 1.38, p = .226, ηG2 = .03 [.00, .04]. Note that the BF is a continuous measure of evidence (as opposed to p-values). For the SB CCC, only low-rate stimuli, ART-rmANOVA: BFincl = 3.66, F(5.0, 20.0) = 4.12, p = .010, ηG2 = .21 [.01, .35], and AM-only stimuli, BFincl = 7.40, F(2.8, 11.3) = 4.30, p = .032, ηG2 = .30 [.04, .44], showed an mTEA effect. For SIPI stimuli, it was absent, BFincl = 0.27, F(3.2, 13.0) = 0.74, p = .555, ηG2 = .01 [.00, .02].
Differences Between High-Rate and Low-Rate Stimulation
To better understand the differences between high-rate and low-rate stimulation, this section focuses on differences in d′ scores between high-rate and low-rate stimuli. First, we analyzed raw d′ scores to determine the effectiveness of dual-electrode high-rate stimulation as compared to low-rate stimulation at face value. Second, we converted the raw scores to Δd′ scores expressing the dual-electrode scores relative to predicted optimal integration of information across electrodes while considering the reduction in per-electrode amplitudes to match the loudness of single- and dual-electrode scores (for details, see Lindenbeck et al., 2024). In doing so, we aimed to investigate whether, for a given high-rate stimulus type, switching from single- to dual-electrode stimulation was beneficial for the overall sensitivity as compared to the low-rate reference case.
Absolute Differences
Figure 4 shows the differences between high-rate and low-rate stimulation in terms of raw (unprocessed) dual-electrode d′ scores separately per CCC. For d′ score differences considering AM-only stimuli (Panel A), we conducted a two-way rmANOVA with the factors mTEA (4%, 32%, 48%, 52%, 68%, and 96%) and CCC (LA, SA, Z, SB, and LB). We found evidence for the absence of an interaction between mTEA and CCC, BFincl = 0.03, F(8.8, 35.0) = 0.38, p = .936, ηG2 = .02 [.00, .02], and for an absence of a main effect of mTEA, BFincl = 0.14, F(3.0, 11.9) = 1.04, p = .412, ηG2 = .02 [.00, .04], again confirming similar mTEA effects for AM-only and low-rate stimuli. However, the main effect of CCC was inconclusive, BFincl = 0.64, F(4.0, 16.0) = 1.26, p = .326, ηG2 = .10 [.00, .19]. Despite the inconclusive CCC effect, Figure 4A clearly shows that dual-electrode AM-only sensitivity was worse than dual-electrode low-rate sensitivity (i.e., d′ differences are negative) for all CCCs.
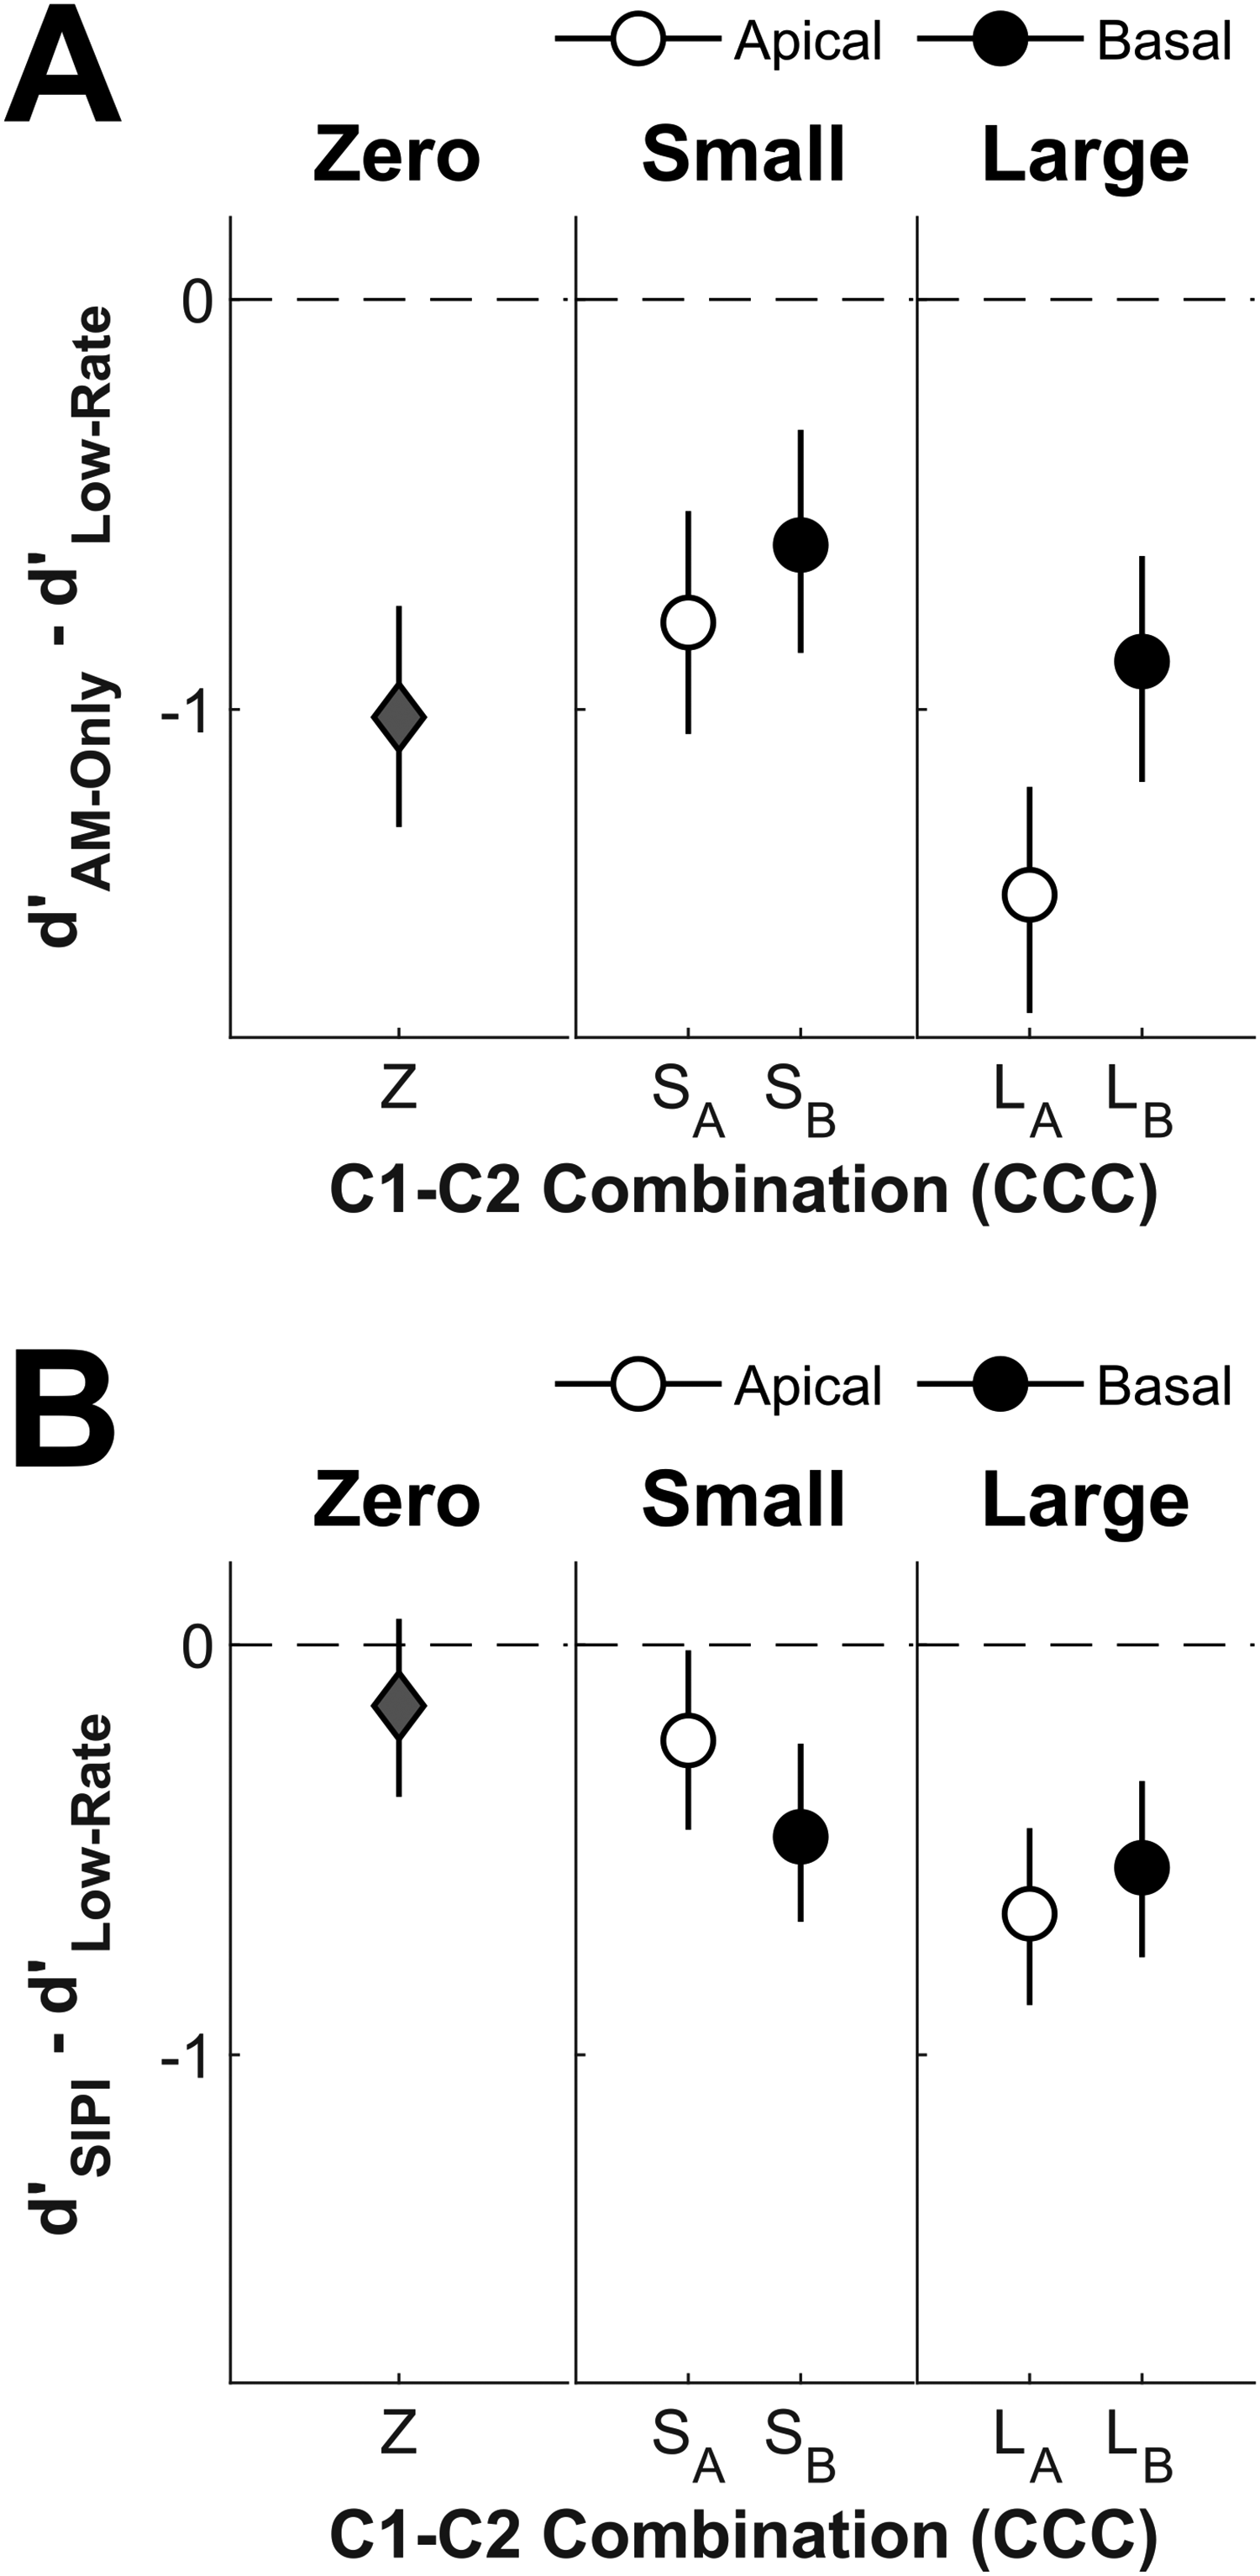
Differences in dual-electrode d′ scores between either AM-only (Panel A) or SIPI (Panel B) and low-rate stimuli for all five CCCs in different panels per tonotopic separations. Error bars show 95% credible intervals derived from the posterior distributions of a Bayesian regression model incorporating the effects of mTEA and CCC with listener modeled as a random intercept. AM = amplitude modulation; SIPI = short inter-pulse interval; CCCs = C1-C2 combinations; mTEA = monaural temporal electrode asynchrony.
For d′ score differences considering SIPI stimuli (Panel B), a similar two-way rmANOVA revealed evidence for a small interaction between mTEA and CCC, BFincl = 40.38, F(11.8, 43.1) = 2.45, p = .018, ηG2 = .05 [.01, .06], for an absence of a main effect of mTEA, BFincl = 0.33, F(3.4, 13.6) = 2.33, p = .116, ηG2 = .02 [.00, .04], and inconclusive evidence for the main effect of CCC, BFincl = 0.42, F(3.2, 13.0) = 0.86, p = .492, ηG2 = .04 [.00, .09]. Separate two-way ANOVAs for symmetric mTEAs of 4/96, 32/68, and 48/52% revealed evidence for a small interaction between mTEA and CCC only for the 4/96% mTEAs, BFincl = 6.04, F(4.0, 16.0) = 4.37, p = .014, ηG2 = .02 [.01, .04]. For these mTEAs, 4% yielded higher SIPI sensitivity than 96% for the LA (p = .015) and the Z (p = .032) CCCs. Still, across mTEAs, Figure 4B shows that SIPI sensitivity approached low-rate sensitivity for Z and SA CCCs while it remained slightly worse for the other three CCCs.
Sensitivity Changes Related to Dual-Electrode Versus Single-Electrode Stimulation
Second, we conducted the same analysis with Δd′ scores. In Lindenbeck et al. (2024), these scores were used to remove baseline (single-electrode) differences between low-rate ITD and temporal-pitch discrimination sensitivity. Δd′ expresses the raw d′ dual-electrode scores as the difference to the Pythagorean sum of the CCC's single-electrode d′ scores multiplied by
For low-rate stimulation, Δd′ was never positive, indicating that for these stimuli, pitch cues were never constructively integrated (cf. Figure 6 in Lindenbeck et al., 2024). Since we showed above that the mTEA effects were similar for all stimuli, differences in Δd′ between AM-only/SIPI and low-rate stimulation can be interpreted in terms of differences in the extent of integration of pitch cues across the two electrodes. Since the Δd′ transformation did not change any of the mTEA-associated effects reported in the previous section, below we focus on the effects of CCC.
Figure 5 shows the differences in Δd′ between AM-only (Panel A) or SIPI (Panel B) and low-rate stimulation. For Δd′ scores considering AM-only stimuli, a two-way rmANOVA with the factors mTEA (4%, 32%, 48%, 52%, 68%, and 96%) and CCC (LA, SA, Z, SB, and LB) revealed inconsistent evidence for the CCC, BFincl = 0.65, F(4.0, 16.0) = 1.25, p = .330, ηG2 = .11 [.00, .21]. However, for Δd′ scores considering SIPI stimuli, a similar two-way rmANOVA revealed evidence for an effect of CCC, ART-rmANOVA: BFincl = 3.16, F(4.0, 16.0) = 2.62, p = .074, ηG2 = .24 [.00, .36], although the p-value just failed to reach significance. Still, the differences in Δd′ shown in Figure 5 suggest that information was integrated across electrodes more for both AM-only and SIPI stimuli as compared to low-rate stimuli (i.e., the differences were mostly positive). For AM-only stimuli, this tended to be the case for mid-basal to basal CCCs, while for SIPI stimuli, this tended to be the case mostly for mid-apical CCCs. Notably, for both high-rate stimulus types, there was no integration of information for the most apical LA CCC.

Differences in dual-electrode Δd′ scores (cf. Lindenbeck et al., 2024) between either AM-only (Panel A) or SIPI (Panel B) and low-rate stimuli. All other aspects as in Figure 4. AM = amplitude modulation; SIPI = short inter-pulse interval.
For completeness, we also conducted this analysis with Δd′ calculated not as the difference to the (loudness-balanced) optimal integration across electrodes but simply as the difference to the better of the two electrodes. The results are almost identical and are reported in Figure S6 in the supplemental materials and Tables S5 (AM-only) and S6 (SIPI) in the supplemental materials.
Discussion
Effect of the mTEA
We hypothesized that the mTEA influences temporal-pitch sensitivity for small tonotopic electrode separations with at least partly overlapping neural populations (i.e., conditions Z, SA, and SB, cf. H1). Based on the spatial tuning curve measurements, we also identified C2 electrodes that did not (or at least only to a small amount) mask the C1 electrode (i.e., conditions LA and LB, cf. H2). The size of mTEA effects was hypothesized to depend on the stimulus type, and high-rate stimuli were predicted to yield larger mTEA effects than low-rate stimuli (cf. H3).
Consistent with the spatial-separation hypotheses, we found large mTEA effects for all zero- and small-separation conditions and the absence of mTEA effects for large-separation conditions. However, mTEA effects were largely similar between high-rate (AM-only/SIPI) and low-rate stimulation, except for the SB condition in which SIPI stimuli showed no mTEA effect. This indicates that the mTEA effect does not simply depend on the pulse number or density, respectively.
Several previous studies have investigated mTEA effects with loudness-balanced stimuli for a subset of our experimental conditions and employed either monaural temporal pitch (e.g., Griessner et al., 2021; Lindenbeck et al., 2024; Macherey & Carlyon, 2010; McKay & McDermott, 1996) and/or ITD perception (e.g., Egger et al., 2016; Francart et al., 2015; Lindenbeck et al., 2024). With dual-electrode AM-only stimuli and several mTEAs, McKay and McDermott (1996) showed that CI listeners perceive the aggregate pulse pattern for separations of 3 mm and less in both an oddball discrimination task and an estimation task. Also for AM-only stimuli but with triple-electrode stimulation, Francart et al. (2015) found a detrimental mTEA effect for a 0.75-mm separation. Both AM-only studies are consistent with the results we found for AM-only stimuli, showing detrimental mTEA effects for tonotopic separations of about 3 mm or less and furthermore for both temporal-pitch and ITD perception.
With dual-electrode low-rate stimuli and using a ranking task, both Macherey and Carlyon (2010) and Griessner et al. (2021) found little to no mTEA effect on the pitch rank for tonotopic separations of 0.75–1.1 mm and 2.1 mm, respectively, and for stimulation in mid-apical regions of the cochlea. Yet, using dual-electrode low-rate stimuli and a discrimination task, both Egger et al. (2016) and Lindenbeck et al. (2024) found detrimental mTEA effects for tonotopic separations less than 6 and 3 mm, respectively, and when the mid-basal portion of the cochlea was stimulated. In particular, Lindenbeck et al. (2024) tested a largely different CI listener cohort but with a matched experimental setup to the present study. They directly compared ITD and temporal-pitch sensitivity and showed that, at least for low-rate stimuli, the mTEA effect did not differ between temporal-pitch and ITD perception.
The discrepancy in the outcomes may originate from the choice of psychophysical task, that is, the employment of an oddball task (McKay & McDermott, 1996), a 2AFC discrimination task (Egger et al., 2016; Lindenbeck et al., 2024), a pitch-ranking task (Griessner et al., 2021; Macherey & Carlyon, 2010), or a pitch estimation task (McKay & McDermott, 1996). Furthermore, we note that the rate differences to be ranked in Macherey and Carlyon (2010) and Griessner et al. (2021) were generally at least twice as large as in the present study. Hence, it might have been the case that mTEA effects manifest differently close to threshold as compared to sufficiently above threshold.
Beyond the psychophysical task, other experimental parameters such as the CI manufacturer and associated electrode array design might potentially play a role. However, neither of the factors electrode array (perimodiolar: Francart et al., 2015; Macherey & Carlyon, 2010; lateral wall: Egger et al., 2016; Griessner et al., 2021; Lindenbeck et al., 2024; McKay & McDermott, 1996), stimulation mode (monopolar: Egger et al., 2016; Francart et al., 2015; Griessner et al., 2021; Lindenbeck et al., 2024; bipolar: Macherey & Carlyon, 2010; McKay & McDermott, 1996), or tested cue (temporal pitch: Griessner et al., 2021; Macherey & Carlyon, 2010; McKay & McDermott, 1996; ITD: Egger et al., 2016; Francart et al., 2015; Lindenbeck et al., 2024) varied consistently with the reported mTEA effects. Furthermore, we note that differences between stimulation modes can vary substantially even within the same CI listeners, as Marozeau et al. (2015) showed for simultaneous multi-electrode stimulation.
In the present study, SIPI stimuli were first tested in dual-electrode configurations. Hence, there is no previous research available for comparison. In theory, on the one hand, SIPI stimuli should produce at least as much channel interaction as AM-only stimuli as they contain even more pulses (cf. Figure 1). On the other hand, temporal pitch coding should be enhanced, as single-electrode SIPI stimulation has previously been shown to be at par with low-rate stimulation (Buechel et al., 2018; Lindenbeck et al., 2024; Srinivasan et al., 2020, 2018). Since AM-only stimulation yielded mTEA effects similar to low-rate stimulation, it comes as no surprise that SIPI stimuli showed largely similar mTEA effects. Future research may investigate if this finding can be generalized to other multi-electrode setups. If such a generalization were possible, the SIPI approach may in fact be a promising candidate to improve temporal-pitch sensitivity in multi-electrode high-rate stimulation.
High-Rate Versus Low-Rate Stimulation
We assumed that the type of stimulus determines overall dual-electrode sensitivity, broadly similar to single-electrode stimulation. Moreover, SIPI (and low-rate) stimuli were predicted to yield similarly high sensitivity, and AM-only stimuli (for the selected AM depth of 0.3) were predicted to yield worse sensitivity (cf. Lindenbeck et al., 2020). Indeed, our single-electrode data showed a large effect of stimulus type and low-rate sensitivity to be significantly higher than AM-only sensitivity across all five tested C1 and C2 electrodes. Yet, SIPI sensitivity was neither significantly better than HR sensitivity nor significantly worse than LR sensitivity and, thus, somewhat worse than reported in Lindenbeck et al. (2020).
For dual-electrode stimulation, when directly comparing the three stimulus types in an omnibus analysis together with the mTEA and the CCC, the stimulus-type-associated effects were largely inconclusive. Consequently, we narrowed down the analysis to investigate whether high-rate dual-electrode pitch discrimination sensitivity differed from low-rate sensitivity (1) on an absolute scale and (2) when considering only the changes in sensitivity related to the switch from single- to dual-electrode stimulation.
While the analyses on an absolute scale (i.e., the raw d′ scores) still revealed inconclusive differences between CCCs, they did reveal that AM-only stimulation was generally worse than low-rate stimulation across CCCs, while SIPI stimulation yielded low-rate-like sensitivity at least for some CCCs. Furthermore, the analyses focusing on the differences between dual- and single-electrode sensitivity (i.e., those based on Δd′ scores) showed that dual-electrode stimulation was more beneficial for high-rate as compared to low-rate stimulation. Only the LA condition was shown to be unlikely to differ between high-rate and low-rate stimulation. Since low-rate stimulation did not show integration of information across electrodes in Lindenbeck et al. (2024), we consider the differences between high-rate and low-rate stimuli to reflect differences in the degree to which pitch cues may be integrated across electrodes. In other words, while high-rate dual-electrode stimulation was never better than low-rate dual-electrode sensitivity, high-rate dual-electrode stimulation seemed to be better than single-electrode stimulation, while low-rate dual-electrode stimulation was similar to single-electrode stimulation.
Taken together, these results suggest that temporal-pitch sensitivity is better when coded by pulse rate as compared to AM rate, consistent with previous studies (e.g., Goldsworthy et al., 2021, 2022). SIPI stimulation seemed to bring high-rate sensitivity close to or at par with low-rate sensitivity also in dual-electrode configurations, which suggests that the SIPI pulses introduced some aspects of low-rate-like behavior, as shown in single-electrode configurations (Buechel et al., 2018; Lindenbeck et al., 2020; Srinivasan et al., 2020, 2018), also with more than one electrode active.
Our finding that high-rate stimulation pitch cues might be integrated at least for mid-basal parts of the cochlea (i.e., some of the tested CCCs) is at odds with previous findings for multi-electrode temporal-pitch and ITD sensitivity, which reported that any improvement in multi-electrode sensitivity was attributable to increases in loudness and vanished when single- and multi-electrode stimuli were matched in loudness (e.g., Egger et al., 2016; Galvin et al., 2015). Intriguingly, the differences between high-rate dual- and single-electrode stimulation were similar when expressed relative to the sensitivity of the better single-electrode condition rather than relative to the integration across both constituting single electrodes (see the supplemental materials). Ihlefeld et al. (2014) reached a similar conclusion for dual-electrode AM-only ITD sensitivity. Hence, we cannot fully determine whether pitch cues were truly integrated (as defined by our Δd′ metric) across electrodes.
Conclusions
We investigated temporal-pitch discrimination sensitivity with high-rate dual-electrode stimulation in five listeners with MED-EL CIs.
For small tonotopic separations (below approximately 2.2 mm), we found large mTEA effects, resulting in reduced sensitivity for high asynchrony (towards 50% of the AM or pulse period). This effect was found across stimulus types. Although high-rate stimuli showed overall mostly worse pitch discrimination than low-rate stimuli, we did not observe a stronger mTEA effect (i.e., an additional detrimental effect on pitch sensitivity) for these stimuli, as might be expected given their higher spatio-temporally pulse density. For large separations (approximately 7.1 mm on the basal side and approximately 9.4 mm on the apical side), the mTEA effect was completely absent. All these results are consistent with the hypothesis that the mTEA effect is driven by channel interactions.
Dual-electrode high-rate sensitivity was never better than low-rate sensitivity. SIPI stimulation approached low-rate levels at least for some tonotopic separations. Compared to single-electrode sensitivity, high-rate stimulation may have benefited from a second stimulating electrode while low-rate stimulation did not, either because of integration of pitch cues across electrodes or the possibility of using the better of the two single electrodes to mitigate low sensitivity on one of the constituting electrodes.
Supplemental Material
sj-pdf-1-tia-10.1177_23312165251408983 - Supplemental material for Effects of Dual-Electrode Asynchrony on Temporal Pitch Discrimination With Amplitude Modulation and Short Inter-Pulse Intervals in Cochlear Implant Listeners
Supplemental material, sj-pdf-1-tia-10.1177_23312165251408983 for Effects of Dual-Electrode Asynchrony on Temporal Pitch Discrimination With Amplitude Modulation and Short Inter-Pulse Intervals in Cochlear Implant Listeners by Martin J. Lindenbeck, Piotr Majdak and Bernhard Laback in Trends in Hearing
Supplemental Material
sj-pdf-2-tia-10.1177_23312165251408983 - Supplemental material for Effects of Dual-Electrode Asynchrony on Temporal Pitch Discrimination With Amplitude Modulation and Short Inter-Pulse Intervals in Cochlear Implant Listeners
Supplemental material, sj-pdf-2-tia-10.1177_23312165251408983 for Effects of Dual-Electrode Asynchrony on Temporal Pitch Discrimination With Amplitude Modulation and Short Inter-Pulse Intervals in Cochlear Implant Listeners by Martin J. Lindenbeck, Piotr Majdak and Bernhard Laback in Trends in Hearing
Supplemental Material
sj-pdf-3-tia-10.1177_23312165251408983 - Supplemental material for Effects of Dual-Electrode Asynchrony on Temporal Pitch Discrimination With Amplitude Modulation and Short Inter-Pulse Intervals in Cochlear Implant Listeners
Supplemental material, sj-pdf-3-tia-10.1177_23312165251408983 for Effects of Dual-Electrode Asynchrony on Temporal Pitch Discrimination With Amplitude Modulation and Short Inter-Pulse Intervals in Cochlear Implant Listeners by Martin J. Lindenbeck, Piotr Majdak and Bernhard Laback in Trends in Hearing
Supplemental Material
sj-pdf-4-tia-10.1177_23312165251408983 - Supplemental material for Effects of Dual-Electrode Asynchrony on Temporal Pitch Discrimination With Amplitude Modulation and Short Inter-Pulse Intervals in Cochlear Implant Listeners
Supplemental material, sj-pdf-4-tia-10.1177_23312165251408983 for Effects of Dual-Electrode Asynchrony on Temporal Pitch Discrimination With Amplitude Modulation and Short Inter-Pulse Intervals in Cochlear Implant Listeners by Martin J. Lindenbeck, Piotr Majdak and Bernhard Laback in Trends in Hearing
Supplemental Material
sj-pdf-5-tia-10.1177_23312165251408983 - Supplemental material for Effects of Dual-Electrode Asynchrony on Temporal Pitch Discrimination With Amplitude Modulation and Short Inter-Pulse Intervals in Cochlear Implant Listeners
Supplemental material, sj-pdf-5-tia-10.1177_23312165251408983 for Effects of Dual-Electrode Asynchrony on Temporal Pitch Discrimination With Amplitude Modulation and Short Inter-Pulse Intervals in Cochlear Implant Listeners by Martin J. Lindenbeck, Piotr Majdak and Bernhard Laback in Trends in Hearing
Supplemental Material
sj-pdf-6-tia-10.1177_23312165251408983 - Supplemental material for Effects of Dual-Electrode Asynchrony on Temporal Pitch Discrimination With Amplitude Modulation and Short Inter-Pulse Intervals in Cochlear Implant Listeners
Supplemental material, sj-pdf-6-tia-10.1177_23312165251408983 for Effects of Dual-Electrode Asynchrony on Temporal Pitch Discrimination With Amplitude Modulation and Short Inter-Pulse Intervals in Cochlear Implant Listeners by Martin J. Lindenbeck, Piotr Majdak and Bernhard Laback in Trends in Hearing
Supplemental Material
sj-pdf-7-tia-10.1177_23312165251408983 - Supplemental material for Effects of Dual-Electrode Asynchrony on Temporal Pitch Discrimination With Amplitude Modulation and Short Inter-Pulse Intervals in Cochlear Implant Listeners
Supplemental material, sj-pdf-7-tia-10.1177_23312165251408983 for Effects of Dual-Electrode Asynchrony on Temporal Pitch Discrimination With Amplitude Modulation and Short Inter-Pulse Intervals in Cochlear Implant Listeners by Martin J. Lindenbeck, Piotr Majdak and Bernhard Laback in Trends in Hearing
Footnotes
Author Note
Portions of this work were presented at the 47th Annual Meeting of the German Acoustical Society, August 2021, Vienna, Austria, the Conference on Implantable Auditory Prostheses, July 2021, Lake Tahoe, CA, United States, and the 19th International Symposium on Hearing, June 2022, Lyon, France.
Acknowledgments
We thank our cochlear-implant listeners for their patience and commitment while conducting the experiments. We further thank Michael Mihocic, Tobias Harvey, and Marie-Luise Augsten for assisting with data collection and Michael Smithson for discussions on effect-size confidence intervals.
Author Contributions
Martin J. Lindenbeck and Bernhard Laback primarily conceptualized and designed the study. Martin J. Lindenbeck collected the data, performed statistical analysis, and wrote the first draft of the manuscript. All authors contributed to manuscript revision, read, and approved the submitted version.
Funding
The authors disclosed receipt of the following financial support for the research, authorship, and/or publication of this article: Martin J. Lindenbeck was supported by a DOC Fellowship of the Austrian Academy of Sciences (A-25606) and by the Dr. Anton Oelzelt-Newin Fund of the Austrian Academy of Sciences (A-100315). Additional support was provided to all authors by the Austrian Agency for International Cooperation in Education and Research (MULT 07/2020). Open access funding was provided by the Open Access Fund of the Austrian Academy of Sciences.
Declaration of Conflicting Interests
The authors declared no potential conflicts of interest with respect to the research, authorship, and/or publication of this article.
Data Availability Statement
The data sets generated during and/or analyzed during the current study are available from the corresponding author on reasonable request.
Supplemental Material
Supplemental material for this article is available online.