
Abstract
Timing cues such as interaural time differences (ITDs) and temporal pitch are pivotal for sound localization and source segregation, but their perception is degraded in cochlear-implant (CI) listeners as compared to normal-hearing listeners. In multi-electrode stimulation, intra-aural channel interactions between electrodes are assumed to be an important factor limiting access to those cues. The monaural asynchrony of stimulation timing across electrodes is assumed to mediate the amount of these interactions. This study investigated the effect of the monaural temporal electrode asynchrony (mTEA) between two electrodes, applied similarly in both ears, on ITD-based left/right discrimination sensitivity in five CI listeners, using pulse trains with 100 pulses per second and per electrode. Forward-masked spatial tuning curves were measured at both ears to find electrode separations evoking controlled degrees of across-electrode masking. For electrode separations smaller than 3 mm, results showed an effect of mTEA. Patterns were u/v-shaped, consistent with an explanation in terms of the effective pulse rate that appears to be subject to the well-known rate limitation in electric hearing. For separations larger than 7 mm, no mTEA effects were observed. A comparison to monaural rate-pitch discrimination in a separate set of listeners and in a matched setup showed no systematic differences between percepts. Overall, an important role of the mTEA in both binaural and monaural dual-electrode stimulation is consistent with a monaural pulse-rate limitation whose effect is mediated by channel interactions. Future CI stimulation strategies aiming at improved timing-cue encoding should minimize the stimulation delay between nearby electrodes that need to be stimulated successively.
Keywords
Introduction
Interaural time differences (ITDs) and level differences encode the location of sound sources along the lateral (left-right) dimension and facilitate the perception of a target source in the presence of spatially separated interfering sources (for reviews, see Blauert, 1997; Middlebrooks & Green, 1991). In normal hearing (NH) listeners, ITD is the dominant sound-localization cue at low frequencies (Klingel & Laback, 2022; Macpherson & Middlebrooks, 2002; Wightman & Kistler, 1992). ITD is most saliently conveyed via the rapidly varying temporal fine structure (the carrier signal) in lower frequency channels up to about 1300 Hz (Brughera et al., 2013; Smith et al., 2002; Wightman & Kistler, 1992; Zeng et al., 2004). The salience of ITD in higher frequency channels depends on the peakedness of their temporal envelope (Klein-Hennig et al., 2011; Laback et al., 2011; Macpherson & Middlebrooks, 2002). For signals covering a broader spectral range, NH listeners typically integrate ITD information across frequencies, often resulting in better ITD sensitivity compared to narrowband stimuli (e.g., Buell & Hafter, 1991; Buell & Trahiotis, 1993).
The situation is, however, rather different in cochlear-implant (CI) listeners. CIs are auditory prostheses designed to provide speech understanding in profoundly hearing-impaired or deaf people. Modern CIs typically use pulsatile electric stimulation which provides two main advantages. First, the neural response is highly phase-locked to the pulse timing (e.g., Hartmann et al., 1984; Van Den Honert & Stypulkowski, 1987), which is potentially advantageous for encoding timing information at sufficiently low rates (see below). Second, it allows one to avoid simultaneous stimulation at different electrodes and, thus, unwanted electric-field summation that potentially impedes the spectral (across-electrode) stimulus representation (de Balthasar et al., 2003; Eddington et al., 1978; Favre & Pelizzone, 1993). One important aspect in multi-electrode stimulation is the relative timing of pulses across electrodes but within an ear (e.g., Francart et al., 2015). This is because even with non-simultaneous stimulation of adjacent electrodes—a standard method in clinical CIs—the stimulation pulse pattern received by a certain auditory-nerve sub-population is not simply the pulse pattern of the closest electrode but rather the weighted sum of several nearby electrode signals. This interplay of insufficiently independent CI electrodes is called channel interaction (e.g., de Balthasar et al., 2003).
Such interactions may, in turn, make it difficult for the auditory system to extract the precise timing information that is required to convey ITDs in the range of microseconds. For example, for a certain auditory-nerve population, overlapping stimulation from multiple electrodes may increase the effective rate. If this rate exceeds the above-mentioned rate limitation, ITD coding should worsen. Furthermore, depending on the exact temporal structure of the aggregate pulse pattern, in particular the resulting inter-pulse intervals, temporal effects such as refractoriness or facilitation may incoherently jitter or otherwise degrade the ITD cue even at sufficiently low rates (e.g., Boulet et al., 2016). Hence, appropriately controlling channel interactions may give CI listeners access to lower effective rates and more precise ITD coding.
With a bilateral CI system, every ipsilateral electrode can, in principle, encode ITD when paired with a place-matched contralateral electrode, and the perception of ITDs conveyed by a single interaural electrode pair has been well studied (e.g., Laback et al., 2007; van Hoesel, 2007). The most controlled situation is to stimulate such a single interaural electrode pair using direct stimulation with a research interface and ensuring that the electrodes are interaurally place-matched (i.e., that the stimulated neurons are tonotopically matched and, therefore, compared by binaurally sensitive neurons). Because this configuration avoids channel interactions, it can be used as a baseline for comparison with multi-electrode configurations. Best sensitivity is typically found if the pulse rate is in the order of about 100 pulses per second (pps), and performance is found to decline with increasing pulse rate (an effect referred here to as rate limitation; Laback et al., 2007; Laback et al., 2015; Majdak et al., 2006; van Hoesel, 2007; van Hoesel et al., 2009). While this type of stimulus is sometimes considered as the electrical analog of acoustic fine structure (i.e., “electric fine structure”), there is a remarkable similarity with envelope rather than fine-structure ITD sensitivity in NH, both in terms of absolute performance and in terms of the rate limitation (Laback et al., 2015). Sensitivity to envelope ITD in electric hearing, using a high-rate carrier pulse train, shows a similar pattern as for unmodulated pulse trains with matched rates, although absolute performance is lower (Laback et al., 2011) and the decline with rate is sharper (Noel & Eddington, 2013; van Hoesel et al., 2009).
The more practical situation of multi-electrode stimulation has not received as much attention yet. In general, recent findings by Thakkar et al. (2018) and Thakkar et al. (2023) with five-electrode stimulation suggest that coding usable low-rate ITD cues (i.e., 100 pps and, hence, below the rate limitation) on one mid-to-basal electrode yields sensitivity that is significantly better than when stimulating with high rates (i.e., 1000 pps) on all electrodes and comparable to stimulating with low rates on either three or all five electrodes. More specifically, the study by Egger et al. (2016) investigated the tonotopic separation of two electrode pairs and measured pulse-rate ITD thresholds. They stimulated with unmodulated pulse trains at a rate of 100 pps and a delay between these pairs of 5 ms (i.e., half the pulse period) and, therefore, highest potential for detrimental channel interactions due to a doubling of the effective pulse rate. They found a clear effect of electrode separation: In case of wide separations, combined-electrode performance was significantly better than single-electrode performance. In case of small separations, the combined-electrode performance did not differ from single-electrode performance.
With multi-electrode stimulation, also the delay between the pulse trains of two electrodes is an important parameter. In the following, we use the term monaural temporal electrode asynchrony (mTEA) when referring to that delay applied between the pulse trains of the two electrodes in the same ear in contrast to the ITD applied across ears. Note that the mTEA is a relative measure and is given as a proportion of the pulse period of the single-electrode pulse train. Ihlefeld et al. (2014) measured envelope-ITD sensitivity and used dual-electrode stimulation with 1000-pps pulse trains with 100-Hz sinusoidal amplitude modulation, minimal mTEA, and a relatively wide tonotopic separation. Combined-electrode performance did not differ from the better single-electrode performance. Finally, Francart et al. (2015) measured envelope-ITD sensitivity with 1000-pps pulse trains and a 100-Hz half-wave-rectified sinusoidal AM for both single-electrode and triple-electrode configurations, while varying mTEA from minimal (i.e., almost simultaneous) to maximal (i.e., half the relevant AM period). They found similar sensitivity for triple versus single-electrode stimulation when the mTEA was minimal. With increasing mTEA, sensitivity worsened, however, only in case of a small separation but not in case of a wider separation. Together, the results of all three studies are consistent with the idea that channel interactions may impede ITD sensitivity in tonotopically proximal multi-electrode stimulation. However, neither of those studies measured the actual degree of channel interaction between the electrodes involved.
In our study, we investigate the hypothesis that channel interactions restrict the access to salient ITD cues with temporally interleaved stimulation. To this end, we studied ITD (i.e., left/right) discrimination sensitivity in bilateral CI listeners being stimulated with two interaurally place-matched electrode pairs. Crucially, each electrode pair used the same stimuli and conveyed the same ITD. Hence, to perform the discrimination task, CI listeners could rely on ITD cues from either electrode pair or a combination of the two. To assess the extent to which channel interactions resulting from dual-electrode stimulation obscure the ITD cues, we varied mTEA and the tonotopic separation, both similarly in the left and the right ear. For large tonotopic separations, we assumed that ITD cues conveyed by each electrode are transmitted through the cochleae independently and are perceptually integrated, hence, in the best case resulting in higher ITD sensitivity for dual- compared to single-electrode stimulation. However, for small tonotopic separations, we assumed that channel interactions impede ITD perception, resulting in similar or even worse performance for dual- compared to single-electrode stimulation.
To achieve a high baseline (i.e., single-electrode) ITD sensitivity, we used pulse trains with 100 pps and per electrode pair (referred to as low-rate pulse trains). To also avoid floor and ceiling effects, we conducted a set of pretests to find, individually per CI listener, one ITD which was used throughout the main experiment. To exclude loudness effects on ITD sensitivity (e.g., Egger et al., 2017) we furthermore loudness-balanced and subsequently image-centered all stimuli.
To alter the potential for channel interactions (i.e., the inter-pulse intervals between the two electrodes within one ear, cf. Boulet et al., 2016), we systematically varied the mTEA (see the bottom row in Figure 1). The mTEA was varied as a proportion of the pulse period of 10 ms, thus, assuming a periodicity of the mTEA effect. To manipulate the amount of channel interactions (i.e., the summation of the two electrodes within a given auditory-nerve neuron), we systematically varied the tonotopic separation between the component electrodes of the dual-electrode combinations, hereafter referred to as C1 and C2, respectively. C1 was fixed in the center of the electrode array while C2 was varied across the array (cf. Figure 2). The selection of tonotopic separations (i.e., C2) was based on a pretest, namely, forward-masked spatial tuning curves (Nelson et al., 2008; Nelson et al., 2011) at C1 in the two ears of each listener.

Monaural versions of the unmodulated low-rate stimuli used in the experiment. Top: Single-electrode stimulus. The thick solid horizontal line marks the pulse period (i.e., Pulse Rate−1). Bottom: Dual-electrode stimulus with the monaural temporal electrode asynchrony (mTEA, thick solid horizontal black line in gray box) between basal (solid line) and apical (dashed line) electrode. The mTEA is expressed as a proportion of the pulse period. For readability purposes, negative pulse phases are omitted and only a few pulse periods are shown (indicated by the dots).

Interaural electrode pair selection. The C1 electrode (Z, in blue) is in the center of the arrangement. Two C2 electrodes are located on the apical side, that is, large-apical (LA) and small-apical (SA). Two further C2 electrodes are located on the basal side, that is, small-basal (SB) and large-basal (LB). SA and SB C2's are located adjacent to C1 (given they provide sufficient masking). LA and LB C2's are selected based on forward-masked spatial tuning curves. Arrows with dashed lines indicate interaural electrode pair candidates for the electrode-matching ITD-sensitivity pretest (cf. section “Forward-masked spatial tuning curves and C2-electrode selection”).
The fact that the stimuli were completely symmetric across ears highlights that there are in fact two stimulus components contributing to ITD perception, namely the signal at the left ear and the signal at the right ear. One tool to connect the two-ear percept ITD with the perceptual contributions from each of the two ears is monaural temporal pitch. As for ITD, temporal pitch is based on the encoding of stimulus timing. In fact, ITD and temporal pitch reveal similar perceptual properties in electric hearing (e.g., Ihlefeld et al., 2015; Kong et al., 2009; Lindenbeck et al., 2020; Lindenbeck et al., 2023). Therefore, similar effects of the parameters mTEA and the tonotopic separation on ITD and temporal pitch may be expected if symmetry across ears is assumed. To that end, our study is complemented by a statistical comparison of the current ITD data with temporal-pitch data collected in unilateral stimulation using matched stimuli (and, hence, rate pitch), mTEA and similar tonotopic separations (Lindenbeck et al., 2024).
Dual-Electrode Interaural-Time-Difference Sensitivity
Methods
Listeners
Five CI listeners (four females) participated, see Table 1 for details. All listeners were post-lingually deafened and used 12-channel implants manufactured by MED-EL Corp. (Innsbruck, Austria) with an electrode spacing of 2.4 mm. In the selection process, we tested listeners having experience in binaural CI testing in our lab and having at least 10 activated electrodes in their clinical fittings. All listeners were volunteers and were paid an hourly wage for their participation.
Details on the CI Listeners.

Note. All listeners used 12-electrode MED-EL CIs in both left (L) and right (R) ears. If the onset of deafness could not be attributed to a specific date (e.g., in case of progressive hearing loss), “deafness onset” may also refer to the onset of profound hearing loss. VAE = vestibular aqueduct syndrome.
In the experiments, we followed the European Charter of Fundamental Rights, worked along the guidelines of “Good Scientific Practice,” and fulfilled the ethical principles for research involving human subjects (Helsinki declaration). The research protocol was one of the ethics-approved standard protocols for CI research at the Acoustics Research Institute laboratory. All subjects were adults capable of giving informed consent in writing before the experiment. They were adequately informed of the aims, methods, sources of funding, possible conflicts of interest, institutional affiliations of the researchers, the anticipated benefits and potential risks and discomfort it may entail, post-study support, and any other relevant aspects. They were informed of the right to refuse their participation or to withdraw consent to participate at any time without reprisal. When collecting data, we headed for proportionality and avoided collecting more data than necessary. Confidentiality of collected personal data was maintained by anonymization.
Stimuli and Apparatus
Figure 1 shows monaural and monophasic versions of the biphasic stimuli used in the main experiment. The pulse rate defined the rate at which temporal cues were conveyed. The dual-electrode stimulus (bottom panel in Figure 1) was constructed by presenting the same pulse train at C1 and one of the four C2's. The more apical stimulus (dashed lines) was delayed by the mTEA (i.e., between 0% and 100%). Six of these mTEAs were selected for the main experiment: 4%, 32%, 48%, 52%, 68%, and 96%. These delays were symmetric around 50% and avoided simultaneous stimulation. 2
Figure 2 shows the four dual-electrode conditions, that is, the four C1–C2 combinations (referred to CCCs), which are named according to the relative position of C2 (i.e., large-apical [LA], small-apical [SA], small-basal [SB], and large-basal [LB]). In addition to these four CCCs, a fifth “pseudo-dual” electrode condition (called Z for “zero,” in blue) was tested in which both C1 and C2 pulse trains were presented at the C1 electrode, simulating a tonotopic separation of zero (i.e., maximum interaction, cf. McKay & McDermott, 1996). The three CCCs SA, T, and SB covered electrode separations from 0 to 2.4 mm and, hence, the separations of adjacent electrodes for all three major CI manufacturers in terms of market share, that is, Cochlear Inc. (approximately 0.75 mm), MED-EL (2.4 mm in our cohort), and Advanced Bionics (1.3 mm; Zeng, 2022). The two largest CCCs LA and LB were selected in pretests based on spatial tuning curves (see section “Forward-masked spatial tuning curves and C2-electrode selection”).
All stimuli were nominally 500 ms long, including linear 100-ms onset and offset ramps. ITDs were applied by delaying the signals of all stimulation electrodes in one ear compared to the other ear. Hence, applying an ITD did not change the mTEA. The pulse duration (including both phases) was 55 µs; phase duration and inter-phase gap depended on the implant type. The stimuli were generated on a personal computer and were sent directly to the implants via the Research Interface Box II (RIB2, Institute of Ion Physics and Applied Physics, Leopold-Franzens-University, Innsbruck, Austria). The RIB2 is bilaterally synced at 600 kHz providing a temporal stimulation precision of 1.67 µs.
Loudness Balancing and Image Centering
After electrode fitting (for details, see section “Electrode pair and ITD selection pretests”) and before using a certain stimulus for a sensitivity measurement (i.e., left/right discrimination), in either the pretests or the main experiment described below, the stimulus amplitudes were first monaurally balanced in loudness and afterwards binaurally centered regarding image position. We used the method of adjustment for both loudness balancing and image centering. Provided precautions are taken to avoid starting-level biases (e.g., Van Eeckhoutte et al., 2018) and listeners complying with the task, this method is similarly accurate as adaptive staircase methods (as we have used so far in, e.g., Lindenbeck et al., 2020; Srinivasan et al., 2020) but much faster (about five times in our case, see also Van Eeckhoutte et al., 2018).
For loudness balancing, reference and target stimuli were presented with a 400-ms inter-stimulus break. The reference was a single-electrode pulse train presented at the C1 electrode. The listeners were asked to indicate whether both stimuli were equally loud and, if not, which one was louder. They were provided with response buttons changing the amplitude by ±2%, ±5%, or ±10% of the dynamic range to iteratively adjust the level of the target stimulus. Per condition, at least two adjustments were performed with the target stimulus level starting above the comfortable level as determined for that electrode in the fittings and at least two adjustments with the target stimulus level starting below the comfortable level. To avoid response bias, the starting level was roved within ±20% of the comfortable level in the single-electrode condition and within ±20% of the balanced single-electrode amplitudes in the dual-electrode condition.
First, single-electrode stimuli were loudness-balanced for all C2 electrodes. Second, using the balanced single-electrode amplitudes, the dual-electrode stimuli with mTEAs of 4%, 32%, and 48% (for more details, see section “Stimuli and apparatus”) were loudness-balanced by adjusting their amplitudes jointly on both electrodes by the same proportion of the dynamic range (cf. Macherey & Carlyon, 2010). The amplitudes finally used in the main experiment for mTEAs of 52%, 68%, and 96% (cf. section “Stimuli and apparatus”) were copied from the adjustments made for delays of 48%, 32%, and 4%, respectively.
Image centering was conducted similarly to the loudness balancing, except that both ears were stimulated simultaneously, and each trial consisted of a single interval only. Listeners were asked to indicate whether they perceived the stimulus in the center and, if not, whether it was more to the left or right. To adjust the image position, they were provided with six response buttons causing a change in amplitude by ±2%, ±5%, or ±10% of the dynamic range, split 2:1 between the ears in the direction of image movement. Per condition, at least four image centering adjustments were averaged to obtain the final amplitudes used in the sensitivity (i.e., left/right discrimination) tests.
Electrode Pair and ITD Selection Pretests
We conducted a sequence of pretests to find, per CI listener, a suitable set of interaural C1 and C2 electrode pairs as well as a global ITD for all conditions of the main experiment. Listeners were allowed to take breaks at any time.
Electrode Fitting and C1-Electrode Selection
First, we fitted both ears by determining threshold, maximum comfortable level, and comfortable level for all 12 electrodes with unmodulated 500-ms 100-pps pulse trains without ramps using an informal adjustment procedure. Using these fittings, we excluded electrodes inducing uncomfortable sensations and/or having an unexpectedly small dynamic range as compared to the surrounding electrodes.
To allow for as many C2 candidate electrodes as possible, we aimed for a C1 electrode in the center of the array, that is, electrode six or seven (cf. Figure 2). Following evidence that interaural electrode matching is more accurate when based on ITD rather than place pitch (Bernstein et al., 2021; Hu & Dietz, 2015; Long et al., 2003; Poon et al., 2009), we based the interaural electrode-pair selection on ITD. To this end, we tested all four interaural combinations of the two C1 electrode candidates six and seven in an ITD-sensitivity pretest using a two-interval, two-alternative, forced-choice (2I-2AFC) left/right discrimination task and the method of constant stimuli with several pre-selected ITDs. The ITD ranged between 25 and 1200 µs and the individually tested ITDs were selected based on prior knowledge on individual ITD sensitivity from previous studies in our lab. The first stimulus was presented with an ITD of zero and the second stimulus was presented following a 400-ms inter-stimulus break with an ITD pointing either to the left or to the right. Listeners were asked to indicate the perceived side of the second stimulus compared to the first stimulus. Stimuli were presented to both sides 25 times each but in overall randomized order. Response feedback was provided after each trial. The collected percent-correct scores were converted to d’ scores using the formula
The interaural C1 electrode pair yielding the highest d’ score was selected. All selected C1 electrodes are listed in Table 2.
Setup of the Main Experiment as Determined in the Pretests.
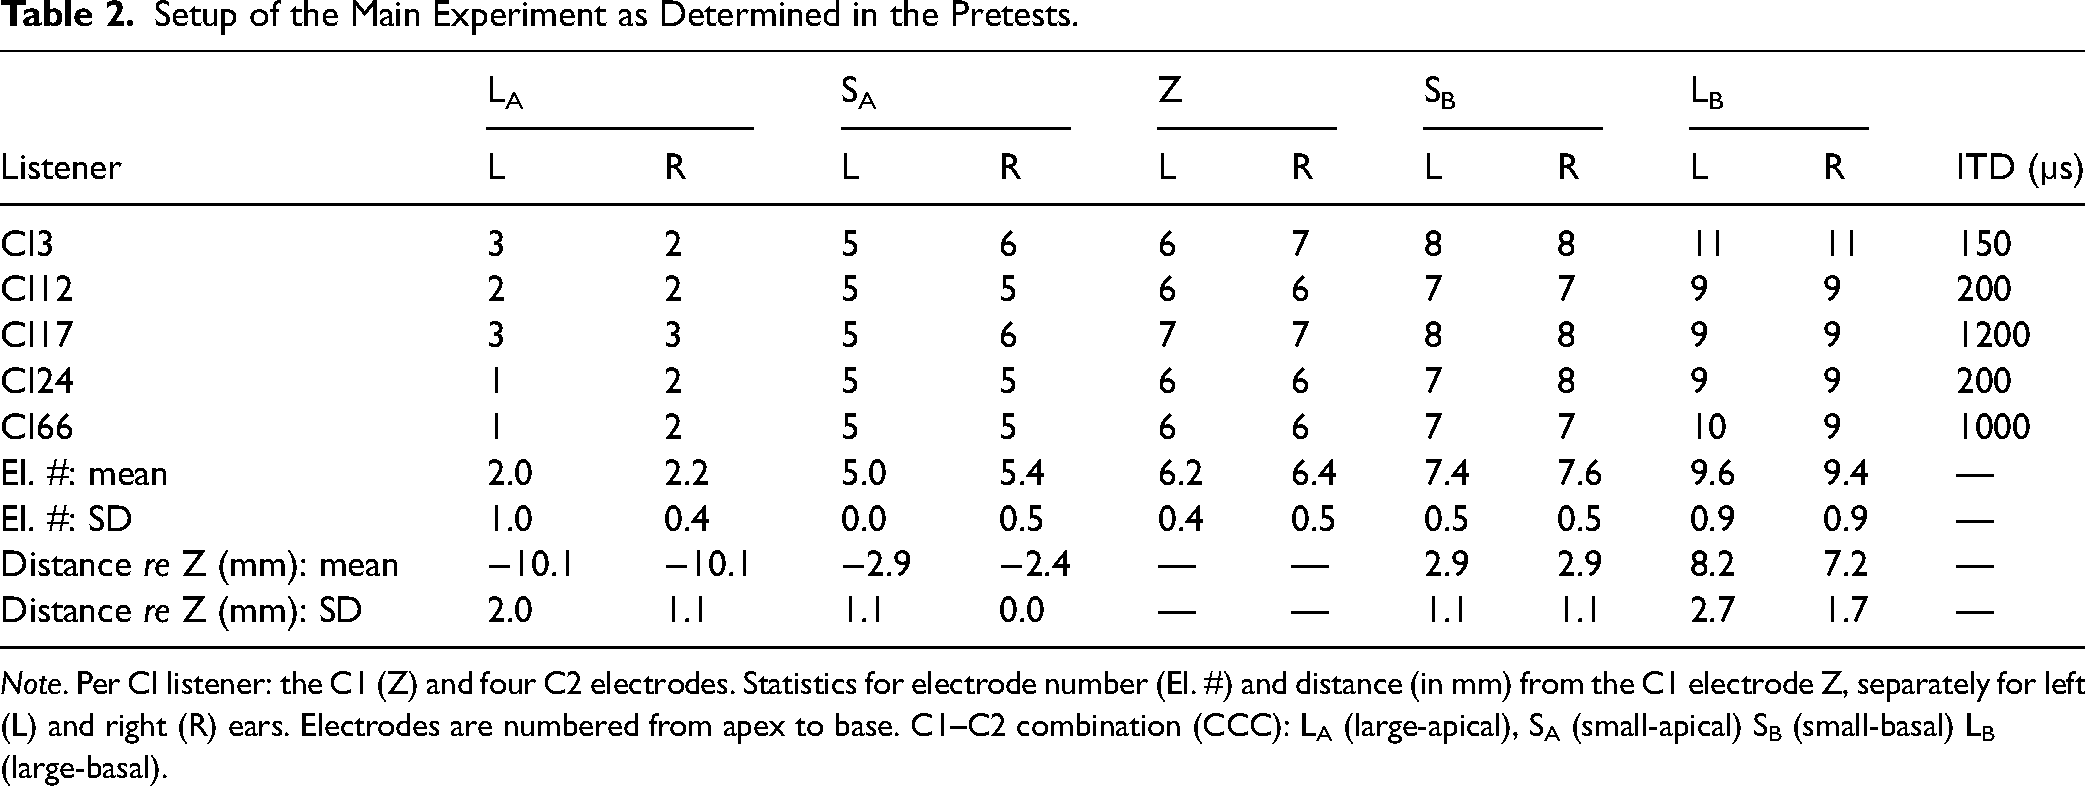
Note. Per CI listener: the C1 (Z) and four C2 electrodes. Statistics for electrode number (El. #) and distance (in mm) from the C1 electrode Z, separately for left (L) and right (R) ears. Electrodes are numbered from apex to base. C1–C2 combination (CCC): LA (large-apical), SA (small-apical) SB (small-basal) LB (large-basal).
Forward-Masked Spatial Tuning Curves and C2-Electrode Selection
The C2 electrode pair candidates and, exemplary, the finally selected electrode pair configurations are shown in Figure 2. We aimed at selecting two types of C2 electrodes: C2's with a small tonotopic separation from C1 to induce maximum channel interactions and C2's with a large tonotopic separation from C1 to induce as little channel interactions as possible. As a marker of channel-interaction potential (i.e., across-electrode masking), we measured listener-specific forward-masked spatial tuning curves using the paradigm described in Nelson et al. (2008, 2011). 3
Before measuring the tuning curves, we fitted both ears for the tuning-curve stimuli using the same procedure as described in section “Electrode fitting and C1-electrode selection.” As masker stimulus, we used an unmodulated 160-ms 1000-pps pulse train without ramps. As target stimulus, we used an unmodulated 10-ms 1000-pps pulse train without ramps on the C1 electrode only. The masker was presented at all available electrodes, whereas the target was always presented at the C1 electrode with a masker-target offset-to-offset delay of 20 ms (cf. Nelson et al., 2008).
The tuning curves were measured separately per ear. The target was presented at the level of 16.5% ± 6.5% (range 7.5%–25.0%) of the target's dynamic range on both ears. The target level was adjusted individually per ear to minimize floor and ceiling effects due to task difficulty but remained fixed during the measurement of the tuning curve. Target levels in this range should not have had an effect on the tuning curve's shape (Nelson et al., 2008). The masker level was varied and the level at threshold was determined in an adaptive 2-up 1-down staircase procedure (Leek, 2001; Levitt, 1971) converging at 71% of the targets being correctly identified. The task was a three-interval three-alternative forced-choice (3I-3AFC) task. Each interval included the masker. In one randomly chosen interval, the masker was followed by the target. The listeners were instructed to indicate the interval that included the target. The initial masker level was 10% of the masker dynamic range. The initial step size was 5% of the masker dynamic range. It was reduced by a factor of 0.7 after each reversal until it reached the minimum step size of 1% of the masker dynamic range. A converging staircase was terminated after 12 reversals. A diverging staircase either exceeded the maximum comfortable level (i.e., it was aborted before stimulating at too loud levels) or dropped below the absolute threshold of the masker electrode. The last eight reversals of a converged staircase were averaged to determine the staircase threshold. The final masking threshold was determined as the average of three staircase thresholds.
After having measured the tuning curves, the small-separation C2 electrode pair candidates (one or two neighboring electrodes of C1 on either side) were evaluated for sufficient masking on both ears. In addition to the presence of masking, the small-separation pairs were required to have ITD sensitivity similar to that of the C1 electrode pair. To find suitable pairs, we conducted another electrode-matching ITD-sensitivity pretest as described in section “Electrode fitting and C1-electrode selection.” The finally selected small-separation pairs are summarized in Table 2.
The large-separation C2 electrode pairs were selected based on three criteria. The first criterion was the presence of nearly no masking of C1 at both ears, as indicated by diverging tuning-curve staircases (i.e., masker level exceeding the maximum comfortable level) or, at least, largest masked thresholds on the respective side of C1. The second criterion was the tonotopic separation from C1: We estimated the extent of channel interactions by selecting the closest possible non-masking C2. The third criterion was—similarly to the small-separation C2's—ITD sensitivity comparable to that of the C1 electrode pair. That criterion was again assessed with an electrode-matching ITD-sensitivity pretest similar to that used for the small-separation C2's. For this test, candidate electrode pairs were selected based on the first two criteria and typically were the closest and second closest possible electrodes. The finally selected large-separation pairs are summarized in Table 2.
Main Experiment: Listener-Specific Interaural Time Difference
Table 2 summarizes the listener-specific setup obtained for the main experiment. The small tonotopic separation was on average and across ears less than 3 mm (i.e., roughly one electrode). The wide separation was on average about 7–8 mm on the basal side and about 10 mm on the apical side.
To maximize the number of testable mTEA and CCC conditions in the main experiment, and to minimize floor and ceiling effects, the listeners were tested at only one listener-specific ITD (Ihlefeld et al., 2015; Kong et al., 2009). The listener-specific ITD used in the main experiment was selected based on the results of the electrode-matching ITD-sensitivity pretests (cf. section “Electrode fitting and C1-electrode selection” and “Forward-masked spatial tuning curves and C2-electrode selection”) and aimed at a homogeneous sensitivity across electrode pairs, optimally, slightly above threshold (i.e., a d’ at or slightly above 1 across electrode pairs). The ITDs selected for individual listeners are summarized in Table 2. Single-electrode ITD sensitivity determined in the pretests was heterogeneous across listeners. Hence, three listeners were tested with small ITDs (≤ 200 µs), and two listeners were tested with large ITDs (≥ 1000 µs).
In the main experiment, the left/right discrimination task was identical to that used in the electrode-matching ITD-sensitivity pretests (see section “Electrode fitting and C1-electrode selection”). Per-trial feedback was provided. Scores were again quantified in terms of d’. To keep place cues constant within a block, the CCCs were tested block-wise. The CCC block order was balanced across listeners but different for each individual listener to (pseudo-)randomize block-order effects. Within each CCC block, the order of mTEAs was randomized. To disentangle interaction effects arising from dual-electrode stimulation from electrode-specific baseline ITD sensitivity, single-electrode conditions, corresponding to C1 and C2 of all dual-electrode conditions, were also measured before dual-electrode conditions within each CCC block. Finally, the entire setup described above (i.e., both single- and dual-electrode conditions) was tested twice, each time with 50 repetitions per condition, resulting in 3500 trials in total per listener.
Statistical Analysis
The main goal of our statistical analysis was to dissociate both the presence and the absence of an effect from measurement noise. In classical terms, we aimed to collect evidence for both the null hypothesis (H0, effect absent) and the alternative hypothesis (H1, effect present). However, the most used statistical method of separating systematic effects from measurement noise using null-hypothesis significance testing (NHST) based on p values only insufficiently tests the H0 and has been extensively criticized (e.g., Amrhein et al., 2019; Cohen, 1994; Rouder et al., 2016). Among others, two recently proposed alternatives are reporting confidence intervals related to the p values (e.g., Cumming, 2014) and Bayesian hypothesis testing (e.g., Wagenmakers et al., 2017). While confidence intervals (e.g., alongside effect sizes) provide both an assessment of statistical power and a measure of practical relevance of a statistical effect, Bayesian hypothesis testing is conceptually different and provides information about the relative evidence for H1 over H0 and vice versa. Thus, we report our statistical results as Bayes-NHST hybrids (cf. Dienes & Mclatchie, 2018; Keysers et al., 2020). This allows us to collect H0 evidence but still retain a fixed Type I error rate and provide estimates of statistical power.
Bayesian Hypothesis Testing
We used repeated-measures analyses of variance (rmANOVAs) for statistical analysis. In the Bayesian implementation (cf. Keysers et al., 2020; van den Bergh et al., 2020) the Bayes factor (BF; e.g., Kass & Raftery, 1995) is used to distinguish between “evidence of presence” (i.e., diagnostic data supporting H1 over H0), “evidence of absence” (i.e., diagnostic data supporting H0 over H1), and “absence of evidence” (i.e., non-diagnostic data that support neither hypothesis). We considered BFs > 3 as evidence for H1 over H0 (“evidence of presence”) and used the inverse threshold (i.e., BF < 0.33) to establish the evidence of H0 over H1 (“evidence of absence”). BFs between 0.33 and 3 were considered inconclusive (“absence of evidence”).
Bayesian statistical analyses were conducted with JASP v0.17.1 (JASP Team, 2023). In particular, we used Bayesian rmANOVAs (Rouder et al., 2012, 2016, 2017; van den Bergh et al., 2020, 2022; Wetzels et al., 2012) in the default JASP prior configuration. The output is the so-called BFincl that quantifies evidence for including an effect in the model (H1) over excluding it (H0).
Null-Hypothesis Significance Testing and Confidence Intervals
To provide effect size estimates and well-known Type I error control, we also conducted “classical” NHST rmANOVAs using MATLAB R2022b (Mathworks, Inc). Both Bayesian and NHST results are always reported together. The significance level was always 5%. To prevent inflation of Type I errors, we used the Huynh–Feldt correction (Huynh & Feldt, 1970) of p values and F-test degrees of freedom (cf. Oberfeld & Franke, 2013).
As effect-size metric, we used the generalized η2 (ηG2) (Bakeman, 2005; Lakens, 2013; Olejnik & Algina, 2003). It is comparable across both within-subjects and between-subjects designs and classifies effect sizes as either small (ηG2 ≥ .02), medium ηG2 ≥ .13), or large (ηG2 ≥ .26) (Bakeman, 2005). The so-called exact analytical 90% “within-subjects” confidence intervals (i.e., the 5%–95% range of ηG2, the F-test is one-sided) are reported in brackets following the ηG2 estimate. Note that the confidence interval of a statistically significant effect does not contain zero.
Results and Discussion
Single-Electrode Stimulation
Figure 3 shows the listener-averaged d’ scores for the single-electrode conditions, denoted with an “S”. The individual listener scores are shown in Figure 4. Across listeners, basal single-electrode ITD sensitivity might appear to be higher than apical sensitivity but note the large variance (particularly due to CI3 and CI66) for the basal-most (LB) electrode. However, a one-way rmANOVA on the d’ scores with the factor electrode revealed evidence for the absence of an effect of electrode (BFincl = 0.28, F[2.1, 8.5] = 0.52, p = .621, ηG2 = .09 [.00, .28]).

ITD-based left/right discrimination sensitivity d’ as a function of mTEA (expressed as a proportion of the pulse period) averaged across CI listeners. Panels distinguish tonotopic separations and C1–C2 combinations (CCCs) are named after the C2 electrode involved (cf. Figure 2). For small and large separations, apical CCCs (SA and LA, respectively) are shown with empty markers and basal CCCs (SB and LB, respectively) are shown with filled markers. For each CCC, single-electrode scores for the C2 electrode are denoted with an “S.” The grey area indicates chance performance (|d’| ≤ .36). Error bars show normalized standard errors (Cousineau, 2005; Morey, 2008).

ITD-based left/right discrimination sensitivity d’ as a function of mTEA in separate rows per CI listener. All other aspects as in Figure 3.
Dual-Electrode Stimulation
The listener-averaged d’ scores for the dual-electrode conditions as a function of the mTEA (in %) are shown in Figure 3. The individual listener scores are shown in Figure 4. The CCCs are shown in separate panels categorized by their tonotopic separation, that is, zero (left), small (about one electrode, middle), and large (three to four electrodes, right). Conditions with apical and basal C2's are denoted by empty and filled circles, respectively.
To jointly assess the effect of mTEA depending on the tonotopic separation statistically, we conducted a two-way rmANOVA. The factor CCC encodes tonotopic separation, that is, Z for zero separation, SA and SB for small separation, and LA and LB for large separation, respectively (cf. Figure 2). We found evidence for an mTEA effect (BFincl = 16.99, F[4.5, 17.8] = 8.71, p < .001, ηG2 = .14 [.07, .19]) that depended on the CCC (mTEA × CCC interaction; BFincl = 15.17, F[20.0, 80.0] = 2.15, p = .009, ηG2 = .12 [.02, .12]). Furthermore, we found evidence for the absence of a CCC effect (BFincl = 0.23, F[4.0, 16.0] = 0.56, p = .693, ηG2 = .04 [.00, .08]).
To assess the differences in the effect of the mTEA for the CCCs tested, we conducted five additional one-way rmANOVAs, one per CCC and each including only the factor mTEA. The results are summarized in Table S1 and visualized in Figure 5.
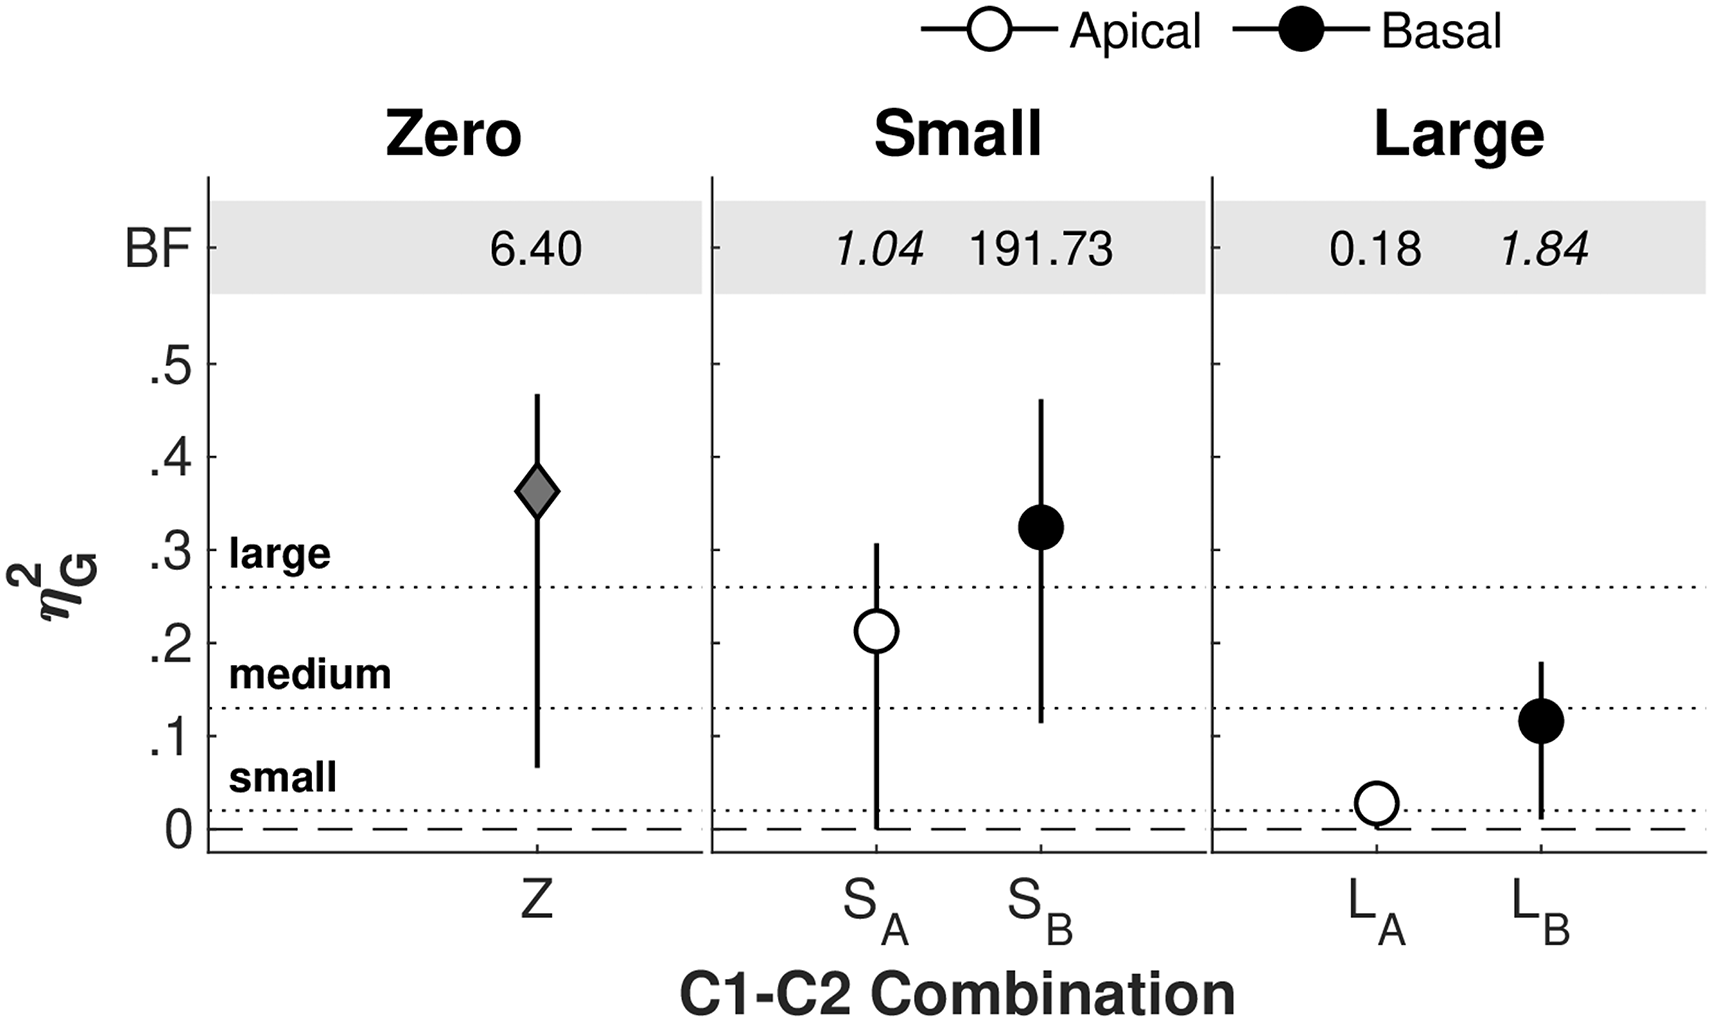
Effect-size estimates ηG2 alongside 90% confidence intervals for several tonotopic separations (panels) and corresponding C1–C2 combinations (CCCs, abscissa). Zero separation: Z CCC. Small separation: apical (SA, empty marker) and basal (SB, filled marker) CCC. Large separation: apical (LA, empty marker) and basal (LB, filled marker) CCC. The dashed line indicates an ηG2 of zero; effects whose confidence intervals do not touch the dashed line are significant with p < .05. Dotted lines indicate threshold ηG2 for small, medium, and large effects, respectively. Bayes factors (BFs) in the grey ribbon indicate evidence for the presence of an mTEA effect (BF > 3) re evidence of its absence (BF < 0.33), given our data (BFincl, cf. section “Statistical analysis”). BFs in italics indicate inconclusive results (i.e., absence of evidence). Color and marker-shape coding is consistent with Figure 3.
For the zero-separation CCC (Z, left panel), we found evidence for a large mTEA effect. The drop in (pseudo-)dual-electrode sensitivity re the single-electrode sensitivity was smallest (about −0.2) for short delays of 4% and 96%, respectively, and considerably larger (about −0.8) for all other delays with a maximum drop for 48%. This effect was largely consistent across listeners with the notable exception of CI24 who showed no mTEA effect.
For small-separation CCCs (middle panel) and the apical condition SA (empty markers), there was inconclusive evidence only. When compared to the zero-separation CCC, the drop in sensitivity for delays between 32% and 68% was less pronounced whereas it was more pronounced for 96%. The effect differed considerably between listeners, with CI66 showing no mTEA effect and both CI12 and CI3 showing only little effect. In contrast, we found evidence for a large mTEA effect for the basal CCC (SB, filled markers). Across listeners, the SB mTEA effect was more homogeneous than the SA mTEA effect, with CI24 as an exception showing only little SB mTEA effect. 4 The Z and SB mTEA effects closely resemble each other.
For large-separation CCCs (right panel) and the apical condition LA (empty markers), we found evidence (homogeneous across listeners) for the absence of an mTEA effect. In contrast, there was inconclusive evidence for the basal condition LB (filled markers). This might have been due to non-negligible effects of at least some mTEAs for CI12 and CI24.
In summary, our hypothesis on the mTEA effect for the zero and small separations was clearly confirmed for two of the three relevant conditions. For condition SA, our results are inconclusive, showing neither clear evidence for absence nor for presence of an mTEA effect. For the large-separation CCCs, we hypothesized the absence of an mTEA effect and we found that evidence indeed, however, in the LA condition only. In the LB condition, our results are inconclusive.
Comparison Between Dual-Electrode Interaural-Time-Difference and Rate-Pitch Sensitivity
In our behavioral ITD experiment, both parameters mTEA and CCC were monaural, which, in case of bilateral stimulation and ITD perception, affected peripheral processing in both ears (cf. Ihlefeld et al., 2015). To provide salient ITD cues, two decent monaural electrode–neuron interfaces are necessary, as compared to only one interface for monaural cues such as rate-based pitch. Hence, the effects of mTEA and CCC might manifest similarly in monaural rate-pitch and ITD perception.
While both percepts are based on similar electrode–neuron interfaces (apart from, e.g., insertion depth and electrode-to-modiolus distance), properties of upstream processing can be percept-specific, for example, pitch-selective neurons in auditory cortex (e.g., Bendor & Wang, 2005) or ITD-sensitive neurons in the brainstem (e.g., Grothe et al., 2010). A study by Ihlefeld et al. (2015) compared rate-limitation effects in monaural rate-pitch versus ITD sensitivity and found ITD sensitivity to correlate significantly with worse-ear rate-pitch sensitivity only. This suggests that a major determinant of ITD sensitivity is the poorer ear which then acts as a monaural bottleneck. Differences between ears in terms of speech recognition performance have further been shown to be related to binaural benefit (Yoon et al., 2011). Still, the rather small explained variance of the correlation in Ihlefeld et al. (2015) suggests additional and possibly percept-specific effects. Note, however, that this correlation was probably underestimated, because it was purely within-subjects and, hence, may have partialed out listener-specific sensory effects common to both tasks.
To further isolate the mechanism underlying the mTEA effect for ITD perception, we compared our ITD-based data with data collected for monaural rate-pitch perception in a matched experimental setup but a different cohort of CI listeners (reported in Lindenbeck et al., 2024). The comparison aimed to minimize the confounding effects of differences between the two CI cohorts, particularly the influence of baseline single-electrode sensitivity, task-specific sensitivity, listener-specific amounts of channel interactions (for large tonotopic separations), and both floor and ceiling effects in general. To this end, we individualized important aspects of the experimental setup (i.e., ITD, rate difference, and tonotopic separation) to test the CI listeners at roughly similar points on their individual psychometric functions (corresponding to perceived difficulty) rather than with similar physical properties.
Methods
Rate-Pitch Data Set
The rate-pitch data set from Lindenbeck et al. (2024) was matched as closely as possible to our ITD data set. In that rate-pitch study, five CI listeners (55 ± 9 years old, four females) were tested monaurally. Three listeners were bilaterally implanted and tested with their preferred ear. The age at onset of deafness was 45 ± 11 years and the CI experience was 7 ± 6 years. All listeners had 12-channel MED-EL implants. Two listeners had electrode arrays with 2.4 mm spacing and three listeners had electrode arrays with 2.1 mm spacing. Note that CI24 participated in both the rate pitch and the ITD experiment.
The C1 electrode was electrode six, thus, located in the center of the electrode array. Small-separation C2's SA and SB were the neighbors of C1 and, hence, spaced on average about 2.2 mm apart. Large-separation C2's LA and LB were selected based on forward-masked tuning curves (cf. section “Forward-masked spatial tuning curves and C2-electrode selection”) and were located on average about 9 mm apically and about 7 mm basally of C1, respectively.
In the experiment, we studied the sensitivity to rate difference (Weber fraction in %) which was fixed for each CI listener, amounting to 15% ± 7%. Analogous to the current ITD data, the rate difference was determined individually per CI listener in single-electrode pretests using unmodulated low-rate stimuli on all five electrodes selected. The tested geometric average (i.e., nominal) rate (cf. Kreft et al., 2010; Lindenbeck et al., 2020) was as close as possible to 100 pps (for more details, see Lindenbeck et al., 2024).
Data Preparation
To remove residual differences in baseline single-electrode sensitivity, we converted the absolute dual-electrode d’ scores into relative dual-electrode d’ scores (hereafter referred to as Δd’) by subtracting the Pythagorean average
Both experiments involved only a single value of the FD or ITD per CI listener, selected based on pretests conducted with unmodulated single-electrode low-rate pulse train stimulation on all five electrodes (pairs, in case of ITD). The FDs and ITDs were selected to “calibrate” the setup such that the absolute dual-electrode d’ scores showed as little floor and ceiling effects as possible (cf. section “Pretests”). Perfectly calibrated, all listeners would have—on average—performed similarly, assuming no other differences between percepts. Because average sensitivity was better than chance level and did not reach the ceiling in all conditions irrespective of the percept, we consider the Δd’-based analysis to yield a valid assessment of between-percept differences.
Statistical Analysis
To search for differences between percepts (i.e., ITD and rate pitch) we conducted an analysis of variance with both between-subjects and within-subjects effects (mixed ANOVA). The between-subjects factor was the Percept (ITD and rate pitch). Within-subjects factors were the mTEA (4%, 32%, 48%, 52%, 68%, and 96%) and the CCC (Z, SA, SB, LA, and LB). All other aspects were as described in sections “Bayesian hypothesis testing” and “Null-hypothesis significance testing and confidence intervals.”
Results and Discussion
Figure 6 shows the Δd’ scores as a function of the mTEA in separate panels for each CCC and with the percept as parameter (ITD with empty markers; pitch with filled markers). Note that negative Δd’ scores indicate a deterioration and positive Δd’ scores indicate an improvement relative to the prediction of optimal integration across electrodes. The error bars show the 95% credible intervals as provided by the “descriptives plots” option of the Bayesian rmANOVA routine in JASP.

Comparison of ITD-based left/right (empty markers) and rate-pitch (filled markers) discrimination sensitivity in terms of Δd’ (for more details, see section “Data preparation”) as a function of mTEA (cf. Figure 1) and in separate panels per C1–C2 combination (CCC, cf. Figure 2). Error bars show Bayesian 95% credible intervals (JASP “descriptives plots” output; JASP Team, 2023).
When visually comparing between the two percepts, for the zero-separation CCC (Z, leftmost panel), the rate-pitch mTEA effect had a u-shape similar to the ITD mTEA effect. In fact, the u-shape for pitch was even a bit broader than that for ITD, suggesting that the mTEA effect might have been larger for pitch than for ITD. For small tonotopic separations, in particular for SA (second-to-left panel), there was a clear u/v-shaped mTEA effect for pitch, but little to no mTEA effect for ITD. At least for some mTEAs, the differences between ITD and pitch were larger than the credible intervals. For SB (center panel), the mTEA effect was similar for ITD and pitch. For large tonotopic separations, in particular LA (second-to-right panel), there was no mTEA effect, neither for ITD nor pitch, even though the ITD Δd’ scores tended to be lower than the pitch Δd’ scores. For LB (rightmost panel), there was no mTEA effect for pitch, however, for ITD, we observed a drop in Δd’ from 32% to 48%.
To assess statistical differences between ITD and pitch discrimination sensitivity, we first analyzed all interaction terms of the mixed ANOVA that included the factor Percept. We found evidence for the absence of an effect of Percept on the mTEA effect (Percept × mTEA interaction; BFincl = 0.16, F[2.2, 17.4] = 0.87, p = .443, ηG2 = .01 [.00, .04]). The evidence for the other interactions was inconclusive (Percept × mTEA × CCC interaction: BFincl = 2.08, F[11.5, 92.3] = 1.72, p = .078, ηG2 = .04 [.00, .05]; Percept × CCC interaction: BFincl = 2.59, F[2.8, 22.4] = 3.18, p = .046, ηG2 = .15 [.00, .29]). The main effect of Percept, although inconclusive, was negligible in size (BFincl = 0.46, F[1.0, 8.0] = 0.00, p = .967, ηG2 = .00 [.00, .00]).
Subsequently, after having established that the mixed ANOVA showed no clear evidence for effects of or interactions with Percept, we also analyzed the effects when pooling the data across percepts. We found evidence that the mTEA effect differed between CCCs (mTEA × CCC interaction; BFincl = 41231.17, F[11.5, 92.3] = 4.09, p < .001, ηG2 = .09 [.03, .11]). Furthermore, we found evidence for a medium mTEA effect across CCCs (BFincl = 16321.46, F[2.2, 17.4] = 11.39, p = .001, ηG2 = .13 [.05, .20]) as well as vice versa (BFincl = 3.28, F[2.8, 22.4] = 3.97, p = .023, ηG2 = .20 [.02, .33]).
To investigate the mTEA × CCC interaction when pooled across percepts, we conducted simple-effects mixed ANOVAs separately per CCC. We did not exclude the between-subjects factor Percept from the ANOVAs because the three-way interaction in the main mixed ANOVA was inconclusive (rather than indicating absence of evidence, see above). The results (i.e., the main effects of mTEA in the simple-effects ANOVAs) are visualized in Figure 7. The ANOVA results are summarized in Table S3. For all three CCCs with zero or small tonotopic separation (Z, SA, and SB), we found evidence for a medium-to-large mTEA effect. For the CCCs with a large tonotopic separation (LA and LB), we found evidence for the absence of an mTEA effect.

Effect of mTEA (i.e., ηG2 alongside 90% confidence intervals) across percepts for several tonotopic separations (panels) and corresponding C1–C2 combinations (abscissa). All other aspects as in Figure 5.
In summary, we found evidence for the absence of an effect of the percept on the mTEA effect. Across percepts, we found an effect of mTEA for zero or small tonotopic separations, but not for large tonotopic separations.
General Discussion
The primary focus of our study was to explore the effect of mTEA, the mTEA in dual-electrode CI stimulation on ITD-based left/right discrimination sensitivity. Several tonotopic separations were tested, specified as C1–C2 combinations (CCCs, cf. Figure 2) and selected to inform about the role of channel interactions. Additionally, we explored the origin of the mTEA effect further by comparing the ITD data with data collected for monaural rate-pitch discrimination with a matched experimental setup.
Due to the general heterogeneity of the CI population, our study was designed as a small-N within-subjects study with the experimental statistical power focused on the main point of interest, that is, on the individual listener. Note that effects observed in small-N studies generalize well as long as the tested hypotheses in principle apply to the entire population and the quality of the collected data is high (Smith & Little, 2018). Despite considerable differences in absolute performance across the five CI listeners tested in the present study, the effects of the main parameters of interest were quite consistent across individuals.
Effect of the Monaural Temporal Electrode Asynchrony
We hypothesized that mTEA affects dual-electrode ITD discrimination sensitivity, provided that the two stimulating electrodes are closely spaced and, hence, interact already peripherally in the cochlea by stimulating at least partially overlapping auditory-nerve fiber populations. To this end, we tested two CCCs (SA and SB) with an average tonotopic separation of about one electrode (i.e., 2–3 mm with the MED-EL electrode array). These CCCs covered the middle part of the electrode array around the C1 electrode. To ensure that peripheral channel interactions indeed occurred with these CCCs, the selection of C2 electrodes was based on forward-masked spatial tuning curves, revealing across-electrode masking of the C1 electrode. Furthermore, to consider the large electrode spacing of MED-EL CIs, we included a control CCC with a tonotopic separation of zero (called Z) in which both C1 and C2 pulse train were presented at the C1 electrode.
In conditions Z and SB, we indeed found evidence for a large mTEA effect represented as a v- or u-shape with drops in ITD-sensitivity d’ of up to 1. The mTEA effect was symmetric around 50%, that is, around half the pulse period, indicating that, first, the temporal order of C1 and C2 is not relevant and, second, that channel interactions resulted in an effective increase of the total pulse rate. In both conditions, the mTEA effect was similar in size, suggesting that an electrode separation of about 3 mm is not sufficient to notably reduce the mTEA effect.
In condition SA, we were not able to obtain any conclusive evidence for either the absence or presence of a delay effect.
We argued that the shape of the mTEA effect is an indicator of the presence of channel interactions. The u-shaped patterns shown in Figures 3 and 6 are overall consistent with the hypothesized effect of channel interactions. This can be best assessed with the zero-separation CCC for which differences between electrodes and tonotopic separation per se play no role. For short and long mTEA of 4% and 96%, respectively, for which C1 and C2 pulses are close in time and neurons have maximal time to recover from the C1–C2 pulse pair from the preceding period, ITD sensitivity was only marginally reduced compared to the single-electrode condition. This outcome suggests that with loudness-adjusted dual-electrode stimuli with short or long mTEAs, C1 and C2 pulses almost fully sum up and generate a spiking pattern in the auditory nerve that closely resembles that of the single-electrode condition (cf. Buechel et al., 2018). For medium mTEAs, C1 and C2 pulses are evenly distributed and, thus, the effective pulse rate increases. Hence, the mTEA effect for this condition can also be interpreted from the perspective of rate coding. The largest rate increase can be expected for the 48/52% mTEAs and condition Z, in which, effectively, the pulse rate doubles to 200 pps. For comparison, for an ITD of 500 µs (i.e., matching our average ITD), Ihlefeld et al. (2015) reported a drop in ITD sensitivity by a d’ of about 1 when the rate was increased from 100 to 200 pps. This corresponds well to the drop in d’ we found for the 48/52% mTEAs. Furthermore, Egger et al. (2016) reported increased ITD threshold for single-electrode 200-pps low-rate stimulation compared to both small- and especially large-separation 100-pps stimulation. Together, these results indicate that our mTEA effect is a manifestation of the rate limitation found in other studies.
Effect of Tonotopic Separation
Without any tonotopic separation between C1 and C2, an increase in mTEA can be interpreted as an increase in effective pulse rate, as discussed above. In conditions with a clear tonotopic separation, we assumed a similar mechanism, in which the mTEA effect is modulated by the amount of channel interactions. Specifically, we assumed that the amount of interactions decreases with increasing tonotopic separation. Further assuming that across-electrode forward masking is a measure of the amount of channel interactions, we measured forward-masked spatial tuning curves (Nelson et al., 2008, 2011) to derive CCCs eliciting minimal forward masking (i.e., LA and LB). We tested these CCCs for an mTEA effect. Indeed, for LA, we found evidence for the absence of an mTEA effect. ITD sensitivity was nearly as good as that predicted from optimal integration across electrodes (cf. Δd’ scores around 0 in Figure 6). For LB, however, we found only inconclusive evidence. For mTEAs of 4% and 32%, the sensitivity was similar to that in LA (cf. Figure 6). For all other mTEAs, the sensitivity dropped without any v/u-shaped pattern. There is, thus, no evidence for the general absence of mTEA in this condition. However, given the lack of a v/u-shaped pattern, the origin of this mTEA effect likely differs from the effect we found for small and zero-separations CCCs (cf. section “Effect of the monaural temporal electrode asynchrony”). One possibility is spurious masking of the basal C2 by C1, which was not captured by the fmSTCs.
Our results suggest that electrodes separated by about 10 mm in the apical half and by 7–8 mm in the basal half of the CI electrode array stimulate largely non-overlapping electrode populations. Our results substantially extend the findings of Egger et al. (2016) reporting no change in ITD thresholds when comparing single-electrode versus dual-electrode stimulation with more than 6 mm tonotopic separation and using an mTEA of 50%.
Interaural Time Difference Versus Rate Pitch: The Origin of the mTEA Effect
The effects of mTEA manifest independently at the two ears (e.g., Ihlefeld et al., 2015). In the case of asymmetry between the ears, the mTEA effect will be dominated by the worse ear, creating a unilateral bottleneck (cf. Anderson et al., 2019, 2022). Hence, to achieve salient binaural cues, two decent monaural electrode–neuron interfaces are necessary. To isolate the mechanism underlying the mTEA effects, we searched for mTEA effects that are specific to binaural hearing and ITD perception. Thus, we compared ITD-based sensitivity with monaural rate-pitch sensitivity. For a fair comparison, the experimental setups were matched (Lindenbeck et al., 2024) and we analyzed only the relative dual-electrode sensitivity in terms of Δd’, that is, contrasting measured dual-electrode sensitivity with the prediction of optimal information integration.
We did not find any clear differences in the mTEA effects for ITD and pitch. Combining the data across the two percepts, we found evidence for an mTEA effect in case of small tonotopic separations (i.e., < 3 mm). These findings appear to contradict the considerable independence of electrodes reported for monaural rate-pitch ranking both with a tonotopic separation of 0.75 mm (Macherey & Carlyon, 2010) and 2.4 mm (Griessner et al., 2021). Furthermore, Griessner et al. (2021) found independence of electrodes via pitch matching of acoustic pure tones to the same electric stimuli in single-sided-deaf CI listeners (tonotopic separation 2.1 mm on average). The most notable difference between the previous studies and the present one is the task (ranking/matching vs. discrimination). In particular, due to our selection of individualized ITDs and FDs in the pretests, our discrimination task was calibrated to be performed around threshold. In contrast to that, the tasks used in Macherey and Carlyon (2010) and Griessner et al. (2021) were performed more supra-threshold. Furthermore, it is unclear to what extent the CI listeners in the different studies focused on one electrode or integrated the information across electrodes to solve the tasks, regardless of the actual amount of peripheral independence.
For wide separations (i.e., > 7 mm), we also found evidence for the absence of difference in the mTEA effect between pitch and ITD percepts. This pattern is consistent with the idea that for both percepts channel interactions are responsible for the observed interplay between the effects of tonotopic separation and mTEA.
Taken together, the absence of a consistent distinction in binaural stimulation compared to monaural stimulation suggests a monaural origin for the mTEA effect that manifests independently, however, potentially to a different degree, in the two ears.
Summary and Conclusions
We studied dual-electrode ITD-based left/right discrimination sensitivity in bilaterally implanted CI listeners as a function of two main parameters: the mTEA and the tonotopic separation of stimulation electrodes. The basic stimulus was unmodulated 100-pps pulse trains. A centrally placed interaural electrode pair (C1) was combined with either of four surrounding interaural electrode pairs (C2), covering major parts of the electrode array and invoking various degrees of tonotopic separation. The single-electrode interaural pairs resembling the dual-electrode conditions showed homogeneous ITD sensitivity (d’).
The results confirmed our overall hypothesis of an interaction between the effects of mTEA and tonotopic separation. For tonotopic separations smaller than 3 mm, we found clear evidence for an mTEA effect in two out of three conditions (i.e., T and SB, but not SA). For tonotopic separations of more than 7 mm (i.e., conditions LA and LB), we found little (condition LB) to no (condition LA) evidence for an mTEA effect; ITD sensitivity was nearly as good as predicted from optimal integration across electrodes.
To shed light on the origin of the mTEA effect, we compared ITD discrimination sensitivity with monaural rate-pitch discrimination sensitivity and did not find systematic differences between these two percepts. In fact, when pooled across all electrode-pair combinations, we even found evidence for the absence of the percept effect.
When pooled across percepts, we found evidence for an mTEA effect for all tonotopic separations smaller than 3 mm and evidence for the absence of an mTEA effect for tonotopic separations larger than about 7 mm. We conclude that channel interactions limit ITD-based perception for tonotopic separations up to at least about 3 mm. Future studies may attempt to determine the exact tonotopic separation (between 3 and 7 mm) for which the mTEA effect vanishes.
Overall, both the decreasing size of the mTEA effect with increasing tonotopic separation and the mTEA effect similarity between the binaural and monaural stimulation suggest that the mTEA effect is a peripheral monaural effect even when tested in a binaural ITD task. As practical implication, our results suggest that the stimulation delay between nearby and successively to encode a sound event-stimulated electrodes should be as short as possible.
Supplemental Material
sj-docx-1-tia-10.1177_23312165241271340 - Supplemental material for Effects of Monaural Temporal Electrode Asynchrony and Channel Interactions in Bilateral and Unilateral Cochlear-Implant Stimulation
Supplemental material, sj-docx-1-tia-10.1177_23312165241271340 for Effects of Monaural Temporal Electrode Asynchrony and Channel Interactions in Bilateral and Unilateral Cochlear-Implant Stimulation by Martin J. Lindenbeck, Piotr Majdak and Bernhard Laback in Trends in Hearing
Footnotes
Acknowledgments
We thank our CI listeners for their patience and commitment while conducting the experiments. We further thank Michael Mihocic, Tobias Harvey, and Marie-Luise Augsten for assisting with data collection as well as Michael Smithson for extensive discussions on confidence intervals for effect sizes. We thank the Institute of Ion Physics and Applied Physics of the Leopold-Franzens-University, Innsbruck, Austria, for providing the equipment for direct electric stimulation.
Author Contributions
MJL and BL primarily conceptualized and designed the study. MJL collected the data and performed the statistical analysis. MJL wrote the first draft of the manuscript. All authors contributed to manuscript revision, read, and approved the submitted version.
Data Availability Statement
The datasets generated during and/or analyzed during the current study are available from the corresponding author on reasonable request.
Declaration of Conflicting Interests
The authors declare that the research was conducted in the absence of any commercial or financial relationships that could be construed as a potential conflict of interest.
Funding
The authors disclosed receipt of the following financial support for the research, authorship, and/or publication of this article: MJL was supported by a DOC Fellowship of the Austrian Academy of Sciences (A-25606) and by the Dr. Anton Oelzelt-Newin Fund of the Austrian Academy of Sciences (A-100315). Additional support was provided to all authors by the Austrian Agency for International Cooperation in Education and Research (MULT 07/2020). Open access funding was provided by the Open Access Fund of the Austrian Academy of Sciences.
Supplemental material
Supplemental material for this article is available online.
Notes
References
Supplementary Material
Please find the following supplemental material available below.
For Open Access articles published under a Creative Commons License, all supplemental material carries the same license as the article it is associated with.
For non-Open Access articles published, all supplemental material carries a non-exclusive license, and permission requests for re-use of supplemental material or any part of supplemental material shall be sent directly to the copyright owner as specified in the copyright notice associated with the article.