
Abstract
Age-related hearing loss (ARHL) currently affects over 20 million adults in the U.S. and its prevalence is expected to increase as the population ages. However, little is known about the earliest manifestations of ARHL, including its influence on auditory function beyond the threshold of sensation. This work explores the effects of early aging on frequency selectivity (i.e., “tuning”), a critical feature of normal hearing function. Tuning is estimated using both behavioral and physiological measures—fast psychophysical tuning curves (fPTC), distortion product otoacoustic emission level ratio functions (DPOAE LRFs), and stimulus-frequency OAE (SFOAE) phase gradient delay. All three measures were selected because they have high potential for clinical translation but have not been compared directly in the same sample of ears. Results indicate that there may be subtle changes in tuning during early aging, even in ears with clinically normal audiometric thresholds. Additionally, there are notable differences in tuning estimates derived from the three measures. Psychophysical tuning estimates are highly variable and statistically significantly different from OAE-derived tuning estimates, suggesting that behavioral tuning is uniquely influenced by factors not affecting OAE-based tuning. Across all measures, there is considerable individual variability that warrants future investigation. Collectively, this work suggests that age-related auditory decline begins in relatively young ears (<60 years) and in the absence of traditionally defined “hearing loss.” These findings suggest the potential benefit of characterizing ARHL beyond threshold and establishing a gold standard for measuring frequency selectivity in humans.
Keywords
Introduction
Age-related hearing loss (ARHL) affects an estimated 20 + million Americans and is all but inevitable for those who live into and beyond their seventh decade of life (Reed et al., 2023). As a progressive and insidious disease, current and future treatment options will be most effective if ARHL is diagnosed as close as possible to its onset (McMahon et al., 2013). Despite this, little is known about the first manifestations of ARHL. For the past 60 + years, diagnostic audiology has focused heavily on threshold function across a limited range of frequencies—that is, how the auditory system responds to soft sounds presented in quiet. This focus ignores other fundamental properties of the auditory system and may help to explain why current clinical tools are often inadequate for detecting subtle signs of auditory change (Musiek et al., 2017). Here, we explore the impact of early aging beyond threshold and through an extended frequency range. Specifically, we examine auditory frequency selectivity (i.e., “tuning”) up to 16 kHz.
Frequency selectivity, also called frequency resolution or tuning, is the ability to distinguish between the individual components of a complex sound (Moore, 2013). Some evidence indicates that human auditory tuning is exceptional compared to other mammalian species (Sumner et al., 2018). However, the exact mechanisms behind this selectivity are still not fully understood. Most experimental evidence suggests that tuning fundamentally arises from the mechanical properties of the basilar membrane and is further refined by active cochlear properties (i.e., outer hair cells) that amplify the basilar membrane traveling wave (Brownell et al., 1985; Neely & Kim, 1983; Robles et al., 1986). Some have further suggested that tuning may also be refined by central auditory system (Møller, 2012). Whatever the precise mechanism(s), it is well-known that many of the cells that contribute to tuning—outer hair cells and auditory nerve fibers in particular—are uniquely vulnerable to damage from biological aging and other environmental insults (Fredelius et al., 1987; Furness, 2015; Kujawa & Liberman, 2006, 2009; Mahendrasingam et al., 2011; Schuknecht, 1964).
Thus, it is unsurprising that tuning and related processes have been shown to decline during aging and in the presence of hearing impairment (Glasberg & Moore, 1986; Lutman et al., 1991; Sommers & Gehr, 1998). Past work has demonstrated both broader tuning and reduced sensitivity in older ears (Matschke, 1991). Nonetheless, the extent to which this broadening occurs during early aging processes, and in the absence of significant threshold decline, is unknown. Some work suggests that changes in tuning in older ears are primarily attributable to hearing loss rather than age itself (Sommers & Humes, 1993), at least at standard clinical frequencies. However, there is opposing evidence that sensitivity and frequency selectivity may be independently affected by auditory insult. Specifically, Hicks and Bacon (1999) found significant changes in auditory filter bandwidths due to aspirin consumption; notably, these changes in tuning were not correlated with the amount of change in behavioral thresholds. Additionally, Badri et al. (2011) found broadened cochlear tuning in individuals with speech perception in noise deficits, even in the absence of elevated behavioral thresholds. This work highlights the potential subclinical nature of changes in tuning as well as its functional impacts. Understanding if and how tuning changes with age may inform diagnostic procedures, hearing aid processing strategies, as well as treatment options—particularly when pharmacological and genetic therapies for treating hearing dysfunction become a clinical reality.
In laboratory animals, tuning is typically derived via measures of single auditory nerve fibers and/or by examining basilar membrane motion at a single location (Kiang et al., 1967; Rhode, 1971). While these methods provide fundamental metric of tuning, they are not feasible in humans due to the invasiveness of the procedures. This has spurred a decades-long quest to find an alternative clinically viable assessment. Prior work has focused heavily on understanding the validity and utility of behavioral assessments of tuning. However, these types of behavioral assessments are notoriously time-consuming and difficult for participants/patients to complete (Sęk & Moore, 2011). Other work has examined the use of otoacoustic emissions (OAEs) for the assessment of cochlear tuning. OAEs are low-level sounds that arise from active cochlear mechanisms that can be measured in the ear canal (Kemp, 1978). As cochlear tuning and OAEs both arise from basilar membrane mechanics and active cochlear processes, OAEs have been demonstrated as a useful, non-invasive metric of tuning that can be measured relatively efficiently (e.g., Brown et al., 1993; Charaziak et al., 2013; Gorga et al., 2002, 2011; Joris et al., 2011; Keefe et al., 2008; Rasetshwane et al., 2019; Shera et al., 2002, 2010; Wilson et al., 2020, 2021).
Here, we assess cochlear tuning using three non-invasive methods that each have high potential for clinical translation. These methods include: (1) distortion product (DP)OAE level ratio functions (LRF), (2) stimulus-frequency (SF)OAE phase-gradient delay, and (3) behavioral fast psychophysical tuning curves (fPTC). To date, these three methods have not been directly compared within ears. We make these comparisons in ears with clinically normal hearing (audiometric thresholds ≤ 25 dB HL at octave and interoctave frequencies from .25 to 8 kHz) across three age groups (18–23, 30–39, and 40 + years). These age groups were established a priori based on previous work from our laboratory that showed nonlinear declines in DPOAE levels in a cross-sectional study (Glavin et al., 2021). These declines first appeared in ears aged 30–39 years and worsened with increasing decade. The groups here were therefore selected to explore the effects of age on other metrics of auditory function (including tuning) across young (baseline), early-aged, and middle-aged ears, respectively. Additionally, we measure tuning in all methods through an extended-high frequency range (up to 16 kHz), where age-related auditory decline typically begins (Bunch, 1929; Lee et al., 2012; Northern et al., 1972; Wiley et al., 1998). Our goals were two-fold: (1) to characterize cochlear tuning during early aging in the absence of clinically significant threshold decline; and (2) to compare the three methods of assessing tuning in these populations, toward understanding clinical utility.
Though all three measures have been used to derive tuning estimates, fundamental differences between them may influence their relative interpretation as well as their clinical utility. Broadly, behavioral tuning measures may be influenced by filtering beyond outer hair cells that would not affect OAEs. This would include inner hair cell degradation (e.g., Lopez-Poveda & Johannesen, 2012), selective auditory nerve fiber damage (Kujawa & Liberman, 2006, 2009), and/or more central processes. Additionally, behavioral tuning estimates can vary significantly depending upon the selected measurement procedure. Specifically, forward-masked PTCs may provide a sharper estimate of tuning that is uncomplicated by cochlear interactions between the masker and the probe (Heinz et al., 2002; Oxenham & Shera, 2003; Shera et al., 2002). However, simultaneously masked PTCs more closely resemble at least some OAE-derived metrics of tuning (e.g., OAE suppression tuning curves) (Charaziak et al., 2013). Nevertheless, the relationship between PTCs and OAE-derived tuning estimates may be complicated. For example, Wilson et al. (2020) found a statistically significant correlation between fPTC and an SFOAE delay-based tuning estimate, but only at 4 kHz (and not at 1 kHz). For these reasons and toward the goal of understanding clinical utility, we selected a fPTC, which employs simultaneous masking, as the behavioral measure here.
Additionally, differences between our two selected OAE measures—DPOAEs and SFOAEs—could affect their respective derived tuning metrics. First, DPOAEs are generally assumed to arise from a broader cochlear region than SFOAEs. DPOAEs are evoked using two tones and arise primarily from their mechanical overlap (in contrast to a single tone for SFOAEs). In addition, the energy contributing to DPOAEs arises from two components (in contrast to a single-source generation mechanism for SFOAEs). The mechanistic differences between these two emission types manifest empirically: these emissions have different phase behaviors and are differentially affected by aging (Abdala et al., 2018; Kemp, 1979; Knight & Kemp, 2001; Zweig & Shera, 1995). Some have suggested that, for these reasons, DPOAE metrics may generally underestimate cochlear tuning (Charaziak et al., 2013). Conversely, as SFOAEs appear to be less affected by aging than DPOAEs, sometimes referred to as a paradoxical “preservation” of SFOAEs, they may overestimate cochlear tuning in early-aged ears (Abdala et al., 2018). Additionally, SFOAEs may be less sensitive to changes in tuning that occur from areas beyond the characteristic frequency place (e.g., tip-to-tail ratios; Gorga et al., 2003).
Methods
Participants and General Procedure
The data presented here are from 59 participants (36 F, 22 M, 1 non-binary/third gender). Participants represented three age groups: 18–23 years (M = 21.19, SD = 1.47), 30–39 years (M = 33.78, SD = 3.42), and 40 + years (M = 51.27, SD = 5.35). Participants self-identified as white (39 participants), Asian (10 participants), Black or African American (7 participants), or as more than one race (2 participants). Additionally, four participants identified their ethnicity as Hispanic or Latino. One participant chose not to disclose their race or ethnicity. Initial inclusion criteria for the study required that participants have clinically normal hearing (audiometric thresholds ≤ 25 dB HL from .25 to 8 kHz bilaterally). However, because of difficulty recruiting older individuals meeting this criterion, three participants in the oldest age group (40 + years) had either one or two thresholds > 25 dB HL but ≤ 35 dB HL in the test ear. Beyond this inclusion criterion, all participants also had no self-reported history of significant noise exposure or otologic disease/surgery, as well as an unremarkable otoscopic examination and immittance results within normal limits.
In addition to the protocols described above, cochlear tuning was assessed from each participant using three methods: DPOAE level ratio functions (LRF), SFOAE phase gradient delay, and fast psychophysical tuning curves (fPTC). All metrics of tuning were assessed in the same single test ear of each participant. This test ear was randomly selected for most participants (31 R, 28 L). For three participants who had one or more audiometric thresholds > 25 dB HL (i.e., outside of the range of clinically “normal” hearing), the better ear was selected as the test ear.
Instrumentation and Calibration
All measures were collected in a double-walled sound-treated booth. Standard audiometric thresholds were measured at octave and interoctave frequencies from .25 to 8 kHz bilaterally. Thresholds from approximately half of participants were measured using Shoebox Audiometry, which was self-administered by the participants on an iPad with E-A-RTONE 3A transducers coupled to the ear with foam eartips. Thresholds from remaining participants were measured using a Madsen Itera 2 audiometer with GN Otometrics (10 Ω) insert earphones. Disposable foam insert eartips were used to couple the transducers to the ear and the Hughson-Westlake procedure (Carhart & Jerger, 1959) was followed.
Signal generation and recording for behavioral tracking (thresholds measured through 16 kHz) and all tuning measures were done on a PC running Windows 10, with an RME Fireface UCX II 24-bit audio interface used for A/D and D/A conversion. All signals were routed to an ER-10X OAE probe (Interacoustics, Denmark; formerly Etymotic Research, Elk Grove Village, IL) which was coupled to the test ear of each participant using disposable Sanibel™ ear tips. All OAE signal generation and recording was controlled through custom Auditory Research Laboratory Auditory software (ARLas; Shawn S. Goodman) run through MATLAB. Signal generation and recording for fPTCs was controlled through the publicly available Psychoacoustics software package (version 1.0.41.0; Sęk & Moore, 2020). Behavioral tracking threshold stimuli were generated through custom MATLAB scripts; interested readers are referred to Lee et al. (2012) for a detailed description of this procedure. Stimuli for all measures were calibrated to forward pressure level (dB FPL) to minimize the effects of standing waves in the ear canal (for a review, see Scheperle et al., 2008). In the Psychoacoustics software, this was achieved by adjusting the probe stimulus at each test frequency for an individual participant based on their unique SPL to FPL transfer function obtained during in-situ calibration.
DPOAE Level Ratio Functions (LRF)
When measured across stimulus ratios (i.e., f2/f1), DPOAEs exhibit a bandpass shape—termed a level ratio function—that is thought to reflect cochlear tuning (Brown et al., 1993; Harris et al., 1989; Wilson et al., 2021). The peak of the LRF occurs at a ratio where the two evoking stimulus tones optimally overlap on the basilar membrane to produce the largest distortion product. The minima of the function occur where the stimuli are too spatially separated to produce distortion (at high ratios) and are too spatially overlapping (at ratios near 1), respectively; the latter scenario is thought to lead to destructive phase interference and/or suppression. To measure LRFs, f2 was fixed in frequency at 2, 4, 8, 10, 12.5, 14, and 16 kHz. f1 swept continuously from f2/f1 = 1.5–1.05, for an entire f1 sweep duration of 8 s. The number of repeated sweeps varied per frequency to maximize the signal-to-noise ratio (SNR) at higher test frequencies: 24 repetitions were used for f2 ≤ 8 kHz; 32 for f2 = 10 and 12.5 kHz, and 40 for f2 ≥ 14 kHz. The stimulus level combination (L1/L2) was set to 65/55 dB FPL for all test frequencies. While cochlear tuning is sharper at lower stimulus levels (e.g., Robles & Ruggero, 2001), Wilson et al. (2021) found that primary level differences (e.g., 65/55 dB FPL vs. 55/40 dB FPL) had only slight effects on LRF tuning estimates. Thus, we selected the higher-level combination to maximize the SNR of the LRFs. The limitations of this approach, and the general effects of stimulus level on tuning, are further explored in the Discussion.
DPOAE level was estimated using the least-squares fit method (Long & Talmadge, 1997). After level estimates were obtained, LRF data for each participant at each f2 frequency were smoothed in MATLAB using the smooth function (loess method, 70% span). After smoothing, the tip of the LRF was determined using the findpeaks function in MATLAB; the NPeaks parameter was set to 1 to select only the maximum peak of the function. DPOAE data along the LRF that were < -25 dB SPL in level were removed and LRFs with fewer than 25% of points ≥ -25 dB SPL were discarded. Next, an SNR check was performed: LRFs with fewer than 25% of points with an SNR ≥ 3 dB were also discarded. Some LRFs had extra inflection points at the extreme high- and low-ratios. To remove most inflection points, the minimum points of both the high- and low-ratio side of the LRF were defined, and DPOAE levels above the minimums at the extreme ends of the function were discarded. A mirroring procedure was performed on all LRF data to minimize the effects of two-tone suppression, which may artificially sharpen tuning on the high-frequency (low ratio) side of the curve. This procedure is fully described in Wilson et al. (2021). Briefly, the procedure “mirrors” the high ratio side of the curve—i.e., the portion of the curve lower in frequency than the tip frequency—to the low ratio side of the curve. Mirrored LRFs were only included in the final data set for any given frequency condition in lieu of their unmirrored counterparts if the estimated Qerb (a metric of tuning, described in more detail below) was lower in the mirrored than unmirrored condition. This is because the intent of the mirroring procedure was to minimize the effects of two-tone suppression and wave interference at ratios where f2 and f1 were close in frequency. A decrease in the Qerb after mirroring suggests an artificial sharpening of the unmirrored estimate of Qerb, perhaps due to two-tone suppression or wave interference. In some cases, an increase in the Qerb was observed after mirroring. This was unexpected and the unmirrored data were used for analysis in these instances.
Qerb is a dimensionless metric of auditory tuning that is defined as the f /ERB, where f is the center frequency of the filter and ERB is the equivalent rectangular bandwidth of the filter. The latter estimates the bandwidth of rectangular filter that has the same peak and passes the same power with a flat spectrum input. To estimate Qerb, DPOAE level data were first converted to power units. The maximum height h of the LRF was found using the max function in MATLAB. The area under the curve, a, was calculated using the trapz function in MATLAB. The equivalent rectangular bandwidth (ERB) was calculated as ERB = a/h. Next, Qerb was derived by dividing the frequency of the tip of the LRF by the ERB, i.e., Qerb = fc /ERB.
In addition to the conventional tuning factor, the peak level of the LRF (i.e., maximum level value of the DPOAE, in dB SPL) was derived. Peaks were estimated in MATLAB by finding the DPOAE level value at the peak of the function.
Fast Psychophysical Tuning Curves
For fPTC measurements, participants were seated comfortably in a chair and asked to listen for a probe tone in the presence of a narrowband masker noise, as described in more detail below. They were instructed to press and hold the spacebar on a keyboard when they were able to hear the probe while ignoring the noise. The frequency of the probe (fp) varied to match the LRF f2 frequencies; that is, fp = 2, 4, 8, 10, 12.5, 14, and 16 kHz. For all probe frequencies, the duration of the probe was set to 0.2 s, with a 0.2 s interval between signal pulses (Sęk & Moore, 2011). The probe level for a given participant was calculated as their behavioral tracking threshold (in dB FPL, described in Instrumentation and Calibration) at fp + 10 dB. At some frequencies, some participants reported that they could not hear the probe at +10 dB SL. In these cases, the probe level was increased in 5 dB steps until the participant was able to hear the probe, or until +20 dB SL was reached, at which point that test frequency was skipped. For fp < 10 kHz, the masker swept downward in frequency from 1.5fp to 0.5fp (Charaziak et al., 2012; Sęk et al., 2005). For fp ≥ 10 kHz, the masker swept downward in frequency from 1.3fp to 0.7fp (Buus et al., 1986). The bandwidth of the masker was set to 320 Hz, as all probe frequencies were greater than 1.5 kHz (Baiduc et al., 2014; Sęk et al., 2005). The noise duration was set to 240 s (Sęk & Moore, 2011). The noise was initially set to 50 dB SPL and varied at a rate of 2 dB/s (Sęk et al., 2005).
To estimate Qerb for PTCs, the raw PTC data were first smoothed in MATLAB using the smooth function (loess method, 25% span; Charaziak et al., 2012). After smoothing, the tip of the tuning curve (ftip) was identified as the frequency value at the minimum of the function; if multiple tips were identified, the average of those frequencies was taken. The tuning curve data were then interpolated with an equally spaced frequency vector, flipped upside-down, and converted into power units. The Qerb was calculated by first determining the ERB using the same procedure as previously described for the DPOAE LRF data (ERB = area/height, where area was determined using the trapz function and height was defined as the maximum of the curve). Qerb was calculated as ftip / ERB.
SFOAE Phase Gradient Delay
SFOAEs were measured in a frequency-sweep paradigm using the suppressor method (Kalluri & Shera, 2013; Shera & Guinan, 1999); specifically, every other measurement interval contained a probe and a suppressor tone, while the remaining intervals contained only a probe tone. The varying intervals were then vector subtracted, after which the residual SFOAE remains. The probe and suppressor both swept in upward frequency (fp = 0.5–20 kHz; fs = 47 Hz below fp) at a rate of 1 octave per second. The stimulus levels were set to Ls = 60 dB FPL and Lp = 40 dB FPL, respectively. SFOAE levels and phase were estimated using sliding time analysis windows with a least-squares fitting (LSF) procedure. Prior to unwrapping SFOAE phase, data points where the SNR was < 3 dB were excluded. SFOAE phase was then unwrapped, expressed in cycles, and the phase of the probe was subtracted from the SFOAE phase.
Qerb estimates from SFOAEs were obtained at the same f2 and fp frequencies assessed by DPOAE LRF and fPTC, respectively (fc = 2, 4, 8, 10, 12.5, 14, and 16 kHz). The methods used to estimate Qerb for SFOAEs generally follow those used by Wilson et al. (2020). First, the SFOAE phase data within ¼ of an octave around each center frequency (fc) of interest were selected. The phase slope at each frequency was estimated by fitting the phase data (Φ, in cycles) linearly using the polyfit function in MATLAB. The phase-gradient delay (in ms) at each frequency, τ, was calculated as the negative slope of the SFOAE phase using the polyder function in MATLAB and then expressed in equivalent number of periods (NSFOAE, where NSFOAE = τ ×fc). Finally, Qerb was calculated as Qerb = r × NSFOAE, where r = 1.25 and is a species-invariant tuning ratio (Alkhairy & Shera, 2019; Shera et al., 2010). We also calculated Qerb using a model that supposes that SFOAE phase-gradient delay is accumulated over a wide basal region (Moleti & Sisto, 2016; Sisto et al., 2015); however, the estimation method did not affect results and therefore only one is shown here.
Statistical Analysis
All analyses were performed in the R statistical software (v. 4.4.0). The primary goals here were to (1) characterize if, and how, tuning changes as a function of early aging, and (2) explore differences between tuning estimates derived from three distinct measures. Additionally, we expected frequency-specific effects. Toward the first goal, we ran multiple regression analyses to explore the effects of age and frequency on tuning (Qerb) within each measurement type (LRF, SFOAE, and fPTC, respectively). Toward both goals, we then pooled the data and compared the effects of age, measurement method, and frequency on tuning (Qerb) while controlling for behavioral thresholds. As appropriate, we completed post-hoc analyses using the {emmeans} package. Specifically, we examined the estimated marginal age trends across the three measurement methods. As a tertiary analysis, we explored age group differences in behavioral thresholds using a two-way ANOVA and performed post-hoc pairwise comparisons with Bonferroni correction.
Results
Audiometric and Behavioral Tracking Thresholds
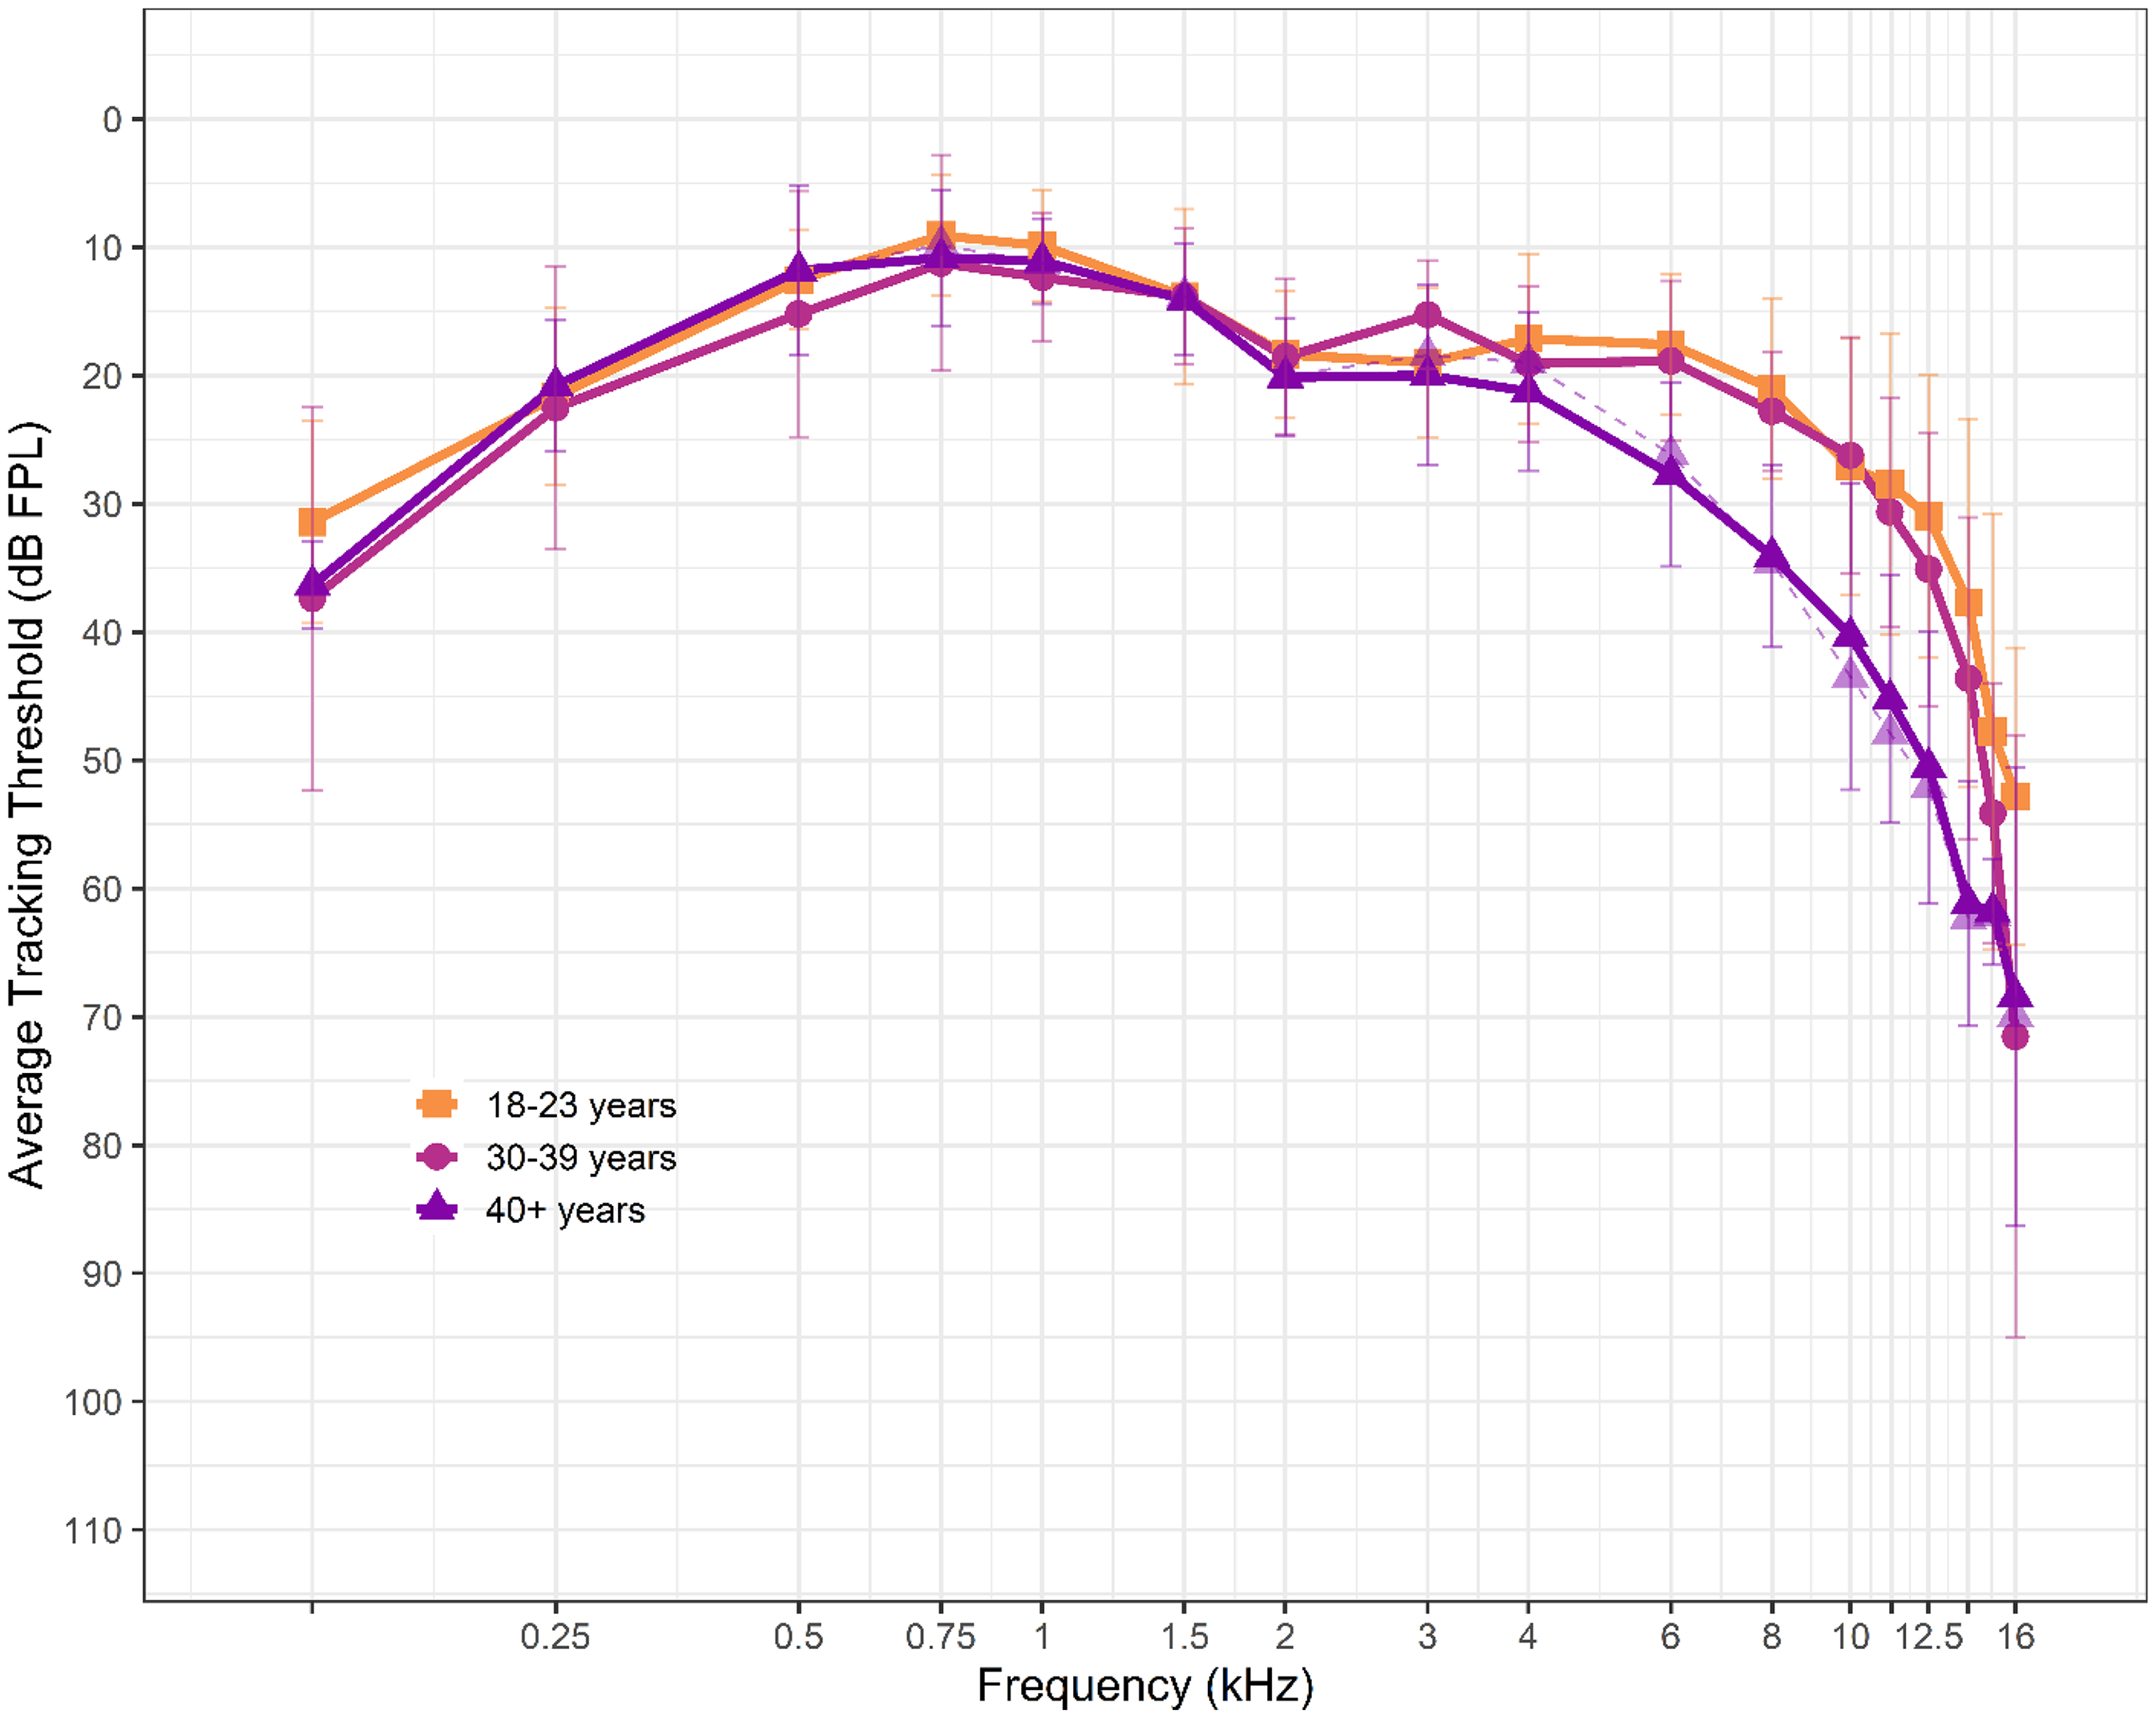
Average audiometric thresholds from the test ear of each of the three participant age groups are shown in Figure 1 as a function of frequency. Aside from the three participants described in the Methods section, all participants had thresholds ≤ 25 dB HL from .25 to 8 kHz. Average thresholds from the oldest age group (40 + years) are shown twice: once with all participant data from that age group (triangles connected with solid lines) and once after the test ear thresholds of the three participants with elevated thresholds were removed (transparent triangles connected with dashed lines).

Average audiometric thresholds in the test ear of participants at octave and interoctave frequencies from 250 to 8000 Hz. Different symbols (squares, circles, and triangles) represent each age group: 18–23, 30–39, and 40 + years, respectively. Error bars represent +/- one standard deviation from the mean. The lighter shaded, dashed purple line with triangles shows the average audiogram of the oldest age group after removing the three participants with elevated (> 25 dB HL) audiometric thresholds. The dotted line in the main figure represents a standard clinical cutoff for normal hearing (25 dB HL). The oldest age group (40 + years) had statistically significantly higher audiometric thresholds than the youngest two groups. However, all participants—with the exception of the three mentioned—had clinically defined normal hearing. The inset displays the same data on a condensed scale for easier visibility of group differences.
A two-way ANOVA (frequency × age group) was performed to evaluate the effects of age group and frequency on audiometric threshold, after checking that audiometric threshold data met normality and homogeneity of variance assumptions. Using a significance criterion of p < 0.05, there was a statistically significant main effect of frequency (F(8, 504) = 5.88, p < 0.001, partial η2 = 0.06) and a statistically significant main effect of age group (F(2, 504) = 98.76, p < 0.001, partial η2 = 0.25). There was also a significant interaction between frequency and group (F(16, 504) = 1.76, p = 0.03, partial η2 = 0.04). Post-hoc pairwise comparisons using a Bonferroni correction indicated statistically significant differences in audiometric thresholds between the youngest two groups (18–23 and 30–39 years, respectively) and the oldest group (40 + years; p < 0.001). There were no statistically significant differences in threshold between the youngest two groups. The effect size of threshold differences between groups was also estimated using Cohen's d. The effect size was large both for differences between the youngest group (18–23 years) and the oldest group (40 + years; d = -1.16) and for differences between the 30 and 39 year group and the oldest group (d = -1.37).
Average behavioral tracking thresholds up to 16 kHz are shown in Figure 2 across age groups. As with audiometric thresholds, tracking thresholds for the oldest age group are displayed twice. The transparent triangles connected with dashed lines show the test ear thresholds averaged after the three participants with elevated thresholds were removed. The oldest age group has notably elevated thresholds compared to the youngest groups, particularly above 4 kHz.
Average behavioral tracking thresholds in the test ear of participants from 0.125 to 16 kHz. Different symbols (squares, circles, and triangles) represent each age group: 18–23, 30–39, and 40 + years, respectively. Error bars represent +/- one standard deviation from the mean. The lighter shaded, dashed purple line with triangles shows the average thresholds of the oldest age group after removing the three participants with elevated (>25 dB HL) audiometric thresholds.
DPOAE Level Ratio Functions (LRF)
Representative LRFs—both unmirrored (solid lines) and mirrored (dashed lines)—from one participant in the youngest age group (18–23 years) are shown across frequency panels in Figure 3. The derived Qerb values for both unmirrored and mirrored LRFs are displayed at the top of each panel. This figure highlights the bandpass shape of LRFs as well as the mirroring procedure. At some frequencies (e.g., f2 = 2, 8, 10, and 12.5 kHz in this example), the mirroring procedure widens the DPOAE LRF. This is when the procedure was, presumably, effective at reducing two-tone suppression on the low ratio (high frequency) side of the LRF; the curve broadens and the derived Qerb is lower after the mirroring procedure. At other frequencies, the effect of mirroring is negligible or reversed. The average difference in Qerb between unmirrored and mirrored conditions (across participants) was always less than 2.

Representative DPOAE level ratio functions (LRF) from an exemplar participant in the youngest age group (18–23 years) across f 2 frequencies. The solid lines represent unmirrored LRFs after smoothing and processing. The dashed lines represent the same LRFs after completing the mirroring procedure. The goal of the mirroring procedure was to mitigate the effects of two-tone suppression on the low ratio (high frequency) side of the curve, where f1 approaches f2 in frequency. Qerb values from unmirrored and mirrored conditions are displayed at the top of each panel. Mirrored LRFs were only included in the final set of data if the Qerb was lower than its unmirrored counterpart for the same condition.
After the cleaning procedures described in the Methods section, LRFs from 55 participants were available for further analysis, all of which are shown in Figure 4 across f2 frequencies and age groups. These data contain only an unmirrored or a mirrored LRF for each participant at each condition, depending on which method yielded a lower Qerb value. The thin lines display individual LRFs; the thicker lines show the loess-fit (80% span) data for each condition. Empty panels indicate that clean data were not available for that condition. There is noticeable variability in LRFs, even within an age group and frequency condition. Additionally, very few individuals in the oldest two age groups (30–39 years and 40 + years) had usable LRFs at or above 10 kHz.
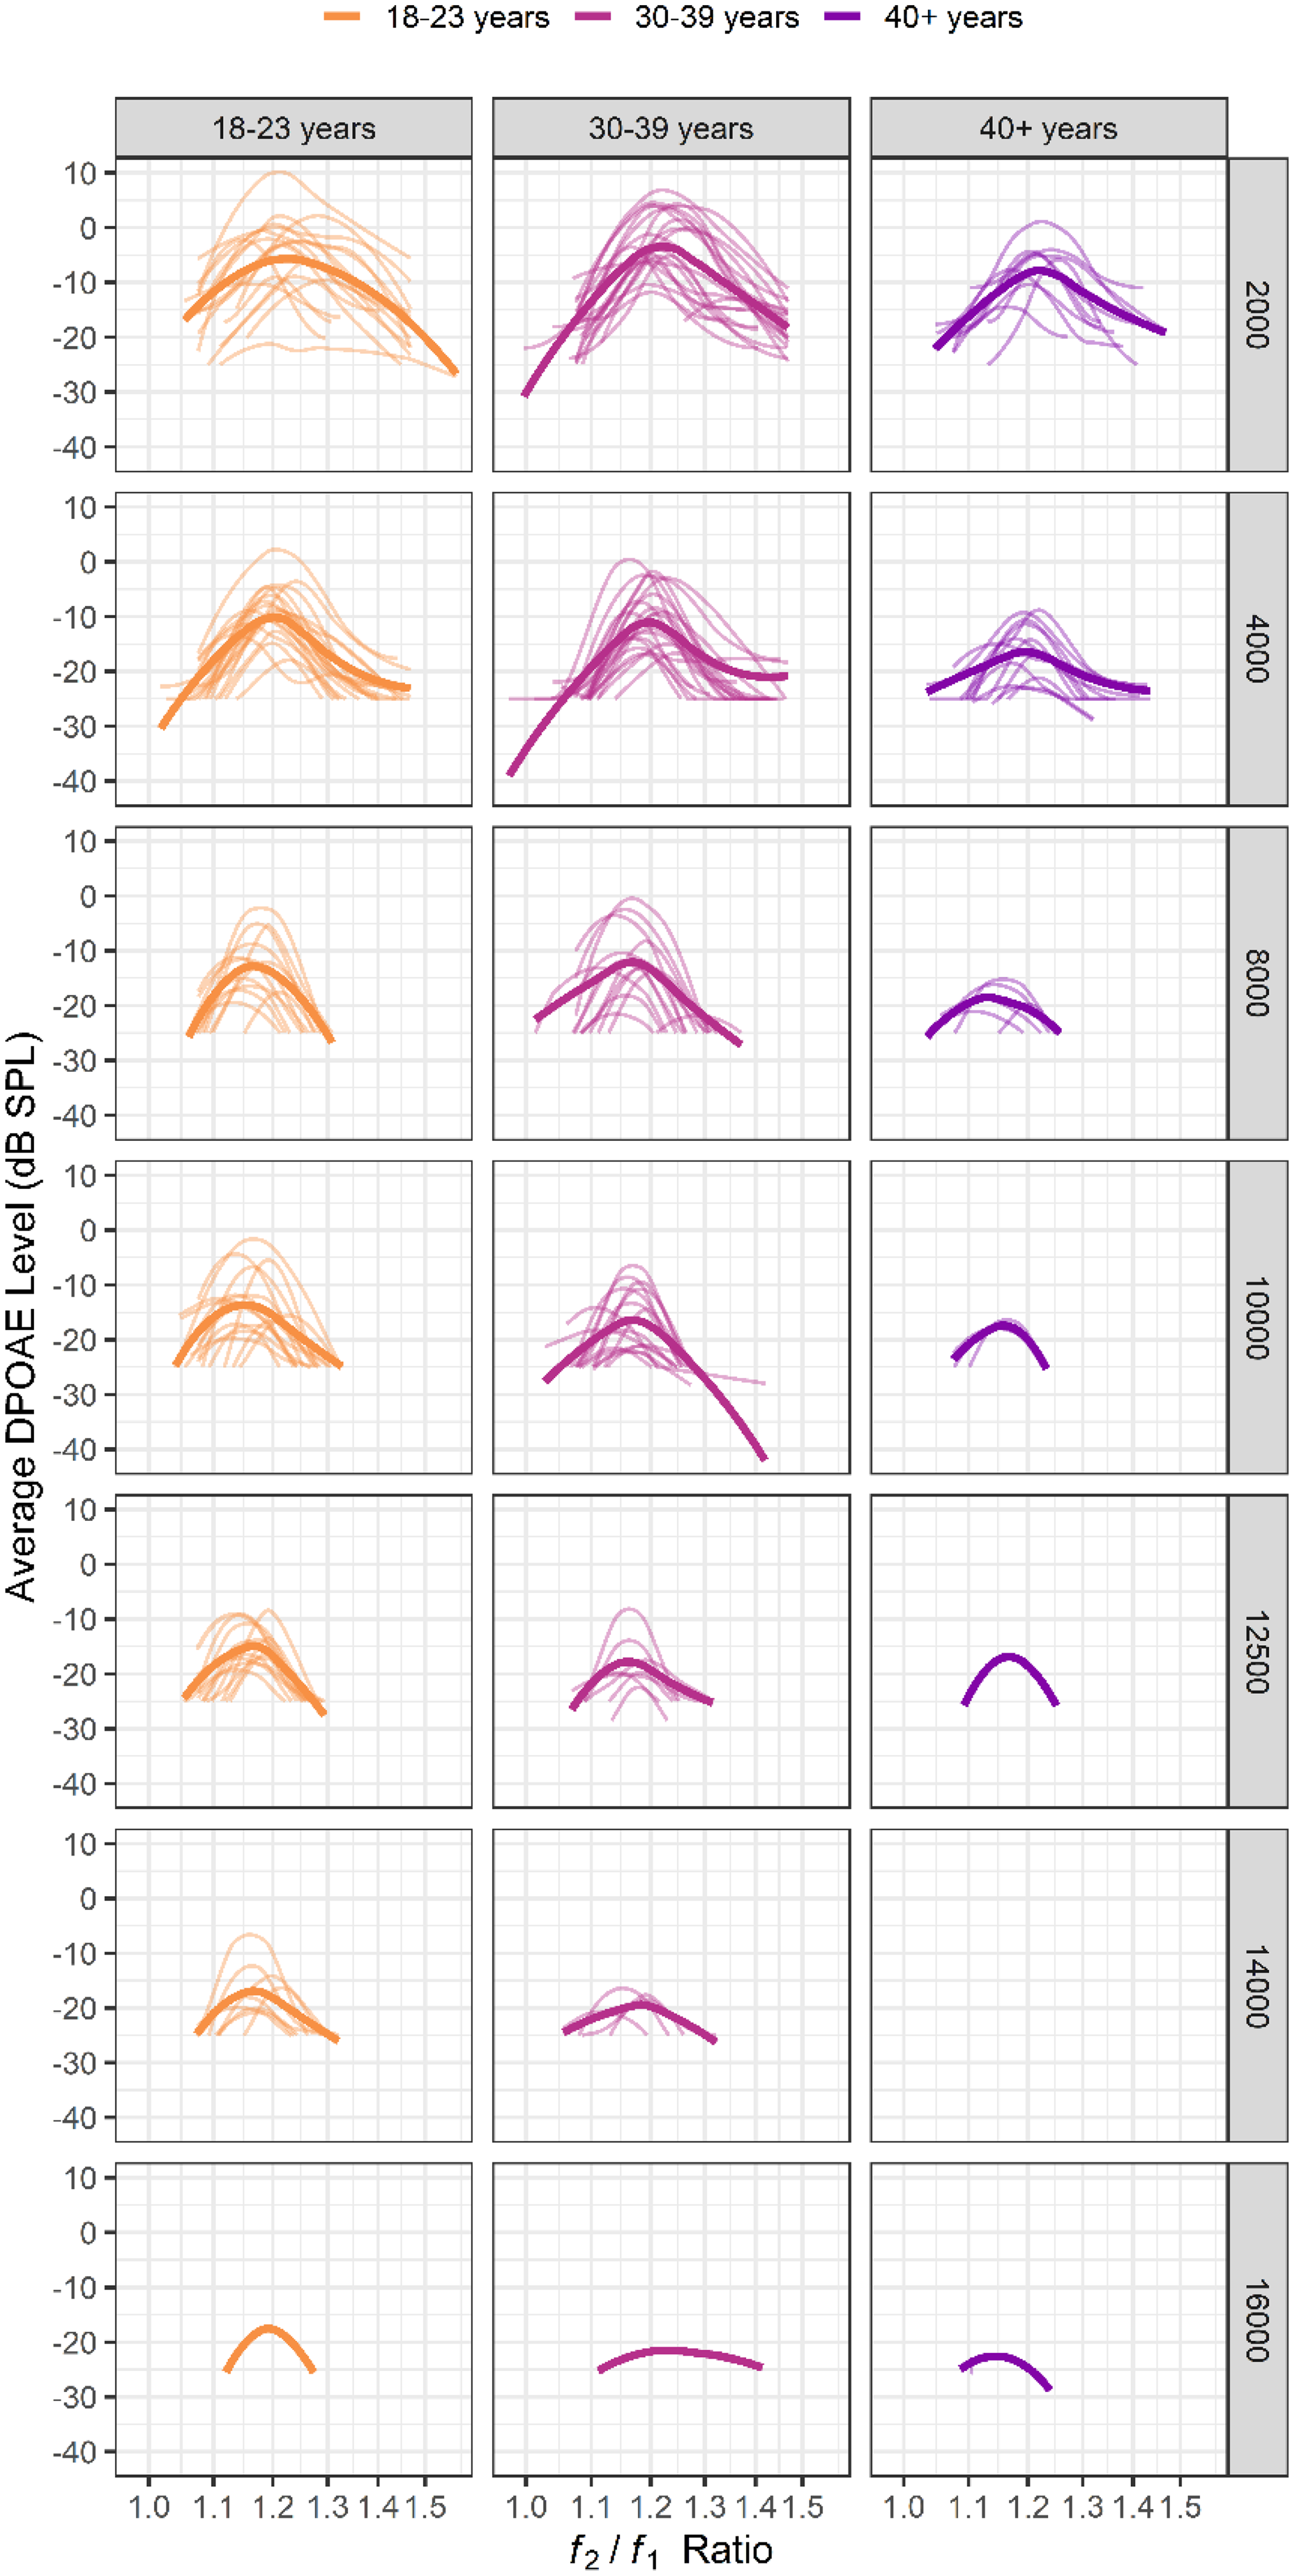
DPOAE level ratio functions (LRF) shown across age groups and f 2 frequencies. Thin lines represent LRFs from individual participants; thicker lines represent a loess fit (80% span) to the data. Generally, fewer LRFs were available for analysis as frequency increased, particularly for the oldest two age groups (30–39 and 40 + years). There is variability in the shape and peak of the LRFs across individuals.
Derived Qerb values are displayed in Figure 5 as a function of frequency and age group. Unique points indicate Qerb values derived from each participant and are shaped according to age group. The three thicker lines show a linear fit to the data from each age group across frequencies. On average, all age groups have tuning factors that increase (i.e., sharpen) as a function of frequency, though the youngest two groups do so at a slightly faster rate than the oldest. After controlling for audiometric pure tone average (PTA) at 0.5, 1, and 2 kHz, the estimated slopes (ΔQerb with frequency in Hz) for each age group are 0.0002, 0.0001, and 0.00002, respectively. The thinner dashed line closest to the bottom of the figure represents loess-fit Qerb values from DPOAE LRF data at a comparable stimulus level combination (62/52 dB FPL) from Wilson et al. (2021). The error bars around this line represent one standard deviation around the mean data from the same study. A multiple linear regression analysis was used to examine the effects of frequency, age, and their interaction on LRF-derived tuning after controlling for PTA. While the overall model was statistically significant F(4, 187) = 3.35, p = 0.01, it only explained ∼5% of the variance in Qerb (R2 = 0.07; adjusted R2 = 0.05). There was a statistically significant main effect of frequency (estimate = 0.0003 [SEM = 0.0002], p = 0.04) on the tuning estimate. However, neither the main effect of age (estimate = 0.03 [SEM = 0.04], p = 0.48), the main effect of PTA (estimate = 0.02 [SEM = 0.06], p = 0.80), nor the interaction between frequency and age (estimate = 0.00 [SEM = 0.00], p = 0.30) were significant.
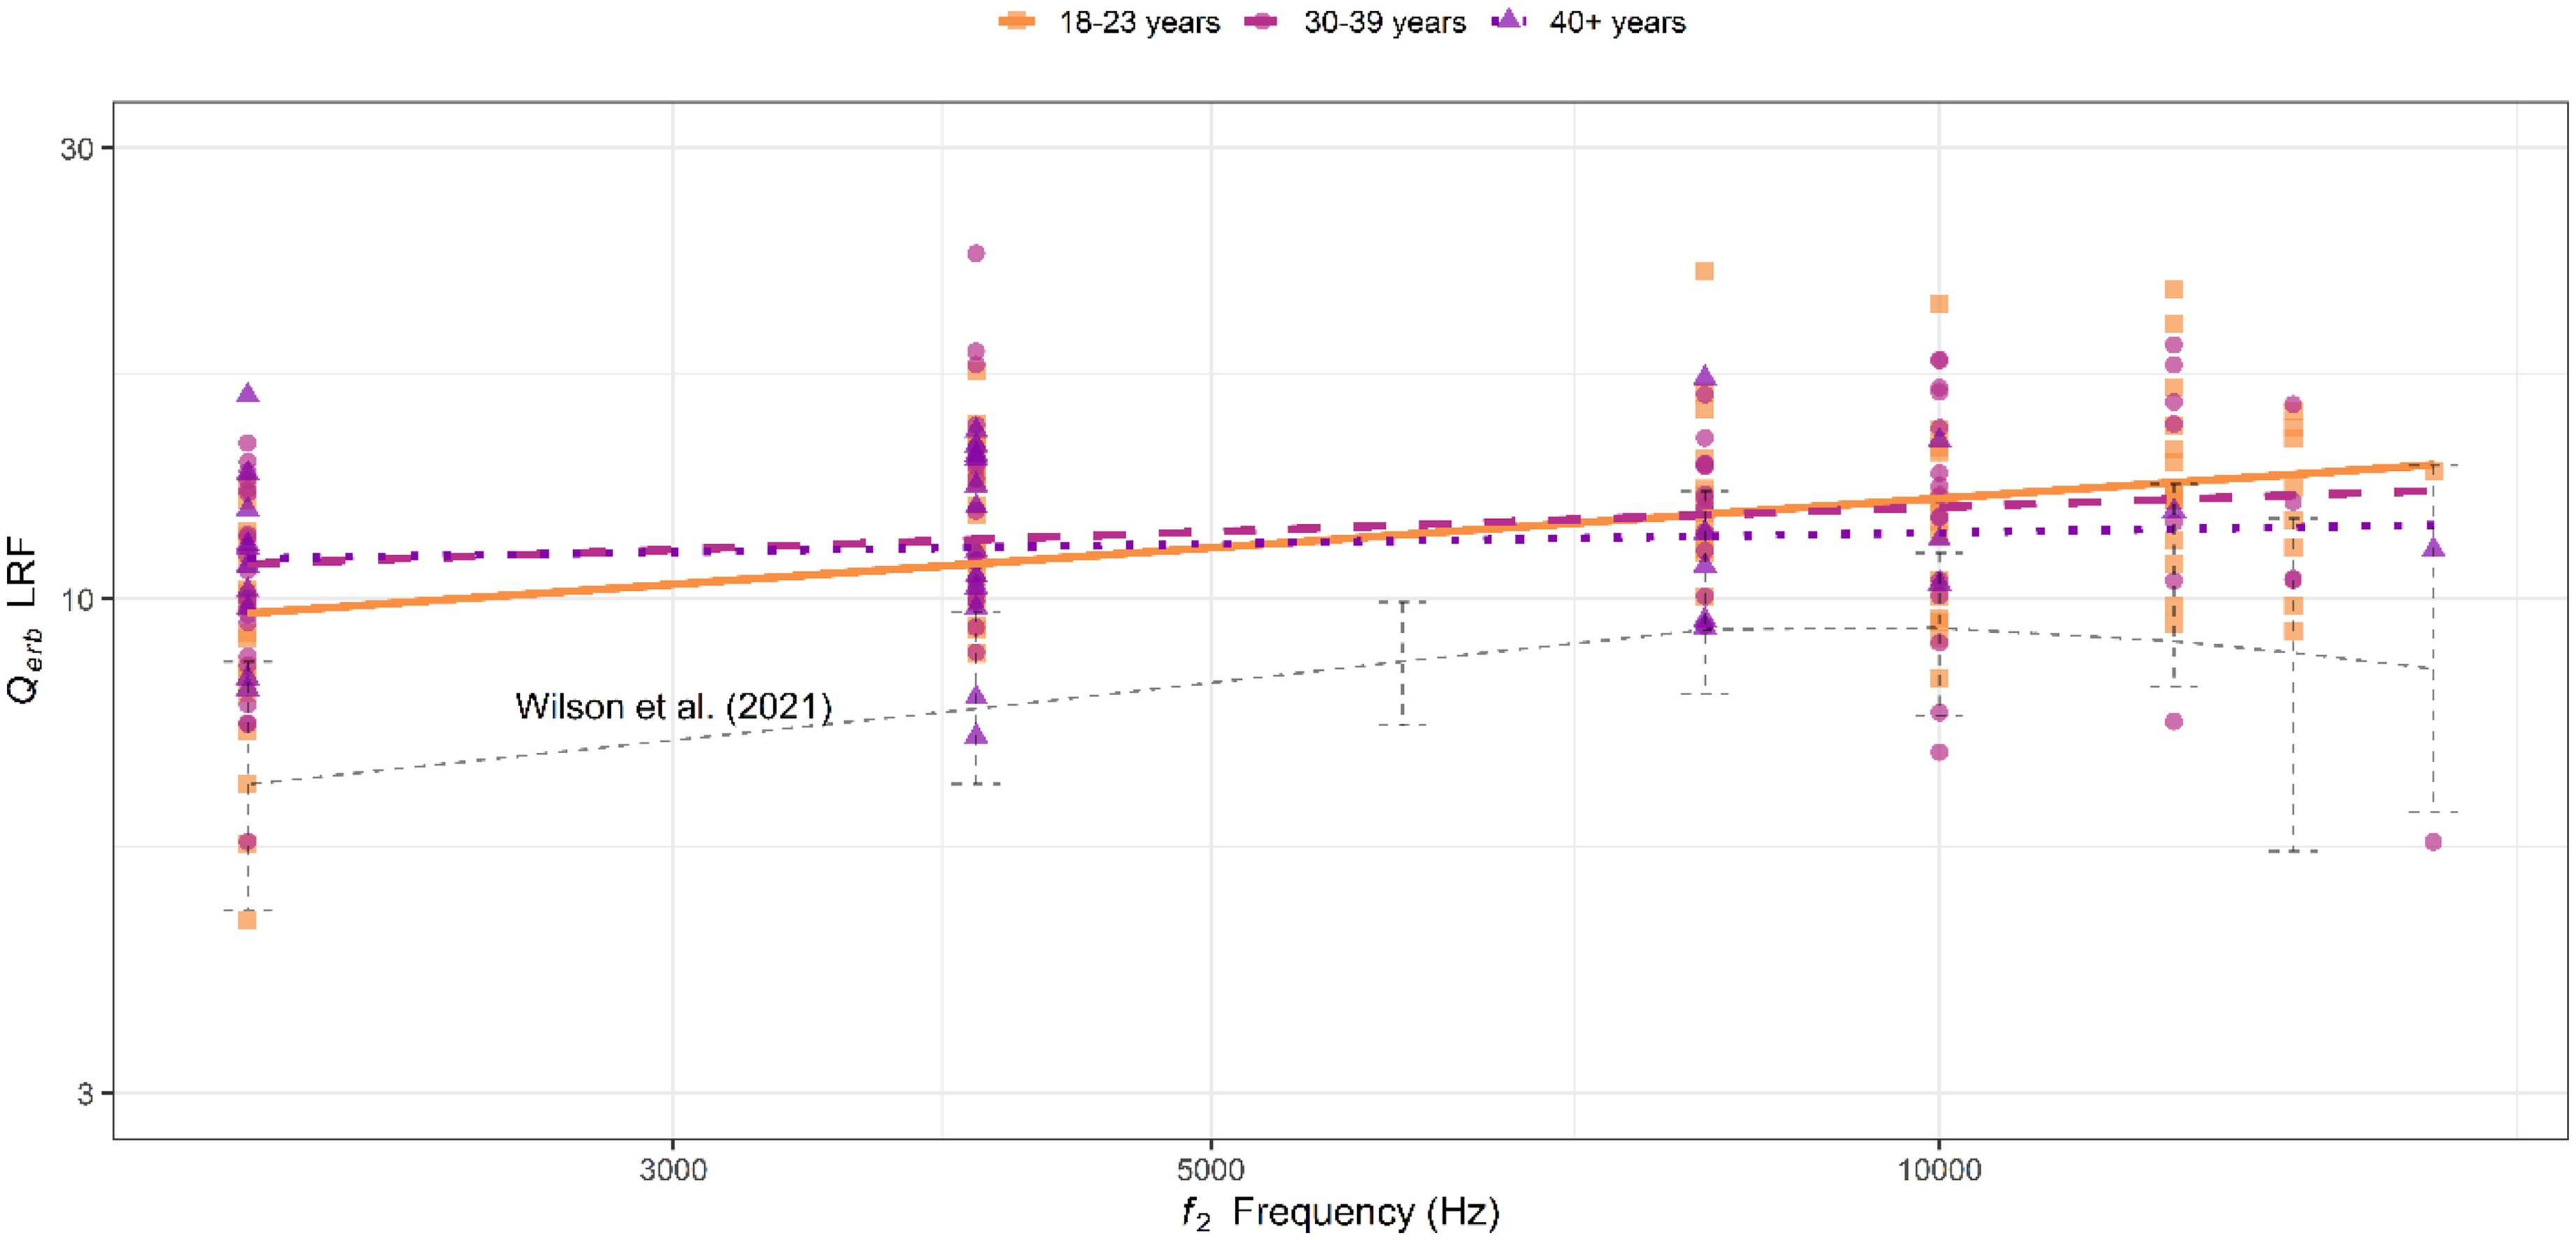
Estimated tuning factors (Qerb) across f 2 frequencies from DPOAE LRF. Different symbols (squares, circles, and triangles, respectively) represent individual tuning estimates from each age group. The lines (solid, dashed, and dotted) represent loess fits to the tuning estimates derived from each age group. The thinner dashed line closer to the bottom of the figure represents the loess fit to tuning estimates derived from DPOAE LRF in Wilson et al. (2021). There are subtle declines in tuning with age, particularly for the oldest group (40 + years), however, these were not statistically significant. Additionally, Qerb estimates here are notably higher than those from Wilson et al. (2021). Potential reasons for this are mentioned in the Discussion, but sampling variability may be a significant factor.
To further explore the tuning phenomenon captured by the DPOAE LRF, we examined the peak level values of each LRF (in dB SPL). These are shown as boxplots in Figure 6 as a function of age group and frequency. Peak level values decrease as a function of frequency for all age groups. Additionally, the peak level values of the oldest age group (40 + years) are lower than those of the youngest two groups. However, these trends were not statistically significant. A linear regression analysis was performed to examine the effect of age, f2 frequency, and PTA on the peak of the DPOAE LRF. With a significance criterion set to 0.05, the model was statistically significant F(4,186) = 34.47, p < 0.001 and explained approximately 41% of the variance in DPOAE LRF peak (adjusted R2 = 0.41). Age was not a statistically significant predictor of peak value (estimate = -0.12 [SEM = 0.07], p = 0.09) after controlling for behavioral thresholds via PTA.

Boxplots of the estimated peak level values of DPOAE LRFs (in dB SPL) shown across age groups and f 2 frequencies. Generally, peak level decreases as a function of frequency. Across frequencies, the peak level is also lower for the oldest group (40 + years) than the youngest two. However, these trends were not statistically significant. Additionally, the peak level across individuals is variable.
SFOAE Phase Gradient Delay
Figure 7 shows SFOAE phase (in cycles) across fp frequencies and individuals. The thick lines in each panel represent a linear fit to each age group's data at that center frequency. Generally, phase accumulates rapidly with increasing frequency across all age groups and individuals. However, the slope of phase accumulation across frequencies is shallower for the oldest (40 + year) age group (0.002 Δ phase with frequency for the oldest group compared to 0.003 for the youngest two groups).

SFOAE phase (in cycles) across seven probe frequencies (fp). The thin lines represent individual data; the thicker lines in each panel represent a linear fit to each age group's data (solid: 18–23 years; dashed: 30–39 years; dotted: 40 + years). Generally, phase accumulates with increasing frequency across all age groups. The slope of the phase accumulation for the oldest group (40 + years) tends to be shallower than for the younger two groups.
Qerb estimations derived from the SFOAE phase gradient delay data are shown in Figure 8 as a function of frequency and age group. Unique points indicate Qerb values derived from each participant; solid lines show a linear fit to the data from each age group across frequencies. The dashed lines represent SFOAE-derived Qerb estimates from Shera et al. (2002) (note: different proportionality factors, k, were used in Shera et al. to estimate these upper and lower intervals). Generally, the oldest age group (40 + years) has the broadest tuning across the frequency range. Additionally, the derived tuning values for the youngest two age groups trend toward or above the upper (sharper) interval from Shera et al. (2002), particularly at the highest test frequencies. Another multiple linear regression analysis explored the effects of frequency, age, and their interactions on SFOAE-derived tuning after controlling for PTA. Again, the overall model was statistically significant F(4, 358) = 34.88, p < 0.001, and explained ∼27% of the variance in Qerb (R2 = 0.28; adjusted R2 = 0.27). There was a statistically significant main effect of frequency (estimate = 0.002 [SEM = 0.0004], p < 0.001) on the tuning estimate. However, similar to the results from the DPOAE LRF analysis, neither the main effect of age (estimate = -0.18 [SEM = 0.12], p = 0.15), the main effect of PTA (estimate = 0.35 [SEM = 0.20], p = 0.08), nor the interaction between frequency and age (estimate = 0.00 [SEM = 0.00], p = 0.52) were statistically significant.

Estimated Qerb values derived from SFOAE phase gradient delay, shown as a function of frequency and age group. Different symbols (squares, circles, and triangles) represent individual data points from each age group (18–23, 30–39, and 40 + years, respectively). Lines (solid, dashed, and dotted) represent linear fits to the data across frequency from each respective age group. The smaller dashed lines represent SFOAE-derived Qerb estimates from Shera et al. (2002). The oldest age group has lower Qerb estimates (i.e., less sharp tuning) across the frequency range, though these differences are not statistically significant.
Fast Psychophysical Tuning Curves
In total, 269 PTCs were measured from 54 participants across the seven probe frequencies of interest. From that total, 53 PTCs were removed during a cleaning procedure prior to analysis. Reasons for removal of a PTC generally fell into one (or more) of four categories: (1) the Q10 (not reported) and/or Qerb could not be estimated for the tuning curve. This occurred for various reasons, including not enough data along the curve, flat data, or highly asymmetrical data (28 PTCs); (2) the estimated slope of the low-frequency side of the PTC was greater than or equal to 0, indicating an aberrant tuning curve shape (9 PTCs); (3) a visual inspection indicated an aberrant tuning curve shape. Typically, this occurred because of significant variability in responses that were not detected by the Q and low-frequency slope criteria set above. This variability often caused multiple peaks in the tuning curve, which, in turn, caused the tip frequency to be misidentified as artificially low (6 PTCs); and (4) the sweep parameters (specifically, the frequency range of the noise) were set incorrectly prior to measurement (10 PTCs).
Figure 9 shows fPTCs at each probe frequency for each age group. Raw data from each participant are shown in the light, unsmoothed lines; a loess fit to each age group's data is shown in the thick line in each panel. Even after the cleaning procedures, the variability in tuning curves is apparent. This is particularly true above 8 kHz across age groups. Data were sparse at the highest test frequencies (> 10 kHz); the number of tuning curves available for analysis decreased systematically with increasing frequency. Only two participants had usable tuning curves above 10 kHz in the oldest age group (40 + years).
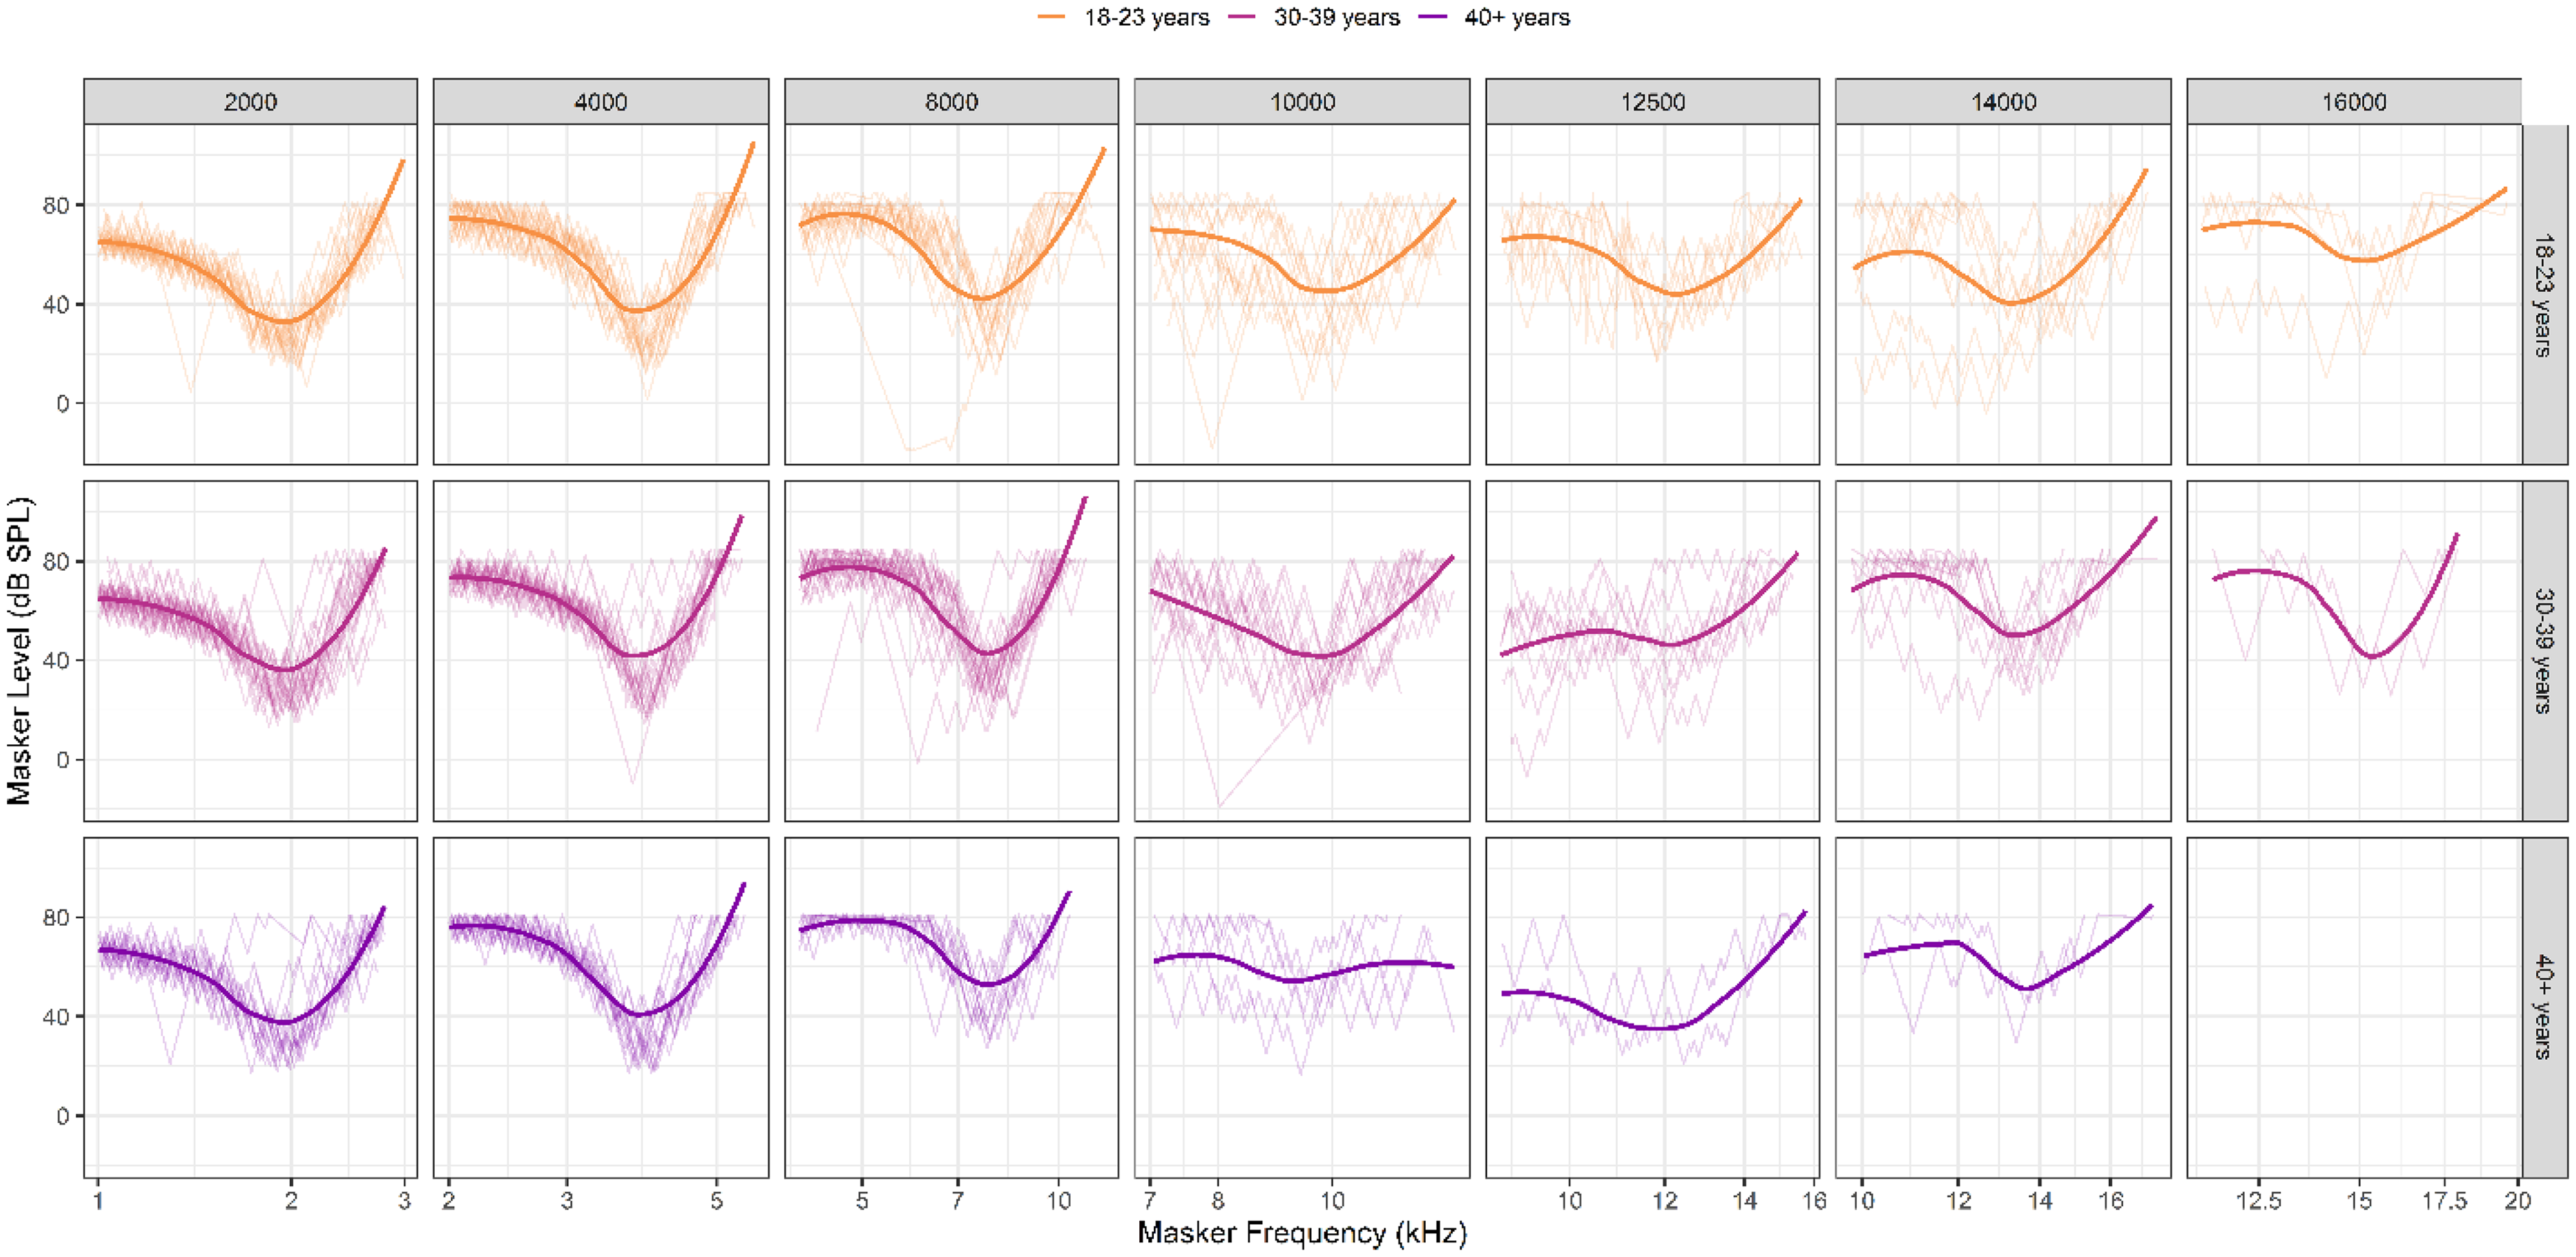
Behavioral fast psychophysical tuning curves (fPTC) across probe frequencies and age groups. Raw PTCs are shown in the thinner lines in each panel. Thick, smoothed lines represent the loess-fit to the group data in each condition. Blank panels indicate there were no usable data for that condition. The number of “clean” (i.e., usable) tuning curves decreased with frequency for all age groups, though the oldest group was most affected. There is significant variability in tuning curves for all age groups, especially at frequencies above 8 kHz.
Qerb estimates from fPTCs are shown in Figure 10 and are plotted against psychophysical tuning data from several other studies (Charaziak et al., 2013; Glasberg & Moore, 1990; Oxenham & Shera, 2003; Wilson et al., 2020; Yasin & Plack, 2005). All studies shown used simultaneous masking. Several general trends are observed. First, the variability of tuning estimates is quite high across all age groups. Second, this variability increases above ∼8 kHz; at 10 kHz, for example, tuning estimates range from ∼6 to almost 100. Third, the rate of increase in sharpness of tuning as a function of frequency seems shallowest for the oldest age group. Fourth, the tuning estimates from this study are notably higher (i.e., sharper) than those from several previous studies.

Estimated Qerb values derived from fast psychophysical tuning curves (fPTC). Different symbols represent individual tuning estimates and are shaped according to a participant's age group (squares, circles, and triangles representing 18–23, 30–39, and 40 + years, respectively). The thicker lines represent linear fits to the data across frequency for each age group. Behavioral tuning data from studies using comparable measurement methods are shown for reference. There are, again, subtle declines in Qerb in the oldest age group (40 + years) relative to the youngest. Additionally, tuning estimates here are generally higher, on average, than those obtained from previous studies using similar methods. Notably, previous studies enrolled significantly fewer participants; sampling variability may be a reason for these differences. This idea is explored further in the Discussion.
fPTC-derived tuning estimates and their relationship to frequency, age, and PTA were explored using a multiple regression analysis. The model was statistically significant F(4, 203) = 15.43, p < 0.001, and explained ∼22% of the variance in Qerb (R2 = 0.23; adjusted R2 = 0.22). While there was a statistically significant main effect of frequency (estimate = 0.003 [SEM = 0.0008], p < 0.001), the other main effects (age estimate = 0.11 [SEM = 0.17], p = 0.53 and PTA estimate = 0.10 [SEM = 0.28], p = 0.73) and the interaction between age and frequency (estimate = 0.00 [SEM = 0.00], p = 0.20) were not.
Effects of Early Aging on Tuning
Next, we explored the overall effects of early aging on tuning across DPOAE LRFs, SFOAEs, and fPTCs. For the remainder of the analyses, participants were only included if they had usable data across all three measures. This reduced the data set to a total of 46 participants (from 59). However, the trends and conclusions from the analyses described here did not change when all participants from the original data set were included.
Figure 11 shows Qerb as a function of age in years. Points represent individual estimates of tuning. The dashed line is a linear fit to the data with the 95% confidence interval shown in light gray. After controlling for behavioral threshold, age was a significant negative predictor of Qerb. Specifically, each one year increase in age was associated with a −0.14 decrease in tuning (estimate = -0.14 [SEM = 0.05], p = 0.002) when collapsed across method and frequency.

The relationship between age (in years) and Qerb collapsed across method and frequency. Points represent individual estimates of tuning; the dashed line is a linear fit to the data with the 95% confidence interval shown in light gray. There is a slight decrease in tuning with age; this effect is statistically significant, even when controlling for behavioral thresholds..
We ran a final multiple regression analysis to examine the interactive effects of frequency, age, and method on tuning (Qerb). Frequency was centered by subtracting the mean frequency from each frequency value. This was done to improve the interpretability of main effects in the model. All instances of “frequency” below refer to the variable after centering. Additionally, we controlled for sensitivity by including behavioral tracking threshold at each test frequency (in dB FPL) as a predictor variable. Behavioral tracking thresholds were used here because we expected their effects to be greater than PTA, as they were measured at each test frequency of interest (2–16 kHz) with a 2 dB step size (compared to 5 dB step size for standard audiometric thresholds). However, the results did not change whether the model included behavioral tracking thresholds or the three-frequency PTA.
The model was statistically significant F(12, 355) = 17.58, p < 0.001 and explained approximately 35% of the variance in Qerb (R2 = 0.37; adjusted R2 = 0.35). There was a statistically significant main effect of frequency, such that Qerb increased (sharpened) with frequency (estimate = 0.004 [SEM = 0.0007], p < 0.001). The main effects of method were also statistically significant. Specifically, LRF tuning estimates were lower than those from fPTC (estimate = -7.33 [SEM = 3.34], p = 0.03), whereas SFOAE tuning estimates were higher (estimate = 7.58 [SEM = 3.34], p = 0.02). There was also a statistically significant main effect of age, indicating that fPTC-derived Qerb decreased slightly but significantly with increasing age (estimate = -0.16 [SEM = 0.08], p = 0.03). There was no statistically significant main effect of behavioral threshold on tuning (estimate = 0.03 [SEM = 0.07], p = 0.60).
The interaction terms highlighted the complex effects between frequency, method, and age. The interactions between age and the other two methods beyond the reference (i.e., DPOAE LRF and SFOAE) were not statistically significant, suggesting that there are not major differences in how age affects Qerb across measurement type. There was a statistically significant two-way interaction between frequency and age (estimate = -0.0001 [SEM = 0.00], p < 0.001), which suggests that age reduces the frequency slope of fPTC-derived tuning. The significant three-way interaction between frequency, DPOAE LRF method, and age further suggests that the slope in DPOAE LRF-estimated Qerb across frequencies was less affected by age than the same frequency slope for fPTC (estimate = 0.0001 [SEM = 0.00], p = 0.003). The three-way interaction between frequency, SFOAE method, and age was similar, but just failed to reach statistical significance (estimate = 0.0001 [SEM = 0.00], p = 0.06). The complex relationships between these predictor variables are further explored in the Discussion. The full model results are shown in Table 1.
The Multiple Linear Regression Model Used to Explore the Combined Effects of Frequency, Age Group, and Method on Q erb .

Comparison of Tuning Values Derived Across Methods
Finally, we explored similarities and differences in the tuning estimates derived from each of the three methods used here (DPOAE LRF, SFOAE phase gradient delay, and fPTC). Figure 12 compiles data to compare Qerb across methods, frequencies, and age groups. The shapes in each panel represent individual data; the lines show linear fits to those data across frequency for each age group, weighted by the number of data points available for that condition (i.e., method/frequency/age group conditions with fewer data points were weighted less heavily in the fit). Several trends can be observed. First, all three measures generally show an increase in tuning with frequency, except for SFOAE data in the oldest age group. Second, tuning estimates derived from DPOAE LRF are lower and less variable than those derived from SFOAE phase and fPTCs. Third, fPTC-derived tuning tended to be the most variable, particularly at the highest test frequencies. Fourth, there are slight differences between age groups in each panel (similar to those observed in Figures 5, 8, and 10); however, these differences are not as easy to visualize for some methods here because the y-axis scaling was held constant across panels in order to best compare the main effects across the three measurement methods.

Comparison of Qerb values across methods (DPOAE LRF, SFOAE phase gradient delay, and fPTC, respectively). Note that participants were only included in this figure if they had data from all three of the measurement methods. Symbols (squares, circles, and triangles) represent individual estimates from participants in each age group. The lines (solid, dashed, and dotted) represent linear fits to those points and are weighted by number of data points at each condition; that is, frequencies where an age group had fewer data points for a given method were weighted less heavily in the fit. Generally, estimates of tuning were highest (i.e., sharpest) across all frequencies when derived from SFOAE phase gradient delay, and lowest when derived from DPOAE LRF. Tuning estimates were most variable when derived from fPTC. Note that age group differences are generally less visible here because of the figure scaling, which is optimized to show differences across measurement conditions.
The relationships between methods were also explored by conducting a post-hoc analysis using the {emmeans} package in R. Specifically, estimated marginal trends in tuning with age were examined across the three methods. These results are shown in Table 2. The change in tuning with age was negative for all three methods; however, only the fPTC (estimate = -0.15 [SEM = 0.07], p = 0.05) and SFOAE (estimate = -0.19 [SEM = 0.07], p = 0.01) methods had slopes that were statistically significantly different from zero. The estimated marginal trend in tuning with age was not statistically significant for the DPOAE LRF method (estimate = -0.01 [SEM = 0.07], p = 0.90). However, pairwise comparisons based on estimated marginal trends, with p-values adjusted using Tukey's method for multiple comparisons suggested no statistically significant differences between the three methods, as shown in Table 3.
The Estimated Effect on Tuning of Age for Each Method of Measuring Q erb .
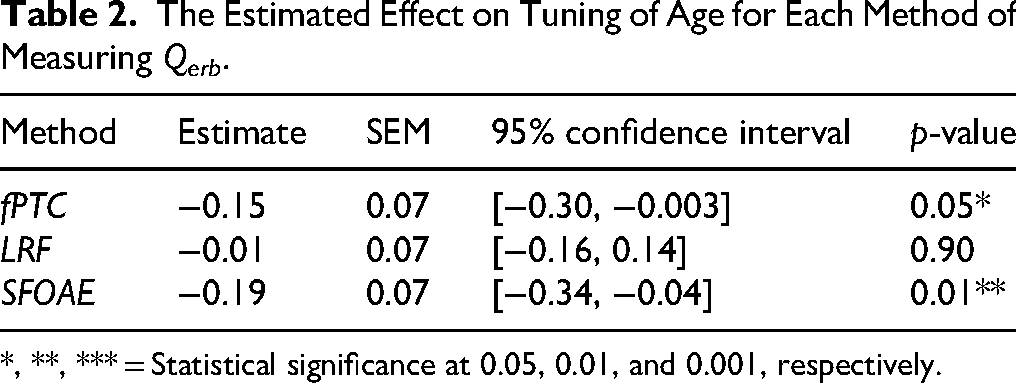
*, **, *** = Statistical significance at 0.05, 0.01, and 0.001, respectively.
The Estimated Contrasts of Age Effects on Tuning Across Measurement Methods.

Discussion
Here, we explored the effects of early aging on frequency selectivity (i.e., tuning). Participants ranged in age from 18 to 59 years, had clinically normal audiometric thresholds (≤ 25 dB HL from .25 to 8 kHz), and had no self-reported history of noise exposure or other otologic problems. Our primary goal was to examine if, and how, early auditory aging processes affect cochlear tuning. Our secondary goal was to compare tuning estimates derived from three non-invasive measures (fPTC, SFOAE phase, and DPOAE LRF), each of which has the potential to be translated into clinical use.
The primary results can be summarized as follows. First, there is evidence that tuning declines during early aging, at least when tuning estimates are pooled across measures. The variability in the data warrant future investigation; if controlled, more significant effects may be detected. Second, there are notable differences in tuning estimates derived from the three measures used here. Third, the variability in tuning across individuals and measures is considerable. Fourth, our estimates of tuning, regardless of measure, are generally higher (i.e., sharper) than those from other studies using similar methods, which could suggest considerable sampling variability across studies. Each of these ideas will be further explored throughout the Discussion.
Effects of Early Aging on Cochlear Tuning
Historically, clinical audiology and hearing research have focused heavily on characterizing auditory function near sensation level (i.e., at threshold) and across a limited range of frequencies. Previous work has demonstrated subclinical age-related declines in auditory function at extended high frequencies (Lee et al., 2012) and using measures beyond traditional behavioral thresholds, including OAEs (Glavin et al., 2021; Hunter et al., 2020; Poling et al., 2014). Cochlear gain (which contributes to threshold sensitivity) and frequency selectivity are both presumed to arise from active cochlear processes, specifically of outer hair cells (Brownell et al., 1985; Robles et al., 1986). Additionally, both sensitivity and selectivity are known to be affected by age and hearing impairment (Henry & Heinz, 2012; Kale & Heinz, 2010; Lutman et al., 1991; Matschke, 1991; Miller et al., 1997). Thus, we were interested in exploring whether tuning is affected by early aging, before there is a significant decline in audiometric sensitivity.
Results suggest declines in tuning with age, even when controlling for behavioral thresholds. Generally, older ears had lower Qerb values (i.e., broader tuning). The effects of age were statistically significant when examining across measures and frequencies (e.g., Table 1 and Figure 11). However, age was not a statistically significant predictor of Qerb in the multiple regression models used to examine the factors that predict tuning within each individual measurement method. This suggests that the individual models may not have been appropriately powered to detect the relatively small effects of age on tuning.
Our final multiple regression model and subsequent post-hoc analyses highlight the complex interactions between the effects of age and measurement method on tuning. Specifically, estimated age slopes (i.e., the slope of tuning with increasing age) were statistically significant only for SFOAE and fPTC, and not for LRF (Table 2). This indicates that fPTC- and SFOAE-derived tuning estimates are more affected by age than LRF-derived estimates. However, pairwise comparisons of the estimated marginal trends showed that there were not statistically significant contrasts between the three measurement methods (Table 3). Collectively, these results suggest that there are declines in tuning with age, but the effects are relatively small and likely impacted by the individual variability seen across all three measures in our sample. Additionally, although fPTC and SFOAE appear to be most affected by aging here, they also have the highest variability across individuals and the largest deviations from tuning estimates from previous studies, as further discussed in the next section. Given this, future work investigating tuning across metrics and/or during early aging should strongly consider increasing sample size, establishing the short- and long-term reliability of these methods, using longitudinal study designs, and establishing normative ranges of tuning across various methods.
Notably, though there were statistically significant differences in behavioral thresholds between age groups, behavioral thresholds were not a statistically significant predictor of tuning in any of our models. This suggests that during early aging and without significant changes in sensitivity, local changes to sensitivity and frequency selectivity may be at least partially driven by different factors.
Tuning Estimates Across Behavioral and OAE Measures
In this work, we compared estimates of tuning derived from three different measures: fast psychophysical tuning curves (fPTC), DPOAE LRF, and SFOAE phase gradient delay. While each of these measures has previously been used to assess tuning, the three have not been directly compared in the same sample of ears.
DPOAE- vs. SFOAE-Derived Tuning
DPOAEs and SFOAEs may both provide objective measures of cochlear tuning. However, it is theorized that the generation of these two types of OAEs is distinct, both in place and mechanism (Shera & Guinan, 1999), which may complicate interpretation. Previous work has suggested that DPOAEs may underestimate the sharpness of cochlear tuning relative to SFOAEs or psychophysical methods given that they arise from a relatively broad region along the cochlear partition and are comprised of two components (Charaziak et al., 2013). However, other evidence suggests that DPOAE-derived tuning estimates are comparable to those obtained from other methods. For example, Wilson et al. (2021) found a modest correlation between DPOAE LRFs and simultaneously masked PTCs, at least when data were pooled together across frequencies (1 and 4 kHz). Additionally, Rasetshwane et al. (2019) did not find a significant difference between suppression tuning curves measured using DPOAEs and SFOAEs at a probe frequency near 1 kHz. Most recently and compellingly, Dewey and Shera (2023) demonstrated a close relationship between DPOAE LRFs and the mechanical responses of the basilar and tectorial membranes in mice. This latter evidence provides support for the validity of DPOAE LRFs as a reliable measure of cochlear tuning.
Relatedly, it has also been argued that SFOAEs may provide a more accurate estimate of cochlear tuning than DPOAEs because they are evoked using a single tone, and therefore arise from a more discrete cochlear location (Charaziak et al., 2013; Wilson et al., 2020). Consistent with this idea, tuning estimates (i.e., Qerb) derived from SFOAEs phase tend to be sharper than those from behavioral methods and/or DPOAEs (Shera et al., 2002). However, past work has also shown that SFOAEs are unexpectedly preserved in level in aged ears relative to DPOAEs (Abdala et al., 2018). This finding has generally been interpreted as evidence that distortion and reflection emissions arise from distinct generation mechanisms, which are differentially affected by aging processes. Specifically, SFOAEs are thought to be a type of reflection emissions, which are theorized to result from the backscattering of energy off micromechanical irregularities within the cochlea. These irregularities, sometimes referred to as “cochlear roughness,” may increase with age, thus leading to the unexpected preservation of SFOAEs relative to DPOAEs. Such an increase in roughness may also affect SFOAE phase delays and their associated tuning estimates. For example, paradoxical behavior has been observed in the SFOAE phase delay of aged ears. Specifically, Abdala et al. (2018) found that middle-aged and older adults had unexpectedly greater phase accumulation (i.e., longer delays, which would be consistent with sharper cochlear tuning) than younger adults. While the reasons for this unexpected finding may be varied, it is worth noting that this work examined phase delay across four octaves (0.5–8 kHz) without considering the break in scaling symmetry in the cochlear apex that occurs below ∼1 kHz, which could have affected their results (e.g., Shera et al., 2010; van Der Heijden & Joris, 2006). Here, we further explored the idea that SFOAEs may be relatively insensitive to aging effects compared to DPOAEs. We speculated that this could potentially cloud interpretations of SFOAE-derived tuning metrics in aged ears. We derived tuning estimates from SFOAE phase gradient delay at 2 kHz and above, thereby avoiding potential complications from a break in cochlear scaling symmetry at lower frequencies.
In this study, tuning estimates were lowest (i.e., broadest) when derived from DPOAE LRFs and highest (i.e., sharpest) when derived from SFOAEs. In our final model, there were statistically significant main effects of both methods compared to fPTC; thus, the three methods yield different Qerb estimates. This finding supports the idea that DPOAEs arise from a more spatially distributed area within the cochlea than SFOAEs.
Additionally, the data here do not suggest that DPOAE- and SFOAE-derived tuning estimates are differentially affected by age (Table 3). In fact, SFOAEs were more sensitive to aging effects than DPOAEs in our sample (Table 2). Thus, SFOAEs likely did not overestimate tuning in aged ears compared to younger ears in our sample. This could be due to a true lack of effect, and/or because our sample of aged ears did not have substantial enough cochlear irregularities to impact the SFOAE phase gradient. Since such irregularities are likely to be largely variable across individuals, future work should consider exploring specific patterns between SFOAEs and other measures within individual ears.
Behavioral Measures of Tuning
Traditionally, psychophysical tuning has been considered the gold standard estimate of cochlear tuning in humans. However, this assumption has been difficult to validate because direct measures of auditory nerve fiber tuning cannot be obtained in humans, and only one recent study in lab animals (ferret) has compared direct measures of neural tuning to tuning estimates from modern psychophysical tasks (Sumner et al., 2018). While the nature of the data shown here prevents us from determining the true validity of each measure, the results at least challenge the clinical applicability of fast, simultaneously masked psychophysical tuning curves. fPTC were most sensitive to aging effects in our sample (Table 1, Table 2). However, these psychophysical tuning curves and their corresponding Qerb estimates showed significant variability compared to the objective measurement methods, particularly at the highest probe frequencies. The potential reasons for this variability are numerous and include cochlear health, cognitive factors (e.g., attention and fatigue), and measurement factors (e.g., the choice of masking method and test–retest reliability).
Measurement-related factors are known to play a large role in the tuning estimates derived from psychophysical tuning curves. While the fPTC method produces rapid results, it is especially susceptible to participant bias compared to other behavioral estimates of tuning. The listening paradigm is subjective and can be difficult for participants to complete, especially when they are unpracticed. This contrasts with other behavioral tuning measurement paradigms where there is a correct option, such as a two-interval, two-alternative forced choice (2I-2AFC) task. This may at least partially explain the variability in behavioral tuning estimates seen here. Other studies using a 2I-2AFC notched-noise method with simultaneous masking to estimate tuning have generally yielded less variable results, at least in young listeners with normal hearing (e.g., Leschke et al., 2022; Oxenham & Shera, 2003). However, such measurement paradigms may take too much time to be clinically viable.
The type of masking used in the measurement can also impact tuning estimates. Compared to forward-masked paradigms, simultaneous masking tends to underestimate tuning due to cochlear nonlinearities that can cause interactions between the probe and masker (Moore & Glasberg, 1981; Oxenham & Shera, 2003). Future work comparing forward-masked PTCs with multiple types of OAE-derived tuning estimates in humans may shed light on the extent to which these methods (behavioral and OAE-based) are influenced by different cochlear and retrocochlear phenomena. Additionally, due to time constraints, fPTCs here were measured with just one downward sweep for each probe frequency. This may have introduced a hysteresis effect in fPTC estimates, as there is a delay in the participant's response in releasing the spacebar (to indicate that the probe is no longer audible) relative to the change in noise level. For downward-swept maskers, this can cause the tip of the tuning curve to fall below the actual probe frequency. Here, such effects were observed but are generally small. The mean percentage difference between probe frequency and tip frequency in our data was just under 4% (M = 3.66%; fp > ftip). These differences were similar across age groups (3.33, 3.73, and 4.16%, respectively). This is consistent with the 3% hysteresis effect found for fPTCs measured with downward sweeping noise by Sęk et al. (2005). While we cannot quantify the potential hysteresis effects on tuning here, Malicka et al. (2009) found that the sweep direction did not significantly affect tuning estimations.
The psychophysical tuning estimates derived here were also notably different from those of previous studies obtained using similar measurement methods (including simultaneous masking). Sampling variability between studies may be a primary reason for this, which is supported by our finding that tuning estimates were consistently sharper across all metrics (DPOAE, SFOAE, and fPTC) than comparable measures in past work. This calls the external validity of work assessing cochlear and psychophysical tuning into question. Without exception, the comparative studies referenced here, regardless of the method used to estimate tuning (e.g., DPOAE, SFOAE, or psychophysical), examined tuning in relatively small, homogeneous samples of listeners. While Wilson et al. (2020) and Wilson et al. (2021) each included just over 20 participants, the other studies included just 10 or fewer participants. Several studies included only four ears, as shown in Figure 10. Additionally, only young listeners with normal hearing were included in these studies; when reported, audiometric thresholds in the samples were typically ≤ 15 dB HL through a standard clinical frequency range. This is problematic because there may be increased variability in tuning estimates—at least those derived from behavioral methods—in more diverse samples, such as children (Malicka et al., 2009) and cochlear implant users (Kreft et al., 2019). The clinical utility of these tools will remain limited until large-scale studies characterize tuning (and its test–retest reliability over short and long periods) in more heterogeneous samples.
Additionally, the data here suggest that the behavioral and OAE-derived tuning metrics used here assess, or are influenced by, different phenomena. Our final model showed statistically significant differences between psychophysical tuning estimates and those derived from both types of OAEs. Fast PTCs, in particular, may be influenced by cochlear suppression or neural inhibition (Moore, 1978; Moore & Glasberg, 1982).
Other Methodological Considerations and Limitations
Here, estimates of tuning were highly variable across individual participants and, in some instances, deviated considerably from those measured in previous studies. While sampling variability may largely explain both of these observations, other methodological decisions are important to consider, including those related to the measurement and analysis of tuning. Ideally, these parameters should be standardized in the future to better allow for cross-study comparisons and clinical use.
One such measurement factor is choice of stimulus calibration method, which is important when measuring both OAEs and/or behavioral phenomenon at high frequencies due to the presence of standing waves (Scheperle et al., 2008; Souza et al., 2014). Stimuli for all measures used here were calibrated to FPL, which should mitigate the effects of standing waves. Despite this, our tuning estimates were consistently higher than those from previous work and we saw considerable variability in our measures. This suggests that tuning estimates, particularly at high frequencies, would be even more variable if FPL was not used here. Additionally, we used a relatively liberal SNR criteria to clean both DPOAE and SFOAE data (3 dB SNR), which could have introduced instability—and therefore variability—into the tuning estimates derived from these measures.
Another important factor, and limitation of this study, is the selection of different stimulus level(s) across paradigms, as cochlear tuning is known to vary with stimulus level (e.g., Ruggero et al., 1997). Here, fPTC were measured at 10 dB SL re: each participant's threshold (in dB FPL). In contrast, stimuli for DPOAE and SFOAE measures were fixed at 65/55 (L1/L2) and 40 dB FPL (Lp) with a 60 dB FPL suppressor (Ls), respectively, which was generally well above threshold in our sample of participants with normal hearing. This complicates the comparison of these three measures and their respective tuning estimates. Previous work has highlighted the complex relationships between level, tuning, and cochlear compression, as well as the impact of isolevel (fixed-level maskers) vs. isoresponse (fixed-level probes) measurement paradigms on tuning estimates (e.g., Eustaquio-Martín & Lopez-Poveda, 2011; Lopez-Poveda & Eustaquio-Martín, 2013; Ruggero & Temchin, 2005). These interactions could at least partially explain why tuning estimates from DPOAE LRF were, generally, broader than those obtained from fPTC and SFOAE. This also raises a broader question about the potential clinical utility of OAE-based tuning measures, given that OAEs typically cannot be reliably measured at levels very close to behavioral threshold. Future work is needed to understand the relationship between psychophysical and physiological tuning measures across levels, as well as the connection between tuning across levels and real-world, functional consequences for listeners.
An additional consideration when analyzing DPOAEs is whether to examine the LRF of the composite DPOAE or to first separate out the reflection component (and thus examine just the distortion component). In this study, we chose to evaluate the composite DPOAE LRF to best understand the clinical relevance of methods that could very easily be adopted for use in clinical practice today. This decision may partially explain why our DPOAE LRF estimates are higher than those of Wilson et al. (2021), who examined only the LRF of the DPOAE distortion component. Similarly, short-latency components of SFOAEs were not separated here but may have influenced tuning estimates. Nevertheless, focusing solely on the long-latency components would be expected to increase tuning estimates, which were already the highest, on average, for SFOAEs.
Analysis parameters, including smoothing function and span, can also significantly influence the shape and width of both DPOAE LRF and PTC data. The DPOAE LRF mirroring procedure is another example of an analysis procedure that could complicate interpretation; for example, the tuning factor sometimes increased after mirroring. However, the use of the mirroring procedure did not significantly impact any of the results or conclusions reported here. Finally, large gaps in SFOAE phase data can impact phase unwrapping (Christensen et al., 2018). While our choice of analysis parameters was rooted in past literature, future work is needed to characterize the effects of these parameters on tuning curves and their estimates.
Summary: Toward a Clinically Viable Assessment of Cochlear Tuning
Here, we explored the effect of early aging processes and measurement method (DPOAE LRF, SFOAE phase gradient delay, and fPTC) on estimates of auditory tuning in individuals with normal hearing sensitivity (≤ 25 dB HL from 0.25 to 8 kHz). Results suggest that cochlear tuning may decline slightly during early aging. However, there is significant variability in the data that warrants future investigation. Additionally, the measurement method has a considerable influence on the derived tuning estimate(s). Future work is necessary to explore cochlear tuning and its test–retest reliability in large, heterogenous samples. Studies comparing behavioral, OAE, and neural measures of tuning in the same species, and across stimulus levels, will be necessary for establishing a “gold standard” for measuring cochlear tuning in clinical settings. It will also be critical to understand the functional ramifications, if any, of changes in tuning.
Footnotes
Acknowledgments
We would like to thank the participants who dedicated their time and ears to this research. We would also like to thank Dr. Shawn Goodman for his assistance with designing and implementing several of the MATLAB scripts used for data collection and analysis here.
Ethical Approval and Informed Consent Statements
All work presented here was approved by and conducted in accordance with the Northwestern University Institutional Review Board (IRB; STU00000295). Informed written consent was obtained from all individuals prior to their participation in this research.
Authorship Contribution Statement
Both authors designed the study, including formulation of hypotheses, development of study objectives, and development of methodological protocols. CCG collected and analyzed the data and wrote the original draft. SD critically reviewed and edited the manuscript.
Funding
This work was supported by the NIH/NIDCD F32DC019557 (CCG).
National Institute on Deafness and Other Communication Disorders (grant number F32DC019557).
Declaration of Conflicting Interests
The authors declared no potential conflicts of interest with respect to the research, authorship, and/or publication of this article.