
Abstract
Age-related hearing loss is difficult to study in humans because multiple genetic and environmental risk factors may contribute to pathology and cochlear function declines in older adults. These pathologies, including degeneration of the stria vascularis, are hypothesized to affect outer hair cells responsible for active cochlear amplification of low-level sounds. Otoacoustic emission (OAE) measures are used to quantify the energy added to the traveling wave in cochlear amplification, which typically weakens with increased pure-tone thresholds and for older individuals. Thus, the current study evaluated two OAE measures for individuals with different components of age-related hearing loss. We examined two retrospective adult lifespan datasets (18 to 89+ years of age) from independent sites (Medical University of South Carolina and Boys Town National Research Hospital), which included demographics, noise history questionnaires, distortion-product otoacoustic emissions (DPOAE), and cochlear reflectance (CR). Metabolic and sensory estimates of age-related hearing loss were derived from the audiograms in each dataset, and then tested for associations with DPOAE and CR. The results showed that metabolic estimates increased for older participants and were associated with lower overall DPOAE and CR magnitudes across frequency (i.e., lower fitted intercepts). Sensory estimates were significantly higher for males, who reported more positive noise histories compared to females and were associated with steeper negative across-frequency slopes for DPOAEs. Although significant associations were observed between OAE configurations, DPOAEs appeared uniquely sensitive to metabolic estimates. The current findings suggest that distortion-based measures may provide greater sensitivity than reflection-based measures to the components of age-related hearing loss.
Keywords
Introduction
Age-related hearing loss is common but challenging to study in humans because multiple genetic and environmental risk factors may be involved in the underlying pathologies (Gates & Mills, 2005; Nadol, 2010; Schmiedt, 2010). Metabolic (i.e., strial) and sensory (i.e., hair cell) pathologies in the cochlea are each hypothesized to affect outer hair cell (OHC) function, which is responsible for a loss of sensitivity to low-level sounds (Dubno et al., 2013; Schmiedt, 2010; Schuknecht & Gacek, 1993). The goal of the current study was to determine the associations of two measures of OHC function with estimates of metabolic and sensory components of age-related hearing loss, which were derived from audiograms.
Evidence of OHC and strial pathologies in age-related hearing loss are commonly seen in human temporal bones (Bredberg, 1968; Nadol, 2010; Nelson & Hinojosa, 2006; Schuknecht & Gacek, 1993; Wu et al., 2020). Atrophy in the stria vascularis and spiral ligament of the cochlea (Schulte & Schmiedt, 1992) is strongly associated with lower endocochlear potential (EP) in the scala media (Gratton et al., 1996; Gratton & Schulte, 1995), which provides power for OHC motility throughout the cochlea. Losses in active cochlear amplification can reduce sensitivity by ~60 dB for high-frequency sounds and by ∼20 dB for low-frequency sounds, based on in-vivo measurements in chinchillas and guinea pigs (Cooper & Rhode, 1997; Hemmert et al., 2000; Robles & Ruggero, 2001; Ruggero & Rich, 1991; Schmiedt et al., 2002; Sewell, 1984). Importantly, this suggests that lower EP produces a gradually sloping hearing loss with larger declines at higher frequencies and smaller declines at lower frequencies.
Sensory pathology typically refers to OHC injury or degeneration that can result from exposure to loud noises or ototoxic drugs. The OHCs near the cochlear base appear more susceptible to damage than at the apex (Sha et al., 2001), which suggests that the more extensive cochlear amplification at high frequencies is particularly sensitive to noise-related damage. For that reason, sensory losses typically involve high-frequency hearing losses that spare hearing sensitivity at low frequencies (Dubno et al., 2013; Liberman et al., 2002; Nadol, 2010; Schmiedt, 2010; Schuknecht & Neff, 1952). Noise-related damages and losses are more common for OHCs compared to inner hair cells (IHC), such that IHCs appear unlikely to substantially affect hearing thresholds (Moore, 2007; Nadol, 2010).
Metabolic and sensory pathologies can occur separately or together (Johnsson & Hawkins, 1972; Kobrina et al., 2020; Lang et al., 2010; Wu et al., 2020). However, it appears that a distinguishing characteristic between the effects of metabolic and sensory pathologies is the relative extent of elevated hearing thresholds at lower frequencies and higher frequencies (Dubno et al., 2013; Schmiedt, 2010; Vaden et al., 2022). As a first step in characterizing different components or subtypes of age-related hearing loss, we categorized audiograms of older adults based on their configurations (Dubno et al., 2013; Vaden et al., 2017, 2018). Because we found that most older adults were classified as a combined metabolic and sensory category, we then developed an approach to estimate the magnitude of metabolic and sensory components from the audiogram (Vaden et al., 2022). Given the hypothesized changes in OHC function involved with both metabolic and sensory components, we predicted that otoacoustic emission (OAE) measures would show different patterns of decline with increasing metabolic and sensory loss (Vaden et al., 2018).
Although EP levels and OHC function cannot be directly observed in older adult humans in vivo, OAEs can provide information about active cochlear processes based on the measurement of a small acoustic signal generated within the cochlea (Kemp, 1978, 2008). When OHCs respond to sound energy with an electromotile response, their movement adds energy to the acoustically driven waves that travel along the basilar membrane (Brownell, 1990). The addition of energy to the acoustically driven motion has been shown to amplify and tune neural responses at specific frequencies and places along the basilar membrane (Davis, 1983; Kemp, 2002). When the wave energy reflects and travels outward, the coherent summated energy produces a small acoustic signal that is decomposed analytically, based on the sound characteristics used to elicit the OAE. Different emissions are used to measure two distinct generation sources: linear coherent reflection and nonlinear distortion (Abdala et al., 2022; Shera & Guinan, 1999, 2008). For example, transient-evoked emissions (TEOAEs) are evoked with a rapid series of clicks or tones and primarily measure the coherent linear reflection of back-scattered energy near the peak of the traveling wave on the basilar membrane. In contrast, distortion-product OAEs (DPOAEs) are elicited with paired tones and primarily measure nonlinear distortion. The relationship between higher pure-tone thresholds and lower OAE magnitudes is well-established (e.g., Gorga et al., 1993; Harris & Probst, 1991; Kemp et al., 1986; Lonsbury-Martin & Martin, 1990; Prieve et al., 1993; Rasetshwane et al., 2015).
DPOAEs are byproducts of normal OHC function that are generated by the nonlinear interaction of cochlear vibrations at multiple frequencies. The DPOAE specifically measured in this study is the 2f1-f2 intermodulation tone generated by stimulus tones at the f1 and f2 frequencies. In previous studies, this DPOAE has been shown to be a good indicator of OHC function at the f2 frequency (Avan et al., 1998; Brown & Kemp, 1984; Fahey & Allen, 1997). Cochlear reflectance (CR) is a different type of OAE that is generated by the reverse scattering of cochlear traveling waves due to a small amount of roughness in the mechanical properties of the organ of Corti (Rasetshwane & Neely, 2012). Reflectance in general, when measured in the ear canal, may be viewed as a transfer function between the forward and reverse propagating components of total acoustic pressure in the ear canal. CR is the cochlear contribution to ear-canal reflectance and may be separated from other sources of reflection by its longer latency (>1 ms) and strong dependence on stimulus level. The CR calculation involves a measurement-based correction for middle ear influence, which reduces the potential for middle ear artifacts. As with other OAE measures, CR magnitude is indicative of OHC status. More specifically, CR measures the linear coherent reflection of back-scattered energy along the cochlear partition (Rasetshwane & Neely, 2012). In this study, CR is evoked by wideband noise (WBN) stimuli, although other stimuli can be used (Rasetshwane et al., 2015; Rasetshwane & Neely, 2012). The use of wide-band noise with CR allows measurement across a range of frequencies, which is more efficient than DPOAEs, which are typically collected for one frequency at a time. Because CR is normalized to the stimulus level, CR magnitude increases as the stimulus level decreases.
In previous studies, clinical test performance and the ability to predict audiometric thresholds from CR responses have been evaluated and compared to that of DPOAEs. Although CR responses did not perform as well as DPOAE measurements in predicting hearing thresholds in a screening paradigm (Neely et al., 2019; Rasetshwane et al., 2015), CR responses still have the potential to be useful in differential diagnosis of cochlear pathologies. Similar to DPOAEs, lower CR responses are associated with higher pure-tone thresholds (Neely et al., 2019; Rasetshwane et al., 2015) and age-related CR declines were well-explained by sensorineural hearing loss (Fultz et al., 2020). Although both types of OAEs are closely linked to OHC function, they are generated by different mechanisms, nonlinearity and scattering, so they have the potential to provide complementary information about etiologies of age-related hearing loss, including metabolic and sensory pathologies.
Previously, we observed that older adults showed significantly different across-frequency patterns of TEOAEs depending on whether their audiograms were classified into an older-normal, metabolic, sensory, or metabolic + sensory category (Vaden et al., 2018). In the current study, we predicted that higher metabolic estimates are associated with broad declines in the DPOAE response across stimulus frequency (Kamerer, Kopun, Fultz, Allen, et al., 2019; Kamerer, Kopun, Fultz, Neely, & Rasetshwane, 2019; Neely et al., 2019) as with CR responses (Fultz et al., 2020; Neely et al., 2019; Rasetshwane et al., 2015). Similarly, we predicted that higher sensory components are associated with steeper slopes for DPOAE and CR responses with weaker responses at the highest frequencies (Vaden et al., 2018).
The distortion-based and reflection-based measures could also provide differential sensitivity to metabolic and sensory components. Distortion-based OAEs are reduced to a greater extent with older age compared to reflection-based OAEs from the same individuals (Abdala et al., 2018; Abdala & Dhar, 2012), which suggests that DPOAEs may be more sensitive to metabolic and/or sensory components than CR responses. Abdala et al. (2018) attribute the smaller age-related declines in reflection-based OAEs to morphological changes inside the cochlea that increase back-scattered energy and partially offset weaker OAEs. Thus, different generation mechanisms may relate to sensory or metabolic components more strongly. Because both DPOAE and CR measures were collected for a subset of individuals, we also examined associations between the responses as well as their unique associations with metabolic and sensory estimates.
In addition to testing hypotheses regarding OAE configurations, it was deemed important to confirm whether each sample showed typical patterns of metabolic and sensory components despite the requirement that DPOAE or CR responses were measurable from the participants. We predicted an increased metabolic component with participant age in each cross-sectional dataset, and an increased sensory component was predicted for males compared to females as well as for positive noise histories (Dubno et al., 2013; Vaden et al., 2022, 2017). An additional goal of the current study was to examine differences due to participant race, given mixed evidence that non-White individuals generally have better pure-tone thresholds than age-matched White individuals (e.g., Kryter, 1983; Lin et al., 2011; Mujica-Mota et al., 2015; Royster et al., 1980). Findings from animal models suggest that melanin may influence susceptibility to noise-induced hearing loss and intermediate cell degeneration that can lower EP production (e.g., Ohlemiller et al., 2009; Schulte & Schmiedt, 1992; Schulte & Steel, 1994; review by Mujica-Mota et al., 2015).
Materials and Methods
Participants
The current study included retrospective data that were independently collected from 924 participants (18–89+ years of age), in the Hearing Research Program at the Medical University of South Carolina (MUSC) and in the Communication Engineering Laboratory at Boys Town National Research Hospital (BTNRH). Most of the MUSC participants were part of a longitudinal cohort study of age-related hearing loss between 1987 and the present, they were recruited from the community and had good general health with no evidence of conductive hearing loss or active otologic/neurologic disease. The MUSC data includes a subset of individuals whose audiograms, DPOAEs, CRs, noise histories, and demographic information were previously reported (Fultz et al., 2020; Vaden et al., 2022). The participants in the original studies at BTNRH (Kamerer, Kopun, Fultz, Allen, et al., 2019; Kamerer, Kopun, Fultz, Neely, & Rasetshwane, 2019; Neely et al., 2019; Rasetshwane et al., 2015) were recruited from a database of potential participants who volunteered for hearing research through various outpatient clinics and community-based recruitment events. None of the BTNRH studies involved metabolic or sensory estimates. Supplementary Table 1 provides more information on the measurements collected in each study and site, which were used for the current study.
Research was conducted according to principles of the World Medical Association Declaration of Helsinki at each site and informed consent was obtained in compliance with Institutional Review Board for Human Research approvals at each institution. The datasets were de-identified prior to sharing, such that the data are considered nonhuman subject data, and data sharing was approved by agreements between the contributing institutions.
Data Selection
Because the present investigation focuses on hearing loss across the adult lifespan in relation to DPOAE and CR measures, data were excluded from individuals younger than 18 years of age. In addition, audiograms were excluded that were poorly fit by the metabolic and sensory profiles (described in section: Metabolic and Sensory Estimates; Vaden et al., 2022) and for participants with poor or missing tympanometry values (See section: Middle-Ear Status). Supplementary Figure 1 shows CONSORT diagrams for the selection of retrospective data for the current study, with numbers of subjects and percentages. The selected data from BTNRH included measurements from 429 adults, ages 18–86 years, 55% female, and 10% non-White. The MUSC data selection included a similar set of measures from 539 adults, ages 19–89+ years, 59% female, and 26% non-White (Table 1).
Summary of Participant Data.
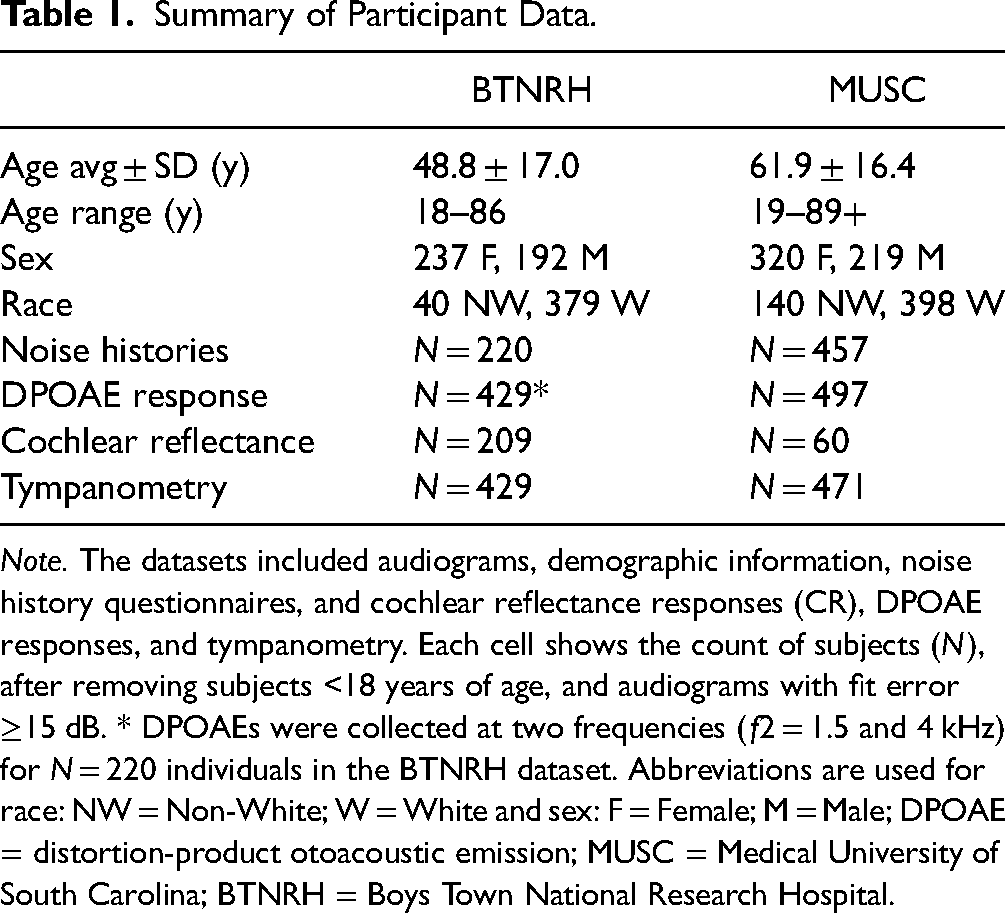
Note. The datasets included audiograms, demographic information, noise history questionnaires, and cochlear reflectance responses (CR), DPOAE responses, and tympanometry. Each cell shows the count of subjects (N), after removing subjects <18 years of age, and audiograms with fit error ≥15 dB. * DPOAEs were collected at two frequencies (f2 = 1.5 and 4 kHz) for N = 220 individuals in the BTNRH dataset. Abbreviations are used for race: NW = Non-White; W = White and sex: F = Female; M = Male; DPOAE = distortion-product otoacoustic emission; MUSC = Medical University of South Carolina; BTNRH = Boys Town National Research Hospital.
Audiogram Collection
Pure-tone thresholds were measured in each study at conventional audiometric frequencies (0.25, 0.5, 1, 2, 3, 4, 6, 8 kHz) using a calibrated Madsen OB822, OB922, Astera2 clinical audiometer with Telephonics TDH-39 headphones (MUSC) or Grason-Stadler GSI AudioStar Pro audiometer with Sennheiser HDA 300 headphones (BTNRH). Threshold measurement for data collection at both sites followed standard pure-tone threshold measurement procedures (e.g., ASHA, 2005). Each study reported using 2- or 5-dB step sizes for threshold determination. In contrast with earlier approaches (Dubno et al., 2013; Vaden et al., 2022), average audiograms were not calculated across visits within the first year for MUSC participants. Rather, the current study used thresholds measured on the DPOAE or CR test date for consistency across sites and across studies.
Metabolic and Sensory Estimates
The current study used a previously developed approach to provide estimates of metabolic and sensory components for each audiogram and exclude audiograms that appear atypical for age-related hearing loss (Vaden et al., 2022). This approach relies on separate metabolic and sensory profiles, which were derived from hundreds of audiograms that were classified as a metabolic or sensory hearing loss by two expert raters (Dubno et al., 2013) and correctly labeled by a trained machine learning algorithm (Vaden et al., 2018, 2017). Separate metabolic and sensory profiles were calculated by averaging the classified audiograms, and then scaling the results so their average profile weight was equal to one. The resultant metabolic and sensory profiles were essentially 1 dB scale-replicas of each type of hearing loss in a relatively pure form, which would perfectly fit the original group average audiograms if each profile was multiplied by some value (Figure 1(A)).

The metabolic and sensory profiles are shown with weights in arbitrary units (AU) that each sum to one. The profiles were fitted to each audiogram in the current study by minimizing the distance between the observed thresholds and the summed profiles, each multiplied by a constant term (i.e., estimates; A). Representative audiograms with distinct subtype configurations were selected from the MUSC dataset based on a pure metabolic loss (B) or a pure sensory loss (C) according to their estimates and predicted error <15 dB. Despite similar magnitudes of hearing loss, the audiograms show different threshold patterns. A linear accumulation of hearing loss is assumed by the model, illustrated by thin lines that show 5 dB increments for each profile in B–C).
Estimates of metabolic and sensory components were calculated by finding the combination of metabolic and sensory profiles that best approximated the pure-tone thresholds in an audiogram (e.g., Figure 1(B–C)). Each profile was multiplied by a test value of 0 dB or higher (i.e., estimate), and their products were summed at each frequency to approximate pure-tone thresholds for one ear. Estimates were derived that minimized the root mean square difference between the predicted and observed thresholds (i.e., predicted error), based on an optimization algorithm (Byrd et al., 1995). Audiograms with predicted error ≥15 dB were excluded from analyses in the current study (Supplementary Figure 1), based on simulation results (Vaden et al., 2022).
Figure 2 shows the average audiograms for each site (Figure 2(A)), and metabolic and sensory estimates for each individual ear represented by points (Figure 2(B–C)). In the scatterplot representation, a “pure” metabolic loss is represented by a blue point on the x-axis (sensory estimate = 0 dB), a “pure” sensory loss is represented by a red point on the y-axis (metabolic estimate = 0 dB), and normal hearing ears are approximately 20 dB or less from the origin (gray points). There were significant differences in the distribution of metabolic and sensory estimates. Results from Kolmogorov–Smirnov tests indicated that the distribution of metabolic estimates was significantly different across sites (D = 0.10, p = .003) as well as sensory estimates (D = 0.20, p < .001). MUSC also showed significantly higher metabolic estimates than BTNRH, t(824) = 2.13, p = .03, and significantly higher sensory estimates, t(971) = 6.08, p < .001. Differences in the metabolic and sensory estimates across sites could result from several differences between the datasets. For example, MUSC participants (61.9 ± 16.4 years old) were on average 13.1 years older than BTNRH participants (48.8 ± 17.0 years old). MUSC also had 1.26 times as many participants and 2.36 times as many audiograms as BTNRH (Figure 2), because data were collected from the better hearing ear only from BTNRH participants (better ears for MUSC are darker symbols in Figure 2(C)).

Median pure-tone thresholds are shown as points with ±25% quartiles (shaded regions) to show the extent of overlap between the BTNRH and MUSC datasets (A). The distribution of metabolic and sensory estimates for 429 BTNRH participants (429 ears; B) and 539 MUSC participants (1012 ears; C). The color-shading in (B) and (C) represents the combined metabolic (blue) and sensory (red) components for each ear. The MUSC dataset included results for both ears of each participant, so results for the poorer hearing ears are indicated by fainter colors (C). Light gray points in (B) and (C) indicate cases with combined metabolic and sensory estimates <20 dB.
Self-Reported Noise History
A sample of BTNRH participants (Kamerer, Kopun, Fultz, Neely, & Rasetshwane, 2019) reported their exposure to impulse noise (yes/no) and completed the Lifetime Exposure of Noise and Solvents Questionnaire (LENS-Q; Bramhall et al., 2017). MUSC participants completed a different noise history questionnaire, detailed previously (Dubno et al., 2013; Vaden et al., 2022, 2017).
Distortion-Product Otoacoustic Emissions Measurement
The DPOAEs (response amplitude to 2f1–f2 tones) from the BTNRH dataset were recorded for nine f2 primaries between 1 and 16 kHz, f2/f1 ratio = 1.22, and primary tone presentation levels L2 = 55 dB SPL and L1 based on a nonlinear function of L2 and f2 (Neely et al., 2019). The BTNRH dataset also included DPOAE responses recorded for two f2 frequencies = 1.5 and 4 kHz, with f2/f1 ratio = 1.22 and primary tone levels at L2 = 55 dB SPL and L1 = 61 dB SPL (Kummer et al., 2000). DPOAEs in the MUSC dataset were recorded at 14 f2 frequencies, half-octave bands for f2 primaries between 0.5–8 kHz, f2/f1 frequency ratio = 1.22, and primary tone presentation levels L2 = 55 dB SPL and L1 = 65 dB SPL. Additional information regarding the stimulus delivery and response measurements are further detailed in the earlier published studies (Kamerer, Kopun, Fultz, Neely, & Rasetshwane, 2019; Neely et al., 2019; Poling et al., 2012). Figure 3 shows the average audiograms, metabolic and sensory estimates, and average DPOAE responses for each dataset.

Average audiograms (A) and distribution of metabolic and sensory estimates (B–C) for the BTNRH and MUSC participants with DPOAE measurements. Response magnitudes in (D) are plotted as filled symbols and solid lines and the corresponding noise floors are plotted as dashed lines. * A subset of BTNRH participants had DPOAE measures at two f2 frequencies: 1.5 and 4 kHz.
Cochlear Reflectance Measurement
The CR response datasets were combined into a single analysis rather than testing for replications, because of the relatively small sample size of the MUSC dataset (Figure 4) and identical protocols across sites. The same equipment and procedures were used because the Fultz et al. (2020) experiment was implemented in collaboration with the coauthors at BTNRH (detailed in Fultz et al., 2020; Neely et al., 2019; Rasetshwane et al., 2015). The stimuli consisted of a wideband linear swept-frequency chirp at 60 dB SPL and WBN presented at 30, 40, and 50 dB SPL. Figure 4 shows the average audiograms, metabolic and sensory estimates, and average CR responses.

Average audiograms (A) and the distribution of metabolic and sensory estimates for the BTNRH and MUSC (B–C) participants with CR measurements. Lower CR responses occur with increasing presentation level (30, 40, 50 dB SPL; D-F, respectively). Differences in the hearing loss and CR responses likely resulted from recruitment differences at BTNRH and MUSC, which emphasized the detection of hearing impairments or age-related differences (respectively).
DPOAE and CR Responses
Both DPOAE and CR responses were measured for a subset of participants. The relatively small MUSC sample (N = 15; Figure 5) was combined with the dataset from BTNRH (N = 119) for a single analysis. Both measures were collected from the BTNRH participants for the same experiment (Neely et al., 2019), while the MUSC participants had each measure collected separately for the CR study (Fultz et al., 2020) and a longitudinal age-related hearing loss study. To limit possible longitudinal changes in the MUSC sample, the participants selected for analysis had less than 4 years between visits (average = 1.2 years) and average pure-tone threshold changes less than 7.5 dB HL (average = 4.7 dB HL).

Average audiograms (A), distribution of metabolic and sensory estimates (B), average DPOAE response (C), and average CR at the 50 dB SPL presentation level (D) from the participants who had both DPOAE and CR measures collected. The combined sample included 71 females and 63 males, ages 19 to 76 years.
Demographics and Noise History Information Analyses
Analyses were performed to characterize the extent to which metabolic or sensory estimates for both datasets were associated with participant age, sex, race, and self-reported noise history. The metabolic or sensory estimates were specified as the dependent variable in each analysis and age, sex, age–sex interaction, race, and noise history were the predictors. Because the majority of participants reported their race as “White” (MUSC: 74%, BTNRH: 90%), the effect of race was modeled categorically as White/non-White. For the BTNRH dataset, linear models were used to perform regression analyses with metabolic and sensory estimates based on better ear audiograms for each BTNRH participant. Linear mixed models with random subject effects terms were used to analyze the MUSC data, because most of those participants had estimates based on audiograms collected from both ears. Model testing was performed to remove factors that did not significantly contribute to model fit (p < .05).
Shape-Based DPOAE and CR Analyses
Generalized linear mixed-model (GLMM) regression analyses were performed to examine associations between metabolic or sensory estimates and the configuration of DPOAE and CR response across frequencies. Growth curve analysis (GCA; Mirman et al., 2008) was used to fit orthogonal polynomials to across-frequency DPOAE or CR responses (i.e., fitted intercepts and slopes; similar to the analyses by Vaden et al., 2018). The regression models specified frequency-level DPOAE and CR response magnitudes (dB) as the dependent variable, and separate CR analyses for each presentation level (30, 40, and 50 dB SPL). The main effects of metabolic or sensory estimates on DPOAE and CR responses across the measured frequencies are the intercept effects. A slope-metabolic interaction or a slope-sensory interaction term was included in the GLMM to estimate how the across-frequency slope of DPOAE and CR responses differed with respect to metabolic and sensory estimates (i.e., slope effects). Each regression model also included participant age and sex as predictors, and tympanometry measures were included as nuisance predictors (see section: Middle-Ear Status). Model testing was performed to remove nuisance predictors that did not significantly affect model fit (p > .05 threshold).
We predicted significantly lower response magnitudes for DPOAEs and CR with increasing metabolic estimates, similar to the pure-tone threshold patterns theorized to involve metabolic declines and our earlier observations based on TEOAE measures (Vaden et al., 2018). Likewise, negative-sloping responses in the DPOAEs and CR across frequencies were predicted to become steeper (more negative) for individuals with increasing sensory estimates, given that declines in high-frequency pure-tone thresholds often appear to spare thresholds at lower frequencies in sensory hearing losses (Dubno et al., 2013; Schmiedt, 2010).
Fitted intercepts and slopes were also compared across DPOAE and CR response measurements collected from the same subset of BTNRH and MUSC participants, by separately fitting those parameters for each participant, and then performing statistical tests with the fitted parameters. The parameters were statistically compared to determine, for example, whether lower DP-intercepts were significantly associated with lower CR-intercepts measured from the same participants. We used dB addition to combine across-frequency measurements for DPOAE and CR responses as a control measure that did not use orthogonal polynomials, which produced similar but numerically distinct results compared to across-frequency averages (i.e., fitted intercept). After significant correlations were observed in the configuration of DPOAE and CR responses, separate linear regression analyses were performed to determine the extent to which the fitted shape parameters were uniquely related to metabolic or sensory estimates.
Noise-Floor Considerations
The current study used measurements related to the noise-floor to mitigate effects related to noise or weak DPOAE/CR responses in the analyses. Because of the noise-floor differences observed (Figures 3–5), each analysis specified the response magnitudes (in dB) as the dependent variable rather than SNR per se. Moreover, the difference between the response magnitude and noise floor for DPOAE and CR measurements (i.e., SNR) was used to exclude weaker magnitude responses from analyses. A lower limit for SNR was empirically set to SNR < −10 dB to minimally exclude data, given that significant correlations typically shown for pure-tone thresholds and DPOAE/CR magnitude were only observed when responses with SNR < −10 dB were excluded. The SNR criterion excluded 4% of the DPOAE responses at individual frequencies for BTNRH (16% for MUSC; see noise floor in Figure 3(D)), 3–6% of the CR responses, and 4% of the responses from participants with both CR and DPOAE collected. The SNR criterion did not completely exclude DPOAE or CR responses for any participants.
Middle-Ear Status
Atypical tympanometry measurements can indicate middle-ear conditions that potentially introduce artifacts or preclude the accurate measurement of DPOAE and CR responses. The current study used poor or missing tympanometry measures as data acceptance criteria to exclude individuals (N = 15 BTNRH, N = 29 MUSC; Supplementary Figure 1) with values outside of a normal range: ear canal volume > 3 mL, absolute ear pressure ≥ 150 daPa, and compliance outside of the 0.2 to 2 mL range (Vaden et al., 2018).
Analysis Software
All analyses were performed in the R Statistics Language (R Core Team, 2022; Version 4.2.2), with R-packages that included lme4 (1.1.3), lmerTest (3.1.3), and colorBlindness (0.1.9).
Results
Demographics and Noise History
Significant associations were observed between the metabolic and sensory estimates and age, sex, race, and noise history, which were consistent across BTNRH and MUSC datasets (Table 2). Metabolic estimates were significantly higher for older participants and did not significantly differ with respect to participant sex or noise history, for both datasets. Race was not significantly associated with metabolic estimates for either site. For the MUSC participants with estimates for both ears, a significant correlation was observed across the left and right ears for the metabolic estimates, r(468) = 0.87, p < .001, which was significantly higher (Z = 7.17, p < .001) than the across ear correlation for the sensory estimates, r(468) = 0.74, p < .001. This observation was consistent with the prediction that sensory hearing losses are more asymmetrical than metabolic losses (Vaden et al., 2022).
Age, Sex, and Race Were Related to Metabolic and/or Sensory Estimates in Each Dataset.

Note. Metabolic estimates were not significantly (ns) associated with race, sex, age–sex interaction, noise history (Y/N), or LENS-Q score. Abbreviations are used for race: NW = non-White; W = White and sex: F = Female; M = Male. Satterthwaite approximation of DF was used for the GLMMs (MUSC only). Significance is denoted by asterisks: * p < .05, ** p < .01, *** p < .001 (two-tailed) and † denotes p < .05 (one-tailed).
MUSC = Medical University of South Carolina; BTNRH = Boys Town National Research Hospital; LENS-Q = Lifetime Exposure of Noise and Solvents Questionnaire; GLMM = generalized linear mixed-model.
Significant age–sex interactions were observed for the sensory estimates in each cohort, with significantly increased sensory estimates in relation to older age—an effect that was more pronounced for males than females. Positive noise histories were associated with higher sensory estimates for both datasets (Table 2), but not metabolic estimates (p > .13). The noise history associations with sensory estimates were weaker or nonsignificant when sex was also included in the same regression model (BTNRH: 1-tailed p = .03; MUSC: p = .70). Noise history was not clearly delineated from sex differences in the combined model because males were significantly more likely to report a positive noise history than females (MUSC: χ2 = 200.76, p < .001; BTNRH: χ2 = 41.30, p < .001). The sensory estimate was not significantly higher in relation to positive noise history when tested separately for males and females in either dataset (p > .12). Although LENS-Q scores were significantly higher for males than females, t(218) = 5.01, p < .001, higher LENS-Q scores were significantly associated with higher sensory estimates among males, t(100) = 2.36, p = .02. Together, these findings provided support for the interpretation that higher sensory estimates in males than females result from more extensive noise exposure. Although sensory estimates were significantly higher for White than non-White participants in each sample, race was not associated with positive noise history differences, χ2 < 0.20, p > .43, nor sex differences (χ2 < 0.62, p > .43). In summary, the metabolic estimates were significantly higher with older age in each dataset, and sensory estimates were higher for males with positive noise histories, older age, and for White participants.
DPOAE Response Configurations
Differences in the DPOAE responses in relation to metabolic or sensory estimates were illustrated by plotting average DPOAE responses across frequency that were adjusted for participant age and sex, with participants binned into quartiles of metabolic (Met) or sensory (Sen) estimates (Met Q1-Q4, Sen Q1-Q4, Figure 6). That is, each blue or red colored line represents the average DPOAE response from 25% of the participants, ranked by their metabolic or sensory estimates. The gray line in each panel represents the median DPOAE response. Higher metabolic estimates (darker blue lines) were associated with lower DPOAE responses across the frequency range in both cohorts (Figure 6(A–B), lines are parallel). Higher sensory estimates (darker red lines) were associated with lower DPOAE responses at 4 kHz and above; in contrast, higher sensory estimates were associated with higher DPOAE responses at 2 kHz and below (Figure 6(C–D), lines cross the median). In other words, higher sensory estimates were associated with even more negative sloping DPOAE responses.

Median DPOAE response adjusted for ear canal volume, compliance, participant age, and sex are shown as gray lines. Panels A–B show the average adjusted DPOAE response across frequency for participants binned into metabolic estimate quartiles (Met Q1–Q4, blue). Panels C–D show the average adjusted DPOAE response for participants binned into sensory estimate quartiles (Sen Q1–Q4, red). Significant shape effects (slope or intercept) are noted at the bottom of each panel.
The shape-based GCA analysis confirmed the predicted associations between metabolic estimates and intercepts, as well as sensory estimates and slopes in each dataset. Across f2 frequencies, DPOAEs showed significantly lower intercepts for individuals with higher metabolic estimates (Table 3). The DPOAEs also showed a significant metabolic estimate-related positive change in the sloping pattern of responses from lower to higher frequencies, which became shallower as the intercept decreased (Table 3; Figure 6(A–B)). In contrast with the metabolic effects, higher sensory estimates were significantly associated with steeper and more negative slopes in both datasets (Table 3, Figure 6(C–D)). As noted in the Methods section, the low-frequency peak shown for the MUSC participants is present in earlier DPOAE studies (e.g., Abdala et al., 2022; Dorn et al., 1998) and Figure 3 illustrates the consistency of DPOAE responses across sites.
DPOAE Response Configuration Effects of Metabolic and Sensory Estimates Were Tested With Separate GLMMs.

Note. Significance is denoted by asterisks: * p < .05, ** p < .01, *** p < .001 (two-tailed). Satterthwaite approximation was used for the GLMM degrees of freedom.
MUSC = Medical University of South Carolina; BTNRH = Boys Town National Research Hospital; GLMM = generalized linear mixed-model; DPOAE = distortion-product otoacoustic emission.
Results from the BTRNH two-frequency DPOAE subset (Table 4) were largely consistent with the other DPOAE configuration findings. Increased metabolic estimates were associated with significantly lower DPOAE response intercepts. Increased sensory estimates were associated with a significantly steeper and more negative DPOAE response slope. In summary, the consistent results across the datasets included significant metabolic effects for DPOAE intercepts and significant sensory effects for the DPOAE slopes. Together, these results suggest that a higher sensory estimate would map onto lower DPOAE responses at higher frequencies while sparing lower frequencies to some degree, while a higher metabolic estimate was associated with lower DPOAE responses across frequencies.
Two-Frequency DPOAEs (Kamerer, Kopun, Fultz, Neely, & Rasetshwane, 2019).

Note. Significance is denoted by asterisks: * p < .05, ** p < .01, *** p < .001 (two-tailed).
DPOAE = distortion-product otoacoustic emission
There was some evidence for race-related differences in DPOAE responses. White participants showed significantly lower DPOAE intercepts than non-White participants in the MUSC sample only, t(478) = −4.93, p < .001. Race differences in the DPOAE datasets from BTNRH were not significant, p > 0.1.
CR Response Configurations
The CR response configurations were significantly related to the metabolic estimates, but not sensory estimates. Figure 7 shows the average CR responses when participant data were binned into quartiles based on their metabolic estimates or sensory estimates (Met Q1-Q4, Sen Q1-Q4). Similar to DPOAEs (Figure 6), the blue or red lines represent the average CR response for 25% of the participants, ranked by their metabolic or sensory estimates, and the gray line represents the median response. Higher metabolic estimates and older age were significantly associated with lower CR intercepts and less negative slopes (Table 5, Figure 7(A)). There were no significant associations between the sensory estimates and CR configuration, nor sex-related differences. White participants had significantly lower intercepts than non-White participants, CR50: t(246) = −2.47, p = .01, but this was only significant in the 50 dB SPL presentation level condition.

Median CR response across frequency, adjusted for ear canal volume, compliance, participant age, and sex are shown as gray lines. Each colored line shows the average CR responses, binned into metabolic estimate quartiles (A; Met Q1–Q4, blue) or sensory estimate quartiles (B; Sen Q1–Q4, red). Only CR responses at the 50 dB SPL presentation level are shown, for clarity. Significant effects (slope or intercept) are indicated at the bottom of each panel.
Participants with Higher Metabolic Hearing Loss Estimates Showed Significantly Lower Intercepts and Positive Slopes in Their CR Responses (Left Column). In Contrast, the Sensory Effects Were not Significant (Right Column).

Note. Significance is denoted by asterisks: * p < .05, ** p < .01, *** p < .001 (two-tailed) and † denotes p < .05 (one-tailed). Satterthwaite approximation was used for the GLMM degrees of freedom.
CR = cochlear reflectance; GLMM = generalized linear mixed-model.
Associations Between DPOAE and CR Responses
Associations were characterized between across-frequency shape parameters from the DPOAE and CR responses for the subset of BTNRH and MUSC data that included measures from the same participants. Only the results for models that included CR50 are reported here because the significant results were the same for CR across presentation levels. After removing individuals with tympanometry measures that did not meet inclusion criteria, the sample included data from N = 134 participants; 71 females, 63 males; 56.3 ± 15.1 years of age. Significant associations were observed between the DPOAE and CR responses, weighted totals across frequencies, as calculated with dB addition, CR50: r(132) = 0.61; p < .001. The fitted intercept parameters for DPOAE and CR responses were also significantly associated, CR50: r(132) = 0.57; p < .001, as were the fitted slope parameters, CR50: r(132) = 0.36; p < .001. These associations suggest that overall DPOAE and CR responses share a moderate amount of variance (Figure 8(A)), as well as their configurations (Figure 8(B–C)).

Significant associations were observed for the DPOAE and CR responses (A), and the fitted intercept (B) and slope (C) parameters for DPOAE (x-axes) and CR (y-axes) in the N = 119 BTNRH participants (colored points) and N = 15 MUSC participants (dark points) with both measures collected (Fultz et al., 2020; Neely et al., 2019).
Interestingly, when the DPOAE and CR shape parameters were adjusted for metabolic and sensory estimates, their associations with each other were significant and essentially unchanged. The adjusted CR-intercepts and adjusted DPOAE-intercepts were significantly associated, CR50: r(132) = 0.47; p < .001, as were the fitted slopes, CR50: r(132) = 0.31, p < .001. This observation suggests that the DPOAE and CR configurations share variance that was independent of the metabolic and sensory estimates, even though both estimates were significantly associated with DPOAE and CR configurations (albeit less extensively for CR). Indeed, although the fitted shape parameters for DPOAE and CR were significantly correlated, those associations accounted for less than 50% of the shared variance (intercept R-square = 32%, slope R-square = 13%; adjusted for metabolic and sensory estimates, intercept R-square = 22%, slope R-square = 10%). Additional control analyses did not provide an explanation for the shared variance between intercepts or slopes, given that the R-square values were not changed after adjusting parameters for participant age, sex, and race, in addition to the metabolic and sensory estimates. While the shared variance potentially involves other participant characteristics, both DPOAE and CR configurations were also expected to share variance related to OHC function despite different generation mechanisms (see Discussion).
Next, we examined the degree to which DPOAE and CR measures uniquely explained variance in metabolic and sensory estimates. When modeled independently, the metabolic estimates were significantly associated with shape parameters for DPOAE and CR [intercepts: t(131) < −4.83, p < .001; slopes: t(131) > 2.42, p < .05]. When modeled together, however, only the metabolic association with DPOAE shape parameters remained significant, intercept: t(129) = −7.60, p < .001; slope: t(129) = 2.42, p = .02, and not CR shape parameters (p > .46). This result suggests that there is some redundancy between CR and DPOAE configuration and that DPOAE uniquely predicts the metabolic estimates. Modeling shape DPOAE and CR separately, sensory estimates were only significantly associated with the DPOAE shape parameters, intercept: t(131) = −1.66, 1−tail p = .005; slope: t(131) = −2.39, p = .02, and not CR shape parameters (p > .26). In the combined model, sensory estimates remained significantly associated with the DPOAE intercept, intercept: t(129) = −2.88, p = .002, but not the DPOAE slope (p = .22). Control analyses showed that the significant associations were not changed after adjusting for age, sex, and race differences. These results suggest that DPOAE configuration was more strongly associated with metabolic estimates because the significant associations for DPOAE configuration were not explained by CR in the combined regression model. In contrast, the association between DPOAE slope and sensory estimates was less robust to the inclusion of CR shape parameters in the same model.
Discussion
The current study provides new evidence that links OAEs to component estimates for metabolic (strial) or sensory (hair cell) hearing loss (Vaden et al., 2022), and follows earlier findings that implicated declines in OHC function to different subtypes of age-related hearing loss (Schmiedt, 2010; Vaden et al., 2018). Consistent with our predictions, our results suggest that DPOAE configurations were significantly associated with metabolic and sensory estimates. Declines in the intercept term, fitted to DPOAE response magnitude across frequencies, were most strongly associated with higher metabolic estimates. In other words, the metabolic estimates that are indicative of a broadly sloping hearing loss were reflected in lower DPOAE responses across a similarly broad range of frequencies. Meanwhile, declines in the fitted DPOAE slopes were significantly more negative for individuals with higher sensory estimates. This suggests that sensory hearing loss, which primarily affects high-frequency pure-tone thresholds, involved significantly smaller DPOAE responses at higher frequencies.
Interestingly, the DPOAE responses appeared to cross the median line with increasing sensory estimates (Figure 6(C–D)) and higher DPOAE responses at frequencies at or below 2 kHz. In other words, DPOAEs appeared higher than average at low frequencies for individuals with more sensory hearing loss. This is similar to the sensory audiometric profile with relatively preserved low-frequency pure-tone thresholds. One framework for understanding that finding is the battery model of age-related hearing loss (Schmiedt, 1993), which proposes that physiological interactions can occur between strial and OHC pathologies. Specifically, OHC losses are hypothesized to reduce the load on strial current, which can conserve EP levels despite strial atrophy. Accordingly, the battery theory predicts that sensory losses are associated with better hearing acuity and bigger DPOAEs at low frequencies than would otherwise be seen (Eckert et al., 2021; Vaden et al., 2022). Because the DPOAE results were replicated across both datasets, the current findings suggest that nonlinear distortion OAEs are sensitive to metabolic and sensory hearing loss estimates.
Participants with higher metabolic estimates also showed lower CR intercepts and shallower fitted slopes across the measured frequencies, in the combined BTNRH and MUSC dataset. This result indicated that lower CR responses occur across frequencies for individuals whose audiograms also show broad, sloping hearing losses. However, there were no significant associations between sensory estimates and CR response configuration at any presentation level. This was unexpected, given that CR response magnitudes were significantly associated with hearing sensitivity in the original studies (Fultz et al., 2020; Neely et al., 2019; Rasetshwane et al., 2015). The absence of a sensory effect despite significant metabolic effects on CR response configuration suggests that there may not have been a sufficient range of sensory estimates for sensitivity to their effects (Figure 4(C)). Another possibility is that the generation mechanisms for CR and DPOAE responses contribute to statistical sensitivity to the metabolic component but not the sensory component of age-related hearing loss.
Neither DPOAE nor CR responses have a functional link to either metabolic or sensory components that are independent of OHC function. Therefore, we should attribute any differences between DPOAE and CR response characteristics to their respective generation mechanisms. In that context, the differences we observed between DPOAE and CR responses may indicate that metabolic and sensory estimates are more specifically related to the nonlinear distortion component measured by DPOAEs (Rasetshwane & Neely, 2012; Shera & Guinan, 1999, 2008). When both measures were included in the same model, the distortion-based measure was more strongly related to metabolic estimates and sensory estimates than the reflection-based measure.
In the current study, we found DPOAEs to be more informative with respect to their dependence on age and age-related hearing loss compared to CR (Rasetshwane et al., 2015). This difference might be partly explained by years of extensive development of DPOAE measurement methods compared to CR. We also observed significant associations between DPOAE and CR response for participants with both measures collected, which did not depend on participant age, sex, race, or metabolic and sensory estimates. Instead, those results suggest that the shared sensitivity of both measures to OHC function accounts for the similarity in their configurations within individuals. Given that 60–70% of the variance in DPOAE and CR configuration was unshared, we also examined the degree to which configuration independently explained variation in metabolic or sensory components. The DPOAE shape parameters explained unique variance in the metabolic estimates, whereas CR did not show effects that were independent of DPOAE to the same degree. Together, these findings suggest that the OAE generation mechanism could underlie sensitivity to associations between OAE configuration and metabolic and sensory hearing loss.
Metabolic and sensory components of age-related hearing loss are theorized to involve combinations of cochlear pathologies, which is why they were predicted to be associated differently with respect to participant age, sex, race, and noise history. The present study found that metabolic estimates were higher for older participants across datasets, consistent with earlier observations (Vaden et al., 2022, 2017). Metabolic estimates were significantly higher for females than males, but only among the participants from the DPOAE datasets, which might be expected based on previously observed sex-related differences in low-frequency hearing loss (e.g., Gates et al., 1990; Gates & Cooper, 1991; Jerger et al., 1993; although c.f. Humes, 2021; Lee et al., 2005; Vaden et al., 2017). Sensory estimates were significantly higher for individuals with positive noise histories, regardless of the specific self-report questionnaire used and across datasets. Males showed significantly higher sensory estimates and positive noise histories compared to females in both datasets, which agrees with earlier findings (Dubno et al., 2013; Vaden et al., 2022, 2017) suggestive of sex differences in noise histories (i.e., sociocusis; Kryter, 1983). We also observed that the sensory component significantly increased with older age, but at a faster rate for males than females. An age-sex interaction has appeared somewhat inconsistently across earlier studies with regard to significant age-related differences for females or males (Dubno et al., 2013; Vaden et al., 2018, 2022, 2017). The age and sex-related differences in metabolic and sensory estimates were replicated across the BTNRH and MUSC participants, and reinforce the view that metabolic declines are predominant in age-related hearing loss (Schmiedt, 2010).
A long-standing scientific question relates to the lower prevalence of hearing loss for Black/African American participants as compared to people of other races. For example, Lin et al. (2011) found that race was the third-strongest predictor of hearing loss among adults 70 years and older, after age and gender, with a significantly reduced risk for Black/African American participants compared to White participants. However, previous studies have found mixed results regarding the question of race-related differences in hearing loss or equivalent hearing loss (e.g., Kryter, 1983; Royster et al., 1980). The current study found some evidence for race-related differences, which were more clearly observed for the MUSC dataset that included a larger proportion of non-White participants, MUSC 26%, BTNRH 10%. Specifically, non-White participants appeared to have significantly lower sensory estimates, and higher DPOAE and CR intercepts compared to White participants. The observation that sensory estimates were significantly lower for non-White participants was consistent with a hypothesis that melanin may confer some protection against OHC damage (see review by Mujica-Mota et al., 2015), particularly since there was no significant race-related difference in noise histories. The observation of higher across-frequency DPOAE and CR responses for non-White participants was also suggestive of less extensive metabolic hearing loss compared to White participants, although the metabolic estimates were not significantly associated with race.
We note that there are differences of opinion regarding the contribution of cochlear pathologies to age-related hearing loss, particularly following a publication by Wu et al. (2020). Their study established a measure of fractional damage to IHCs and OHCs, not just death, which was more extensive than previously appreciated in middle-age and older adult cochleas from human temporal bones. Their claim that sensory damage (both IHCs and OHCs) dominated age-related hearing loss was not well-supported, given that 60–80% of hearing threshold variation was not explained by those measurements. Those significant but weak associations were obtained in a sample with more pervasive sensory hearing losses than community-based research samples typically include. Our view is that their nonsignificant strial findings should also be approached with caution. For example, Wu et al. noted that OHC damage in their sample was so extensive that the cochlear amplifier would likely be dysfunctional regardless of EP levels. Similarly, the battery model of age-related hearing loss suggests that sensory losses may reduce the load or demand for EP (Eckert et al., 2021; Schmiedt, 1993), such that strial condition has a smaller effect on cochlear amplification. In other words, hearing losses that result from strial degeneration may be less evident to the extent that OHC losses conserve EP levels. Finally, activated macrophages across the stria vascularis appear to be a better predictor of hearing thresholds than strial atrophy as defined by strial thickness, in a recently published mouse model and histopathology study linking age-related inflammatory dysfunction to strial declines (Lang et al., 2023).
Limitations. We note some limitations of the present study. Given our focus on age-related hearing loss and otoacoustic emissions, it is worth noting that participants with measurable OAEs are likely to have milder hearing losses than participants in other studies without those measurements. This selection criterion was necessary to investigate measures of cochlear function in the current study, however, we acknowledge that it could influence demographic and noise history effects. Nevertheless, the distribution of metabolic and sensory components was still quite broad within each dataset. Other potential limitations of the current study could include the use of different equipment and procedures for measuring DPOAEs at the two sites, although the results were replicated across sites despite those methodological differences. The current study did not characterize associations between metabolic and sensory estimates and OAE growth functions, however, this may be an important future direction given evidence of differential changes in OAEs and audiometric thresholds in animal models (Mills & Schmiedt, 2004). We also recognize the limitations involved with self-reported noise history, which are well-known, but again despite their limitations have produced consistent results with respect to metabolic and sensory estimates.
Conclusions
The current findings provided additional support for metabolic and sensory estimates of age-related hearing loss derived from audiograms (Dubno et al., 2013; Vaden et al., 2022), based on their significant associations with demographic information, noise history, and OAEs that were replicated across two independently collected and large retrospective datasets from community-based research samples. Briefly summarized, the findings from the current study showed that the metabolic component was higher for older participants and was associated with lower DPOAE and CR intercepts across frequencies, whereas the sensory component was higher for males with self-reported positive noise histories and was associated with steeper and more negative slopes in the DPOAE responses. Although we observed moderate strength associations between DPOAE and CR responses, the DPOAE responses explained more unique variance in the metabolic estimates than CR responses. Differentiating metabolic and sensory components could support more targeted treatment of age-related hearing loss (Eckert et al., 2021), which is hypothesized to involve a combination of declines in strial and sensory function. Our findings suggest distortion-based responses can provide additional information on the cochlear pathologies involved with age-related hearing loss.
Supplemental Material
sj-docx-1-tia-10.1177_23312165231213776 - Supplemental material for Metabolic and Sensory Components of Age-Related Hearing Loss: Associations With Distortion- and Reflection-Based Otoacoustic Emissions
Supplemental material, sj-docx-1-tia-10.1177_23312165231213776 for Metabolic and Sensory Components of Age-Related Hearing Loss: Associations With Distortion- and Reflection-Based Otoacoustic Emissions by Kenneth I. Vaden Jr, Stephen T. Neely, Sara E. Harris and Judy R. Dubno in Trends in Hearing
Footnotes
Acknowledgments
We thank Rick Schmiedt and Jayne Ahlstrom for helpful comments on the manuscript, as well as the authors of the original studies that contributed data for this study: Carissa Allen, Michael P. Gorga, Aryn Kamerer, Judy G. Kopun, Natalie M. Lenzen, and Daniel M. Rasetshwane. We also thank the study participants.
Data Availability Statement
Following publication, the deidentified data that underlie the results reported in this article (text, tables, figures, and appendices) can be requested from the corresponding author and accessed with appropriate IRB and institutional approvals from Boys Town National Research Hospital and/or Medical University of South Carolina.
Declaration of Conflicting Interests
The authors declared no potential conflicts of interest with respect to the research, authorship, and/or publication of this article.
Funding
This work and the original studies at MUSC were supported (in part) by the National Institutes of Health/National Institute on Deafness and Other Communication Disorders (NIH/NIDCD) grant number P50 DC000422 and the National Center for Advancing Translational Sciences of the NIH under grant number UL1 TR001450. This investigation was conducted in a facility constructed with support from the Research Facilities Improvement Program (grant number C06 RR014516) from the NIH/National Center for Research Resources. The original research studies at BTNRH were supported by NIH/NIDCD grant numbers R01 DC008318, P30 DC004662, R01 DC016348, and T32 DC000013.
Supplemental Material
Supplemental material for this article is available online.
References
Supplementary Material
Please find the following supplemental material available below.
For Open Access articles published under a Creative Commons License, all supplemental material carries the same license as the article it is associated with.
For non-Open Access articles published, all supplemental material carries a non-exclusive license, and permission requests for re-use of supplemental material or any part of supplemental material shall be sent directly to the copyright owner as specified in the copyright notice associated with the article.