
Abstract
The Abbreviated Profile of Hearing Aid Benefit (APHAB) has been one of the most frequently used patient-reported outcome measures (PROMs) since its inception 30 years ago. For the APHAB, single-valued 95% critical differences have been presented for the identification and interpretation of meaningful benefits in research and in the clinic. A narrative literature review of studies that used the global APHAB score as a hearing-aid outcome measure showed that the average benefit varied directly with the average unaided baseline score for each measure. Next, data from 584 older adults enrolled in our recently completed randomized controlled hearing-aid trial were examined. The same dependence of benefit scores on unaided baseline scores was observed in these data. Regression to the mean made relatively minor contributions to the observed dependence of APHAB scores on baseline unaided scores. These results indicate that the application of a single value for the 95% critical difference is not valid for the interpretation of APHAB scores. Rather, baseline-specific benefit criteria are needed. Based on these results, baseline-specific Minimal Detectable Differences (MDDs; or 95% critical differences) and Minimal Clinically Important Differences (MCIDs) using both distribution-based and anchor-based approaches were generated for the APHAB-global score.
Keywords
Introduction
Hearing aids represent the primary intervention for millions of adults with audiometric hearing loss of sensorineural origin ranging in severity from mild to severe. Many patient-reported outcome measures (PROMs) have been developed for the evaluation of hearing aid benefits over the past several decades. Several systematic reviews have consistently identified the abbreviated profile of hearing aid benefit (APHAB; Cox & Alexander, 1995) as among the most widely used hearing-aid PROMs (Granberg et al., 2014; Perez & Edmonds, 2012). In Germany, the APHAB appears to be the most widely used self-report measure due to its use in supporting insurance coverage of hearing aids (Löhler et al., 2017b).
The 24-item APHAB was derived from its longer parent PROM, the 66-item Profile of Hearing Aid Performance (PHAP; Cox et al., 1991; Cox & Gilmore, 1990; Cox & Rivera, 1992). Both PHAP-based measures use a seven-item response scale that asks the frequency with which the respondent experiences various hearing difficulties, with responses ranging from “never (1%)” to “always (99%),” higher scores reflecting more frequently experienced difficulties. Several items, however, are reversed to minimize response bias (Cox & Alexander, 1995; Cox & Gilmore, 1990). Unaided and aided PHAP and Abbreviated PHAP (APHAP) scores are obtained with the aided scores subtracted from the unaided baseline scores to derive the Profile of Hearing Aid Benefit (PHAB) score or the APHAB score for the abbreviated version. In other words, PHAB = PHAPu-PHAPa and APHAB = APHAPu-APHAPa, where the subscripts “u” and “a” denote “unaided” and “aided” scores, respectively. All PHAP and APHAP scores have been expressed as percentages, tied to the percentages listed with each response. So too have the benefit scores, PHAB and APHAB, been expressed as percentages, the simple difference in frequency-of-occurrence percentages between unaided baseline and aided scores.
Factor analyses of PHAB scores led to the development of seven PHAB subscales, five pertaining to communication difficulties in a variety of listening conditions (ease of communication, EC; familiar talkers, FT; background noise, BN; reverberation, RV; and reduced cues, RC) and two pertaining to the distortion (DS) and aversiveness (AV) of environmental sounds (Cox & Gilmore, 1990). The APHAB retained four of the original seven PHAB subscales, but each scale was limited to six items, three scales pertaining to communication difficulties (EC, BN, and RV), and one focused on the aversiveness of environmental sounds (AV). Several subsequent studies found the communication subscales of the PHAB or the APHAB to be strongly correlated and these subscales were typically reduced to a single score, the PHAB-global or the APHAB-global score (Chisolm et al., 2005; Cox et al., 2007; De Sousa et al., 2023, 2024; Dornhoffer et al., 2020; Humes et al., 2003; Humes et al., 2017; Knoetze et al., 2024; Kochkin, 1997; Sabin et al., 2020). Each global score is the mean for the communication-related items only: 18 of 24 items for the APHAB-global and 47 of 66 items for the PHAB-global. Although the longer PHAB has been used frequently in clinical research, including several clinical trials comparing technologies (e.g., Haskell et al., 2002; Larson et al., 2000; Walden et al., 1998, 1999, 2000) and in recent randomized controlled trials evaluating fitting methods (e.g., Humes et al., 2017; Humes et al., 2025), the shorter APHAB PROM is widely used clinically and has been used in many more studies of hearing-aid outcomes. Hence, the rest of this article focuses primarily on the APHAP/B measures.
In recent randomized controlled trials (RCTs) using hearing-aid PROMs conducted by the authors (Humes et al., 2025; Sabin et al., 2020), we have attempted to identify individuals with substantial improvements using the APHAB-global score. Various definitions of “substantial improvement” have been advocated for use in RCTs (e.g., Klukowska et al., 2024; Norman et al., 2003; Sedaghat, 2019) with most centered on the concept of the minimal clinically important difference (MCID). The MCID is more than a “statistically significant” difference from baseline to post-intervention. It identifies the minimal difference that will likely be important to the individual and affect the individual's function (Jaeschke et al., 1989). Klukowska et al. (2024) identified and reviewed thirteen different methods and Franceschini et al. (2023) seventeen methods used in other fields to generate MCIDs for PROMs. Most approaches to calculation can be categorized into one of two types, distribution-based methods and anchor-based methods (Franceschini et al., 2023; Klukowska et al., 2024; Norman et al., 2003; Sedaghat, 2019). In anchor-based approaches, the anchor is an independent assessment of meaningful change that can be linked to the outcome measure of interest. It can be a simple and direct query about the meaningfulness of the intervention's impact or can be derived from other measures of “success,” such as intervention adherence or daily usage. Both approaches have been used frequently in clinical otolaryngology research (Tripathi et al., 2024).
In some cases, anchor-based methods have asked those completing an intervention to directly rate the impact of the intervention on their everyday function or life, typically using a single query with five- to seven-item responses (e.g., a 5-point Likert scale with responses ranging from “much worse” to “much better”). The PROM of interest is then evaluated for the 5-to-7 subgroups formed from their responses to this query to establish a clinically meaningful difference (Jaeschke et al., 1989; Sedaghat, 2019). Another approach is to use Receiver Operating Characteristic (ROC) curves to assess the sensitivity and specificity of the PROM in identifying those with successful interventions (Franceschini et al., 2023; Klukowska et al., 2024; Sedaghat, 2019). For hearing-aid PROMs, “success” has often been defined based on retention and daily use of the purchased hearing aids (Cox & Alexander, 1995; Cox & Rivera, 1992; Hickson et al., 2010; Humes, 2021; Humes et al., 2003; Humes & Humes, 2004).
When an anchor item has not been obtained in an RCT and clinical guidance has not previously established the clinical importance of differences for a given PROM, researchers have typically resorted to distribution-based methods to establish the MCID. The two most common distribution-based methods for estimating the MCID are based on the standard deviation of the baseline PROM scores (SDb) from a representative sample of individuals. The most widely used formulas to estimate MCIDs have been MCID = 0.5 × SDb and MCID = SDb × (1–rxx)0.5, the latter being an estimate of the standard error of measurement (SEM) based on the test‒retest correlation (rxx). The popularity of these two distribution-based methods of MCID calculation has been confirmed recently for research in otolaryngology (Tripathi et al., 2024). Another widely used distribution-based estimate of the MCID is more often referred to as the minimal detectable difference (MDD; Norman et al., 2003; Sedaghat, 2019), calculated as MDD = 1.96 × 20.5 × SEM. The latter has been commonly employed in audiology in the form of 95% critical differences (Cox & Alexander, 1995; Cox & Gilmore, 1990; Demorest & Walden, 1984; Weinstein et al., 1986), Demorest and Erdman (1988) describing an empirical approach to the estimation of MDDs or critical differences directly from the distributions of test‒retest differences. MDDs are the smallest differences that can be reliably detected using the PROM whereas MCIDs are the smallest detectable differences that have clinical importance to those receiving the intervention. MCIDs, therefore, are expected to be slightly to substantially larger than the corresponding MDDs for a given PROM.
For hearing-aid PROMs, MDDs or critical differences most often have been reported as single values, and this holds for the APHAB. For the APHAB, Cox and Alexander (1995) reported 95% critical differences of 26% for unaided and aided APHAP scores and 33% for the APHAB benefit score, all for individual subscales. That is, the aided frequency of speech-communication difficulties was 26 percentage points lower than the baseline unaided frequency of occurrence. For the APHAB-global, Chisolm et al. (2005) reported 95% critical-difference values of 17.8% and 15.9% for test‒retest intervals of 2 or 10 weeks, respectively. Applying the 95% critical difference of about 17% established for the APHAB-global by Chisolm et al. (2005), individuals with APHAB-global scores ≥17% would be considered to have clinically significant benefit regardless of the original unaided baseline APHAP-global score.
The use of a single critical difference, MDD, or MCID value for hearing-aid PROMs is counterintuitive. Consider, for example, two individuals, A and B, who have baseline APHAP-global scores of 17% and 68%. Based on the 95% critical differences for the APHAB-global of 17%, Person A would be required to report an aided frequency of communication difficulties of 0%, a complete elimination of communication difficulties, whereas a change in score of 17 percentage points for Person B would reflect about a 25% reduction from baseline difficulties. Would such widely differing reductions in communication difficulties relative to unaided baseline be considered of comparable clinical importance? Our recent experiences with the APHAB in RCTs suggested that the MCID, MDD, and 95% critical differences should be tied to baseline performance, each increasing as baseline function worsened (scores increased). Baseline-dependent benefit has been noted previously in other fields (e.g., Wang, Hart, Stratford & Mioduski, 2011) as well as for hearing-aid PROMs, including the APHAB-global score (e.g., Kochkin, 1997). Noting the dependence of APHAB-global benefit scores on unaided APHAP-global scores, Kochkin (1997) suggested that the percentage reduction from unaided to aided APHAP-global scores be used rather than the difference score (APHAB-global).
In this article, we build on this proposal of Kochkin (1997) to further explore the dependence of APHAB-global scores on the baseline unaided APHAP-global scores. The goal is to obtain a valid interpretation of the change in APHAP scores from unaided to aided conditions so that meaningful benefits from hearing aids can be better determined.
Interpretation of PHAP-Based PROMs
Despite the popularity and broad use of the APHAB, the interpretation of scores is challenging. The scores, as noted, estimate the frequency of difficulties of various types experienced by adults with hearing difficulties and are represented by percentage estimates ranging from 1% to 99%. This part of the scoring is straightforward, but how are the differences from unaided to aided, the derived-benefit measures, to be interpreted? What does a reduction in frequency of difficulties of 17 percentage points mean for individual hearing-aid wearers with different unaided baseline scores?
To assist in the interpretation of the benefit measures, Cox and colleagues identified groups of 55 to 117 successful hearing-aid users and established normative percentiles for APHAB scores among these groups of successful users (Cox & Alexander, 1995; Johnson et al., 2010). In these normative studies, “hearing aid success” was defined as the use of hearing aids for at least one year and self-reported usage of at least four hours per day. Only the most recent of these studies (Johnson et al., 2010) included percentiles for APHAB-global scores for unaided, aided, and benefit measures. Median APHAP/B-global scores were 70%, 33%, and 35% in Johnson et al. (2010; N = 117) for unaided, aided, and benefit measures, respectively. Clearly, the observed benefit for the median successful hearing-aid user in these normative guidelines greatly exceeds the reported 95% critical difference of 17%.The median APHAB-global score of 35% represents a halving of aided difficulties from the median unaided baseline global score of 70%. We argue here, however, that an APHAB-global benefit of 35% should only be the expected or targeted benefit for those successful hearing-aid users who have an unaided baseline APHAP-global score of 70%.
In all the normative studies of Cox and colleagues, scores for successful users from the 5th to the 95th percentiles were provided. This allowed each respondent's score to be compared to the distribution of scores among successful hearing-aid users to establish some sense of the likelihood of that respondent becoming a successful user. Given the relatively small sample sizes of each normative group, however, the robustness of these other estimated percentiles, perhaps even the medians, is questionable for broad application. Regardless of the specific percentile under consideration, the interpretation of the expected benefit for successful hearing-aid users is problematic when the individual compared to those normative values differs from the successful users in baseline characteristics, including in unaided APHAP-global score.
Rather than interpreting the APHAP/B-global scores relative to the percentiles from successful hearing-aid users, we propose directly interpreting the scores from the labels ascribed to the seven response alternatives used in the APHAP. The first two columns of Table 1 show the seven response categories used in the APHAP (Cox & Alexander, 1995). Using the assigned percentages, lower and upper limits to each response category were established by bisecting the differences in the assigned percentages between successive response categories. These limits are also provided in Table 1. To offer better resolution of responses, response scale steps of ½-category were then generated and appear in the four right-most columns of Table 1.
APHAP Response Categories and Assigned Percentage Scores with Lower (LL) and Upper (UL) Limits to Provide a Range of Percentage Scores for each Response Category. To Provide More Response Resolution, a Half-Step Response Scale was Created and this Response Scale Is Shown in the Right Four Columns.

Extreme APHAP-global scores rarely occur. For example, in the NU dataset from our recently completed RCT (Humes et al., 2025; N = 584), global scores falling in the range from “seldom/occasionally” (category 2.5) to “generally/practically always” (category 5.5) represented about 90% of the score categories. For the aided APHAP-global, 90% of the score categories fell between “never/seldom” (category 1.5) to “half the time” (category 4). The infrequent use of the extreme ends of the seven-point response scale basically collapses the scale from seven responses to about four or five. This provides further justification for the use of a ½-step scale to provide better resolution of responses over the range used by most respondents. Across unaided and aided conditions, most of the data available fall in the response range 2.5 to 5.5 for the ½-step response scale (Table 1).
For seven-item Likert scales, frequently used in PROMs, the most common criteria for MCID values have ranged from 0.5 to 1 response units on the seven-item scale with broad use of 0.5 × SDb as the MCID (Norman et al., 2003). Such a criterion for change results in an MCID that corresponds to a Cohen's-d effect size of 0.5, a medium effect size. If the criterion for change was based on ½-unit changes on a seven-point ordinal response scale, this would result in 0.25 × SDb as the SD-based change criterion, which corresponds to a Cohen's-d effect size of 0.25. Cohen's-d values from 0.2 to 0.5 have been frequently used in establishing MCIDs of PROMs (Klukowska et al., 2024), representing either small or medium effect sizes.
In the sections to follow, we present evidence from the literature and from our recently completed RCT on the dependence of hearing-aid benefit, captured via the APHAB, on baseline performance. Such dependence suggests that baseline-dependent MCIDs, MDDs, or 95% critical differences, may be needed to appropriately determine clinically meaningful benefits for individuals. These data are then used to develop baseline-specific MDDs and MCIDs for the APHAB-global PROM. Distribution-based estimates of the MCID and MDD, both based on SDb, are presented first, followed by exploration of an anchor-based method tied to the successful use of hearing aids 6 months after the fitting.
Evidence for the Dependence of Benefit on Baseline
Analyses
We took two main approaches to examining the dependence of APHAB scores on baseline unaided APHAP scores: (a) a targeted narrative review of the literature; and (b) analyses of individual data from an RCT recently completed by the authors (Humes et al., 2025). For the first, we sought several studies from the peer-reviewed literature that reported unaided APHAP scores and at least an aided APHAP score or an APHAB score from adults. If the global scores were not provided, then scale scores for the three scales comprising the global scores (EC, RV, BN) had to be available (and were averaged to generate the global score). The goal of this review was to identify enough studies and participants to permit examination of any association between APHAB scores on the unaided baseline scores.
Twelve studies reported the requisite APHAP/B scores. Details of these 12 studies are given in Table 2. The total sample size across studies was 36,874, but this was largely due to the scores from 35,000 adults reported by Löhler et al. (2017b), the remaining 1,874 coming from the other 11 studies. The grand mean age (not weighted by sample size) was 72.6 years. Most of the participants were older adults with mild-to-moderate sloping sensorineural hearing loss and most were fitted bilaterally. The percentage of new hearing-aid users varied widely (0–100%) across studies. In addition, aided APHAP-global scores were obtained at a variety of post-fitting intervals, ranging from four weeks to several years. The mean unaided baseline scores ranged from about 36 to 76.
Summary of Studies Identified from the Narrative Review.

Note. M = mean; SD = standard deviation; wks = weeks; mos = months; yrs = years; avg. = average; for hearing loss severity: Mi = mild; Mo = moderate; S = severe; HA = hearing aid.
Global scores = mean of reported mean scale scores for ease of communication (EC), reverberation (RV) and background noise (BN) scales.
For the analyses of the APHAP-global scores from the RCT of Humes et al. (2025), data from 584 adults for unaided and aided conditions, the NU dataset, were included. Forty-four percent were male. Ages ranged from 50 to 81 years (M = 69.1 and SD = 6.6 years). Better-ear four-frequency (500, 1000, 2000 and 4000 Hz) pure-tone-average, PTA4, ranged from 6.25 to 50.0 dB HL (M = 32.1 dB HL; SD = 9.1 dB HL) and baseline APHAP-global scores ranged from 3.4% to 89.7% (M = 38.8%; SD = 17.6%). The full 66-item PHAP was administered and the APHAP scores were obtained by extracting the pertinent item responses.
Results of Analyses of Baseline Dependence
The mean APHAB-global benefit scores (mean unaided APHAP-global score – mean aided APHAP-global score) from Table 2 are plotted versus the corresponding unaided APHAP-global baseline score in the top panel of Figure 1. The best-fitting line, fitted to the unweighted mean values in the top panel of Figure 1, is also shown and the linear-regression parameters are provided in that panel. It would clearly be inappropriate to apply a single magnitude of benefit, such as 17%, as a meaningful change for all. Such a fixed value would appear to be typical or average for those with baseline unaided APHAP-global scores of 30%–40% but would only represent about half the typical benefit observed for those with baseline APHAP-global scores of 70%.

The top panel shows the mean APHAB-global scores plotted as a function of the APHAP-global baseline score for several studies. The middle panel shows box plots for the APHAB-global scores from the NU dataset for each of four groups representing the most prevalent baseline-response groups (N = 574 of 584 in these groups). The bottom panel shows the individual data from the NU dataset (N = 584). In all three panels, the solid line (red, online) is the best-fitting line fitted to the data, fitted to the medians in the top two panels and to the individual data in the bottom panel. Regression parameters are shown at the top of each panel.
The middle and bottom panels of Figure 1 show the NU data. Four APHAP-global baseline groups were formed that had large samples (N = 99 to 130; response-category groups 2.5, 3, 3.5, and 4 from Table 1; total N = 574 of 584). Boxplots (middle panel) were generated for each group. As the median baseline score increased, APHAB-global also increased. The best-fitting line fitted to the median values in the middle panel shows a 0.67 change in aided benefit with every one-unit change in baseline score. Thus, the average amount of benefit decreases as the average baseline score decreases.
The bottom panel of Figure 1 shows the corresponding individual APHAP-global data from the 584 adults in the NU dataset. Much higher r2 values were obtained, as expected, for the linear regression fit to the medians in the middle panel compared to the fit to the individual data in the bottom panel. Across all three panels, slopes were less than 1, ranging from 0.56 to 0.67. The slopes of the best-fitting equations indicate that APHAB-global is about 55%–67% of unaided APHAP-global score, consistent with Kochkin (1997, 2003). The distribution of the proportional improvements in APHAP-global provided by Kochkin (2003), however, was almost rectangular from 0.05 to 0.75 (Kochkin, 2003). Such large individual variation in APHAB-global scores is reflected in the linear-regression fit to the individual data in the bottom panel of Figure 1 which accounts for only 42% of the variation in APHAB-global.
When the independent variables of age and better-ear PTA4 were added to linear-regression analyses of the individual NU data, the best-fitting model was significant [F(3, 580) = 141.3, p < .001], but only the APHAP-global baseline score was a significant predictor (t = 19.1, p < .001) with p > .39 for each of the other predictors. The correlation between APHAP-global baseline and benefit was r = .65 and this decreased only slightly when controlling the effects of the covariates (part and partial r = .62, .60). Equivalent results were obtained for each gender separately. These findings suggest that the baseline unaided APHAP-global score is the primary determiner of the benefit measured by the APHAB-global PROM, at least among the predictors considered here.
The dependence of APHAB-global scores on unaided APHAP-global baseline scores is not unlike that which can occur from regression to the mean. It is well known that when a test, such as the APHAP, is administered twice, there is a tendency for the scores on the second administration (aided scores here) to regress toward the population mean due simply to chance (Cronbach & Furby, 1970; Nunnally, 1967). As a result, when differences are calculated between the two test scores, patterns not unlike that shown in Figure 1 have been observed. The effects of regression to the mean should always be considered in studies involving pre- and post-intervention assessments with the same test (e.g., Crosby et al., 2003; Edwards et al., 1978; Speer, 1992). The greater the reliability of the test, however, the less the role played by regression to the mean. Depending on the specific measure of reliability, the reliability of the APHAP has been estimated to be .8 < rxx < .95, all suggesting relatively minor contributions of regression to the mean in the data shown in Figure 1. Regression to the mean is considered in greater detail in the Discussion.
Despite a long history of use of the APHAB, there is relatively little guidance as to how one should interpret the observed unaided APHAP-global scores. Most evaluations of APHAP-global unaided scores have focused on validation of the subscales using other audiologic information, such as pure-tone thresholds and speech-audiometry (Cox et al., 2003; Löhler et al., 2017a). Löhler et al. (2017a) suggested that the unaided APHAP is so dependent on pure-tone hearing loss that it could be used to screen for the presence of such hearing loss. They reported that an unaided APHAB-global score of 15% was the best cut-point for the identification of adults with audiometric hearing loss (PTA4 > 25 dB HL). There appears to have been little evaluation of the functional significance of unaided APHAP-global scores, however, beyond associations with pure-tone and speech audiometry. Rather, the focus in most analyses has been on the derived-benefit measure, the APHAB-global score.
Due to the general lack of research on the functional interpretation of unaided APHAP-global scores, which is desirable for the segregation of individuals into functionally relevant groups, we have opted to form baseline groups tied to the response categories used in the APHAP (Table 1). Others have opted to rely on percentiles or quartiles to determine how a given individual fares in comparison to similar peers but as noted above, this depends critically on the characteristics of the peer group, including unaided APHAP scores. In addition, quartiles and percentiles only provide a perspective on performance or benefit relative to that of the peer group or norms, not the absolute functional performance or benefit. We felt that categorical changes in the PHAP-based measure would better reflect functional changes resulting from intervention than the use of percentile-based norms. For example, an unaided APHAP-global score corresponding to experiencing communication difficulties “half the time” (4) that then improved to a score corresponding to “occasionally” having such difficulties (3) is more directly interpretable than the comparison of each score to normative data.
We next sought to establish baseline-dependent MCIDs for the APHAB. Distribution-based estimates of the MCIDs for the APHAB-global score were estimated first, followed by an anchor-based estimate. The anchor was based on hearing-aid “success”: the retention and daily usage of the devices 6 months after the hearing-aid fitting.
Derivation of MDDs and MCIDs
As noted in the Introduction, both the MCID and the MDD are often derived from the baseline (unaided) standard deviation, SDb. Establishing good estimates of the baseline SD for the populations for whom hearing-aid PROMs are targeted is critical to deriving appropriate distribution-based MCID values. Figure 2 shows the SDb values for the APHAP-global score for each of the most prevalent response-category groups. It is well known that the SD depends on the range of scores (e.g., Hozo et al., 2005; Shi et al., 2020), often referred to as the “range rule,” which simply states that the SD = range/4. The solid line in Figure 2 plots this simple approximation using the observed range of scores for each response-category group. The baseline SD is clearly driven, in large part, by the range of scores for each response group. This follows from the partitioning of the results into groups based on identical score ranges (Table 1). Importantly, the one-size-fits-all population estimates at the far right for the APHAP-global agree with the single-value estimates reported in the literature but are clearly much larger than the SDb values for each baseline group. This too follows from the dependence of SDb on the range of scores.

The boot-strapped (N = 1000) standard deviations and 95% confidence intervals for unaided baseline (SDb) are plotted as a function of baseline response category (in ½-steps) over the range of the most prevalent baseline responses for the APHAP PROM. The solid line is the predicted SDb based on the range of scores within each response-category group.
The boot-strapped SDb values from Figure 2 are provided in Table 3 for the APHAP-global, along with the 95% confidence intervals for each estimate. (Boot-strapped estimates generated throughout this article were based on 1,000 repetitions with bias-correction and acceleration of estimates, BCa.) Next, the MCID was calculated in various ways. The simplest estimate, one-half the SDb value, is provided in the next column of Table 3. This is equivalent to a Cohen's-d effect-size criterion of d = 0.5, a medium effect size, when the baseline SD is used in the denominator (Klukowska et al., 2024; Norman et al., 2003; Sedaghat, 2019). MCID estimates based on d = 0.25, a small-effect criterion, can be generated from SDb estimates in Table 3 by multiplying SDb by 0.25 instead of 0.5.
Boot-Strapped Estimates of Baseline SD and Derived Estimates of Minimum Clinically Important Differences (MCID) for the APHAB-Global for Each of Three Different Estimation Methods.

Note. Estimates were derived from the APHAP-global dataset (NU, N = 584). SD = standard deviation; CI = confidence interval; SEM = standard error of measurement; rxx = test−retest correlation.
Another estimation method, shown in the last column of Table 3, involves first calculating the standard error of measurement (SEM) from the SDb value using the test‒retest correlation (rxx) and then multiplying this by 2.77 (1.96 × 20.5; Demorest & Walden, 1984; Klukowska et al., 2024; Norman et al., 2003; Sedaghat, 2019). Because the benefit measures are difference scores, unaided—aided, the SEM of both scores must be considered. This results in the standard error of the difference score equaling 20.5 × SEM. Finally, the 95% confidence interval is obtained by multiplying 20.5 × SEM by 1.96 (or, SEM × 2.77). The test‒retest correlation, rxx, was estimated to be 0.85 for the APHAP-global baseline scores (Cox & Alexander, 1995); the derivation of this estimate is described in more detail in the Discussion.
As expected (e.g., Franceschini et al., 2023; Klukowska et al., 2024), the various MCID estimates in Table 3 do not converge on the same values. However, the SDb and SEM × 2.77 estimates are quite similar which arises from use of rxx = .85 as the test‒retest correlation for both PROMs.
Regardless of the method of computation, the distribution-based MCID estimates in Table 3 for the APHAP-global PROM clearly vary somewhat across baseline groups, as shown in Figure 2 for SDb. To demonstrate the consequences of this variation, the SEM-based MDD estimate of 19% for the APHAB-global, a value in line with estimates in the literature, was applied to the NU dataset. This study was of interest because 83.9% of those who enrolled kept their hearing aids after a 6-week trial period. When a single MDD of 19% for the APHAB-global benefit was applied, 41.2% of the total sample exceeded the MDD with values of 5.6%, 32.2%, 63.4%, 72.7%, 68.6%, and 72.2% for unaided baseline APHAP-global response categories of 3.0 to 5.5, respectively. When the baseline-specific MDDs in Table 3 were applied to the APHAB-global scores, 84.9% demonstrated benefit with values of 80.6%, 85.2%, 92.4, 91.9%, 94.3%, and 100% for unaided baseline APHAP-global response categories of 3.0 to 5.5, respectively. The higher prevalence of APHAB-global benefit exceeding the baseline-specific MDDs, 84.9%, is consistent with the high retention rate of the devices by these individuals, whereas the application of a single MDD value to all cases yielded only 41.2% who appeared to experience meaningful benefit. Why would 58.8% without meaningful benefit opt to keep their hearing aids?
Exploring Anchor-Based Approaches to MCID Estimation for the APHAB-Global
Assuming the APHAP response categories have functional significance, we evaluated whether meaningful differences could be defined using these response scales directly. As noted above, the two most employed change criteria for 7-point response scales have been either a full-point change or a one-half-point change on the response scale (Norman et al., 2003). The ½-point change criterion afforded greater resolution in these exploratory analyses and was evaluated here. Based on the analyses of other 7-point Likert-scale PROMs, the authors hypothesized that a half-point change in APHAP-global scores after 6 weeks of hearing-aid use reflects clinically meaningful changes. Using the NU (N = 584) dataset, the prevalences of unaided and aided response categories, as well as changes in response categories (benefit), for the PHAP-based global scores were determined. Eighty percent of the individuals demonstrated APHAB-global values representing at least a ½-step improvement. For a larger 1-step change criterion, only about 55%–60% would meet this one-step change criterion for functional change. Recall that about 84% of the adults in the NU dataset opted to keep their hearing aids after the 6-week trial.
ROC Analyses
To better evaluate the optimal response-scale change criterion for the MCID, Receiver Operating Characteristic (ROC) curves were generated. The ROC analyses were used to determine the optimal cutoff change criterion for the identification of hearing-aid “success.” The NU dataset (N = 584) included data from 465 older adults, 79.6% of study enrollees, who returned for evaluation 6 months after the hearing-aid fitting. In earlier studies, hearing-aid “success” has often been defined based on use of hearing aids for at least 4 h per day after 1 year or more of use (e.g., Cox & Alexander, 1995; Cox & Rivera, 1992; Hickson et al., 2010). This was likely a reasonable usage criterion from an era during which most candidates for hearing aids had moderate or severe hearing loss and frequent daily usage was expected. Even so, about 10%–25% of those who had worn hearing aids for 1 year to more than 10 years, self-reported daily usage was less than 4 h per day (e.g., Cox & Alexander, 1995; Cox & Rivera, 1992; Johnson et al., 2010). As hearing-aid candidacy criteria have changed to include more adults with milder hearing loss, part-time hearing aid use may be more realistic. Hearing-aid “success” was defined here in two ways: (1) an individual opted to keep their hearing aids at 6-weeks post-fit and was wearing the devices an average of 2 or more hours daily at 6-months post-fit; or (2) the same as (1) except for an average of 4 or more hours of daily use at 6 months. Note that the present definition of success includes daily usage criteria based on datalogging. In many prior studies, including those making use of the APHAB (e.g., Cox & Alexander, 1995; Johnson et al., 2010), the definition of success was based on self-reported estimates of usage. It has been found that usage estimates based on self-report tend to be 1 to 4 h higher than those obtained with datalogging for the same individuals (Brooks, 1972; Haggard et al., 1981; Humes et al., 1996; Laplante-Levesque et al., 2014; Solheim & Hickson, 2017; Taubman et al., 1999).
Using these two success criteria, ROC curves were generated for the APHAB-global scores for nine ½-response-category steps between one full response-category decline (−1) to 3.5 response-category improvements. ROC curves are typically evaluated by the Area-Under-the-Curve (AUC) metric with the measured AUC tested against AUC = 0.5, or chance performance. As shown in Figure 3, the AUC values ranged from 0.56 to 0.61 with one of the two AUC values being significant (p < .05). It should be noted, however, that the nonsignificant AUC value shown in Figure 3 was p = .05, which would often be considered an acceptable criterion for statistical significance in exploratory analyses like these. Nonetheless, even the significant AUC value is small. The best cut-off point varied somewhat across the ROCs. For the APHAB-global, a change criterion of a half-step yielded the highest Youden Index based on 4 h of daily hearing-aid use at 6 months. However, the Youden Index was highest for a change criterion of 1.5 steps for the 2-h daily usage success criterion. Thus, a single change criterion using the response scale was not found to be optimal across these two ROCs and neither of the ROCs had high AUC values.

Receiver operating characteristic (ROC) curves for the APHAB-global PROM and for hearing-aid success based on either 2 or 4 h of daily usage at 6-months post-fit. The area under the curve (AUC) metrics for each ROC curve are provided in the figure legend and AUC values differing significantly (p < .05) from chance (AUC = 0.5) are marked with an asterisk.
Binary Logistic-Regression Analyses
Binary logistic-regression analyses were performed to further evaluate the ½- and 1-step change criteria for the APHAB-global and PHAB-global. In these exploratory analyses, we considered both “success” criteria. Table 4 provides the odds ratios (ORs) and their boot-strapped 95% confidence intervals for the APHAB-global and each success criterion. The left-most set of ORs in Table 4 is for the half-step change criterion and the right-most set of ORs is for the 1-step change criterion. Covariates in each analysis were gender, age, and better-ear PTA4 and, for two of the four analyses, those marked by an asterisk by the ORs, the PTA4 covariate was significant (p < .05). For the 2-h-a-day usage success criterion (top row of Table 4), neither the half-step nor the 1-step change criterion resulted in significant fully adjusted ORs. For the 4-h-per-day success criterion (bottom row of Table 4), the APHAB-based change criteria were all significant. The odds of hearing-aid success at 6-months post-fit were 1.6 to 1.8 times higher if the APHAB-global score at 6 weeks showed improvement corresponding to at least one-half or one-full step. The significant ORs were slightly higher for the ½-step change criterion than for the full-step change criterion.
Fully Adjusted Boot-Strapped Odds Ratios (ORs) (and 95% Confidence Intervals) From Several Binary Logistic-Regression Analyses for Two Criteria for Hearing-Aid “Success.”

Note. The left-most set of ORs were for the one-half-step change and the right-most set of ORs were for the 1-step change. Covariates in each logistic regression analysis were gender, age, and better-ear PTA4. For 2 of the 4 analyses, marked with an asterisk, PTA4 was the only significant covariate. For the ½-step criterion and ≥ 4 h/day, the OR (95% CI) for PTA4 = 1.028 (1.001, 1.054; p = .038) and, for the 1-step criterion and ≥ 4 h/day, the OR (95% CI) for PTA4 = 1.027 (1.001, 1.054; p = .039). Significant (p < .05) ORs for the APHAP change criterion are shown in bold and italicized font.
Best-Supported MCIDs and MDDs
Overall, most analyses favor a change of one-half step as meaningful for the APHAB-global. The midpoints of each response category from 1 to 7.5 are shown in Table 1. The differences between successive midpoints define the change in APHAB-global score at each baseline that results in at least a one-half-step improvement in score from unaided to aided conditions. For example, a person who has an unaided APHAP-global score between 62.5% and 72%, would fall into response category 5, corresponding to a rating of “generally.” The midpoint response for those in this category is 67.3% as shown in Table 1. For an aided improvement to be considered meaningful, at least a half-step improvement, the response category would be required to improve to 4.5, which has a corresponding midpoint score of 56.3%. This represents an improvement in APHAB-global score of 11.0%. This change, along with those generated in the same manner for baseline response categories from 2.5 to 5.5, are shown as the filled circles in Figure 4. These values are also presented in Table 5 and are considered the best estimates of the MCIDs for the APHAB-global PROM. For comparison, the unfilled circles in Figure 4 show the MDDs estimated using the SDb-based distribution method (Table 3; far-right column). The MDD is typically smaller than the MCID, although the variation of the two with baseline score is similar.

Plots of the suggested minimal clinically important differences (MCIDs; filled circles) and the minimum detectable differences (MDDs; unfilled circles) for the APHAB-global PROM as a function of APHAP-global unaided response category. The MCIDs represent the differences in response-category midpoints from Table 4. These data were derived from the NU Dataset (N = 584).
APHAP-Global Response-Category Baselines, in One-Half Steps, Corresponding Lower and Upper Score Ranges, Response-Range Midpoints, and APHAB-Global MCIDs are given for Each Response Category. Too Few Data Were Available for the Response-Scale Extremes to Estimate the MCID.
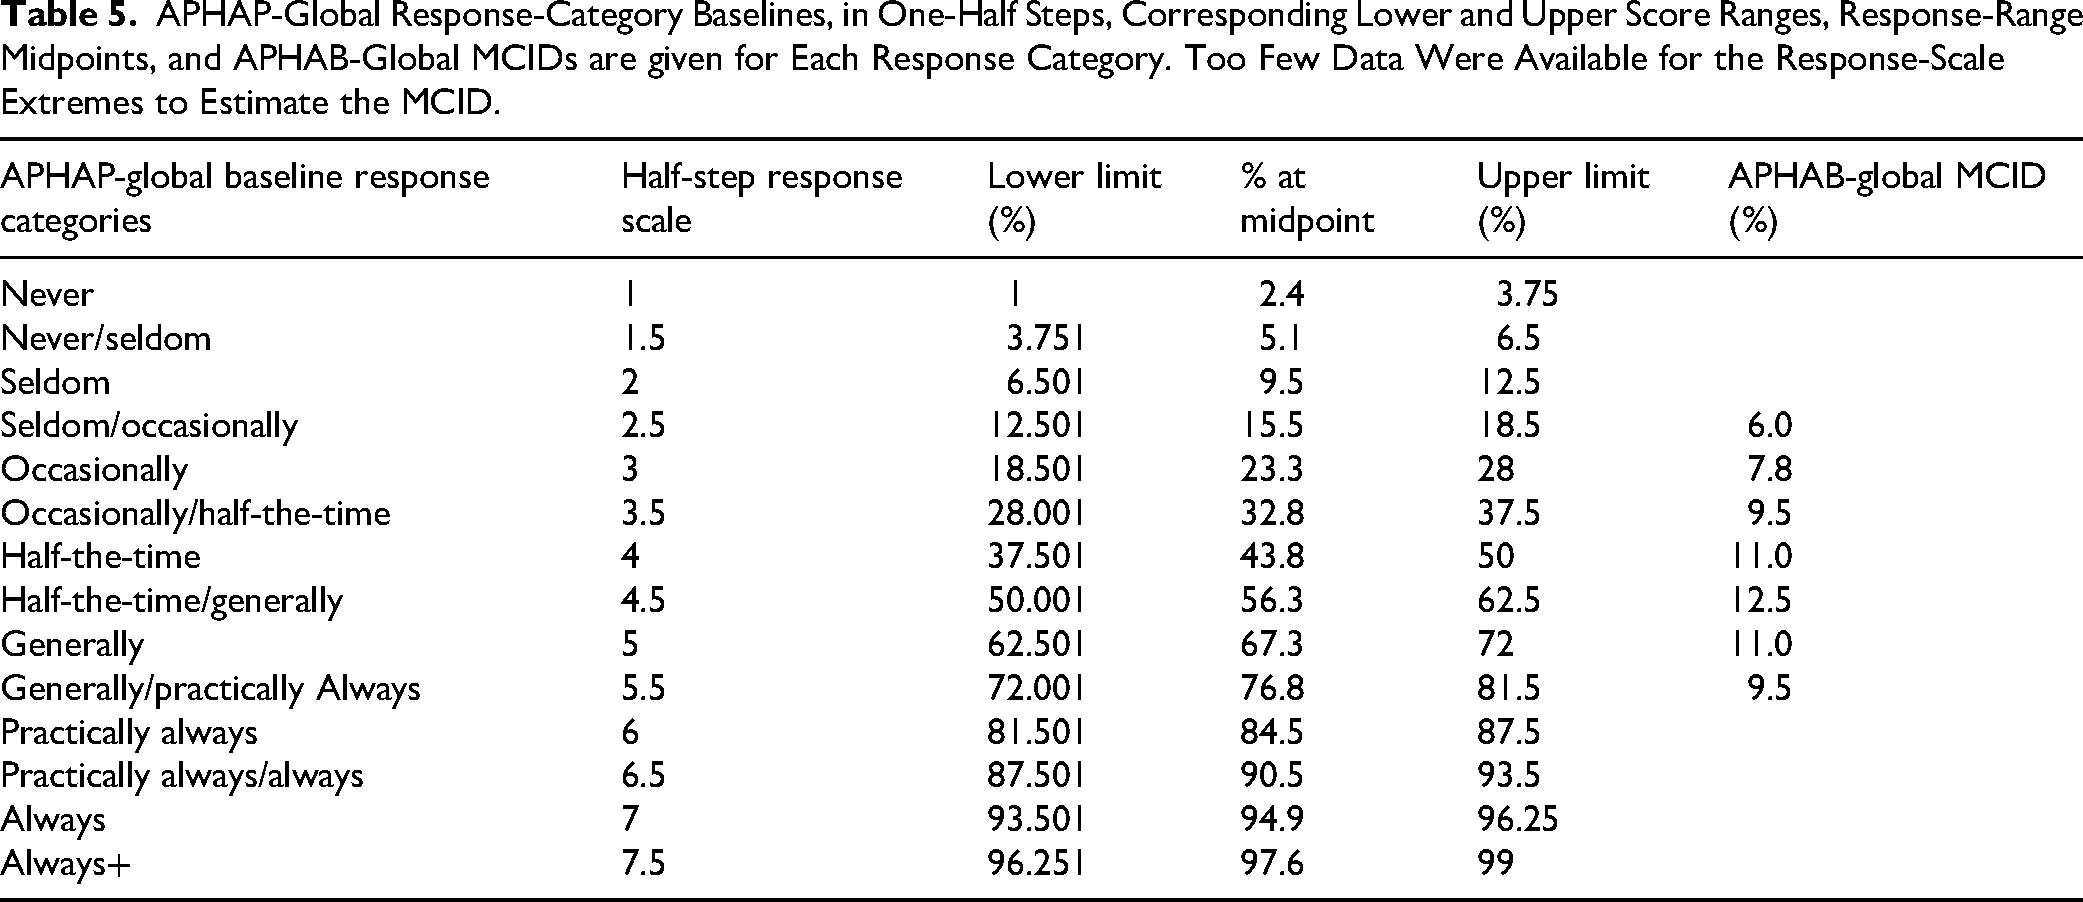
At first glance, it may appear that the way to use the values in Table would be to identify the one-half step grade associated with the unaided PHAP-based score and then identify the one-half-step grade corresponding to the aided PHAP-based score. If the improvement in grade is at least 0.5, then the MCID will have been met or exceeded. Such a use of the MCIDs in Table 5 would be inappropriate. To illustrate the problem with this approach, assume an individual gives an unaided APHAP-global score of 65% and, after six weeks of hearing-aid use, gives an aided APHAP-global score of 54%, an APHAB-global benefit score of 11%. From Table 5, this corresponds to a change of one-half step along the response scale from “generally” to “half-the-time/generally” and would be considered as meeting the criterion for an MCID. However, consider another individual with the same unaided baseline score of 65% but an aided score of 61%, resulting in an APHAB-global (benefit) score of 4%. Once again, this example yields a change of one-half step along the response scale from “generally” to “half-the-time/generally” but would be incorrectly considered as having met the criterion for an MCID. Instead, the appropriate use of Table 5 is to identify the response category corresponding to the unaided baseline score, but then to use the MCID APHAB-global values in the far-right column of Table 5. For both the preceding examples, the same MCID, APHAB-global (benefit) = 11.0%, would apply and only the first case would exceed the MCID.
A far simpler approach to determine benefit ≥ MCID would be to abandon the use of the percentages for frequency of speech-communication difficulties all together. In this case, the responses, 1 to 7, would be averaged, rather than their associated percentages. If the unaided and aided APHAP-global scores are computed directly from the response categories and then subtracted, mean unaided—mean aided, a difference ≥ 0.5 reflects at least a half-step change in mean global scores on this 7-point scale. This is the recommended procedure for application of the half-step MCID criterion. It is much simpler than relying on the % values in Table 5. The primary drawback with this simplified approach to scoring and interpretation of benefit scores is that it has not been used previously. All prior APHAP and APHAB scores have been reported as percentages reflecting the frequency of difficulties experienced. Global rating scores, however, can be converted to corresponding percentage scores using the following formula: APHAP score in percentage = ‒4.88 + [109.77/(1 + e (−(APHAP score – 4)/−1.1))], where the APHAP score included in the exponent is the mean response rating. This transformation is from the best-fitting four-parameter sigmoidal function (adjusted r2 = .997) relating assigned percentages to the seven integer response categories. This transformation from mean rating scale score to mean percentage difficulty score might be needed, for example, when comparing results to prior studies or to previous tests, all of which most likely have been expressed in percentages of difficulties and not as mean rating scores.
Further research that includes more individuals with higher baseline scores is needed to enable the generation of MCIDs for such baseline score ranges. This is unnecessary for those with very low baseline scores, as it is unlikely that those who have mean global APHAP unaided baseline scores corresponding to “seldom” or “never” would take up hearing aids. At the other extreme, those who have mean baseline scores corresponding to “practically always” or “always” may be candidates for the use of other devices, such as cochlear implants.
Discussion
Summary of Findings and Recommendations
The evidence presented above supports the use of baseline-dependent change criteria for the APHAB-global. A single value of the 95% critical difference, MDD or MCID, will typically under-identify meaningful benefit for those with better (lower) baselines and over-identify benefit for those with poorer (higher) baselines. Both in the synthesis of the literature and the analyses of the NU dataset presented here, the measured hearing-aid benefit was found to vary significantly with the unaided baseline score, including in regression analyses adjusting for differences in age, hearing loss, and gender. Baseline-specific MDDs and MCIDs are required for the accurate determination of significant benefit from hearing aids using the APHAB-global.
The analyses presented above focused on the shorter APHAB outcome measure rather than the PHAB, given its broader use clinically and in clinical research. Analyses of the PHAB-global scores from the NU dataset and two other clinical trials (Haskell et al., 2002; Humes et al., 2017) yielded the same conclusions as those drawn from the analyses of the APHAB-global scores presented here. This is not surprising, given that the APHAB was developed from the analyses of the PHAB data by Cox and Alexander (1995), including the use of identical items from three scales (EC, RV, and BN) common to both instruments as well as the use of an identical response scale. The individual data for both PHAP-based measures were available in the NU dataset and the correlations between the PHAP/B and APHAP/B were 0.97, 0.96, and 0.95, for unaided, aided, and benefit scores, respectively. Given these correlations, together with the similar composition of the scales and the use of identical response scales and scoring, the MDD and MCID values described above for the APHAB-global most likely can be used with the PHAB-global as well.
Regression to the Mean
The dependence of the APHAB-global score on the unaided APHAP-global score, described in Figure 1, resembles the expected result for the effect of regression to the mean. Consideration of the effects of regression to the mean has a long history in the evaluation of test scores in education and PROMs in clinical contexts because the typical approach is to obtain a score twice, once before intervention and again following intervention (e.g., Nunnally, 1967; Speer, 1992). When a test or scale, such as the APHAP, is repeated, regression to the mean may affect the results, especially when the results are interpreted based on a change score or a difference score, as for the APHAB. The classic approach to adjust scores for regression to the mean is to generate a “true” difference score by adjusting the observed baseline score to a true baseline score with the adjustment based on the reliability of the measure (Cronbach & Furby, 1970; Nunnally, 1967). To make such adjustments, one must know the reliability of the test score, the APHAP-global, and the mean APHAP-global baseline score of the group (as an estimate of the mean for the population of interest). As applied to the APHAB difference score, the true APHAP baseline score = r*(APHAP global baseline) + M, where r is a measure of reliability and M = the group mean baseline score (Cronbach & Furby, 1970; Nunnally, 1967). This correction for regression to the mean has been recommended for use in the study of clinical interventions (e.g., Crosby et al., 2003, 2004; Speer, 1992; Speer & Greenbaum, 1995).
Revelle and Condon (2019) identified at least a dozen different measures of “reliability,” and a variety of reliability coefficients have been used to correct scores for regression to the mean. Most often, the test‒retest correlation, rxx, has been recommended (Nunnally, 1967; Revelle & Condon, 2019). In the absence of test‒retest reliability studies, the split-half correlation is an alternative (e.g., Trimble & Cronbach, 1943).
The test‒retest reliability of the APHAP-global was estimated here to be rxx = 0.85. This was determined from results for test‒retest reliability of the scale scores comprising the APHAP-global. Somewhat surprisingly, no other test‒retest correlations could be found for the unaided APHAP scales or the global score. Each scale score in the APHAP is based on six items, resulting in 18 items for the APHAP-global score. Using the lowest scale test‒retest correlation (rxx = 0.65 for the six-item RV scale) reported by Cox and Alexander (1995) and applying the Spearman-Brown formula to estimate the test‒retest correlation for the 18-item global score yields an estimated rxx value of .85 for the APHAP-global. For comparison, we calculated rxx for the full PHAP-global using the raw data (scale scores only) from 334 older adults in the NIDCD/VA clinical trial (Haskell et al., 2002). The NIDCD/VA trial repeated the unaided PHAP measurements four times with an interval of about 90 days between each repetition of the unaided PHAP. The observed test‒retest correlations for unaided PHAP-global scores for these data ranged from rxx = .80 to .87 across test intervals, values in line with the estimated APHAP-global rxx value of .85.
Finally, in the absence of solid rxx values for the APHAP-global unaided scores, we also generated split-half reliability estimates using the R package psych (Version 2.4.12; Revelle, 2024) and obtained split-half correlations of r = .95, .92, and .84, for the maximum, average, and minimum split-half correlations for the unaided APHAP-global score, respectively. Based on these split-half correlations, and the test‒retest data for the unaided PHAP-global scores presented above, an assumed rxx of .85 for the APHAP-global unaided scores appears reasonable.
The effects of the assumed rxx value on the estimation of the true APHAP-global unaided score and the resulting estimates of the true APHAB-global scores are shown in Figure 5. The range of rxx values included in Figure 5 is .70 to .95. For comparison, the observed APHAP-global baseline and APHAB-global benefit scores from the NU dataset are plotted as filled circles in Figure 5. The estimated true APHAB-global scores for those in the first or fifth quintiles of the baseline score suggest that regression to the mean may have resulted in the overestimation of the true APHAB-global scores for those with the highest baseline scores and underestimated the true APHAB-global scores for those with the lowest baseline scores. Using the assumed rxx value of r = .85, these errors at each extreme amount to about 3–4 points and flatten the dependence of APHAB-global on unaided baseline slightly. Of course, if a lower rxx value is assumed, the flattening of this function is even greater as shown in Figure 5. However, even for the worst case shown in Figure 5, there is still a dependence of APHAB-global scores on unaided APHAP-global baseline scores.

Estimates of the true APHAB-global scores are shown for a range of rxx values from 0.70 to 0.95. Estimated true APHAP-global baseline score = rxx × (APHAP global baseline) + M, where rxx is the test-retest reliability of the APHAP-global baseline score and M = the group mean baseline score.
In summary, regression to the mean undoubtedly has some effect on the dependence of APHAB-global scores on unaided APHAP-global baseline scores. The best estimates of these effects, however, are small given the assumed rxx of .85 for the APHAP-global scores.
Additional Considerations
The evidence presented here supports the use of a half-step change in the PHAP-based response scale as an MCID. The anchor-based MCIDs established here for the APHAB-global are shown in Figure 3 and Table 5, while Table 3 shows the MDDs established using the distribution-based method and SDb. As noted, given the same response scale and assuming the same reliability for the PHAP and the APHAP global scores, the SDb, MDD, and MCID estimates provided in Tables 3 and 5 can be applied to each of these PROMs. As was noted, implementation of the ½-step change criterion for MCID can be accomplished more readily by averaging the integer responses directly rather than converting them to percentages representing the frequency of difficulties experienced.
When using either PHAP-based PROM, it must be kept in mind that it is the frequency of experiencing everyday communication difficulties, from never (1%) to always (99%), that is being self-reported. This is not the same as assessing how much difficulty is experienced in those same communication contexts. To demonstrate this, data from Cox et al. (1991) were used. They administered the PHAP and the Intelligibility Rating Improvement Scale (IRIS) to 42 elderly hearing-aid users. The IRIS presented the same 66-listening situations as the PHAP, but the response scale was changed to reflect the percentage of speech understood using the same seven-response scale and values from 1% to 99%. There was little correspondence between the benefit measured on the speech-communication scales of the PHAB and those same scales on the IRIS, with correlations of 0.39, 0.34 and 0.54 for the EC, RV and BN scales, respectively. In support of this dissociation between frequency of difficulties and severity of difficulty, Cox et al. (2003) found low-to-moderate correlations, 0.3 < r < 0.6, between APHAB scores and behavioral measures of speech understanding in noise. Thus, reducing the frequency of communication difficulties experienced does not necessarily imply that speech understanding performance has been improved with hearing aids, whether the latter is measured by self-report (IRIS) or by behavioral measures of speech-in-noise performance. Research is needed to further explore the meaning and interpretation of the benefit scores obtained with the PHAP-based PROMs.
The appropriate determination of SDb is essential for the derivation of both the MDD and MCID for hearing-aid PROMs. Although the limited evidence available and presented in Figure A1 in the Appendix suggests that it is not critical whether the baseline score is obtained at pre-intervention or post-intervention, using the “then-test” method, additional research is needed. At a minimum, it is important that future studies using the PHAP-based PROMs specify the method used to establish baseline scores.
Until more research is available, the way in which the scale items were administered should be clearly specified. For the NU dataset reviewed here, for instance, the 66-item PHAP was administered, with APHAP scores obtained by extracting the responses to the 24-items comprising the APHAP or the 18 items comprising the APHAP-global. This is the same procedure as used by Cox and Alexander (1995) to generate the original norms for the APHAP/B and that has been followed in several studies. Subsequently, Johnson et al. (2010) compared the original PHAP-extracted APHAP norms to a separate set of norms obtained using the APHAP as a separate and independent scale (and with different hearing-aid technology compared to 1995). For the EC, FT and BN scales comprising the APHAP-global, there were no notable differences in percentiles between these two sets of norms. This comparison suggests that the way in which the score was obtained is of little consequence. Nonetheless, it is recommended that this be reported in future research studies until this can be confirmed.
We have proposed some guidelines for MDDs and MCIDs that can be used with the APHAB-global (or PHAB-global) to identify meaningful changes following the use of hearing aids. Professional practice guidelines recommend the use of outcome measures, including self-report measures, to assess the benefit of hearing aids (ASHA; Valente et al., 2006). MCIDs are central to the interpretation of those outcomes. In addition, both MDDs and MCIDs are essential to the interpretation of the outcomes of research examining the efficacy and effectiveness of hearing-aid interventions. These values are not only of importance to the interpretation of the results at the conclusion of a study but also are needed to appropriately power studies prior to data collection at the design stage.
Finally, our focus in this article has been on the APHAB-global with implications for the parent outcome measure, PHAB-global, as well. Although one of the most broadly used self-report outcomes, many others exist. It may be the case that the baseline dependence of outcomes that has been described here is also relevant for these other outcome measures. In fact, we have examined this for one of the other widely used outcome measures, the Hearing Handicap Inventory for the Elderly (HHIE; Ventry & Weinstein, 1982), and have observed a similar dependency (Humes et al., 2025b).
Footnotes
Acknowledgments
For the data reported from Northwestern University (NU), the collection of these data was supported, in part, by a research contract from PCORI (#HL-2019C1-16094).
Ethical Approval and Informed Consent Statement
For the Northwestern University (NU) data reported here, the study protocol, including screening of participants, was approved by Northwestern University's Institutional Review Board (STU00213710).
Funding
The authors disclosed receipt of the following financial support for the research, authorship, and/or publication of this article: For the Northwestern University (NU) data reported here, the research to gather those data was funded, in part, through a Patient-Centered Outcomes Research Institute (PCORI) Award (HL-2019C1-16094; S. Dhar, L. Humes Co-PIs). The views, statements, and opinions in this presentation are solely the responsibility of the authors and do not necessarily represent the views of the Patient-Centered Outcomes Research Institute (PCORI), its Board of Governors or Methodology Committee.
Declaration of Conflicting Interests
The authors declared no potential conflicts of interest with respect to the research, authorship, and/or publication of this article.
Data Availability Statement
The NU data will be made freely available through the PCORI website following publication of the final project report on that website in the near future.