
Abstract
This study investigated which of a range of factors could explain performance in two distinct groups of experienced, adult cochlear implant recipients differentiated by performance on words in quiet: 72 with poorer word scores versus 77 with better word scores. Tests measured the potential contribution of sound processor mapping, electrode placement, neural health, impedance, cognitive, and patient-related factors in predicting performance. A systematically measured sound processor MAP was compared to the subject's walk-in MAP. Electrode placement included modiolar distance, basal and apical insertion angle, and presence of scalar translocation. Neural health measurements included bipolar thresholds, polarity effect using asymmetrical pulses, and evoked compound action potential (ECAP) measures such as the interphase gap (IPG) effect, total refractory time, and panoramic ECAP. Impedance measurements included trans impedance matrix and four-point impedance. Cognitive tests comprised vocabulary ability, the Stroop test, and the Symbol Digits Modality Test. Performance was measured with words in quiet and sentence in noise tests and basic auditory sensitivity measures including phoneme discrimination in noise and quiet, amplitude modulation detection thresholds and quick spectral modulation detection. A range of predictor variables accounted for between 33% and 60% of the variability in performance outcomes. Multivariable regression analyses showed four key factors that were consistently predictive of poorer performance across several outcomes: substantially underfitted sound processor MAP thresholds, higher average bipolar thresholds, greater total refractory time, and greater IPG offset. Scalar translocation, cognitive variables, and other patient related factors were also significant predictors across more than one performance outcome.
Keywords
Introduction
Cochlear implantation has been shown to substantially improve speech recognition in adults with hearing loss (Boisvert et al., 2020). However, it is well noted that there remains significant individual variability in speech recognition outcomes. Patient-related factors such as age at implantation, etiology, and duration of deafness have been shown to explain only a small amount of this variance, up to approximately 22% (Blamey et al., 1996, 2013; Holden et al., 2013; Lazard et al., 2012). It has been theorized that the variability in adult cochlear implant (CI) speech perception outcomes is attributable to a broad range of factors including “bottom-up” auditory sensitivity factors and “top-down” linguistic and neurocognitive factors. Auditory sensitivity, in this context, refers to the capacity to detect and distinguish the spectral and temporal cues embedded in speech, which are essential for recognizing different vowels and consonants (Moberly et al., 2016). It is probable that degradation of the cues will result in downstream neurocognitive effects.
The present study focused on understanding the relative importance of a range of factors potentially associated with poorer auditory sensitivity and poorer word recognition and sentence in noise performance in experienced adult CI recipients. These were categorized to include: device mapping, anatomy and surgical placement of the electrode, health of the neural substrate, impedances, cognitive skills, and patient-related variables such as duration of deafness. Auditory sensitivity was measured using aided thresholds, phoneme discrimination, spectral resolution, and temporal resolution tests.
Device mapping issues that result in poorer audibility and comfort can degrade auditory sensitivity. Thresholds (T-levels) play a crucial role in determining how well a CI user perceives sound. For example, Busby and Arora (2016) reported that when T-levels were set significantly below the “true” measured T-levels in the CI MAPS for a group of 19 adults (i.e., reduced by 60% or 90% of the measured hearing dynamic range), word recognition in quiet at conversational and soft presentation levels was significantly degraded. Since aided thresholds are directly linked to T-levels, underfitting these levels negatively impacts aided thresholds. In a retrospective study of 78 postlingually deafened adult CI recipients, de Graaff et al. (2020) found that poorer speech perception occurred when aided thresholds exceeded 27 dB HL. The present study examined whether underfitted T-levels, C-levels, or other suboptimal MAP settings in the recipient's walk-in MAP accounted for variability in performance outcomes.
Surgical factors, including cochlear abnormalities, scalar translocation, insertion depth, and the distance from the modiolus, have been identified as significant predictors of speech perception outcomes (Holden et al., 2013; Finley et al., 2008; James et al., 2019; O'Connell et al., 2016). However, the impact of electrode tip foldover on speech recognition is less understood, largely due to its rarity in cochlear implantation, with limited subject numbers available for study (McJunkin et al., 2018; Zuniga et al., 2017). In a cohort of 96 adult CI recipients, James et al. (2019) found that surgical factors explained 20% of the variance in early sentence recognition, while patient-related factors accounted for about 40%. Although scalar translocation is consistently associated with poorer CI performance, findings on modiolar proximity, and base and tip insertion depth, have been mixed. For example, from a database of 220 CI ears, Chakravorti et al. (2019) analyzed the predictive value of modiolar distance, base, and tip depth for different array subgroups. In the perimodiolar arrays, they found that greater modiolar distance and greater base insertion depth were associated with poorer CI performance, whereas for straight arrays, greater base insertion depth was associated with better CI performance. Weller et al. (2023) found a positive correlation between word recognition in quiet and the insertion angle (tip depth) for straight electrode arrays in an analysis of 154 implanted ears. However, other studies have reported significantly poorer CI performance with greater insertion depth (Finley et al., 2008; James et al., 2019; Ketterer et al., 2022).
Although the neural substrate status cannot be measured directly in the CI recipient, several diagnostic measures aim to estimate neural health. Potential markers for spiral ganglion cell (SGC) health include the average bipolar (BP) or focused thresholds, as well as the residuals (i.e., unexplained differences) of the linear relationship between electrode-to-modiolus distance and focused stimulation. Long et al. (2014) reported that the within-subject focused and BP threshold variances were significantly correlated with word recognition. Furthermore, the residual error of the focused threshold—distance relationship was also significantly predictive of word performance. That is, higher thresholds that could not be explained by the electrode contacts being farther away from the modiolus were hypothesized to reflect SGC loss. However, these findings were not able to be confirmed for steered quadrupolar focused thresholds in the study by DeVries et al. (2016) with 10 CI recipients. Instead, DeVries et al. found that higher average focused thresholds were associated with poorer vowel and consonant recognition. This aligns with Arjmandi et al. (2022) who reported that higher average focused thresholds measured across the array were associated with poorer vowel identification in both quiet and noise in a group of 15 children and 21 adults.
Panoramic electrically evoked compound action potentials (PECAP) is an objective method to determine neural spread of excitation (Cosentino et al., 2016). It provides a matrix derived from ECAP amplitudes for every possible combination of masker and probe electrode, and then uses a nonlinear algorithm to estimate the underlying neural function for each electrode. Garcia et al. (2021) proposed a revised version of PECAP that incorporates “biologically realistic” constraints into the algorithm, enabling more detailed estimates of neural activation patterns by modeling current spread and neural health along the array. In this study, we used a shortened version of PECAP, measuring ECAPs on half the electrodes across the array (half the 22 × 22 electrode matrix).
Another potential marker of SGC health is the polarity effect (PE), which is the difference in detection thresholds between cathodic- and anodic-centered pulses for electrodes (Carlyon et al., 2018; Goehring et al., 2019; Macherey et al., 2017). Cathodic-centered pulses emphasize the negative phase of the biphasic pulse, which is generally more effective at stimulating neurons, while anodic-centered pulses emphasize the positive phase, requiring higher current levels to achieve similar activation. In this study, we measured this neural health predictor both behaviorally, using asymmetrical pulses (where the positive and negative phases differ in duration or amplitude), and objectively, using neural response telemetry (NRT) with equal length biphasic pulses. Asymmetrical pulses provide more concentrated charge, making them more effective for selectively stimulating neural populations. The PE is believed to reflect the health of spiral ganglion neuron (SGN) peripheral dendrites. Carlyon et al. (2018) found that lower thresholds for cathodic-centered compared with anodic-centered pulses corresponded to lower average thresholds and better rate discrimination. Similarly, Goehring et al. (2019) reported significant correlations between PE and average speech perception outcomes in both quiet and noise, as well as with age and duration of deafness, further supporting the potential of PE as a measure of neural health. Furthermore, in a group of 15 CI recipients tested with asymmetrical pulses, Mesnildrey et al. (2020) reported that lower cathodic thresholds were associated with better spectrotemporal detection.
The interphase gap (IPG) effect has been associated with increased SGN density (Prado-Gutierrez et al., 2006; Ramekers et al., 2014). Consistent with preclinical findings, a clinical study with 10 bilaterally implanted CI recipients by Schvartz-Leyzac and Pfingst (2018) reported that the between ear difference in change of the ECAP amplitude growth function (AGF) slope, as IPG was increased from 7 to 30 µs, was significantly associated with the between ear difference in sentence in noise and consonant recognition. The IPG offset (Brochier et al., 2021; McKay & Smale, 2017) is proposed to be an even purer measure of neural health than the IPG AGF slope effect, as it accounts for and removes non-neural influences. The IPG offset metric measures the additional current needed for the smaller IPG to elicit the same ECAP amplitude as the wider IPG. A wider offset is hypothesized to be a marker of better neural health. However, recent clinical studies using this offset metric have failed to find significant associations between IPG offset and CI performance outcomes (Imsiecke et al., 2021; Arslan & Luo, 2022). Furthermore, a study by Skidmore and He (2021) unexpectedly reported a significantly larger IPG offset for a group of children with a small or absent cochlear nerve compared to a group with normal-sized cochlear nerves. In the present study, we computed the IPG effect in several ways for comparison with previous literature—specifically, the IPG AGF slope difference, the IPG threshold difference and the IPG offset.
The ability of the neurons to fire again after stimulation by a masker is referred to as the nerve's refractory or recovery ability. As with other potential neural health measures there are mixed findings in the clinical literature on the potential of refractory ability to explain CI performance. In a study of 11 postlingually deafened adult CI recipients, Kiefer et al. (2001) reported significant negative correlations between total refractory period and overall speech perception performance that was consistent across three different processing strategies. He et al. (2018) reported longer absolute refractory periods in addition to other ECAP differences in implanted children with cochlear nerve deficiency (CND) compared to children with normal-size cochlear nerves. In contrast, a meta-analysis by van Eijl et al. (2017) found nonsignificant results in five other CI studies that investigated the relationship between refractory ability and CI performance.
In addition to evaluating differential ECAP measures (i.e., IPG effect and PE effect), the current study investigated the association between CI performance and the maximum ECAP amplitude and ECAP AGF slope. DeVries et al. (2016) reported that the mean ECAP peak amplitude was significantly associated with better speech perception performance and not explained by electrode-to modiolus distance. Furthermore, steeper AGF slopes were associated with better speech perception in a study by Kim et al. (2010), though this finding was not confirmed by other studies (Cosetti et al., 2010; DeVries et al., 2016). Recently, a retrospective study of 139 adult CI recipients by Gärtner et al. (2021) found that steeper AGF slopes were linked to shorter duration of hearing loss and younger age at implantation. In another recent retrospective study with 124 postlingually deafened adults, Dong et al. (2023) reported that higher ECAP amplitude and steeper AGF slopes were associated with better word recognition. However, the group found even stronger associations with word recognition for a compound discharge latency distribution metric, which aims to reflect the number and temporal firing properties of auditory nerve fibers. Skidmore et al. (2023) introduced the Electrode-Neuron Interface (ENI) index, which combines several ECAP measures—AGF slope, ECAP threshold, and N1 latency (measured from the waveform with the maximum ECAP amplitude), along with the absolute refractory period—across three electrodes along the array. This composite metric was found to significantly explain speech perception performance, particularly in noise, for 24 postlingually deafened CI adults. Higher ENI values were associated with better speech perception performance and increased with lower ECAP thresholds, lower N1 latency, lower absolute refractory period, and steeper ECAP slope. The ENI accounted for at least 10% of the variance in most of the study's speech perception outcome measures.
It is important to recognize that the various potential markers of neural health discussed above may not be assessing the same aspect of the neural substrate. While some markers could be interrelated, it is likely that different measures capture distinct characteristics of neural health and could be additive in explaining variability in CI performance. For instance, Hughes et al. (2018) found that IPG effects and PE were not systematically correlated. They speculated that IPG effects might assess temporal or integrative properties related to demyelination, while PE might reflect the health at the excitation site.
A further source of variability potentially impacting auditory sensitivity are intracochlear impedances. Postoperative imaging may reveal extensive cochlear ossification which can impede the flow of the current from the electrodes. Certain pathologies, such as meningitis are often associated with ossification. Ossification can also occur as part of a cascade of intracochlear inflammation, fibrosis, and osteoneogenesis (Seyyedi & Nadol, 2014). Postoperative four-point impedance measurement is an objective test that aims to primarily measure tissue impedance by passing current through two electrodes while measuring voltage with two recording electrodes located between the stimulating electrodes to reduce the electrode contact influence. It is considered to be a marker of fibrotic tissue response. Fibrosis can form around the electrode capsule itself after surgery but also at later stages of device use and alter the flow of the electrical current. The present study evaluated the potential contribution of the four-point impedance and etiology (including meningitis) in explaining variance in performance outcomes.
Some studies have suggested that neurocognitive variables such as working memory, inhibition-concentration ability and perceptual closure are associated with adult CI outcomes, but findings are mixed (Holden et al., 2013; Moberly et al., 2017; Tao et al., 2014; Zekveld et al., 2007). Our study conducted three cognitive measures: a vocabulary test, the Symbol Digit Modality Test (SDMT) which requires speed of processing and attention, and the Stroop test, which requires inhibition of conflicting information. It investigated the potential impact of cognitive skills to explain variance in all performance outcomes including auditory sensitivity outcomes that are assumed to require minimal cognitive processing.
In addition to cognitive skills our study evaluated the explanatory value of other patient-related factors such as etiology, age at implantation, duration of deafness, and preoperative word recognition. These factors have been shown previously to explain significant variability in CI performance (Blamey et al., 2013; Goudey et al., 2021). We also collected questionnaire data on the annoyance of tinnitus in daily life since some studies with normal hearing and hearing-impaired listeners have reported a significant negative association of severe tinnitus and speech perception likely due to its negative impact on attention (Ivansic et al., 2017; Liu et al., 2018).
There has been a large amount of literature exploring factors that help to explain variability in CI performance. The present study evaluated a wider range of factors than previously investigated in a sizeable number of CI recipients. It also uniquely enrolled two groups of subjects, who were clearly differentiated in terms of their performance on a word recognition test in quiet at screening. The primary aim was to identify factors that predict CI performance on a range of outcomes from simple auditory sensitivity tasks to standard speech perception tests in quiet and noise. A secondary aim was to determine the impact of electrode placement—modiolar distance, and base and apical insertion depths on CI performance for lateral wall and perimodiolar electrode arrays. Learnings from this exploratory study are the first step in the quest toward the future development of a test battery to diagnose the cause/s of poor auditory sensitivity, which can in turn provide targeted, personalized CI care. A better understanding of potential contributors of poor auditory sensitivity may also inform development of future devices, fitting algorithms, surgical tools, and electrodes.
Methods
Subjects
Adult postlingually hearing-impaired CI subjects with at least 12-month CI experience using Cochlear Ltd devices and implanted in 2007 or later were enrolled at two sites: Royal Victorian Eye and Ear Hospital, Melbourne, and Medizinisch Hochschule Hannover in Hanover. They used one of the following approved Cochlear™ Nucleus® Implants; CI400, 500 and 600 series implants with both perimodiolar and straight electrode arrays. Subjects were excluded if they used a restricted electrical frequency allocation table due to the use of combined electric-acoustic stimulation in the ear to be assessed. Subjects had to meet a word recognition in quiet performance inclusion criterion in the implanted ear. Their word recognition score at 65 dB SPL had to be either below the 35th percentile of the site's implanted population to meet the classification of a “poor” performer, or above the 65th percentile of the site's implanted population AND ≥ 20% higher than the preoperative word score to meet the classification of a “good” performer. It should be noted that despite the classification as “poor” performers based on word recognition performance, recipients in this group were still using their cochlear implant daily and presumably deriving some benefit from the implant. Analysis of Freiburg word scores in quiet ≥ 12 months postimplantation for the CI population at Hanover indicated that the 35th and 65th percentiles were approximately equivalent to 35% and 65% correct word scores, respectively. Analysis of CNC word scores in quiet ≥ 12 months postimplantation for the CI population at Melbourne indicated that the 35th and 65th percentiles were approximately equivalent to 29% and 54% correct word scores, respectively. To facilitate recruitment of “poor” performers at the Melbourne site the cutoff word score in quiet was raised to 35% later in the study.
Across the two sites 149 subjects were tested, 77 good performers and 72 poor performers. At the Melbourne site there were 34 good performers and 27 poor performers; 16 of these poor performers completed the full three-visit study, while 11 completed a shorter, single-visit version that included a subset of the full test battery. This subset included testing of only some of the predictor variables (specifically bipolar thresholds, IPG change, four-point impedance, trans impedance matrix (TIM) and patient-related variables) and some of the outcome variables (specifically words in quiet, sentences in noise, the Quick Spectral Modulation Detection Test (QSMD), and the Amplitude Modulation Detection Test (AMDT)). The full test battery included testing of all the predictor variables and the outcome measures. The single visit option was offered at Melbourne to facilitate recruitment.
Table 1 summarizes subject demographics and electrode array types. If a CI recipient was using bilateral Cis and both ears met eligibility criteria, only one ear was selected for testing to facilitate recruitment of the appropriate subject numbers in the poorer and good performing groups.
Summary of Subject Demographics and Electrode Array Types.

M:F = number of males and females; SD = standard deviation of the mean.
Predictor Variables
Tables 2 and 3 provide summaries of the predictor variables investigated. Some details are provided in the text and further details for each of the predictor variables are provided in the Supplemental Methods material.
Summary of Predictor Variables for MAP Settings, CT Scans, Impedances, Cognitive Measures, and Patient-Related Measures.

Summary of Predictor Variables for Behavioral and ECAP Neural Health Measures.

The group of 5 electrodes for the metrics with measurements on 5 electrodes were a subset of the electrodes measured for bipolar thresholds. “Good” fit regression lines are described in ECAP measures.
ECAP=electrically evoked compound action potential; IPG=interphase gap; LAPL=loudness acceptable presentation level; NRT=neural response telemetry; PE=polarity effect; PECAP= Panoramic ECAP.
Mapping
In the first study visit a “Measured MAP” was made using a systematic behavioral approach below and the T-levels in this MAP were compared to the T-levels in the subjects’ walk-in “Own MAPs” that they typically used every day. Subjects’ Own MAPs were evaluated according to the “fail” criteria shown in Table 4, which were hypothesized to potentially degrade CI performance. These fail criteria (including “Low” T levels—T-levels in the Own MAP that were substantially lower than those in the Measured MAP) were potential binary predictor variables for the regression analyses.
“Fail” Criteria for Subjects’ Own MAPs.

#C-SPL refers to the sound pressure level required to stimulate at maximum comfortable level (around 65 dB SPL).
$Q-value refers to the percentage of the electrical dynamic range to which the top 10 dB of the instantaneous input dynamic range is mapped.
&T-SPL refers to the sound pressure level required to stimulate threshold level (around 25 dB SPL).
*Sensitivity 12, T-SPL 25.
The Measured MAP initially involved calculating a very “rough” threshold using a Hughson-Westlake method and then finding the current level at which the subject correctly counted the number of randomly presented stimuli (N = 1–5 on each electrode) for three consecutive presentations. If the count was incorrect the CL was increased in steps of two until the subject responded correctly. Prior to this an out of compliance check of the subject's “Own MAP” was done and ratings of loudness were obtained at comfort level (C-level) and at 50% of the Own MAP dynamic range (C-levels minus T-levels). For Contour Advance and Slim Straight electrode arrays, T-levels were measured for every second electrode and more electrodes in the basal region if possible. For Slim Modiolar electrode arrays, T-levels were measured on all electrodes. On the same electrodes, Measured MAP C-levels were calculated using loudness ratings on a loudness rating scale to a target rating of loud but comfortable (a rating of 40). A sweep across electrodes was done to confirm that all C-levels were comfortably loud. Loudness balancing was conducted at 50% of the dynamic range in groups of four overlapping electrodes. Finally, the Measured MAP overall loudness was estimated. International Speech Test Signal (ISTS) noise was presented through speakers at 60 dB SPL (RMS) and the C-levels were increased or decreased using global modifications as a percentage of the dynamic range until the ISTS noise was judged as comfortably loud on the rating scale.
Neural Health Behavioral Measures
Neural health behavioral measures included measurement of bipolar thresholds and examination of the polarity effect. Stimuli were generated using MATLAB software and delivered to a sound processor via the Nucleus Implant Communicator (NIC) software version 4.1.
Bipolar Thresholds
BP thresholds were obtained on up to 16 electrodes using biphasic, pulse-train stimuli (250 pps, 100 µs pulse width, 8 µs IPG, 200 ms train duration). Flagged electrodes were automatically deselected, then additional electrodes (in the following order #1, #2, #16, #14, and #8) were removed until a total of six electrodes had been deselected from a possible maximum of 22 electrodes. The choice of the additional electrodes for removal were based on keeping a good spread of electrodes across the array but reducing the most basal electrodes which were more likely to have compliance issues.
For 13% of the electrodes (285 out of 2,191 measurements), BP thresholds could not be obtained at the system's maximum current level of 255 CL, due to the narrower electrical fields of BP stimulation, which recruit fewer neural fibers. In cases where the compliance limit of the current sources was not reached, this maximum value was imputed as the threshold. If, however, the out of compliance level had been exceeded then the out-of-compliance current level was assigned arbitrarily implying that the true threshold was at this level or above. In total, 265 out of the 285 saturated thresholds were estimated to be out of compliance. Out of compliance levels were estimated by assuming a fixed compliance voltage and calculating the BP impedance as the sum of the common ground impedance of the electrodes forming the BP configuration. As mentioned, these arbitrarily assigned thresholds likely underestimate the true values. However, their inclusion enables more electrodes per subject to be part of the data analysis, albeit with this limitation. Including these thresholds is important, as previous studies have shown that higher focused thresholds are associated with poorer outcomes (Arjmandi et al., 2022; DeVries et al., 2016).
Behavioral Polarity Effect
The behavioral PE was measured using asymmetric quadriphasic pulses, which consist of two biphasic pulses of opposite polarity appended together. The parameters used by Macherey et al. (2017) were selected; a stimulation rate of 100pps, 42 µs pulse width, 8 µs IPG and a stimulus duration of 400 ms. Two conditions were tested: the cathodic centered with the predominant charge in the adjacent negative cathodic pulses and the anodic centered with the predominant charge in the adjacent positive anodic pulses. The behavioral PE was measured on five electrodes spread across the array as close as possible to electrodes 3, 6, 11, 17, and 21 while ensuring that the electrodes were a subset of those used for BP threshold measurements.
ECAP Measures
Amplitude growth functions were obtained using Custom sound EP 6.0 for two IPGs—the default 7µs and the wider 58 µs on the same five electrodes measured for the behavioral PE. The default gain was 50 dB and the default delay 122 µs. If an ECAP was unable to be visualized on an electrode before the loudness acceptable presentation level (LAPL) was reached, optimization of the delay and gain recording parameters was conducted. Initially, an AGF was obtained using a five current level step size and the AGF was repeated approximately halfway up the AGF response from the previous series using the smaller step size of 2 dB. The minimum AGF response in the first series was determined as an N1-P1 amplitude of ≥10 µV. The same recording parameters were used for the short and wider IPGs. ECAP LAPL amplitude and linear slope were calculated from the AGF for the cathodic leading biphasic pulse at the default IPG of 7µs. In addition, differential measures were calculated from the AGF including IPG effect measures and the NRT polarity effect (see Table 3). A minimum of three data points was required for each of the IPG regression lines, and the variance explained by the regression line had to be ≥ 50% (R2 ≥ 0.5) for the regression lines to be a “good” fit for inclusion in the regression analyses. See supplementary document for details on good fit data for the ECAP measures.
A refractory test was obtained using Custom Sound EP 6.0 on the five electrodes used for other ECAP measures. LAPLs were obtained for each electrode with a masker probe interval of 10000 µs. The recording-active electrode was set at Probe-active +2 electrodes and IPG at 7 µs. The masker-probe offset was 10 CL with the masker 10 CL above the probe CL.
PECAP (1/2 matrix) provided a single estimate each of neural health (ƞ) and spread of excitation (ơ) on all active electrodes along the array (up to 22) (Garcia et al., 2021). The calculations were done using software made available by Garcia et al. (2021), which generated .csv files that were used to collect the data required via import into Cochlear Custom Sound EP software.
Electrode Placement Measures
Postoperative and where available, preoperative imaging was obtained for most participants in the study except for a subset of poor performers who participated in a shortened single-session version of the study, where the imaging requirement was waived. De-identified imaging data was analyzed for electrode positioning, including average modiolar distance, average mid-modiolar distance, base depth, tip depth, and presence of scalar translocation. The average modiolar distance differs from the average mid-modiolar distance in that it measures the distance of electrodes to the medial wall rather than to the mid-modiolar axis. Further details are provided in the Supplemental Methods document. Details on the algorithm used for analysis and its validation are reported by Sismono et al. (2022).
Impedance Measures
Trans Impedance Matrix (TIM) was conducted using Custom sound EP 6.0 in the default mode with each intracochlear electrode referenced to MP2 for both stimulation and recording and the current level is set to 109 CL. Four-point impedance was also conducted using TIM in Custom Sound EP 6.0, but with MP1 referenced for the stimulating electrode and MP2 as reference for the recording electrode.
Cognitive Measures
Vocabulary Ability
At the Hanover site the multiple-choice German vocabulary word test termed “Wortschatztest” WST (Schmidt & Metzler, 1992) was administered. In this paper-and-pencil test the recipient was asked to identify an existing German word from a list of six words, where five were nonwords, across 42 lists in total. At the Melbourne site, the online q-interactive Peabody Picture Vocabulary test (PPVT-5) was administered (Dunn, 2019). The recipient was required to point to the correct picture that represented the words spoken by the clinician. Lipreading cues were available to the recipient and printed words were also available for the target words. Both the WST and PPVT provide the target word in a written form and assess receptive vocabulary but the WST unlike the PPVT does not require an understanding of the meaning of the word. For both tests, the raw number of correct answers was converted into a standardized score with a mean of 100 and a standard deviation of 15 (Dunn, 2019; Schmidt & Metzler, 1992), based on a normative population.
Symbol Digit Modality Test
The SDMT is a neurocognitive test involving a simple substitution task that requires pairing of specific numbers with geometric figures within 90 s (Smith, 1982). After a practice run of 10 items, the task assesses processing speed, divided attention, visual scanning and tracking, and motor speed. All incorrect substitutions (unless self-corrected) were recorded, and the final score was calculated as the total number of correct symbols substituted minus errors. A lower score indicates poorer performance.
Stroop Test
The Victoria Stroop Colour Word Test (VST) Stroop test measures selective attention, cognitive flexibility and processing speed, commonly used to evaluate executive functions (Scarpina & Tagini, 2017).
It consists of three cards: Dots (D), Words (W), and Colors (C).
- On the D card, participants name the colors of 24 colored dots. - On the W card, they name the ink color of printed neutral words (not color names). - On the C card, they name the ink color of color words printed in incongruent ink (e.g., “red” printed in green).
Participants were timed as they completed each card, and errors (that were not self-corrected) were recorded. The outcome measure was calculated as the time to complete the C card divided by the time to complete the D card, with a higher score indicating poorer performance.
Patient-Related Measures
Patient-related measures included duration of severe to profound high-frequency (SPHF) loss in the implanted ear, age at implantation, age at screening, the preoperative word score in the implanted ear, a rating of tinnitus annoyance and etiology. Duration of SPHF loss was self-reported on the screening form. Tinnitus annoyance in everyday life was evaluated with two questions. Firstly, subjects were asked if they experienced tinnitus in the implanted ear. If the answer to this question was yes, they were asked to rate how bothersome tinnitus was in their daily life (0 = not at all, 1 = mild, 2 = moderate, and 3 = severe). If subjects answered no to having tinnitus in the implanted ear, they were arbitrarily assigned 0 (not at all) to the question “Is your tinnitus bothersome in your daily life?” Subject etiologies were categorized into seven groups: Meniere's Disease, Genetic, Structural damage (including meningitis), Otosclerosis, Hair-cell damage, Sudden sensorineural hearing loss, and Unknown. Blamey et al. (2013) assigned separate categories for meningitis and for otosclerosis. However, given the low numbers of subjects in the current study who presented with an etiology of meningitis, this etiology was included in the structural damage category, along with trauma and inner ear dysplasia. The hair-cell damage category included noise exposure, scarlet fever, viral labrynthitis, autoimmune disease, chronic otitis media, large vestibular aqueduct syndrome, rubella, measles, and whooping cough. The genetic category was based on a familial classification of etiology in medical records and did not involve genetic testing. Each of the categories except for the “unknown” category was categorized as 1 (presence) and 0 (absence). For subjects with unknown etiologies, their data were not classified as “0” for any of the known etiology categories, because they might still fall under one of these known categories, even though the exact cause of deafness is unknown.
Outcome Variables
Table 5 summarizes the outcome variables measured in this study. Details for each variable are provided in the Supplemental Methods document. The subject's Own MAP was used to test the outcome variables.
Summary of Outcome Variables.

Statistical Analyses
Univariable Analyses
Univariable analyses were initially conducted to identify independent predictors for subsequent inclusion in the multivariable models. This step ensures that only variables demonstrating a potential independent influence on the outcomes are carried forward, minimizing confounding in the comprehensive analyses. Modiolar distance, base and apical insertion depths were assessed separately within perimodiolar and lateral wall array subgroups due to potential selection bias related to surgical decisions based on anatomical considerations or preoperative hearing levels.
All the outcome variables in this study were continuous except for performance group (poor performer versus good performer defined by the word recognition in quiet score). For continuous outcome variables, a linear regression was conducted for each predictor variable. For the categorical outcome variable of performance group, logistic regression was utilized to estimate the relationship between each predictor variable and the likelihood of being classified as a poor performer versus a good performer. The odds ratio describes the change in likelihood of being in the poor performance group relative to the good performance group for each one-unit increase in the predictor variable. Specifically, an odds ratio of 1 indicates that the predictor does not influence the performance group. An odds ratio greater than 1 indicates that each unit increase in the predictor is associated with an increased likelihood of being in the poor performer group, while an odds ratio less than 1 suggests a protective effect that decreases the likelihood of being in the poor performer group with each unit increase in the predictor. Due to the exploratory nature of the study, p-values were not adjusted for multiplicity.
Multivariable Analyses
A multivariable model was constructed for each outcome variable using the following procedure:
Inclusion of independent predictor variables which had p-values ≤ .2 in the univariable analysis. It is acknowledged that this univariable regression p-value cut-off criterion could introduce some bias, leading to the increased risk of missing a significant finding for a variable. However, it was not possible to allow all variables to enter the backwards regression due to the large number of independent variables and insufficient sample size with measured data for all the independent variables. Eligible predictors originating from the same category of predictor variables (e.g., average IPG offset and maximum IPG offset) were examined for close correlations, using paired variable scatterplots calculating the Pearson correlation coefficient r. A rule was applied to exclude closely correlated variables within the same category; where a pair of variables had r ≥ 0.7, one of the variables would be excluded. This usually resulted in only one predictor variable out of each category being included in the initial multivariable model. The 1/2 matrix PECAP variables which had small sample sizes were excluded from the multivariable analyses. Also excluded were the electrode placement variables; modiolar distance and base and apical insertion depth, which were analysed in subgroups as described above. An initial multivariable regression model was constructed, from which a backward stepwise regression approach was taken. At each step, the predictor variable with the largest p-value (model intercept excluded) was removed and the model re-run, until all nonintercept predictors in the model had relatively low p-values (< .2). The cut-off of 0.2 rather than the more conservative cut-off of 0.05 was chosen to allow retention of independent variables that explain a reasonable amount of adjusted variance. This was considered appropriate given the exploratory nature of the study. Multicollinearity between predictor variables was evaluated using the variance inflation factor (VIF). The VIFs for the predictor variables in the final model were required to be less than 2.0, allowing only small intercorrelation between variables. Eligible predictors with smaller sample sizes or convergence issues that were excluded from the initial multivariable model were added back in, one by one, and were included in the final model if all predictor variables in the model reached a significance level of p < .2.
Missing data posed a challenge for model fitting, since the number of subjects in the sample could change substantially as variables were added or removed in the stepwise procedure. Initially, the LASSO (Least Absolute Shrinkage and Selection Operator) technique was attempted for model selection, but the small sample size, further split for cross-validation, led to convergence issues and occasional spurious results. Given the exploratory nature of the study, p-values were not corrected for multiple testing in the multivariable analyses. However, correlations between CI outcomes (except for aided thresholds) were moderate to high, which decreased the risk of spurious findings compared to low or no correlation between outcomes (Bishop, 2023). As expected, there were low correlations between aided thresholds and the other outcomes. The mean correlation for the primary endpoint outcomes excluding aided thresholds was 0.62.
In each multivariable linear regression model, the coefficient estimate, standard error and 95% confidence limits, and significance (p-value) for each predictor variable were reported in addition to the overall adjusted R-square. Instead of interpreting the coefficients of the independent variables as the impact of a single unit change, they are discussed in terms of the effect of a 20% change in the predictor variable's range (from its minimum to maximum value) on the dependent variable. This provides a consistent and more meaningful interpretation of the regression coefficients across the performance outcomes. Residual diagnostics (histograms, QQ plots, and residuals vs. fitted values) were computed for each model to confirm that assumptions of normality were not violated.
For the binary outcome of performance group (poor vs. good performers defined by the word recognition score in quiet), a multivariable logistic regression was conducted. The multivariable logistic regression was computed using the same procedure as the multivariable linear regression. Results included the coefficient estimate (β), standard error, odds ratio with 95% confidence intervals, and p-values. The odds ratios of the independent variables are again discussed in terms of the impact of a change of 20% of the independent variable's data range (minimum to maximum) on the dependent variable.
Results
Univariable Analyses
Tables 6 and 7 show the predictor variables that were significantly associated with outcome measures with an uncorrected p-value <.05. Additional details for the univariable regressions are provided in Supplemental Univariable plots. For many predictor variables, the averages were computed for the basal, apical, and mid array region in addition to the overall average. In these cases, only the variable with the lowest p-value is shown for each outcome. Figure 1 shows the regression plots for the independent variables that were significantly associated with phoneme discrimination in noise (Language-independent Test, LIT) with uncorrected p-values <.05. Plots for the other outcome measures are provided in the Supplemental Univariable plots.

Scatter plots for the prediction of LIT performance for predictor variables with a significant association (uncorrected p < .05). Good performer (GP) and poor performer (PP) group data is shown. The regression lines, Pearson correlation coefficients, and associated p-values are shown.
Univariable Analyses With Significant Neural Health Predictor Variables for Auditory Sensitivity Measures, Performance Group (Words in Quiet at 65 dB SPL) and Sentences in Noise.

For each variable for the auditory sensitivity measures, the upper row shows in italics the r value and uncorrected significance of the r (*** p <.001, ** p < .01, * p < .05) and the lower row shows the sample size (n) and coefficient estimates. PDQ65 and PDQ50 refer to phoneme discrimination in quiet at 65 dB SPL and 50 dB SPL, respectively. For performance group (words in quiet) the upper row shows the odds ratio and lower row the sample size (n).
AMDT= Amplitude Modulation Detection Test; avg=average; BP= bipolar; IPG= interphase gap; LIT= Language-independent Test; PDQ= Phoneme Discrimination in Quiet; PE= polarity effect; PECAP=Panoramic electrically evoked compound action potential; QSMD= Quick Spectral Modulation Detection.
Univariable Analyses With Significant Mapping, Electrode Placement, Cognitive, and Patient-Related Predictor Variables for Auditory Sensitivity Measures, Performance Group (Words in Quiet at 65 dB SPL) and Sentences in Noise.
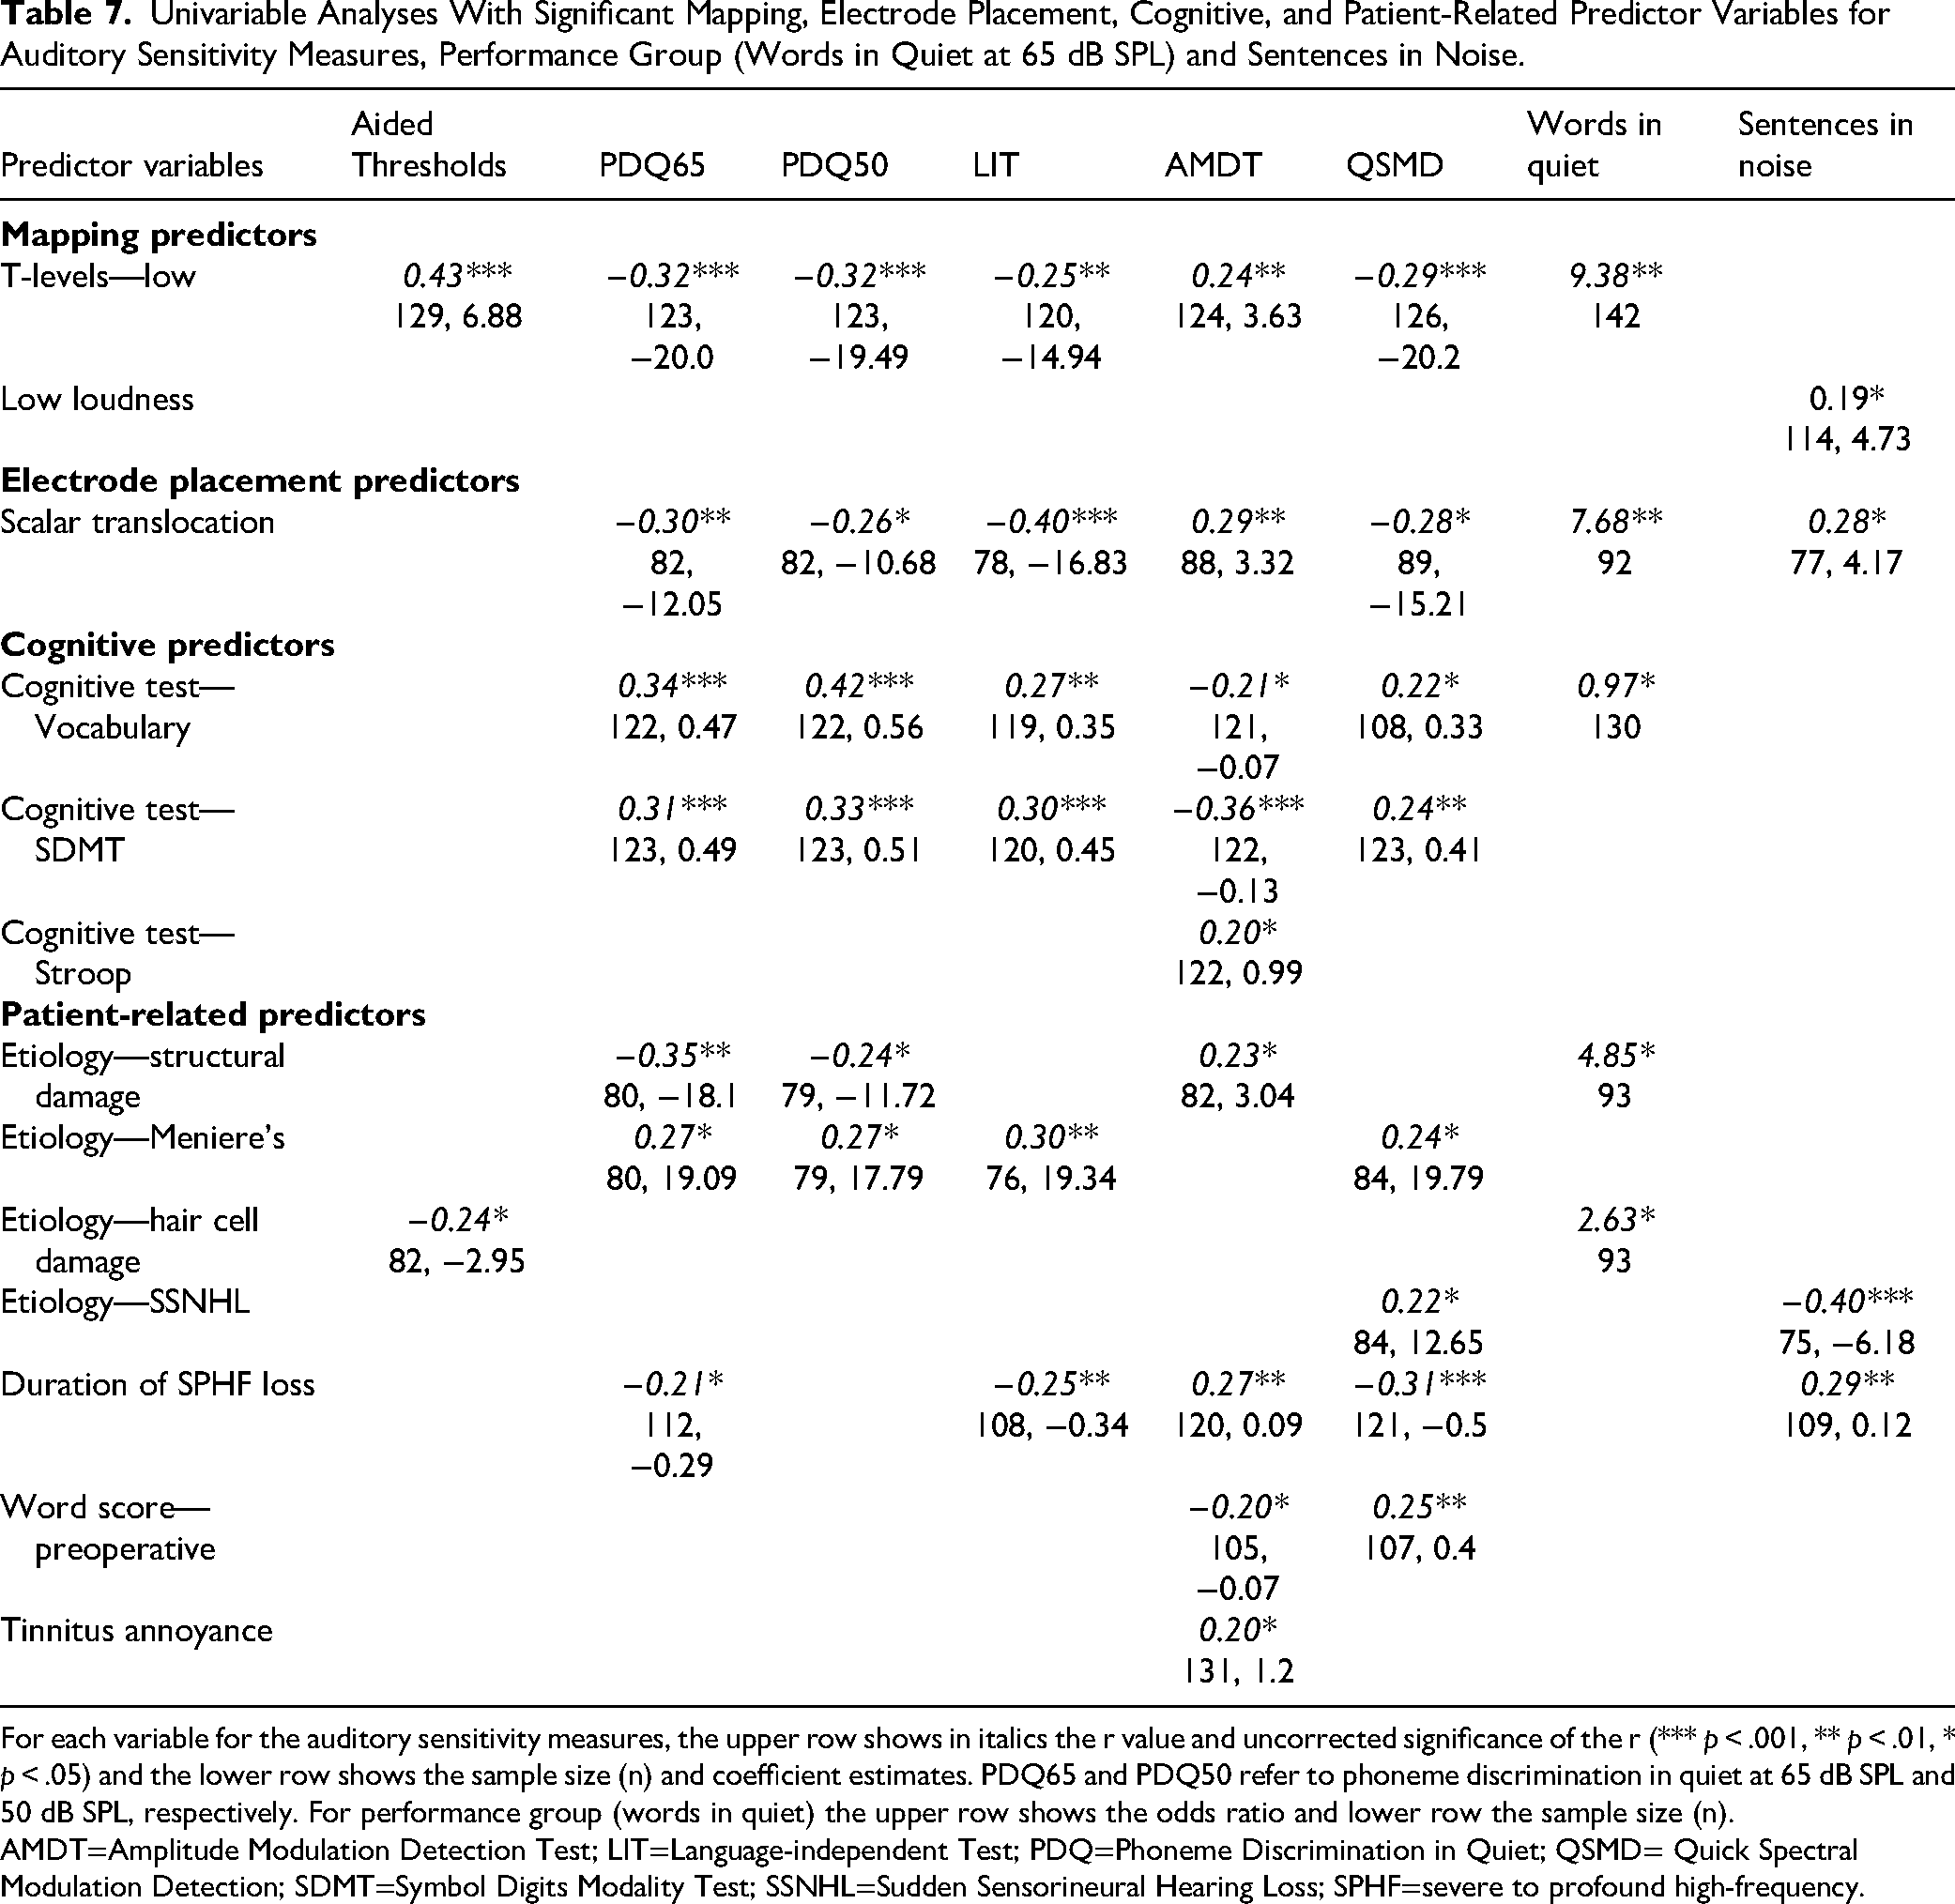
For each variable for the auditory sensitivity measures, the upper row shows in italics the r value and uncorrected significance of the r (*** p < .001, ** p < .01, * p < .05) and the lower row shows the sample size (n) and coefficient estimates. PDQ65 and PDQ50 refer to phoneme discrimination in quiet at 65 dB SPL and 50 dB SPL, respectively. For performance group (words in quiet) the upper row shows the odds ratio and lower row the sample size (n).
AMDT=Amplitude Modulation Detection Test; LIT=Language-independent Test; PDQ=Phoneme Discrimination in Quiet; QSMD= Quick Spectral Modulation Detection; SDMT=Symbol Digits Modality Test; SSNHL=Sudden Sensorineural Hearing Loss; SPHF=severe to profound high-frequency.
Average BP thresholds, average total refractory time, basal IPG offset, low T-levels, scalar translocation, and vocabulary ability were consistent, significant predictors across outcomes. Higher average BP thresholds, higher average total refractory time, higher average basal IPG offset, presence of low T-levels, presence of scalar translocation, and lower vocabulary ability were associated with poorer CI performance. Performance on the SDMT was also a consistent strong predictor across auditory sensitivity outcomes with higher performance being associated with better performance.
As mentioned in the Methods section the computation of the average BP threshold variable included assigning thresholds to unmeasured levels that were out of compliance or had reached the device output limit. Re-analyses of the univariable regressions examining the relationship between average BP thresholds and each of the performance outcomes were conducted with the omission of these unmeasured values (see Figure 8 in the Supplemental Univariable Plots). When the unmeasured values were removed average BP thresholds were still significantly associated with all CI performance outcomes with very similar correlations and p-values compared to the analyses with the unmeasured values. The correlations were very slightly lower for most of the outcome measures for the analysis we chose which included unmeasured values. The analysis with unmeasured values enabled more electrodes per subject to be part of the data analysis.
Multivariable Analyses
Aided Thresholds
An accurate multivariable linear regression model was unable to be obtained for average aided thresholds since there were no independent variables apart from low T-levels that met the criterion of p ≤ .2.
Phoneme Discrimination in Quiet
Tables 8 and 9 show the final multivariable linear regression models (n = 53 and n = 55) which predict phoneme discrimination in quiet at 65 dB SPL (RMS) and at 50 dB SPL (RMS), respectively. The variance accounted for in phoneme discrimination at the conversational and soft presentation levels are 57% and 48%, respectively (adjusted R-squared). Three predictor variables feature in the models at both presentation levels. An increase of 3.9 dB re 1µV in average BP thresholds was associated with a decrease of 4.2% and 3.4% in phoneme discrimination in quiet at the conversational and softer presentation levels, respectively. The presence of low MAP T-levels was associated with a 21.6% and 19.5% decline in phoneme discrimination at 65 dB SPL and 50 dB SPL, respectively. On the vocabulary test, an increase of 11.6 and 11.0 in the standardized score was associated with an increase of 5.5% and 5.2% in phoneme discrimination scores at the higher and lower presentation levels, respectively.
Multivariable Linear Regression Model Predicting Phoneme Discrimination in Quiet at the Presentation Level 65 dB SPL (RMS).

The adjusted R-squared of the model with 53 subjects (33 good performers and 20 poor performers) is shown in addition to the predictor variables, estimate (beta or slope), 95% confidence limits and significance of beta and p-value (**p < .01; *p < .05).
avg.=average; BP= bipolar; NRT= neural response telemetry; PE= polarity effect.
Multivariable Linear Regression Model Predicting Phoneme Discrimination in Quiet at the Presentation Level 50 dB SPL (RMS).
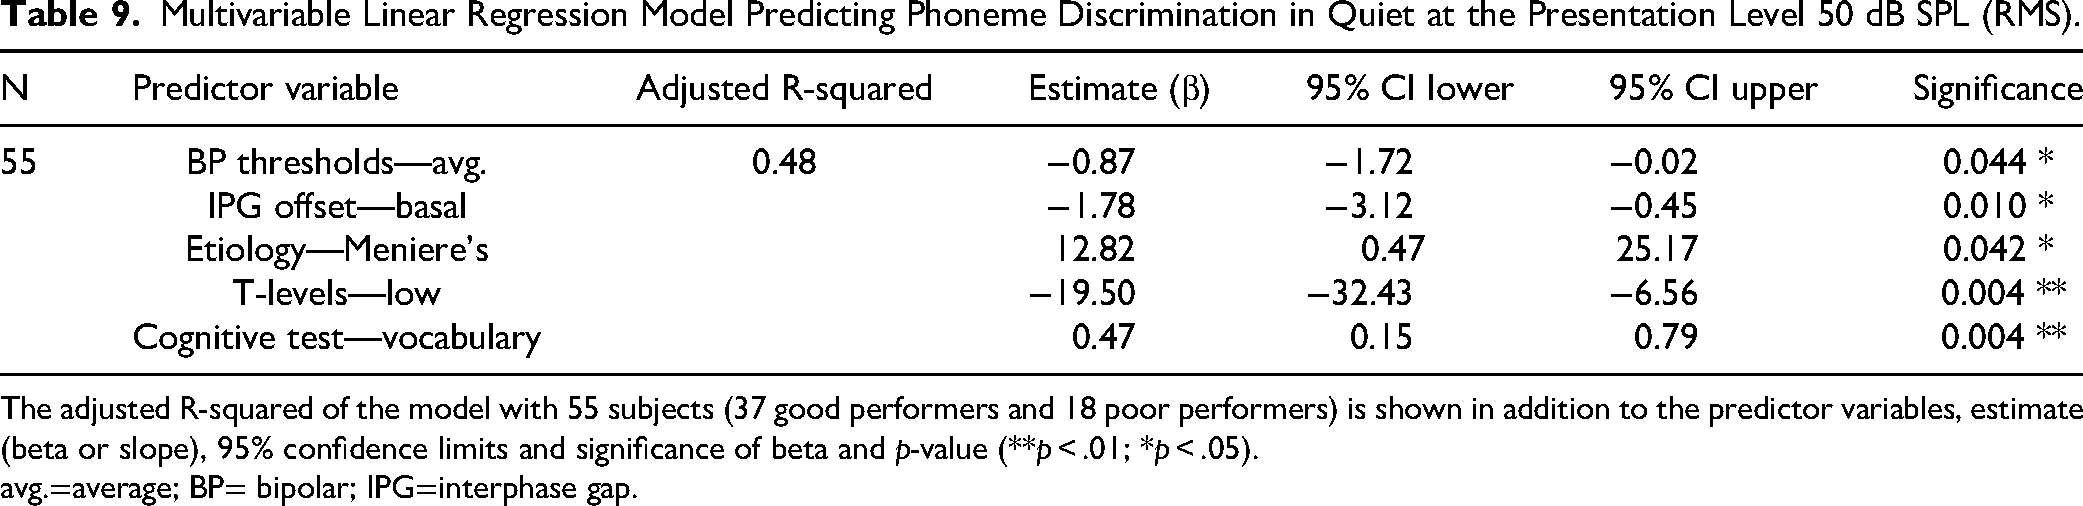
The adjusted R-squared of the model with 55 subjects (37 good performers and 18 poor performers) is shown in addition to the predictor variables, estimate (beta or slope), 95% confidence limits and significance of beta and p-value (**p < .01; *p < .05).
avg.=average; BP= bipolar; IPG=interphase gap.
Three predictor variables were present in the final model for phoneme discrimination at the conversational level of 65 dB SPL but not at the softer presentation level. An increase of 20.6 dB CL in average basal NRT PE was associated with a decline of 5.4% in phoneme discrimination at 65 dB SPL. An increase of 1.0 dB re 1µA in average basal behavioral PE was associated with a 4.4% decline in phoneme discrimination at 65 dB SPL. An increase of 319.8 µs in average total refractory time was associated with 6.4% degradation in phoneme discrimination at 65 dB SPL.
The presence of etiology Meniere's disease was in the final model at the softer presentation level only. The presence of Meniere's disease was associated with a 12.8% increase in phoneme discrimination at 50 dB SPL. An increase of 2.7 dB CL in the average basal IPG offset was associated with a decrease of 4.8% for phoneme discrimination at 50 dB SPL.
Phoneme Discrimination in Noise (LIT)
Table 10 shows the final multivariable linear regression model (n = 73 subjects) predicting phoneme discrimination in noise (LIT) with an adjusted R-square variance of 45%. Six of the seven predictor variables in the final model show significance at the p < 0.05 level; average BP thresholds, average IPG offset, average refractory time, low MAP T-levels, SDMT, and Stroop performance. An increase of 3.9 dB re 1µA in average BP thresholds was associated with a decline of 4.6% on the LIT. An increase of 2.7 dB CL for average IPG offset was related to a 6.8% degradation in LIT performance. Presence of low T-levels was associated with a decline of approximately 14.7%. An increase of 9.6 years in duration of SPHF loss was associated with a decline of 1.8% in LIT score and an increase in the ratio of 1.3 on the Stroop test (poorer performance) was associated with a decline of 6.1% on the LIT. For average refractory time, an increase of 329.6µs was related to a decrease of 3.7% on the LIT. Improved performance of 12 on the SDMT was associated with an improvement of 4.1% on the LIT.
Multivariable Linear Regression Model Predicting Phoneme Discrimination in Noise.

The adjusted R-squared of the model with 73 subjects (48 good performers and 25 poor performers) are shown in addition to the predictor variables, estimate (beta or slope), 95% confidence limits and significance of beta and p-value (***p < .001, *p < .05, †p < .2).
avg.=average; BP= bipolar; IPG= interphase gap; SDMT=Symbol Digits Modality Test; SPHF=severe to profound high-frequency.
Spectral Resolution (QSMD)
Table 11 shows the final multivariable linear regression model (n = 65) which predicts QSMD performance with an adjusted R-square of 35%. Two neural health predictors are independent predictors of QSMD in the model, one is significant at p < .05. Average total refractory time was the strongest predictor in the model; a 315.5 µs increase in total refractory time was associated with a 9.6% decrease in the QSMD score. Although missing significance at the 0.05 level of significance, apical IPG threshold difference IPG contributed to unique variance in the model. A 21.0 dB CL increase in the IPG threshold difference (58 µs IPG minus 7 µs IPG) was associated with a 3.68% increase in the QSMD score. An additional 9.6 years in the duration of the SPHF loss was related to a degradation of 4.4% on the QSMD.
Multivariable Linear Regression Model Predicting QSMD Performance.

The adjusted R-squared of the model with 65 subjects (42 good performers and 23 poor performers) is shown in addition to the predictor variables, estimate (beta or slope), 95% confidence limits and significance of beta and p-value ***p < .001, **p < .01, †p < .2.
avg=average; IPG= interphase gap; QSMD= Quick Spectral Modulation Detection; SPHF=severe to profound high-frequency.
Temporal Resolution (AMDT)
Table 12 shows the final multivariable linear regression model (n = 80) which predicts AMDT performance with an adjusted R-square of 33%. Two neural health predictors—average BP thresholds and average total refractory time were significant independent predictors of AMDT performance in the presence of the other model variables. An increase in average BP thresholds of 3.9 dB re 1µA was associated with poorer AMDT performance; an increase of 1.2 dB (re 100% modulation). An increase of 329.6 µs in average total refractory time was associated with an increase of 1.0 dB re 100% modulation on the AMDT. The MAP setting predictor—low T-levels was also a significant predictor in the model. The presence of low MAP T-levels was associated with poorer AMDT performance, with an increase of 2.11 dB (re 100% modulation). Three patient-related variables accounted for unique variance in the final model. An increase of 11.4 years in the duration of SPHL was associated with poorer AMDT performance: with an increase of 0.9 dB (re 100% modulation). An increase of 12.2 years in age at screen was similarly associated with poorer AMDT performance, with a 0.8 dB (re 100% modulation) increase on the AMDT. Although missing significance at the 0.05 level of significance tinnitus interference in life was a predictor of AMDT performance with increased tinnitus interference (an increase of 1 in the tinnitus rating) associated with poorer AMDT performance—a 1.0 dB (re 100% modulation) increase. Performance on the Stroop was a significant predictor of AMDT. An increase of 1.3 s in the Stroop ratio score (poorer performance) was associated with poorer AMDT performance, with an increase of 2.1 dB (re 100% modulation).
Multivariable Linear Regression Model Predicting AMDT Performance.

The adjusted R-square of the model with 80 subjects (51 good performers and 29 poor performers) is shown in addition to the predictor variables, estimate (beta or slope), 95% confidence limits and significance of beta and p-value (**p < .01; *p < .05, †p < .2).
AMDT=Amplitude Modulation Detection Test; avg=average; SPHF=severe to profound high-frequency.
Performance Group (Words in Quiet)
Table 13 shows the final multivariable logistic regression model (n = 72 subjects) which models the odds of being a poor versus a good performer using the six-step procedure described in the methods, based on the word recognition score in quiet at 65 dB SPL (RMS) measured in visit 1. Three of the five variables in the model show significance at the p < .05 or p < .01 levels. Scalar translocation is associated with 14.9 times the chance of being a poor rather than good performer (95% CI: 2.3, 96.2). Low T-levels in the everyday MAP is associated with 34.4 times the chance of being a poor rather than good performer (95% CI: 2.48, 478.0). Subjects with higher average IPG offset are more likely to be poorer performers on words in quiet. Every 3.10 unit increase in the average IPG offset is associated with 2.31 times the chance of being a poor rather than good performer (95% CI: 1.13, 4.81). The remaining two variables in the model, average bipolar thresholds and vocabulary ability had p-values less than .2. Subjects with higher average BP thresholds are more likely to be poorer performers on words in quiet. Every 3.85 unit increase in the average bipolar threshold is associated with 1.44 times the chance of being a poor rather than good performer (95% CI: 0.86, 2.44). Subjects with higher vocabulary scores are more likely to be good performers for words in quiet. Every 14.4 unit increase in the standardized vocabulary score is associated with 0.48 times the chance of being a poor rather than good performer (95% CI: 0.22, 1.00). That is, the chance of being a poor rather than good performer is reduced by 52% (95% CI: 0%, 78% reduction).
Multivariable Logistic Regression Model Showing the Variables That Predict the Odds of Being a Poor Versus Good Performer.

Group means, odds ratios, intercept, beta (“slope”) with standard error, 95% confidence limits and significance of the slope with p-value listed as well as symbols indicating different significance thresholds ( **p < .01; *p < .05, †p < .2).
avg.=average; BP= bipolar; IPG= interphase gap.
Sentences in Noise
Table 14 shows the final multivariable linear regression model (n = 47) which predicts sentence in noise (CI alone) performance with an adjusted R-square of 60% for the combined variance explained by six significant predictor variables.
Multivariable Linear Regression Model Predicting Sentence in Noise (CI Alone) Performance.

The adjusted R-square of the model with 47 subjects (27 good performers and 20 poor performers) is shown in addition to the predictor variables, estimate (beta or slope), 95% confidence limits and significance of beta and p-value (**p < .01; *p < .05).
avg.=average; IPG= interphase gap; LAPL= loudness acceptable presentation level; SPHF=severe to profound high-frequency.
Two neural health predictor variables were significant predictors in the model; apical LAPL amplitude and average IPG offset levels. An increase of 2.3 dB CL in the average IPG offset was associated with an increase of 1.7 dB in the SRT. An increase of 180.8 µV in average apical LAPL amplitude was associated with better sentence in noise performance, with a decrease of 1.8 dB in the SRT. The presence of scalar translocation was associated with poorer sentence in noise performance, with an increase of 4.9 dB in the SRT. Similarly, the presence of low MAP T-levels was associated with poorer performance, with an increase of 6.9 dB in the SRT. Finally, two patient-related variables, duration of SPHL and preoperative words in quiet score were significant predictors of sentence in noise performance in the implanted ear. A 12% improvement on the preoperative word score was associated with better performance—a decrease of 1.5 dB in the SRT. An 11.4-year increase in duration of SPHL was associated with poorer performance, with an increase of 1.0 dB in the SRT.
Electrode Array Subgroup Analyses
Univariable analyses were computed for both the perimodiolar and lateral wall array types to determine the predictive power of the CT variables—modiolar distance, electrode array base depth, and tip depth in explaining the variance for eight CI outcomes (see Table 15). Figure 2 shows the univariable plots for performance as a function of modiolar distance for the perimodiolar arrays, given that several significant associations were observed for modiolar distance. Phoneme discrimination in quiet at the conversational level is shown in the plots given the stronger correlations with the electrode placement predictor variables at this presentation level compared to the softer presentation level.
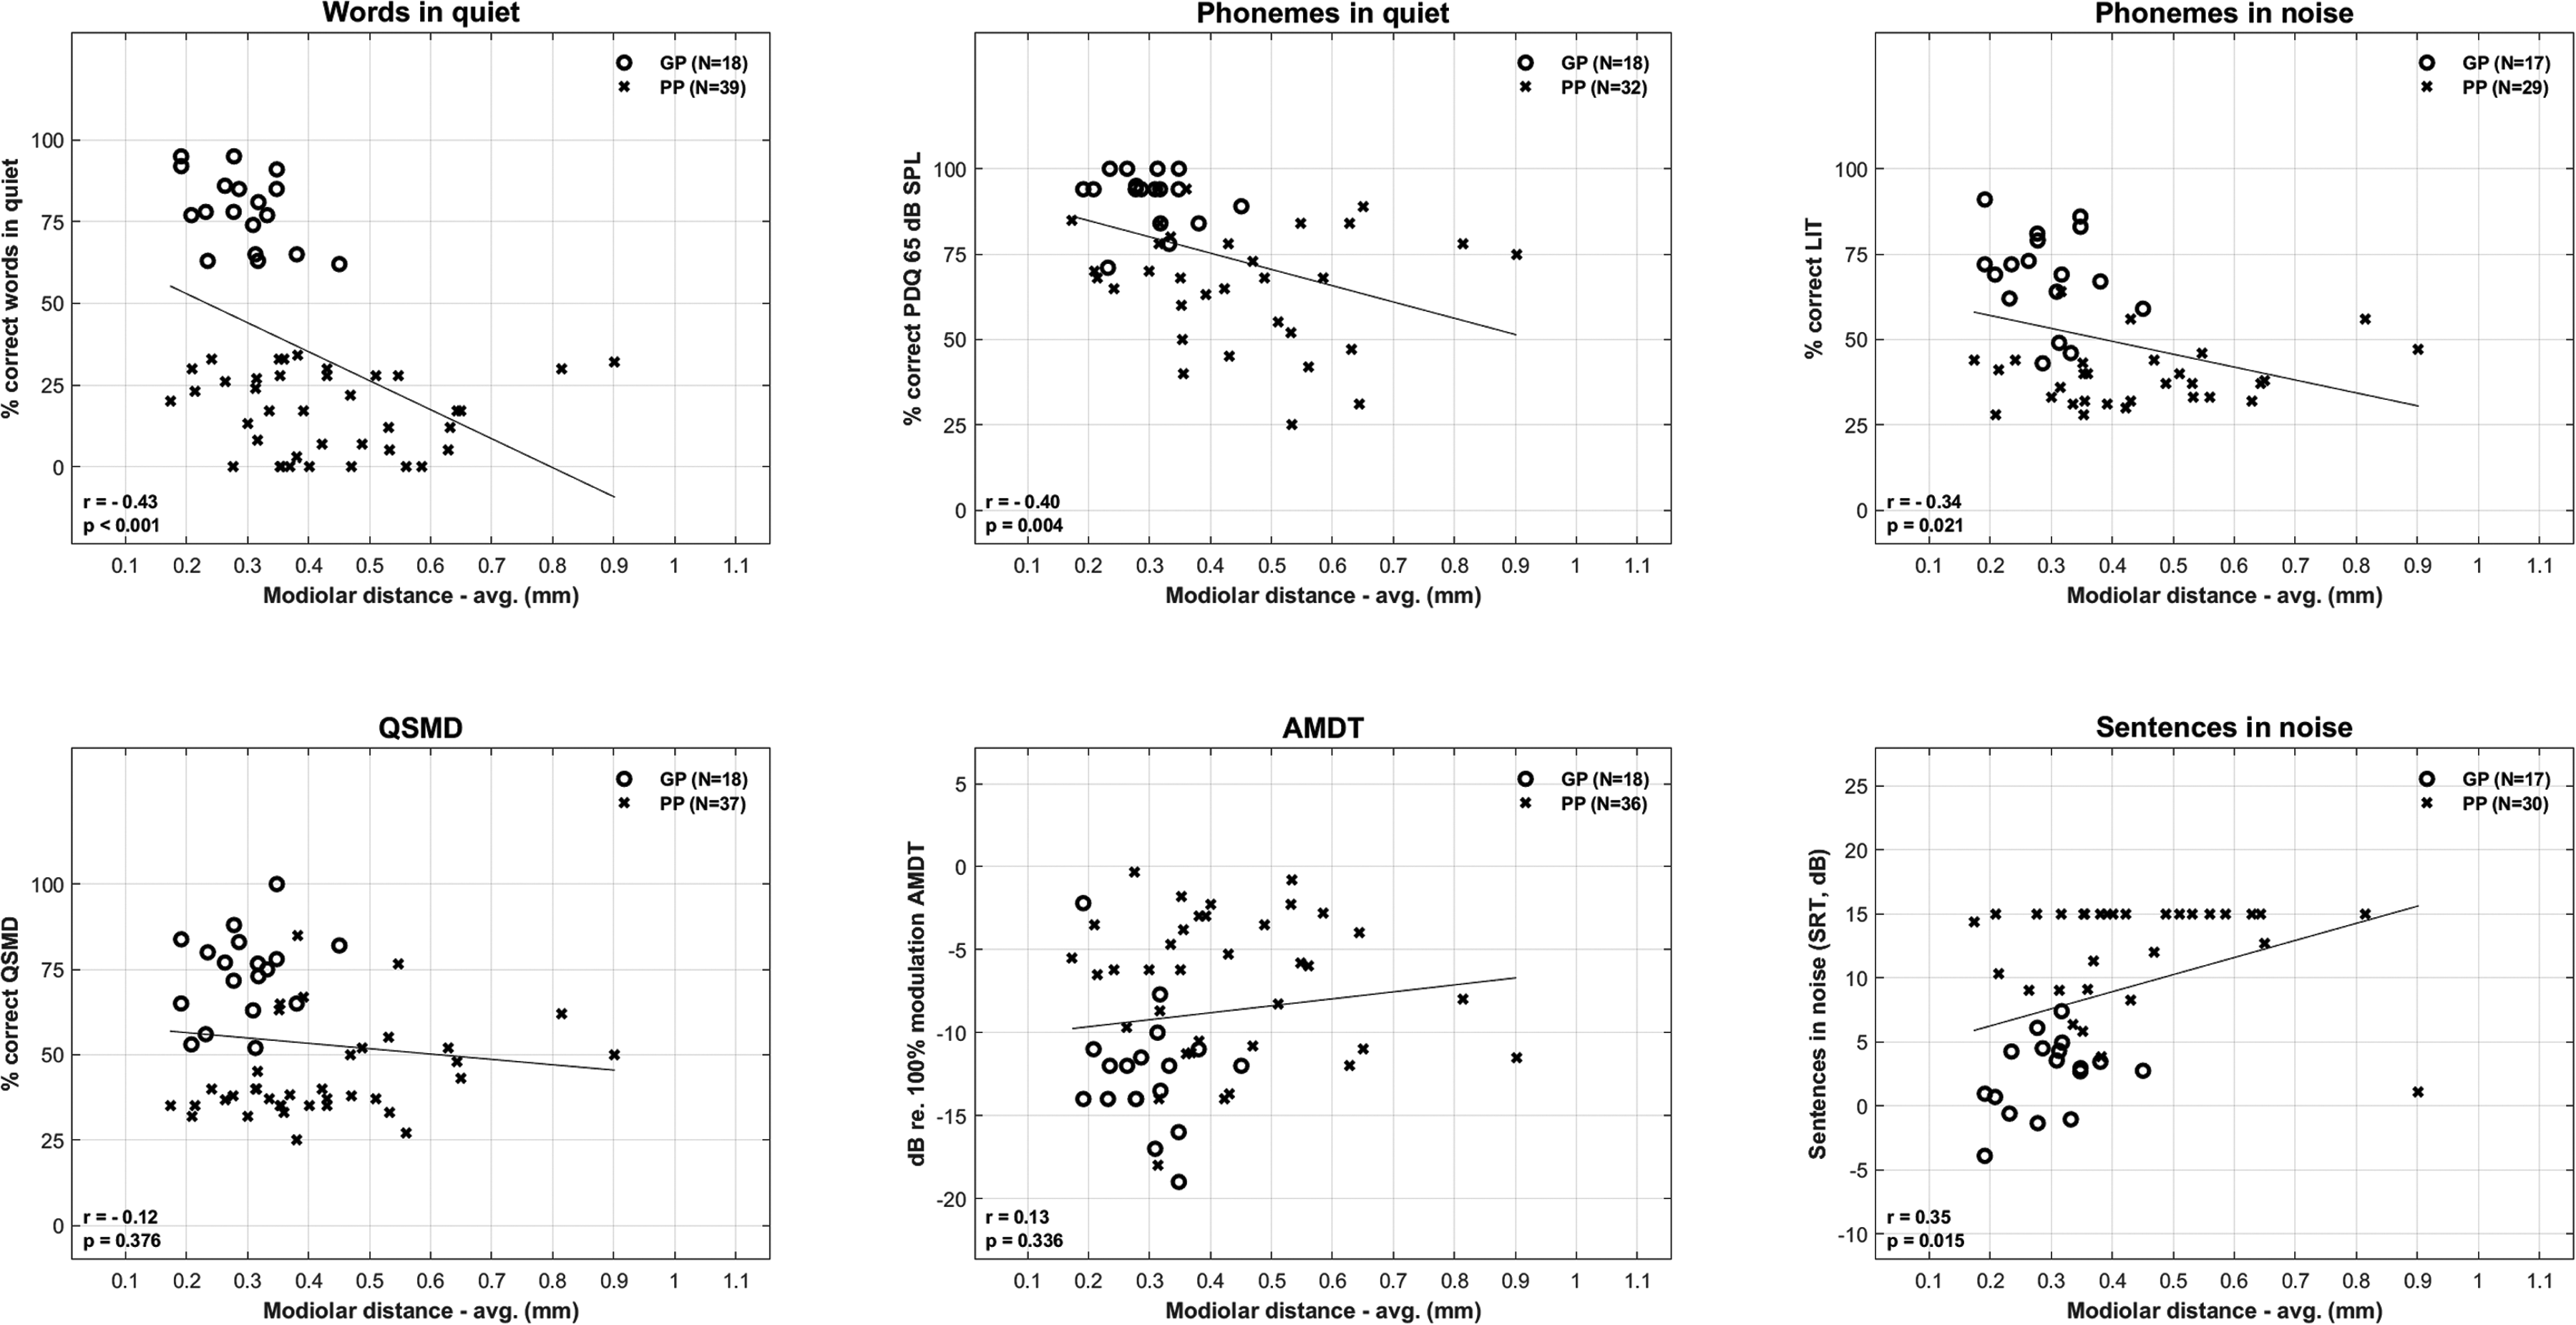
CI performance across different outcome measures as a function of modiolar distance for perimodiolar arrays. For each outcome measure the uncorrected correlation (r), p-value, and number of good performers (GP) and poor performers (PP) are shown. Lower scores are better for AMDT and sentences in noise. AMDT=Amplitude Modulation Detection Test.
The Uncorrected Correlation (r value) in Italics, Significance of the r value (***p < .001, **p < .01, *p < .05) and Number of Subjects is Shown for the Univariable Analyses Between the Three CT Scan Variables and CI Outcomes for PM Array and LW Subgroups.

AMDT=Amplitude Modulation Detection Test; avg.=average; CT=computed tomography; LIT=Language-independent Test; LW=lateral wall; PM=perimodiolar; QSMD= Quick Spectral Modulation Detection.
Discussion
Multivariable regression models revealed four main predictor variables; average BP thresholds, average total refractory time, low MAP T-levels and IPG offset, that consistently predicted CI performance across several outcome measures, despite differences in sample size. Sample size for these multivariable models ranged from 47 subjects for sentence in noise performance to 80 subjects for AMDT. The variance explained by the models (adjusted R2) ranged from 33% for AMDT to 60% for sentences in noise. The more conservative adjusted R2 was used to minimize inflation of the model's explanatory power, effectively preventing overestimation of the model's ability to predict outcomes. It is acknowledged though that the p-values for the univariable and multivariable analyses were not corrected for multiplicity given the exploratory nature of the study. Given the intent to consider the potential contribution of a large variety of predictor variables in this study, a Bonferroni or Benjamini—Hochberg correction for multiplicity may lead to a high rate of false negatives. Such corrections would be overly conservative since they assume independence of the multiple tests, whereas intercorrelations exist between many of the predictors and between outcomes in the present study (Bishop, 2023).
In the multivariable regression models, higher BP thresholds were significantly associated with poorer performance on the LIT, AMDT, and PDQ (Phoneme Discrimination in Quiet) at both 65 dB SPL and 50 dB SPL. Furthermore, in the presence of other predictor variables higher BP thresholds were associated with a greater chance of being a poor performer (based on words in quiet). However, this association with performance group did not reach statistical significance, as the p-value was not below the .05 threshold. It needs to be reiterated that a small proportion of the BP thresholds were limited by out of compliance estimations and consequently underestimated the true thresholds. The regression coefficients for BP thresholds suggest a clinically meaningful impact, for example, a small 3.9 dB re 1µA increase in thresholds (20% of the dynamic range of the BP threshold data) was associated with a 4.2% and 4.6% degradation in scores for phoneme discrimination in quiet and in noise, respectively. The univariable plots show that the association of BP thresholds with CI outcomes is largely driven by the association of poorer performance for BP thresholds above approximately 56 dB re 1µA. These findings are compatible with the studies by Arjmandi et al. (2022) and DeVries et al. (2016) that reported poorer speech perception performance in CI subjects with higher focused thresholds. Arjmandi et al. (2022) found that high focused thresholds above 50 dB re 1µA were associated with poorer performance. In contrast to the findings of Bierer (2007) and Long et al. (2014), neither the variability of the BP thresholds measured in several different ways, nor the root mean square error of the threshold/modiolar distance relationship were significant predictors of CI performance in univariable or multivariable regression analyses. It should be noted that there was less variability in the BP data in the present study compared to the Long et al. study, which may in part be due to some true thresholds being constrained by reaching the device's maximum output. Furthermore, BP thresholds were averaged from a greater number of measures in the previous studies compared to the present study, likely enhancing the precision compared to our study. Mesnildrey et al. (2020) were also unable to confirm the finding of a significant association between CI performance and the root mean square error of the threshold/distance relationship. However, the computed tomography (CT) imaging in their study and in our study had less resolution than the resolution of the postoperative CT scans in the Long et al. (2014) study, affecting the accuracy of the modiolar distance measurements.
BP thresholds do not purely reflect neural health at the electrode–neuron interface. A multivariable analysis with 91 subjects in this study (perimodiolar and lateral wall arrays) revealed that scalar translocation, and average modiolar distance together explained 25% of the adjusted variance in the BP thresholds (see Supplemental BP threshold variability analysis). Modiolar distance alone accounted for 15% of the adjusted variance. Scalar translocation would be expected to damage the cochlea, mix perilymph and endolymph, and potentially cause damage to neural tissue so the common factor of BP thresholds and scalar translocation could be neural. It should be noted that BP thresholds were significant predictors of CI performance outcomes for both lateral wall arrays and perimodiolar arrays in univariable analyses. For perimodiolar arrays, BP thresholds were a significant predictor of all outcome measures with correlations ranging from 0.42 to 0.55. For the smaller lateral wall array group, correlations were also significant for all outcome measures except AMDT, with significant correlations ranging from 0.29 to 0.40. This finding supports the hypothesis that average BP thresholds reflect more than just modiolar proximity, especially given that modiolar proximity was not a significant predictor of CI performance for lateral wall arrays.
Average total refractory time was significantly associated with CI performance in four of the multivariable regression models; for the LIT, QSMD, AMDT, and PDQ at 65 dB SPL. Higher total refractory time which comprised a combination of the absolute and relative refractory times, was associated with poorer CI performance. An increase of 320 to 330 µs in total refractory time was associated with decreases of 6.4% and 4.0% for phoneme discrimination in quiet at 65 dB SPL and in noise, respectively, and with an increase of 1.0 dB on the AMDT. Preclinical findings with guinea pigs by Ramekers et al. (2015) show that a lack of SGN is associated with greater refractory period. He et al. (2018), Kiefer et al. (2001), and Skidmore et al. (2023) reported a similar association to the present findings, whereas a meta-analysis by van Eijl et al. (2017) reported only one significant refractory finding for Kiefer et al. (2001) and nonsignificant findings for the other five clinical studies that were evaluated. It is worth noting however that the nonsignificant findings for four of the other five studies were all in the expected direction with longer refractory time from masker stimulation being associated with poorer CI performance. Refractory time can be reported in different ways. Kiefer et al. (2001) did not report absolute or relative refractory time but reported the masker probe interval associated with 50% of the maximum ECAP amplitude. This measure is very similar to the combined T0 +tau measure used in the present study which is the masker probe interval associated with approximately 63% of the maximum ECAP amplitude. A recent study with 32 adult Nucleus CI recipients by Marx et al. (2024) used the same total refractory period measure as the present study. One subject was reported to have a peripheral limiting factor on early sentence recognition after CI activation due to apical and basal electrode total recovery periods that exceeded the 95% confidence limit for the cohort's data (∼ 2.3 ms). Notably, the refractory period for this subject matches the maximum total refractory period for one of our poor performers.
A range of potential mapping issues in subjects’ everyday MAPs were evaluated in this study (see Table 4) but the presence of low T-levels was the only consistent significant predictor of CI performance. In the multivariable regression models, the presence of low T-levels (a binary predictor variable) was significantly associated with a greater likelihood of being a poor performer on words in quiet, and poorer performance for aided thresholds, phoneme discrimination in quiet at both 65 dB SPL and 50 dB SPL, phoneme discrimination in noise (LIT), AMDT and sentences in noise. It should be reiterated that “low T-levels” in this study refer to T-levels that were substantially underfitted. Specifically, on average across all electrodes, the T-levels in the recipient's Own MAP were lower by more than 60% of the dynamic range (of the Measured MAP) compared to the T-levels in the systematically Measured MAP created during the study. The regression coefficients for low T-levels suggested a strong clinically meaningful impact, for example, presence of low T-levels was associated on average with a 15% to 22% degradation in phoneme discrimination in noise and in quiet, respectively. This study's findings on the impact of low T-levels are compatible with the findings of Busby and Arora (2016) who reported significant degradation for words in quiet at conversational and soft presentation levels when the T-levels were set substantially below the “true” T-levels. Similarly, they are indirectly consistent with the study by de Graaff et al. (2020), which reported degradation in word recognition at 65 dB SPL for late onset CI recipients (after 7 years of age) when aided thresholds exceeded 25 dB HL. This study's findings highlight the value of T-level measurements in clinical mapping. However, accurately determining T-levels can be challenging in individual cases. The finding that low T-levels degraded sentence-in-noise performance might seem counterintuitive at first. However, this can be explained by the fact that many poor performers had adaptive speech reception thresholds SRTs at the cap of 15 dB, which is essentially like listening in quiet. This might also explain why Stroop test performance did not correlate with sentence-in-noise outcomes, in contrast to the significant association with LIT and AMDT performance. In the latter two tests the distracting noise was present for every subject.
IPG offset (either average or basal) was a significant predictor in multivariable models for four outcome measures: words in quiet, sentences in noise, phoneme discrimination in noise, and in quiet at 50 dB SPL. Greater offset refers to the increased current level that is needed for the shorter IPG to elicit the same ECAP amplitude elicited by the longer IPG. Greater IPG offset was unexpectedly associated with poorer CI performance. This was not in the expected direction based on data from animal studies showing greater IPG effect associated with greater SGN density (Prado-Gutierrez et al., 2006; Ramekers et al., 2014). Theoretically, the larger IPG allows more time for spike initiation before the cancelation phase of the biphasic pulse, although the precise mechanisms linking increased ECAP parameters, such as slope and offset, with increasing IPG remain unclear. Univariable plots show that the unexpected association in the present study is mainly driven by a small group of good performing CI recipients with their smallest IPG offsets below 8 dB CL. There is no obvious explanation for this. Considerable scatter in CI performance was shown for IPG offsets above 8 dB CL. The finding of greater IPG offset for children with CND (small or absent CN in imaging data) compared to children with clearly delineated cochlear nerves (Yuan et al., 2022) aligns with the present study's finding of greater IPG offset associated with poorer CI performance, but the underlying mechanism for this finding is far from clear. In the reanalysis of the He et al. (2020) data, Yuan et al. interestingly found that the method of calculating the IPG change metric influenced the statistical significance between CN groups—whether calculated as a raw difference or proportional to the lower IPG value.
Recent clinical studies have investigated the predictive impact of the IPG offset but failed to find a significant association between this metric and speech perception and/or psychophysical outcome measures. In a study by Imsiecke et al. (2021) with 32 CI subjects, including those using standard CI and electrical acoustic stimulation, there was no significant expected correlation between speech-in-noise performance and IPG current offset measured on the most apical electrode. However, a significant association (R2 = 0.38) was found between the duration of deafness and IPG current offset on the most apical electrode. Interestingly, the direction of this association aligns with the findings of the present study and those reported by Skidmore and He (2021) and Yuan et al. (2022), albeit the IPG offset calculation was performed inversely in the Imsiecke et al. (2021) study. In the Imsiecke study, level 50% change, also termed IPG current offset, was defined as the subtraction of the stimulus intensity obtained with the smaller IPG from the stimulus intensity obtained with the larger IPG. This resulted in a negative association with greater duration of hearing loss being associated with more negative current offset, but consistent with the current study findings due to the inverted calculation method. A study by Arslan and Luo (2022) with 8 CI subjects (12 ears) found no significant associations between IPG offset and measures of CI performance. A study by Sijgers et al. (2025) with 17 CI adults with residual hearing at 500 Hz did not measure the association of IPG offset with speech perception performance but reported an unexpected lack of association between IPG offset and preoperative acoustic hearing, an indirect measure of neural health. The inconsistency between preclinical and clinical IPG offset findings may be partly due to anatomical differences and variations in peak ECAP amplitudes. Peak amplitudes in clinical studies will be constrained by the tolerance of the listener to loud stimuli.
The clinical study by Schvartz-Leyzac and Pfingst (2018) supported the preclinical findings on the IPG effect, though it did not specifically measure the IPG offset. Instead, it focused on the change in AGF slope with increased IPG. It found that between ear differences in AGF slope changes, as IPG increased from 7 to 30 µs, were strongly associated with differences in speech perception performance among 10 bilaterally implanted CI subjects, with steeper slopes for higher IPGs. This effect was shown to be independent of non-neural factors such as electrode position, reinforcing its potential relevance to neural health assessment (Schvartz-Leyzac et al. (2020). The preclinical study by Ramekers et al. (2014) reported a stronger correlation between neural health and the change in the AGF slope as IPG increased compared to the correlation between neural health and the IPG offset measured at 50% of the ECAP dynamic range. The present study measured the AGF slope difference for 58 µs compared to 7 µs but did not find this variable to be significant in either the univariable or multivariable regression analyses for any of the CI performance outcomes. Although this study aimed to replicate the approach used by Schvartz-Leyzac and Pfingst (2018) in measuring the linear slope difference, discrepancies in the data sets made a precise replication impossible. The current study's data exhibited less consistent patterns, with R2 values of 0.5 or higher for the linear slopes, whereas all the electrode measurements in the previous study had much stronger correlations, with R2 values of 0.95 or higher.
The patient-related predictor variable duration of SPHF loss that indirectly reflects neural health significantly predicted CI performance in four of the multivariable models; LIT, AMDT, and QSMD and sentences in noise. Consistent with previous literature (Blamey et al., 2013; Goudey et al., 2021), greater duration of SPHL loss was associated with poorer CI performance. An increased duration of 10 years of SPHF loss was associated with degradations of 1.8%, 4.6%, and 0.8 dB on the LIT, QSMD, and AMDT, respectively. The negative impact of this variable tended to be for durations of deafness above approximately 30 years. Another patient-related indirect marker of neural health—preoperative word perception significantly predicted SRT performance. Consistent with previous findings by Plant et al. (2016) and Goudey et al. (2021), better preoperative word perception was found to be associated with better sentence in noise performance in the implanted ear. In line with past studies (Blamey et al., 2013; Goudey et al., 2021), the presence of the etiology—Meniere's disease was associated with better CI performance, although only for one of the outcome measures in the multivariable models—phoneme discrimination in quiet at 50 dB SPL. In the univariable analyses with a greater cohort of subjects, Meniere's etiology was associated with better performance for most outcome measures; words in quiet, phonemes in quiet at both presentation levels, phonemes in noise and the QSMD, possibly due to less neural degeneration or preserved cochlear structures in Meniere's patients compared to other etiologies. Goudey et al. (2021) also reported that the etiology categories—meningitis, otosclerosis, sudden hearing loss, and “other” were associated with CI performance in the multivariable analyses. Consistent with the findings of Blamey et al. (2013) and Goudey et al. (2021), the etiology grouped category of structural damage, which included meningitis, was associated with poorer CI performance for several outcome measures in univariable analyses. The patient-related variable—tinnitus annoyance in everyday life was associated with poorer AMDT performance in the multivariable analysis, although the variable did not reach significance at the 0.05 level. This finding is compatible with previous studies with normal and hearing-impaired listeners that report poorer speech perception associated with severe to chronic tinnitus (Vielsmeier et al., 2016; Ivansic et al., 2017; Liu et al., 2018). Tinnitus has been shown to degrade attention (Ivansic et al., 2017) and it is likely that this impact on attention and concentration is contributing to the association of poorer speech perception with tinnitus.
In contrast to the abovementioned predictors, there were a few variables that showed weaker predictive power in the final multivariable model for a single primary outcome measure. These included the IPG threshold difference at the apical end of the array, the polarity effect, and LAPL amplitude at the apical region. Higher apical LAPL amplitude was associated with better CI alone SRT performance; an increase of 181 µv was associated with a 1.8 dB improvement on the SRT. This is compatible with previous literature where higher average LAPL amplitude was reported to be associated with better speech recognition scores (DeVries et al., 2016; Dong et al., 2023). The basal behavioral PE neural health variable was a significant predictor in the multivariable model for phoneme discrimination at the conversational level. Higher cathodic centered thresholds compared to anodic centered thresholds were associated with poorer phoneme discrimination. It was also a significant predictor in the univariable analyses for PDQ at 65 dB SPL and AMDT performance. Additionally, average behavioral PE was a significant univariable predictor of QSMD. This study's findings for the polarity effect measured with asymmetrical stimuli are compatible with previous findings by Carlyon et al. (2018), Goehring et al. (2019), and Mesnildrey et al. (2020). The behaviorally measured PE is theorized to reflect peripheral neural health. Additionally, in the present study, PE was measured objectively using ECAP (NRT). The basal NRT PE measure was also a predictor in the final model for phoneme discrimination in quiet at 65 dB SPL and predicted performance in the same direction as the behavioral PE. The behavioral and objective PE measures were likely not measuring the same underlying neural health given their lack of intercorrelation as evidenced in the low VIF value <2.0.
The PECAP predictor variables were not considered for inclusion in the multivariable analyses due to the smaller sample size. Univariable analyses did not show significant associations between the PECAP current spread and CI outcomes but indicated some promising associations between PECAP neural health and CI outcomes. The mid region PECAP neural health (η), referring to the middle section of the electrode array, was a significant univariable predictor of PDQ at both 65 dB SPL and 50 dB SPL, QSMD, words in quiet and sentences in noise. Higher mid region PECAP neural health was associated with better CI performance. The odds ratio and coefficients imply a clinically meaningful impact for this predictor, for example, a 0.03-unit increase in mid-region PECAP neural health was associated with a 1.9 dB decrease in SRT. However, the odds ratio and coefficients for this predictor need to be treated with caution given the higher associated confidence intervals and consequent uncorrected p-values that only just reached significance at the 0.05 level for several outcome measures. Another PECAP neural health predictor, SD signed diff (the signed difference in η values, either in the mid region or across the entire electrode array), was also a significant univariable predictor of two CI outcomes: QSMD and AMDT. Again, the direction of the association across these outcome measures was consistent; greater variability in the signed difference of the η values was associated with poorer CI performance. As with the mid region PECAP neural health (η) predictor, there were wider confidence intervals associated with the coefficients and the uncorrected p-value only just reached significance at the .05 level.
Expectedly, scalar translocation was a strong predictor of performance for words in quiet and sentences in noise. The presence of scalar translocation increased the odds of being a poor performer on words in quiet by 14.9% on average and was associated with an increase of 4.9 dB in the SRT. Finley et al. (2008), Holden et al. (2013), and James et al. (2019) also reported significantly poorer speech perception scores with scalar translocation. In the univariable analyses, scalar translocation was a highly significant predictor for words in quiet, LIT, QSMD, and AMDT performance. Consistent with past literature, scalar translocation was primarily associated with the perimodiolar Contour Advance array (James et al., 2019). In this study, it occurred almost exclusively in the Contour Advance arrays except for one Slim Modiolar perimodiolar array. For one of the poor performers with scalar translocation there were also indications of a minor tip folder at the apical end.
Cognitive variables surprisingly accounted for variance in several auditory sensitivity outcomes in the multivariable models. Although auditory sensitivity measures were expected to be minimally influenced by cognitive skills, performance on the SDMT was a significant predictor of phoneme discrimination in noise on the LIT, in both multivariable and univariable regressions. Better SDMT performance was associated with better phoneme discrimination in noise. While SDMT performance was not a predictor in the multivariable models for any other auditory sensitivity measures or for performance group, it was a significant predictor in the univariable regressions for the psychophysical AMDT and QSMD measures and for PDQ at 50 dB SPL. These findings could in part be explained by the focused attention required in the SDMT, since attentional skills are measured in addition to speed of processing and spatial-temporal ability. Better performance on the Stroop test was associated with better AMDT and LIT performance in the multivariable models. Stroop performance was also a significant predictor in the univariable AMDT analysis but missed significance at the 0.05 level in the univariable LIT analysis (p = .141). This study's findings are compatible with those by Marx et al. (2024) who reported that poorer Stroop performance (poorer than 1.65 SD from published normal population means) for four out of 32 adult CI subjects was a limiting neurocognitive factor affecting early sentence recognition 1 month after CI activation. Although English standardized scores were not available for the Victoria Stroop test used in the present study, a Kruskall-Wallis one way analysis of variance on ranks showed that there was no difference in the median age for the poor and good performer groups (H = 0.771, p = .38). The association between Stroop and LIT performance in this study is intuitive since the LIT test requires discrimination of phonemes in the presence of background noise and the Stroop test aims to measure the ability to inhibit irrelevant stimuli. Although less intuitive, the association between the AMDT and Stroop could be explained by the extra cognitive load or distraction caused by the addition of amplitude jitter in this task. The CI recipient is required to ignore the AMDT jitter in the same way that they need to ignore the incongruent color word in the Stroop task, focusing on the task-relevant information. In contrast, Stroop performance was not a significant predictor on the QSMD test, and it is noteworthy that there was no loudness jitter for the spectrally modulated versus unmodulated stimuli in this task.
Vocabulary test performance was a predictor of the odds of being a poor performer on words in quiet in the multivariable model and a significant predictor in the univariable analysis. It was also a significant predictor of PDQ at both 65 dB SPL and 50 dB SPL in univariable and multivariable models. However, there have been mixed findings in the literature regarding the predictive value of vocabulary in explaining variability in word recognition in quiet. Holden et al. (2013) found nonsignificant results after correcting for age, and nonsignificant associations were also reported by Collison et al. (2004) and Kaandorp et al. (2015). In contrast, Völter et al. (2021) reported significantly poorer lexical decision accuracy and slower reaction times in recognizing nonwords for low performing adult CI users compared to high performing users on Freiburg words in quiet. Similarly, the vocabulary test at the Medizinisch Hochschule Hannover site in the present study evaluated the ability to distinguish nonwords from real words.
Electrode Array Subgroup Analyses
Smaller modiolar distance was significantly associated with better performance on several CI outcomes for the perimodiolar array group only. In contrast, there were no significant associations for the lateral wall group. The finding of smaller modiolar distance being associated with better performance aligns with the study by Chakravorti et al. (2019) which reported uncorrected significant Pearson correlation coefficients of 0.27 and −0.27 for words in quiet and sentences in noise, respectively, for precurved arrays and no significant correlations for straight arrays. The association for modiolar distance for the perimodiolar array subgroup is also consistent with the findings reported by Holden et al. (2013) on the related predictor variable of wrapping factor. The importance of modiolar proximity for perimodiolar arrays is not surprising, where smaller distances between the electrode and the modiolus are linked with better speech perception outcomes. In these arrays, positioning the electrodes closer to the spiral ganglion cells can lead to more focused stimulation and less current spread. However, with lateral wall arrays, modiolar distance becomes less impactful since the electrodes are positioned farther from the modiolus by design. In these cases, small variations in modiolar distance have minimal effect on performance due to the consistently large distance. As a result, modiolar proximity is not a key determinant of performance for lateral wall arrays, and other factors, such as insertion depth, may play a more significant role in influencing outcomes.
Greater base insertion depth was significantly associated with poorer word recognition in quiet for perimodiolar arrays. For the other outcome measures the association was in the same direction but was nonsignificant. Although Chakravorti et al. (2019) did not find a significant Pearson correlation between base insertion depth and word recognition for perimodiolar arrays, the association was similarly in the same direction, suggesting a consistent trend. The negative association between base depth and speech outcomes aligns with the previous finding by Holden et al. (2013), which reported that deeper insertions at the base can push the perimodiolar array toward the lateral wall—an undesirable position that may degrade performance. On the other hand, for straight arrays Chakravorti et al. (2019) reported better outcomes with greater base insertion depth, with significant associations between base insertion depth and CNC words and BKB-SIN outcomes. For the lateral wall arrays in the present study, increased base insertion depth was significant for only one CI outcome—sentences in noise, where greater base depth was linked to poorer performance in the implanted ear—contradictory to the findings of Chakravorti et al. (2019). However, the direction of the association for all other outcomes was neither consistent nor close to significance. In the present study greater tip insertion depth was not associated with CI performance for lateral wall arrays and for perimodiolar arrays it was only significantly associated with one CI outcome—better sentence in noise performance. However, the p-value in the latter association was only just significant at the uncorrected .05 level so caution should be exercised in drawing any conclusions based on this finding. It should be noted that most arrays in the present study had tip insertion depths between 300° and 400°, with only a small number of subjects exhibiting slightly shallower or deeper insertions. This range is generally much shallower than the insertion depths for lateral wall arrays analyzed in Weller et al. (2023), where greater tip insertion depth was significantly associated with better word recognition in a multivariable analysis that included relevant confounding variables. However, it should be noted that no significant association was found between tip insertion depth and sentence in noise performance in the study by Weller et al.
Conversely, James et al. (2019) and Ketterer et al. (2022) reported significant negative associations between apical tip insertion depth and speech perception performance in multivariable analyses that controlled confounding variables. Subjects in the study by James et al. (2019) showed optimal early postoperative performance at insertion depths around 360° or even less, which leads to a frequency-place mismatch of approximately one octave. The contrasting findings in the literature for angle insertion depth highlight the lack of consensus and complexity re the relationship between insertion depth, frequency to electrode allocation and cochlear implant performance.
Future Directions
The findings of this study provide further insights into important sources of variability in CI performance which aim to ultimately inform personalized CI care. Estimation of differences in neural health within the cochlear may lead to focusing stimulation on healthy neurons or changing the frequency assignment of electrodes to healthy regions. The potential neural health markers identified in the study are promising but still require further development and confirmation. Incorporating measurement of bipolar or focused thresholds in clinical mapping with interpretation in relation to modiolar distance could be considered. It would be preferable if these thresholds could be measured objectively. Measurement of ECAP neural health markers such as refractory period on a subset of electrodes could also be considered in the clinical setting. Understanding the cognitive ability of the CI recipient is clearly important and diagnosis and management of cognitive deficits would likely benefit from a multidisciplinary approach.
Classical statistical analyses were conducted in the present study and in most past studies on understanding CI variability. In the future, the application of AI and machine learning to handle large, multilevel datasets could illuminate important patterns that classical analyses may overlook.
Conclusions
The combination of a range of potential predictor variables were found to account for between 33% and 60% of the variability in CI performance outcomes in a reasonably large group of subjects which targeted the enrollment of both good and poor performers. Predictors from potential sources of variability including mapping, anatomical/surgical, neural health, impedances, cognitive, and patient-related variables all contributed to explaining variability in speech perception outcomes. The strongest and most consistent predictors of performance in both univariable and multivariable analyses across a range of outcomes were underfitted MAP T-levels, average BP thresholds, average total refractory time, and IPG offset. The IPG offset finding was incompatible with preclinical findings, but recent clinical findings show a lack of consensus on the impact of IPG offset on CI performance. Other neural health variables such as ECAP LAPL amplitude and the polarity effect were weaker predictors accounting for variance in the presence of other variables for only one performance outcome. The presence of scalar translocation, which occurred almost exclusively in the Contour Advance electrode array, was associated with degraded performance for several speech perception outcomes in univariable analyses and for words in quiet and sentences in noise in multivariable analyses. Modiolar distance was a predictor of performance for several speech perception outcomes for perimodiolar arrays only, with smaller modiolar distance being associated with better performance. Cognitive variables accounted for variance in several outcomes including psychophysical outcomes. Poorer vocabulary ability was associated with poorer phoneme discrimination in quiet and increased odds of being a poorer performer, poorer SDMT scores were associated with poorer phoneme discrimination in noise and poorer Stroop performance was associated with poorer performance for both temporal resolution and phoneme discrimination in noise. Finally, patient-related predictors including duration of SPHF loss, Meniere's etiology, preoperative word recognition, and tinnitus annoyance accounted for some performance variance in at least one multivariable model.
Supplemental Material
sj-tiff-1-tia-10.1177_23312165251347138 - Supplemental material for A Prospective, Multicentre Case-Control Trial Examining Factors That Explain Variable Clinical Performance in Post Lingual Adult CI Recipients
Supplemental material, sj-tiff-1-tia-10.1177_23312165251347138 for A Prospective, Multicentre Case-Control Trial Examining Factors That Explain Variable Clinical Performance in Post Lingual Adult CI Recipients by Pam Dawson, Amanda Fullerton, Harish Krishnamoorthi, Kerrie Plant, Robert Cowan, Nadine Buczak, Christopher Long, Chris J. James, Fergio Sismono and Andreas Büchner in Trends in Hearing
Supplemental Material
sj-tiff-2-tia-10.1177_23312165251347138 - Supplemental material for A Prospective, Multicentre Case-Control Trial Examining Factors That Explain Variable Clinical Performance in Post Lingual Adult CI Recipients
Supplemental material, sj-tiff-2-tia-10.1177_23312165251347138 for A Prospective, Multicentre Case-Control Trial Examining Factors That Explain Variable Clinical Performance in Post Lingual Adult CI Recipients by Pam Dawson, Amanda Fullerton, Harish Krishnamoorthi, Kerrie Plant, Robert Cowan, Nadine Buczak, Christopher Long, Chris J. James, Fergio Sismono and Andreas Büchner in Trends in Hearing
Supplemental Material
sj-tiff-3-tia-10.1177_23312165251347138 - Supplemental material for A Prospective, Multicentre Case-Control Trial Examining Factors That Explain Variable Clinical Performance in Post Lingual Adult CI Recipients
Supplemental material, sj-tiff-3-tia-10.1177_23312165251347138 for A Prospective, Multicentre Case-Control Trial Examining Factors That Explain Variable Clinical Performance in Post Lingual Adult CI Recipients by Pam Dawson, Amanda Fullerton, Harish Krishnamoorthi, Kerrie Plant, Robert Cowan, Nadine Buczak, Christopher Long, Chris J. James, Fergio Sismono and Andreas Büchner in Trends in Hearing
Supplemental Material
sj-tiff-4-tia-10.1177_23312165251347138 - Supplemental material for A Prospective, Multicentre Case-Control Trial Examining Factors That Explain Variable Clinical Performance in Post Lingual Adult CI Recipients
Supplemental material, sj-tiff-4-tia-10.1177_23312165251347138 for A Prospective, Multicentre Case-Control Trial Examining Factors That Explain Variable Clinical Performance in Post Lingual Adult CI Recipients by Pam Dawson, Amanda Fullerton, Harish Krishnamoorthi, Kerrie Plant, Robert Cowan, Nadine Buczak, Christopher Long, Chris J. James, Fergio Sismono and Andreas Büchner in Trends in Hearing
Supplemental Material
sj-tiff-5-tia-10.1177_23312165251347138 - Supplemental material for A Prospective, Multicentre Case-Control Trial Examining Factors That Explain Variable Clinical Performance in Post Lingual Adult CI Recipients
Supplemental material, sj-tiff-5-tia-10.1177_23312165251347138 for A Prospective, Multicentre Case-Control Trial Examining Factors That Explain Variable Clinical Performance in Post Lingual Adult CI Recipients by Pam Dawson, Amanda Fullerton, Harish Krishnamoorthi, Kerrie Plant, Robert Cowan, Nadine Buczak, Christopher Long, Chris J. James, Fergio Sismono and Andreas Büchner in Trends in Hearing
Supplemental Material
sj-tiff-6-tia-10.1177_23312165251347138 - Supplemental material for A Prospective, Multicentre Case-Control Trial Examining Factors That Explain Variable Clinical Performance in Post Lingual Adult CI Recipients
Supplemental material, sj-tiff-6-tia-10.1177_23312165251347138 for A Prospective, Multicentre Case-Control Trial Examining Factors That Explain Variable Clinical Performance in Post Lingual Adult CI Recipients by Pam Dawson, Amanda Fullerton, Harish Krishnamoorthi, Kerrie Plant, Robert Cowan, Nadine Buczak, Christopher Long, Chris J. James, Fergio Sismono and Andreas Büchner in Trends in Hearing
Supplemental Material
sj-tiff-7-tia-10.1177_23312165251347138 - Supplemental material for A Prospective, Multicentre Case-Control Trial Examining Factors That Explain Variable Clinical Performance in Post Lingual Adult CI Recipients
Supplemental material, sj-tiff-7-tia-10.1177_23312165251347138 for A Prospective, Multicentre Case-Control Trial Examining Factors That Explain Variable Clinical Performance in Post Lingual Adult CI Recipients by Pam Dawson, Amanda Fullerton, Harish Krishnamoorthi, Kerrie Plant, Robert Cowan, Nadine Buczak, Christopher Long, Chris J. James, Fergio Sismono and Andreas Büchner in Trends in Hearing
Supplemental Material
sj-tiff-8-tia-10.1177_23312165251347138 - Supplemental material for A Prospective, Multicentre Case-Control Trial Examining Factors That Explain Variable Clinical Performance in Post Lingual Adult CI Recipients
Supplemental material, sj-tiff-8-tia-10.1177_23312165251347138 for A Prospective, Multicentre Case-Control Trial Examining Factors That Explain Variable Clinical Performance in Post Lingual Adult CI Recipients by Pam Dawson, Amanda Fullerton, Harish Krishnamoorthi, Kerrie Plant, Robert Cowan, Nadine Buczak, Christopher Long, Chris J. James, Fergio Sismono and Andreas Büchner in Trends in Hearing
Supplemental Material
sj-docx-9-tia-10.1177_23312165251347138 - Supplemental material for A Prospective, Multicentre Case-Control Trial Examining Factors That Explain Variable Clinical Performance in Post Lingual Adult CI Recipients
Supplemental material, sj-docx-9-tia-10.1177_23312165251347138 for A Prospective, Multicentre Case-Control Trial Examining Factors That Explain Variable Clinical Performance in Post Lingual Adult CI Recipients by Pam Dawson, Amanda Fullerton, Harish Krishnamoorthi, Kerrie Plant, Robert Cowan, Nadine Buczak, Christopher Long, Chris J. James, Fergio Sismono and Andreas Büchner in Trends in Hearing
Supplemental Material
sj-docx-10-tia-10.1177_23312165251347138 - Supplemental material for A Prospective, Multicentre Case-Control Trial Examining Factors That Explain Variable Clinical Performance in Post Lingual Adult CI Recipients
Supplemental material, sj-docx-10-tia-10.1177_23312165251347138 for A Prospective, Multicentre Case-Control Trial Examining Factors That Explain Variable Clinical Performance in Post Lingual Adult CI Recipients by Pam Dawson, Amanda Fullerton, Harish Krishnamoorthi, Kerrie Plant, Robert Cowan, Nadine Buczak, Christopher Long, Chris J. James, Fergio Sismono and Andreas Büchner in Trends in Hearing
Supplemental Material
sj-docx-11-tia-10.1177_23312165251347138 - Supplemental material for A Prospective, Multicentre Case-Control Trial Examining Factors That Explain Variable Clinical Performance in Post Lingual Adult CI Recipients
Supplemental material, sj-docx-11-tia-10.1177_23312165251347138 for A Prospective, Multicentre Case-Control Trial Examining Factors That Explain Variable Clinical Performance in Post Lingual Adult CI Recipients by Pam Dawson, Amanda Fullerton, Harish Krishnamoorthi, Kerrie Plant, Robert Cowan, Nadine Buczak, Christopher Long, Chris J. James, Fergio Sismono and Andreas Büchner in Trends in Hearing
Supplemental Material
sj-docx-12-tia-10.1177_23312165251347138 - Supplemental material for A Prospective, Multicentre Case-Control Trial Examining Factors That Explain Variable Clinical Performance in Post Lingual Adult CI Recipients
Supplemental material, sj-docx-12-tia-10.1177_23312165251347138 for A Prospective, Multicentre Case-Control Trial Examining Factors That Explain Variable Clinical Performance in Post Lingual Adult CI Recipients by Pam Dawson, Amanda Fullerton, Harish Krishnamoorthi, Kerrie Plant, Robert Cowan, Nadine Buczak, Christopher Long, Chris J. James, Fergio Sismono and Andreas Büchner in Trends in Hearing
Supplemental Material
sj-docx-13-tia-10.1177_23312165251347138 - Supplemental material for A Prospective, Multicentre Case-Control Trial Examining Factors That Explain Variable Clinical Performance in Post Lingual Adult CI Recipients
Supplemental material, sj-docx-13-tia-10.1177_23312165251347138 for A Prospective, Multicentre Case-Control Trial Examining Factors That Explain Variable Clinical Performance in Post Lingual Adult CI Recipients by Pam Dawson, Amanda Fullerton, Harish Krishnamoorthi, Kerrie Plant, Robert Cowan, Nadine Buczak, Christopher Long, Chris J. James, Fergio Sismono and Andreas Büchner in Trends in Hearing
Footnotes
Acknowledgements
We sincerely thank Charlotte Garcia for analyses of PECAP data, and internal colleagues Riaan Rottier, Ryan Melman, Andrew Vandali, Zachary Smith, Filiep Vanpoucke, Birgit Philips, Obaid Qazi, and Tim Brochier for their contributions to study design and/or analysis. We thank Colette McKay, Bob Carlyon, and Tommy Peng for their helpful input on specific neural health metrics. Thanks also to Sylvia Tari, Alex Rousset, Evelyn Do, Anika Morgenstern, Mark Schuessler, and Eugen Kludt for their help in recruitment and collection of data. Interim data was previously presented in poster format at the 2023 Conference on Implantable Auditory Prostheses—Lake Tahoe.
Ethical Considerations
This study was approved by the Royal Victorian Eye and Ear Hospital Ethics Committee on 26 March 2020 (RVEEH: 20 /1457H) and by the Hannover Medical School Ethics Committee on 20 April 2020 (MHH 8923-BO_S_2020). All participants provided written informed consent prior to enrollment in the study. This research was conducted ethically in accordance with the World Medical Association Declaration of Helsinki.
Funding
The authors disclosed receipt of the following financial support for the research, authorship, and/or publication of this article: This fundamental research was fully funded by Cochlear Limited. Employees of Cochlear Ltd played an integral role in the design and data analysis.
Declaration of Conflicting Interests
The authors declared no potential conflicts of interest with respect to the research, authorship, and/or publication of this article.
Data Availability
Data generated during and/or analyzed during the current study are not publicly available due to the large and complex nature of the dataset but are available from the corresponding author on reasonable request.
Supplemental Material
Supplemental material for this article is available online.
References
Supplementary Material
Please find the following supplemental material available below.
For Open Access articles published under a Creative Commons License, all supplemental material carries the same license as the article it is associated with.
For non-Open Access articles published, all supplemental material carries a non-exclusive license, and permission requests for re-use of supplemental material or any part of supplemental material shall be sent directly to the copyright owner as specified in the copyright notice associated with the article.