
Abstract
Under- and overamplification of sound is a common problem in hearing aid fitting. This paper describes the implementation of two new variants of the hearing in noise test for quantifying aided hearing at the lower and upper ends of the range of everyday-life sound levels. We present results from experiments carried out with 30 adult hearing aid users to determine the respective test–retest reliabilities. Participants completed a test battery consisting of the standard Danish hearing in noise test, a variant targeting the lower threshold of audibility and a variant targeting the limit of loudness discomfort. The participants completed the test battery twice for reliability analysis. The results revealed a significant difference between test and retest for both the hearing in noise test and the two hearing in noise test variants. However, the effect sizes for the differences were all very small. A calculation of Pearson correlation coefficients showed that both the hearing in noise test and the two new hearing in noise test variants had significant and strong correlations between test and retest. The within-subject standard deviations were determined to be 0.8 dB for hearing in noise test, 0.9 dB for lower-end test, and 2.2 dB for upper-end test. The findings demonstrate that both the lower-end test and upper-end test have high test–retest reliabilities, and thus can provide consistent and reliable results.
Keywords
Introduction
The purpose of hearing aid (HA) treatment is to enhance the HA user's communicative abilities by providing an audible signal while the amplification is at a tolerable and comfortable level (Valente et al., 1998). However, these criteria are not always met, and under- and overamplification of sound is a common problem in HA fitting, which results in the inability to hear low-level sounds adequately or loudness discomfort, respectively. Insufficient amplification may lead to problems hearing soft speech and whispering, while too much amplification can affect the HA user's perception of the HA's sound quality (Wong et al., 2003), which in turn may have an impact on the patient's overall satisfaction with HAs (Kochkin, 2010) and can be decisive for whether the HA user will use HAs (Kochkin, 2000).
Under- or overamplification of sound can occur for two main reasons. One is related to perception, for example, when the selected gain-prescription rule disagrees with the needs and preferences of the individual HA user (Ching et al., 2010). Other reasons are purely technical, for example, when HAs are not fitted precisely to the selected gain-prescription targets. Real-ear measurements (REMs) are a solution to this problem, ensuring that HAs are providing the desired target level of amplification (Munro et al., 2016). Finally, even REM-adjusted HA gain can be off target if hearing threshold levels (HTLs), which the target is prescribed from, are measured with error. The latter aspect is of particular interest in a parallel randomized clinical trial (RCT), outlined by Pedersen et al. (2023), which compares HA treatment based on user-operated audiometry to HA treatment based on traditional audiologist-driven audiometry. The present study was conducted as part of the preparatory work for the mentioned RCT. In any case, due to the varied reasons for under- and overamplification, it is necessary to focus on the HA user's actual aided hearing to assess these issues—technical measurements will not necessarily reveal them.
Traditionally, HA users’ hearing performance is assessed by evaluating speech intelligibility with a test of aided speech-in-noise (SIN) performance. One of the most widespread methods for assessing a HA user's aided SIN performance is the hearing in noise test (HINT) (Soli & Wong, 2008), which uses everyday sentences presented in noise. The HINT has been adapted to several languages (Soli & Wong, 2008), including Danish (Nielsen & Dau, 2011). Although tests like these give a good indication of a HA user's actual hearing performance, and thus can detect certain problems with the HA fitting, they are not well suited for detecting neither possible under- nor overamplification of sound. This is because the result of an aided SIN performance test mainly depends on the speech-to-noise ratio (van Dijkhuizen et al., 1987), and has little correspondence with, for example, sound quality measures (Gabrielsson et al., 1988). In fact, tests of aided speech intelligibility are in general measured at a comfortable sound level, approximately 60–70 dB hearing level (HL) (Elberling, 1999), specifically to ensure adequate audibility. Thus, presentation levels are nowhere near the lower level of audibility nor beyond the upper end of the comfortable loudness range where loudness discomfort may occur, which happens at approximately 20–40 and 90–110 dB HL respectively (Elberling, 1999). This, in turn, means that the HA gain can be considerably off target without any noticeable effect on SIN performance and indicates that aided SIN performance tests lack the necessary sensitivity to detect under- and overamplification.
Another common way to evaluate a patient's actual hearing is by self-report measures. However, the evidence suggests no clear correlation between self-report measures and behavioral measures for HA users (Stenbäck et al., 2022), indicating that the self-reported measurements are influenced by other parameters than the actual hearing performance, such as tinnitus, motivation, and so on (Houmoller et al., 2022). This suggests that also self-report measures may lack sensitivity toward under- or overamplification. Additionally, self-report measures seldom cover the audibility of low-level sounds, or the discomfort associated with loud speech (Cox & Alexander, 1995, 2002; Noble et al., 2013). Consequently, clinicians have to subjectively address these aspects, with varying success depending on the patient's reporting accuracy.
Taking all of this into account, there is a need for behavioral tests specifically designed to examine aided hearing at the lower and upper ends of the range of everyday-life sound levels, for the purpose of identifying potential issues caused by either under- or overamplification. This area has been explored in previous studies (Cox et al., 2007; Keidser et al., 2010; Mackersie, 2007; Mueller & Bentler, 2005), with attempts made to quantify and address the need for hearing at low levels and tolerance of sounds at high levels. For instance, Cox et al. (2007) assessed the audibility of low-level sounds by measuring aided sound field thresholds for warble tones. Similarly, Formby et al. (2017) used tone stimuli to assess participants’ perception level of “soft and loud, but okay” sounds. Other approaches have directly targeted participants’ perceived hearing with HAs. For example, Mackersie (2007) utilized real-ear saturation responses during a 90 dB sound pressure level (SPL) pure-tone sweep. If participants experienced loudness discomfort during this sweep, the HA's maximum output was reduced. Mueller and Bentler (2005) followed a similar procedure, using speech and noise stimuli at 85 dB SPL as the target for the “loud, but okay” judgment. As evidenced by the literature, there is currently no general consensus on how to achieve this balance. Consequently, full assessments often require multiple technical setups, various test materials, and elaborate procedures, making implementation into clinical practice challenging. Nonetheless, the importance of attaining a balance between audibility and comfort is emphasized in audiological assessment guidelines for HA fitting (Benson & Messersmith, 2022).
Here, we propose two new test protocols derived from the HINT, aiming specifically at testing aided hearing at the lower and upper ends of the range of everyday-life sound levels, respectively. It was decided to base the two tests on speech sounds, as previous research shows that these are the most important sounds to HA users (Skagerstrand et al., 2014). These tests may further add to the general trend toward more ecologically valid clinical tests, characterized as tests that closely reflect the real-life hearing-related functions (Keidser et al., 2020), for assessing the impact of HAs and their different settings (Keidser, 2016). The lower-end test is denoted HINT-L and is essentially a traditional test of speech reception threshold (SRT) (ASHA, 1979), using sentences instead of spondees. The HINT-L uses the HINT target sentences presented in quiet and adaptively varies the presentation level of the target sentences to obtain the threshold for 50% of sentences correctly repeated. Thus, prescribed amplification will be directly reflected in the HINT-L result. The upper-end test is denoted HINT-U and is a loudness category-matching test where the presentation level of HINT sentences corresponding to “Uncomfortably loud” is determined. Again, prescribed amplification will be directly reflected in the HINT-U result.
This paper describes the implementation of the HINT-L and HINT-U and presents results of experiments carried out with HA users to determine the respective (within-visit) test–retest reliabilities. As a baseline, results from a standard HINT (with a masker configuration reflecting a real-life scenario; Zaar et al., 2024) are also included. The assessment of test–retest reliabilities involves analyzing correlation coefficients and within-subject standard deviations (SDs). The face validities of the HINT-L and HINT-U are high, since the measures directly reflect what they are intended to measure (Nunnally & Bernstein, 1994), thus the validity of these tests will not be further investigated.
Materials and Methods
Participants
Thirty adult HA users from Odense University Hospital (OUH) participated in the study (18 males, 12 females, age 49–84 years, mean age 71 years, and SD of 9 years). The pure-tone audiograms of the participants are summarized in Figure 1. To ensure participant familiarity with their HAs and minimize potential effects of acclimatization to new sounds on test–retest results, all participants had a minimum of 3-month experience with their HAs. Additionally, participants had a valid audiogram (defined as a maximum of 1 year old), which their current HA fitting was based upon, a sensorineural hearing loss with hearing thresholds exceeding 20 dB HL at two or more octave frequencies in the frequency range of 0.5–4 kHz, a symmetric hearing loss with a maximum pure-tone average (PTA) (mean of 0.5-1-2-4 kHz) difference between the ears of 15 dB, and were Danish native speakers. Participants were excluded if they had air-conduction thresholds exceeding 90 dB HL at two or more frequencies or a condition with fluctuating hearing loss, for example, Menières disease, or if they were under treatment with ototoxic drugs.
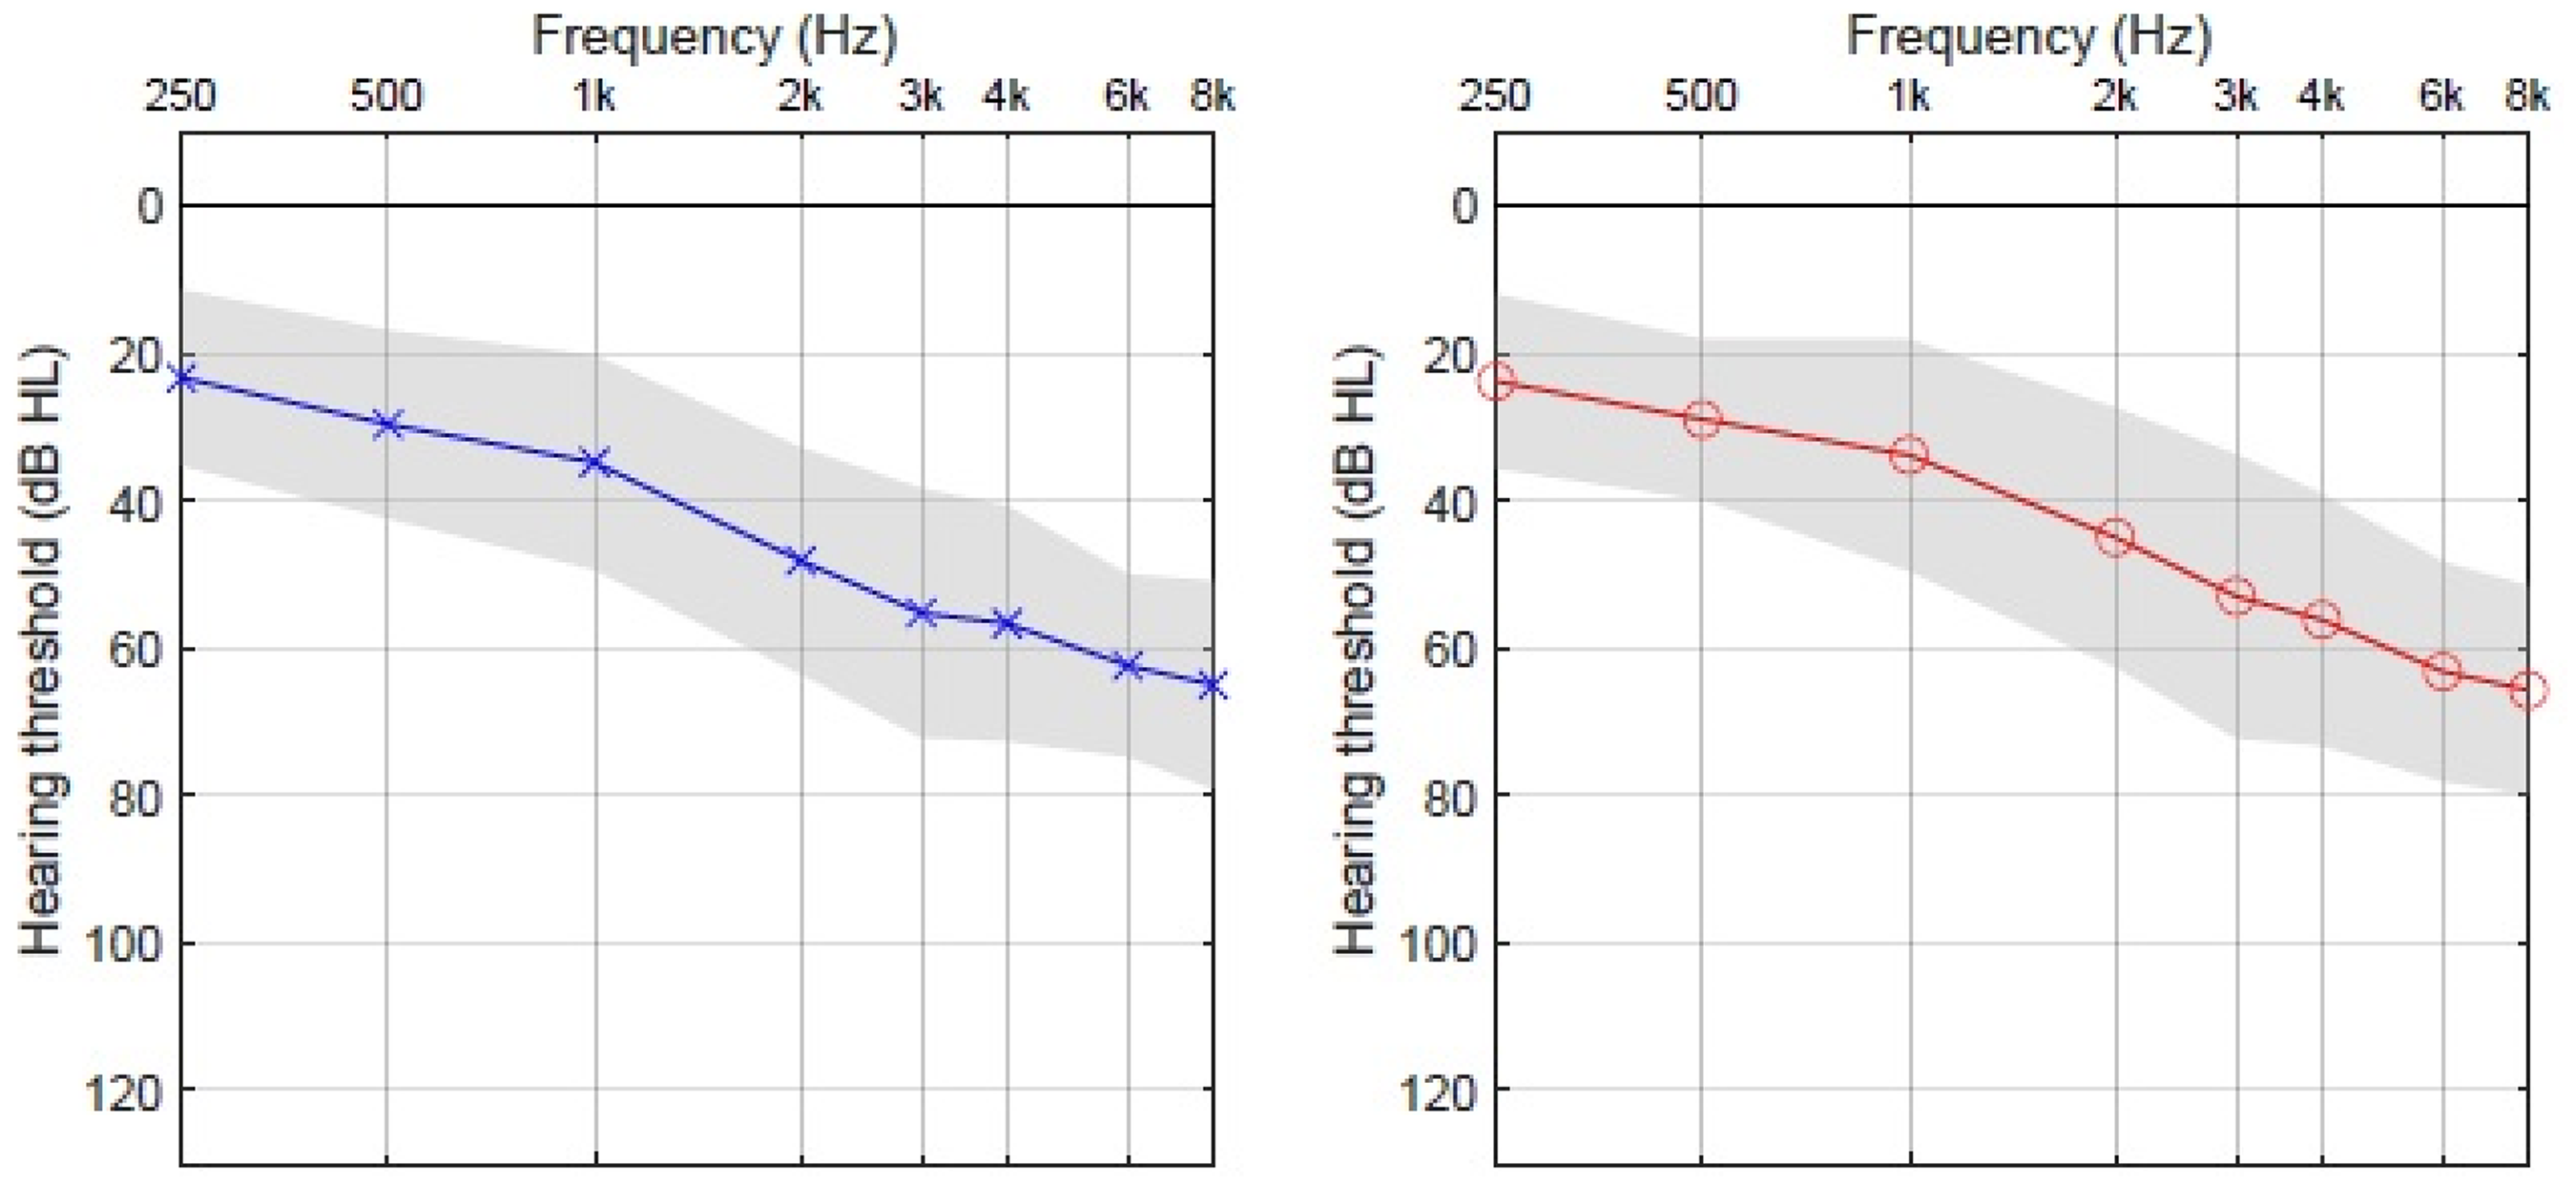
Mean audiogram of the 30 participants in the study. The gray area represents 1 standard deviation (SD) from the mean.
Testing Environments
The tests were conducted in an anechoic chamber at OUH. To increase comparability with real-life situations of the test surroundings, a hard floor was installed, and the walls were decorated with pictures in glass frames and wooden panels so that the acoustics of the room to a greater extent reflected everyday surroundings with some amount of reverberation. The door was open to the front room where the experimenter was seated. Despite modifications to the room acoustics, the reverberation time remained relatively low with a maximum of 40 ms across frequency. Ambient noise in the room was measured with a calibrated Brüel & Kjær Type 4132 1” condenser microphone with a Type 2617 preamplifier connected to a Type 2636 Measuring Amplifier (HBK, Nærum, Denmark). The output of the measuring amplifier was finally routed to an RME Fireface UC soundcard (RME, Haimhausen, Germany), which recorded minute-long sections of the background noise, and so on via bespoke Matlab software (MathWorks, Natick, Massachusetts). The measured long-term average noise level was 30 dB SPL C-weighted, but dominated by low frequencies as evidenced by the (lower) 25 dB SPL A-weighted noise level. An additional measurement of the noise floor (with blocked microphone) suggests that the ambient noise was below the measurement noise floor at frequencies above about 2 kHz. Altogether, these measurements (graph not included) show that even for the lowest presentation levels reported below, stimuli were above the ambient noise in the test room.
Equipment
The stimuli were presented via an RME Fireface UC soundcard (RME, Haimhausen, Germany) and five Genelec 8020 D active loudspeakers (Genelec, Idensalmi, Finland). The loudspeakers were placed at the ear level in a circle with a radius of approximately 1.3 m around the participant in the middle at 0° (speaker 1), 330° (speaker 2), 30° (speaker 3), 215° (speaker 4), and 145° (speaker 5), as shown in Figure 2. The soundcard was connected to a Lenovo ThinkCentre stationary PC (Lenovo, Hong Kong, China) running on Windows 10, which was used to run the test software. The tests were realized by adapting the settings of the HINT App (Interacoustics, Middelfart, Denmark); details are given below. Participants gave verbal feedback to the experimenter through a TG-300 tour guide system (Linkx, Kaohsiung City, Taiwan).

Loudspeaker setup used for the experiments. In HINT, target was presented from 1 and noise from 2 and 3. In HINT-L, target was presented from 1. In HINT-U, target was presented from 1, 2, and 3 and noise from 4 and 5. HINT = hearing in noise test; HINT-L = lower-end test hearing in noise test; HINT-U = upper-end test hearing in noise test.
Procedure
Participants were enrolled in the study directly after a scheduled appointment at the Department of Audiology at OUH. After enrolment, participants were guided to the designated test room, where they were given oral and written information about the study, whereafter they signed a written consent form. Participants were asked about their sex, age, experience with HAs, and tinnitus status.
The participants were then seated in the middle of the loudspeaker arrangement wearing their own HAs, instructed to keep their head in a static position, and not to adjust the volume or change the program settings of their HAs during the test. Participants were presented with the full test battery followed by a 5-min break whereafter the test battery was repeated for the retest. The test battery consisted of the HINT, HINT-L, and HINT-U and was carried out in the listed order. All data were manually transferred to the study's online database by the experimenter.
Test Material and Instructions
The sentence material from the Danish version of the HINT (Nielsen & Dau, 2011) was used as target material for the three test protocols. The sentence material consists of 10 test lists and three practice lists each containing 20 everyday sentences of five words. As the original HINT sentences were adjusted in level by up to ±4 dB to equalize sentence intelligibility (Nielsen & Dau, 2011), a special version of the HINT corpus was created, which is more suitable for assessing loudness. This special version was used for the HINT-U, where sentence intelligibility was not a concern, while achieving equal loudness across sentences was desirable. This was accomplished by equalizing the root-mean-squared (RMS) sentence levels for the HINT-U test. The RMS values were computed unweighted and included any spurious DC components. It was subsequently verified that removing the DC component only changed equalization gains by less than 0.001 dB.
The HINT
The HINT was conducted in a setup reflecting a real-life scenario, as suggested by Rønne et al. (2017) and Zaar et al. (2024). The HINT measured an aided speech reception threshold in a speech-on-speech condition with spatially separated single-talker maskers (SRT N , with the index N indicating the threshold found in noise). The HINT target sentences were presented at a fixed target level of 65 dB SPL, while the masker level was varied adaptively, starting from 58 dB SPL for the two maskers combined. Target sentences were delivered through loudspeaker 1, and the masking talkers were presented from loudspeakers 2 and 3 (in the frontal hemisphere). Each masking stimulus consisted of running male speech mixed with speech-shaped noise 6 dB lower in level. The participants received oral instructions before the start of the test and were asked to verbally repeat as many of the target-sentence words as possible. Participants were encouraged to guess, if necessary, when repeating the presented sentences. The repeated sentences were manually scored by an audiologist (the first author). Instead of following the standard HINT scoring protocol (Nielsen & Dau, 2011) (whole sentence correct or not), sentences were scored as correct if three or more individual words were correct. In this way, the adaptive procedure was tracking the threshold for at least three out of five words correct, rather than the intended threshold for fully correct sentences. Apart from this adjustment, the determination of SRT N followed the standard HINT rules. Each participant was presented with two concatenated test lists (i.e., 40 sentences) in both the test and retest. Prior to the test runs, two training runs were conducted, using the three designated training lists 11, 12, and 13. After the first, with 20 sentences, the participant could ask any questions and if necessary additional instructions were provided. Next, a full training run with 40 sentences was conducted. Previous experience (Rønne et al., 2017) indicates that after 60 sentences of training, performance has reached a stable plateau. Test lists 1 and 2 were used for the test across all participants and similarly, lists 6 and 7 were used for the retest. In this way, we deliberately chose to accept a possible mean test–retest difference (test-list bias) to avoid inflating the test–retest variance with a contribution from test-list balancing across participants.
The HINT-L
The variant targeting the lower end of daily-life sound levels measured an aided SRT in quiet (without the index N indicating the threshold found without noise) with target speech presented at low levels starting at 20 dB SPL without background noise. Before starting the test–retest experiments, we conducted extensive piloting of the HINT-L. Through this process, we determined that initiating the test at the low level of 20 dB SPL (which no participants could hear) resulted in an efficient test flow and consistent results. The target level was adapted according to whether the previous sentence was repeated correctly or not. Stimuli were delivered through speaker 1 in front. The participant was asked to follow the same instructions as in the HINT, the repeated sentences underwent the same scoring process, and the SRT was determined using the same methodology as described above. Likewise, as in the HINT, each participant was tested using two concatenated test lists (40 sentences) in both the test and retest. Test lists 3 and 4 were used for the test and lists 8 and 9 were used for the retest, again giving preference to a clean estimate of test–retest variance at the cost of a potential test–retest bias due to a list effect.
The HINT-U
In the variant targeting the upper level of amplification, the HINT framework was used in an adaptive loudness category-matching fashion. The aim was to estimate the target speech level in dB SPL for a loudness rating of uncomfortably loud. This involved varying the target speech level starting at 87 dB SPL with a constant fixed background noise level at 63 dB SPL. Similar to the preparation of the HINT-L variant, extensive piloting of the HINT-U was conducted before starting the test–retest experiments. During this process, no participants reported discomfort before reaching 90 dB SPL and therefore 87 dB SPL was chosen as the starting level. This decision aimed to minimize the duration of exposure to loud sound levels, thereby reducing potential discomfort for the participants throughout the test. Based on the piloting, we also recognized the utility of introducing constant background noise. This was done to provide participants with a reference sound level and mitigate the risk of habituation to progressively higher levels, which might otherwise result in artificially elevated thresholds for uncomfortably loud sound levels. The introduction of background noise led to greater consistency in identifying the uncomfortably loud SPLs. The level for the background noise was set at 63 dB SPL, resembling the level of speech in a typical conversation. This decision aimed to make the test more comparable to real-life situations where participants find themselves in social contexts. The background noise consisted of the same spatially separated single-talker maskers as in the HINT, albeit presented from the rear-hemisphere loudspeakers 4 and 5. The target speech was delivered through loudspeakers 1, 2, and 3; all three front loudspeakers were used to generate sufficiently high levels. This was necessary as the maximum distortion-free output of a single Genelec 8020 D active loudspeaker is 107 dB. By combining all three speakers, we could achieve an upper limit of distortion-free loudspeaker reproduction at 115 dB SPL. The target speech level was adjusted via the same software as used for the HINT, with an uncomfortably loud answer scored as “correct” resulting in a decrease in level and vice versa. The test run was terminated, when a participant had indicated three out of five identical presentation levels as uncomfortably loud. Before the test started, the participants received both written and oral instructions, including a page which displayed seven different categories of loudness (Elberling, 1999) (see Appendix 1). The experimenter introduced the loudness scale and read the instructions over with the participant in a low-key tutorial fashion and used gestures and repetition if it was deemed necessary. The instruction emphasized that the participant should not pressure themself into something uncomfortable to receive as high a threshold as possible, but instead indicate uncomfortably loud as soon as the sound level began to become uncomfortable. The instructions were inspired by the instructions used by Cox et al. (1997) in the contour test of loudness perception. Test list 5 was used for the test and list 10 was used for the retest, both taken from the RMS-equalized version of the HINT corpus mentioned above.
Statistical Approach
The statistical analyses were conducted using STATA 17 IC-15 (Stata Corp LLC, Texas, USA).
The statistical analysis consisted of a visual inspection of Bland–Altman (BA) plots to assess the differences between the test and retest results (Altman & Bland, 1983), calculations of means and SDs of differences, Shapiro–Wilk normality tests to determine whether to use a parametric or nonparametric test to investigate the difference between test and retest, paired t-tests (p > .05), and a Wilcoxon signed-rank test. Cohen's d (Téllez et al., 2015) was used to assess the difference between the test and retest results. Furthermore, the within-subject SDs (Bland & Altman, 1996) were calculated for both the HINT and the two HINT variants, as well as Pearson correlation coefficients between the test and retest results to determine the test–retest reliabilities.
Data Management
Data were stored using the Research Electronic Data Capture (REDCap) tool (Harris et al., 2009) supplied by Odense Patient data Explorative Network (OPEN). The research project was registered at OUH, Region of Southern Denmark (20/50524), as part of the UAud project.
Results
The mean result for the HINT was −1.1 dB SNR (signal-to-noise ratio) with an SD of 3.4 dB at test and −1.6 dB SNR with an SD of 3.3 dB at retest. For the HINT-L, the mean result was 38.6 dB SPL with an SD of 7.1 dB at test and 37.5 dB SPL with an SD of 7.0 dB at retest. In the case of the HINT-U, the median was 96.8 dB SPL with an interquartile range (IQR) of 89.8–102.5 dB SPL at test and 95.0 dB SPL with an IQR of 87.8–100.4 dB SPL at retest. To further explore the results, relationships between the three HINT variants (means of test and retest) and the better-ear PTA are plotted in Figure 3, with correlation coefficients and corresponding p-values displayed in each panel. This figure shows that HINT SRT N and HINT-L SRT significantly increase with PTA, while no relationship between HINT-U and PTA is observed.
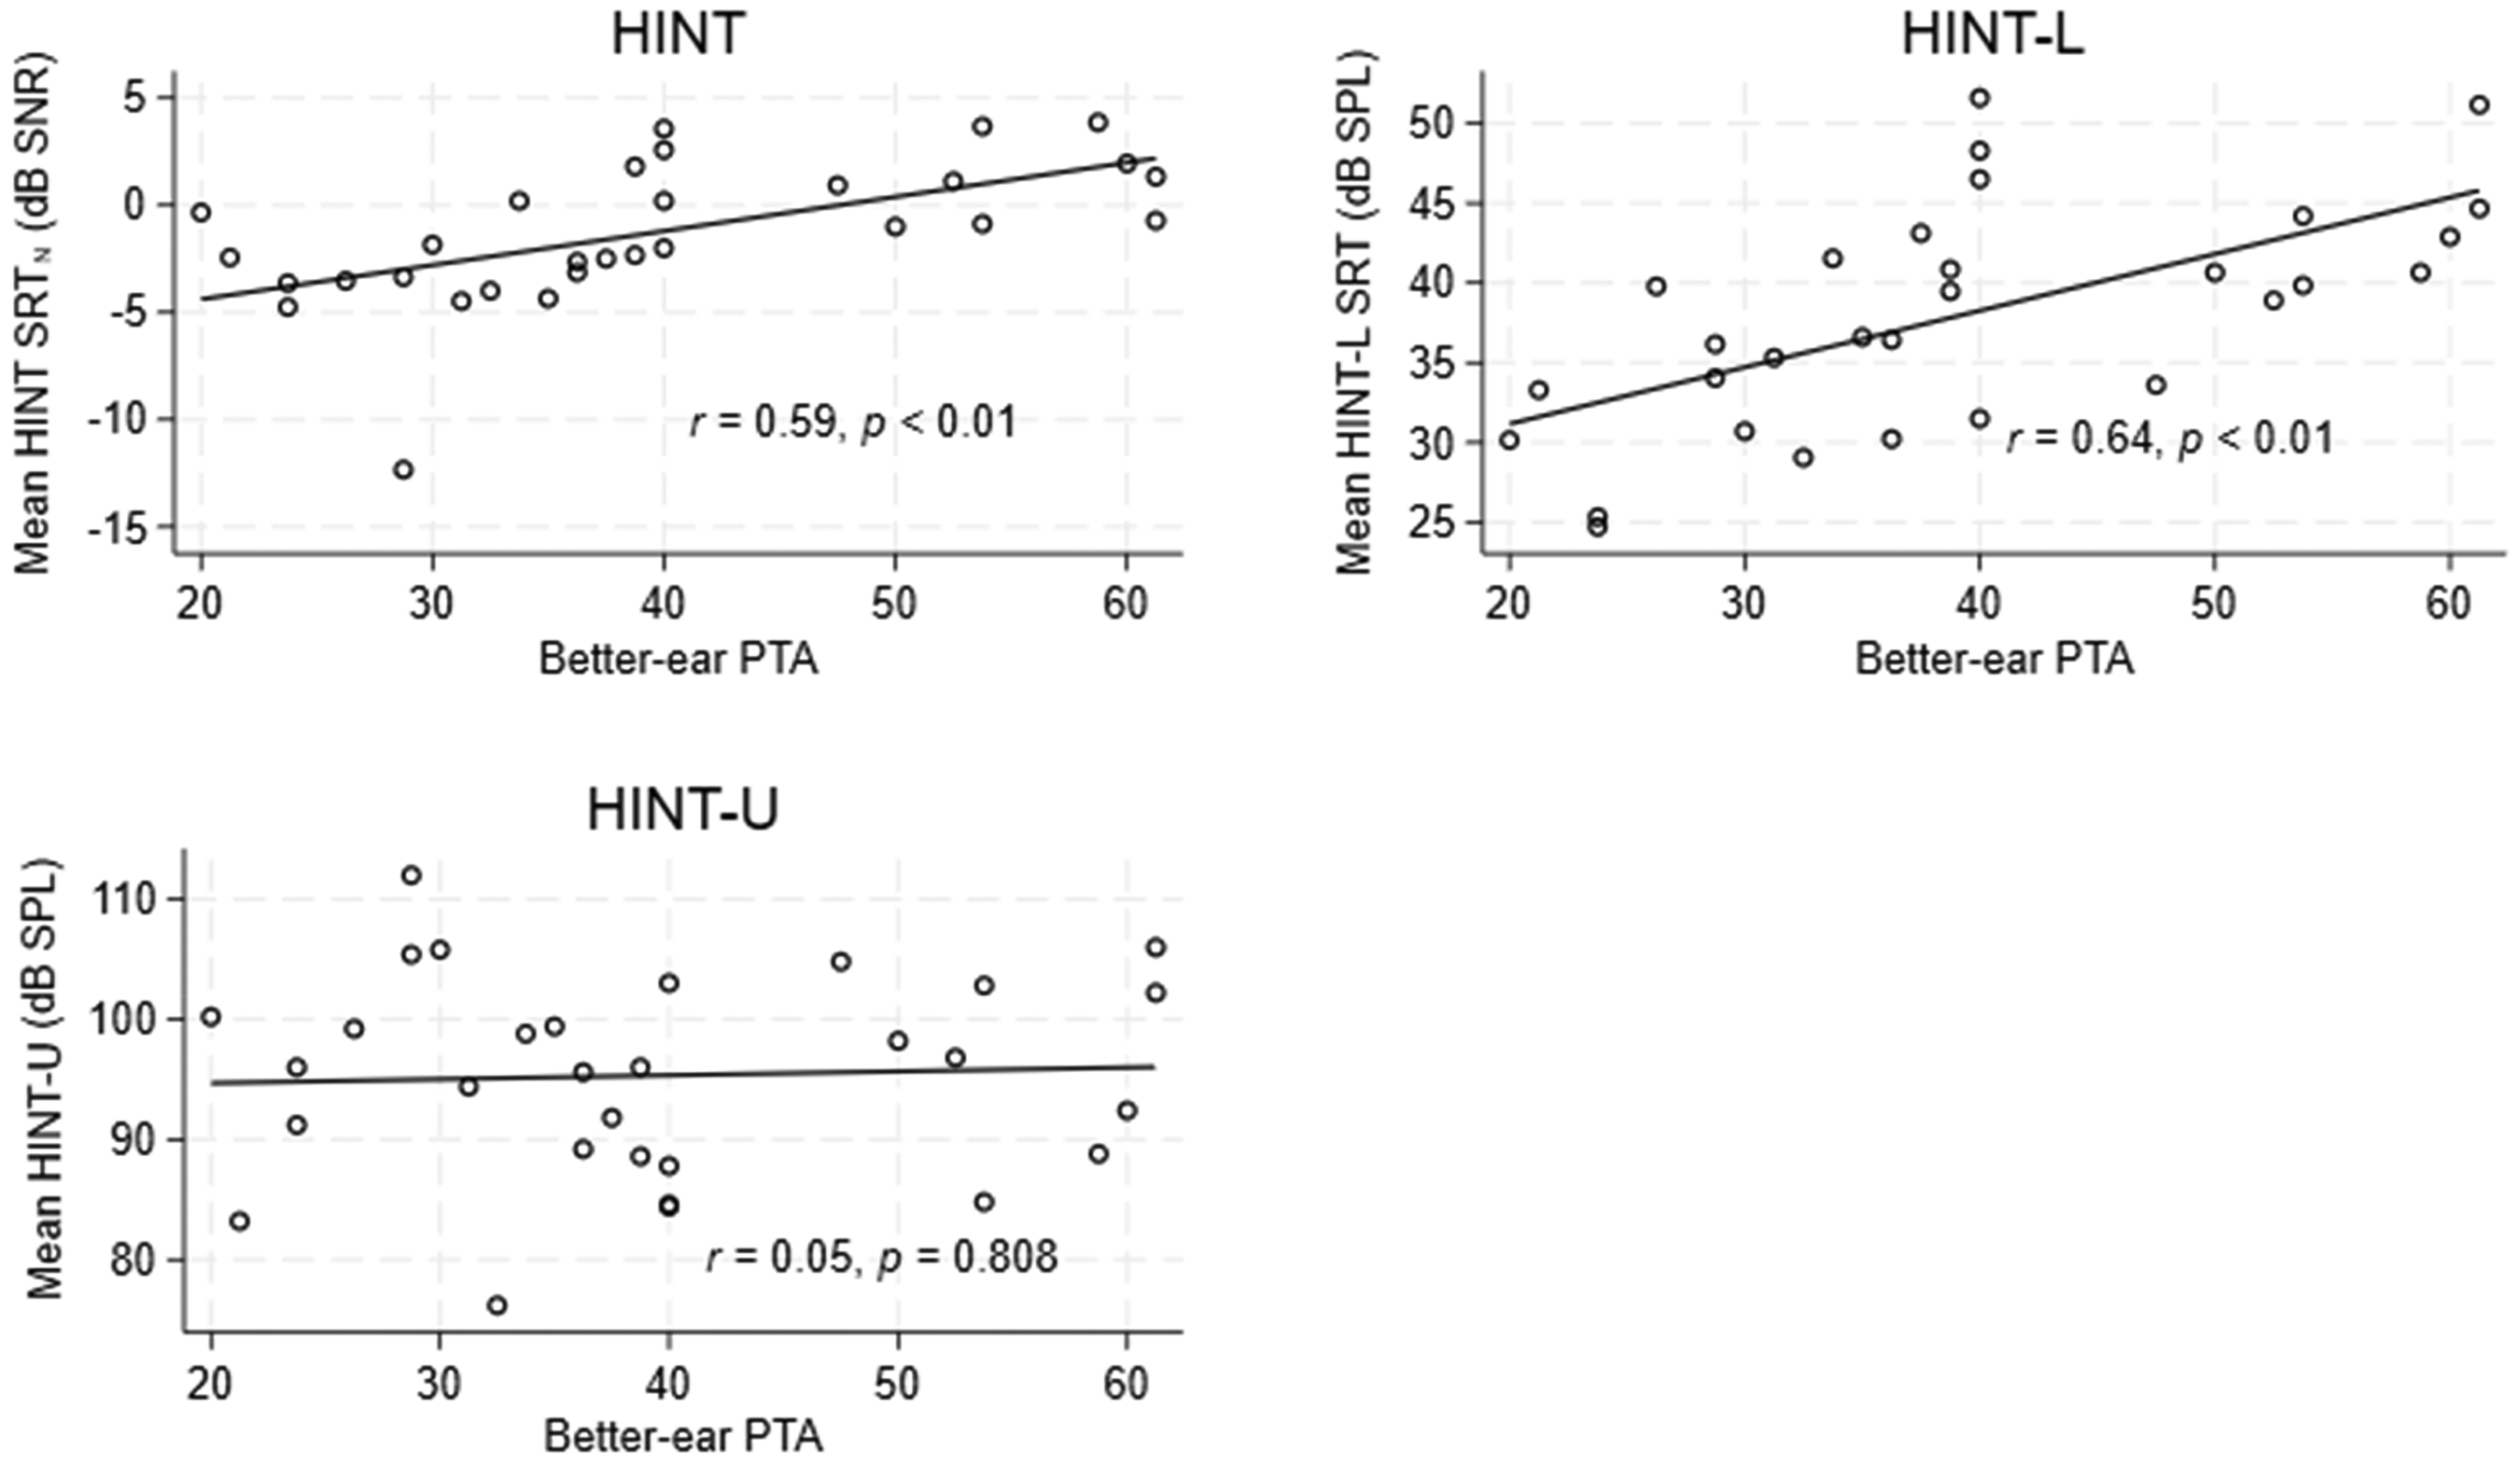
Relationships between the three HINT variants (mean of test and retest scores) and better-ear PTA (mean of 0.5-1-2-4 kHz). HINT = hearing in noise test; PTA = pure-tone average.
Turning to the test–retest properties, the BA plots in Figure 4 show the differences between test and retest scores (retest minus test) against the mean score for the HINT, HINT-L, and HINT-U. As can be seen, the test–retest difference is independent of the mean for both the HINT and the two HINT variants. The BA plots also show that the mean difference between test and retest is below zero for both the HINT and the two HINT variants. Paired t-tests revealed that the mean test–retest difference was significantly different from zero for the HINT, t(29) = 2.53, p = .017, and for the HINT-L, t(29) = 4.70, p < .001. Likewise, a Wilcoxon signed-rank test showed that the median test–retest difference was significantly different from zero for the HINT-U (Z = 3.475, p < .001). However, a calculation of Cohen's d showed that the effect sizes for the differences between test and retest were either equal to or less than 0.2 for both the HINT and the two HINT variants, and they are therefore considered very small effects at most.

Bland–Altman plots of the difference between test and retest scores against the mean score for each of the three HINT variants: HINT, HINT-L, and HINT-U. The plots include all data points, including outliers. HINT = hearing in noise test; HINT-L = lower-end test hearing in noise test; HINT-U = upper-end test hearing in noise test.
Means and SDs of the differences between test and retest results across participants for the HINT, HINT-L, and HINT-U are shown in Table 1. The means of differences between test and retest fell between −0.5 and −1.8 dB, with the biggest difference found in the HINT-U and the smallest difference found in the HINT. The SDs of differences ranged between 1.1 and 3.0 dB, with the highest variance found for the HINT-U and the lowest variance found for the HINT. The BA plots also reveal four potential outliers across the three tests, defined as a test–retest difference deviating more than 2 SDs from the mean. When the potential outliers were removed from the means and SDs calculations, the means of differences between test and retest fell between −0.6 and −1.9 dB (Table 1), again with the biggest difference found for the HINT-U and the smallest difference found for the HINT. The SDs of differences ranged between 0.9 and 2.0, with the highest variance again found in the HINT-U and the lowest variance found in the HINT. The removal of outliers made the difference between test and retest normally distributed for the HINT-U but had no influence other than that. Removal of the four outliers had no impact on the level of significance or the effect size of the difference between test and retest results for either the HINT or the two HINT variants.
Means and SDs of SRT Differences Between Test and Retest for All Data and with Potential Outliers Omitted.

Note. For the differences, test was subtrahend.
SD = standard deviation; SRT = speech reception threshold; HINT = hearing in noise test; HINT-L = lower-end test hearing in noise test; HINT-U = upper-end test hearing in noise test.
To assess repeatability and quantify the individual measurement error for each variant, within-subject SDs were calculated as the square root of half the square of the differences as recommended by Bland and Altman (1996). The within-subject SDs were determined to be 0.8 dB for HINT, 0.9 dB for HINT-L, and 2.2 dB for HINT-U.
Lastly, the Pearson correlation coefficients were computed to assess the relationship between test and retest for the HINT, HINT-U, and HINT-L (Table 2). The results show that both the HINT and the two HINT variants had a significant and strong correlation between test and retest with, r(29) = .948, p < .001, for the HINT, r(29) = .983, p < .001, for the HINT-L, and r(29) = .942, p < .001, for the HINT-U. Further analyses showed a significant correlation between the HINT and the HINT-L at both test and retest ranging between, r(29) = .492, p < .006, and r(29) = .501, p < .005. The HINT-U was not significantly correlated with either the HINT or HINT-L.
Pearson Correlation Coefficients Between the SRTs Measured at Test and Retest for the HINT, HINT-L, and HINT-U (n = 30).
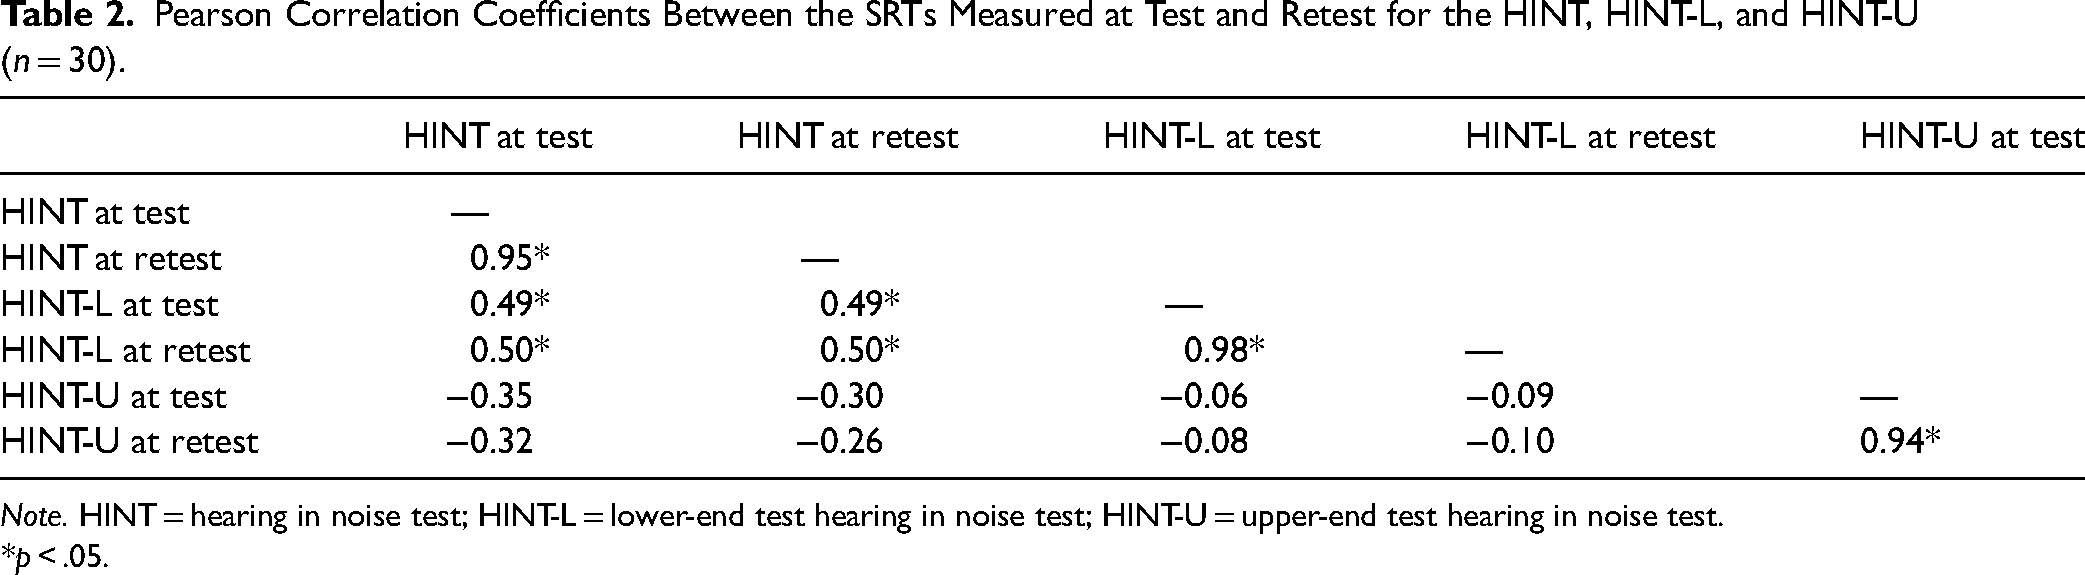
Note. HINT = hearing in noise test; HINT-L = lower-end test hearing in noise test; HINT-U = upper-end test hearing in noise test.
*p < .05.
Discussion
In this study, we proposed, designed, and collected test and retest results from two new HINT variants, the HINT-L and HINT-U, aiming to quantify aided hearing at low- and high-input levels. Additionally, results from a standard HINT were included as a baseline. Overall, the analysis of the test–retest data demonstrates that both the HINT-L and HINT-U have high test–retest reliability. The HINT-L reliability is on par with that of the standard HINT, whereas the HINT-U within-subject SD is about twice as large indicating a less reliable test. However, both the HINT-L and HINT-U appear to provide consistent results.
The results from the three HINT variants showed interesting trends, even though the participants were using their own HAs of various brands and models, and compensation for hearing loss therefore was not standardized across participants but represented standard care at OUH. There was a statistically significant moderate positive correlation between the HINT SRT N and the better-ear PTA, while PTA was far from explaining all SRT N variance. This is in agreement with recent findings from, for example, Zaar et al. (2024) who found PTA to be a significant predictor of HINT SRT N measured in a very similar setup, while more variance was explained by suprathreshold spectrotemporal modulation detection thresholds. Also, the HINT-L SRT showed a statistically significant moderate positive correlation with better-ear PTA. This is in line with the notion that hearing loss at low-input levels is compensated approximately according to a half-gain rule, which means that the higher the PTA, the higher the expected aided threshold of hearing and consequently the higher the HINT-L SRT. HINT-U results showed no correlation with better-ear PTA, which indicates that at high-input levels, participants were on average equally well fitted in terms of gain, irrespective of degree of hearing loss. However, HINT-U results showed considerable variability—covering more than a 30-dB range, which suggests substantial differences in individual uncomfortable loudness (UCL) level. These observations are corroborated by the within-HINT-variant correlations reported in Table 2, which show a moderate relationship (r ≈ .5) between HINT and HINT-L, and essentially no relationship between HINT-U and the other measures, suggesting that the loudness-based HINT-U indeed, and as intended, taps into another outcome domain than the speech-recognition-based HINT and HINT-L tests. Finally, the findings are consistent with results from Gabrielsson et al. (1988) and van Dijkhuizen et al. (1987), who found that the detection of low-level sounds and tolerance toward high-level sounds do not share the same underlying abilities.
Test–Retest Properties
Small yet significant differences (biases) were found between test and retest for each HINT variant. Thus, there was a slight mean difference in HINT SRT N , HINT-L SRT, and HINT-U SPL from test to retest: −0.5, −1.1, and −1.8 dB, respectively. As mentioned in the “Materials and Methods” section, part of this observed bias in the standard HINT results can be attributed to a list effect, which refers to a systematic difference in SRTs between different test lists, even if the colocated steady-state noise masking condition used by Nielsen and Dau (2011) is different from the one used here. Thus, data from Nielsen and Dau (2011) allow estimating a list effect of −0.15 dB between lists 1 and 2 (mean SRT N : 0.1 dB) and lists 6 and 7 (mean SRT N : −0.05 dB), which were used here for the HINT condition. Assuming a similar test-list effect applies to the SRT-in-quiet HINT-L results, a list effect of −0.45 dB was estimated between lists 3 and 4 (mean SRT N : 0.1 dB) and lists 8 and 9 (mean SRT N : −0.35 dB). A list effect for the HINT-U test cannot be estimated in a similar fashion, as the RMS-equalized version of the speech material was used for this variant. The remaining bias, still indicating a decrease (better performance at retest) in HINT SRT N and HINT-L SRT, can probably be attributed to a residual learning effect, despite the use of training runs. For HINT-U, the reduction in threshold SPL from test to retest suggests that the participants’ tolerance to loud sounds decreased with repeated exposure to the test, possibly due to fatigue from the continued exposure to loud sounds. In any case, it is important to note that the observed biases between test and retest were small, both from a clinical perspective and as evaluated by the calculated Cohen's d effect size. Specific to the HINT test–retest bias, this can be further substantiated by results from McShefferty et al. (2015) who found a just-noticeable difference in speech-to-noise ratio of 3 dB, that is, substantially above the test–retest bias observed here.
The within-subject SDs obtained for HINT and HINT-L in this study are on par with, or even better than, previous HINT test–retest measurements, for example, Nielsen and Dau (2011) and Laugesen et al. (2013). This supports the capability of the novel HINT-L test to deliver reliable outcomes. Considering the most relevant differences that the HINT-L aims to capture further corroborates that. One such difference relates to changes in aided sound level caused by an inaccurately measured audiogram. Due to the step size used in clinical hearing-threshold testing, the smallest possible measurement error in an audiogram is 5 dB. Again, since HAs are commonly fitted using approximate half-gain rules, this audiogram error would translate to a gain error of about 2.5 dB, assuming that the HTLs are mismeasured by the same 5 dB across all frequencies. Accordingly, for the test to measure the smallest possible difference resulting from a mismeasured hearing threshold, the measurement uncertainty must be less than 2.5 dB. From the 0.9-dB within-subject SD of the HINT-L, it is clear that the test can detect variations of the required magnitude. The within-subject SD of the HINT-U was notably larger than those of the HINT and HINT-L. This disparity may be attributed to several factors. First, the HINT-U test differs significantly from the HINT and HINT-L, in terms of test procedure and scoring methodology. Thus, the HINT-U test procedure relies on notoriously variable loudness assessment (Elberling, 1999), and adding to this, there was no specific training included for the HINT-U. The scoring method, where the test run was concluded after three identical SPL turning points, favored shorter test durations to reduce participant exposure to uncomfortably loud sounds. This may have contributed to higher test–retest variability compared to the richer data defining thresholds for HINT and HINT-L. However, despite the larger measurement uncertainty, it is important to mention that the within-subject SD of the HINT-U still falls within the range capable of detecting the above-mentioned minimum relevant difference of 2.5 dB. This indicates that despite the increased variability, the HINT-U remains sensitive enough to discern meaningful changes in aided sound level.
As a final note on test–retest properties, the excellent reliabilities of all three test variants are confirmed by the test–retest correlations of 0.95, 0.98, and 0.94, reported in Table 2 for the HINT, HINT-L, and HINT-U, respectively.
Limitations
Due to miscommunication, a three-out-of-five words-correct adaptive rule was used here for the HINT and HINT-L instead of the intended sentence-correct adaptive rule (Rønne et al., 2017). According to Rønne et al. (2017), the sentence-correct adaptive rule tracks the 77% point on the words-correct psychometric function, whereas the three-out-of-five words correct adaptive rule probably tracks a point between 50% and 60% on the words-correct psychometric function. Assuming a psychometric-function slope of 15% point/dB at a speech recognition score of 50%, this amounts to an offset of about 1.1–1.8 dB in the direction of lower SRTs with the three-out-of-five rule. However, for the purpose of the present study, the eventual effect on the estimated test–retest reliability is of more importance. The psychometric function is steeper at the 50% point than at the 77% point, which means that small shifts in SNR around the 50% point could lead to larger changes in speech recognition scores. This suggests that the present study might slightly underestimate the test–retest variability, as smaller variations in SNR are required to change the recognition score at the 50% point compared to at the 77% point. In contrast, the present unorthodox three-out-of-five words correct adaptive rule used with the HINT corpus could cause test–retest variability to be slightly overestimated, as this rule likely tracks a lower point on the psychometric function compared to the sentence-correct rule. Together, this suggests negligible effect of the scoring-rule mishap on the estimated test–retest variability. As a final note, the experience from the HINT scoring in the experiments described above was that most of the responses were either 0 or 5 words correct, meaning that the three-out-of-five words correct rule would anyway approach the sentence-correct rule. Although the ideal course of action would have been to repeat the measurements with the correct scoring rule, constraints on both time and participant availability made new measurements intractable. Considering the relatively minor expected effect discussed above, the original results were deemed acceptable.
Our testing room was located in a separate section of the clinic, resulting in a relatively consistent ambient noise level throughout the day. Thus, we lack experience of how significant fluctuations in ambient noise might impact the test results. Direct effects on HINT-L results and effects on participant concentration in the HINT from louder background noise may be expected. Therefore, for clinical use, strict limits on background noise levels should be enforced.
Furthermore, future work using these tests could incorporate randomized test-list assignments to determine test–retest reliability for situations where testers randomly or intentionally use different lists across participants.
Outlook
A major component of a HA fitting is to achieve an optimal balance between audibility and comfort. Here, audibility was evaluated through the HINT-L variant, while comfort was evaluated through the HINT-U variant. An optimal fitting can be characterized by achieving as low an SRT N in the HINT as possible, indicating optimal SIN performance, while maintaining a good balance between the HINT-L SRT (soft-sound audibility) and the HINT-U SPL (listening comfort at high levels). As of now, the new test results can only be compared to general scales of loudness perception, for example, Elberling (1999), and normative data are needed before the variants can be standardized and used in clinics for the absolute evaluation of the individual patient's HA outcome. Therefore, further research focusing on specific subgroups of HA users is essential to understand how the outcomes of the new test variants are influenced by individual hearing preferences and challenges, such as a lowered UCL level, loudness summation, and speech intelligibility issues, beyond just HA fitting. Additionally, future studies could investigate whether the starting level impacts the reliability of the two test variants. If no significant impact is found, clinicians could adjust the starting level to better align with participants’ thresholds. This adjustment could reduce test time in the HINT-L and minimize discomfort in the HINT-U for individuals with high loudness sensitivity.
Despite the lack of normative data, the two new HINT variants show good reliability, as evidenced by the BA plots in Figure 4. In particular, it is encouraging that the test–retest deviations are evenly distributed across the plots. Thus, even if some individuals’ results were primarily driven by, for example, a low UCL level, this does not impact reliability. However, individual preferences and challenges such as suprathreshold loudness perception can be expected to affect absolute values at an individual level, while that these factors should largely be balanced out when examining results at a group level. Conversely, deliberate and consistent alterations in the HA gain prescription could have a more pronounced impact on results at the group level. Thus, the two new tests may be used for relative measurements, such as between-group comparisons in intervention studies. Specifically, these tests were developed for comparing groups in the UAud RCT (Pedersen et al., 2023), which uses an identical setup to that utilized in the current study. By comparing the distribution of the SRTs from HINT-L and the uncomfortably loud SPLs from the HINT-U, any tendency toward either under- or overamplification in the intervention group compared (HAs fitted from self-test audiograms) to the control group (HAs fitted from standard audiograms) will eventually be revealed.
Conclusion
This paper described the implementation of two novel variants of the HINT for quantifying HA amplification at the lower and upper ends of the range of everyday-life sound levels, termed the HINT-L and HINT-U. It further presents results of experiments carried out with HA users with the main purpose of determining the respective test–retest reliabilities. The results demonstrate that the two variants of HINT have strong test–retest reliabilities. This indicates that these new tests can provide consistent results. Future studies should focus on collecting normative data and investigate factors that may limit the generalizability of the test–retest results, which would ensure broader clinical applicability and allow for the variants to be used in the clinics for the evaluation of the individual patient's aided hearing and thus contribute to optimizing the patient's HA outcome.
Supplemental Material
sj-pdf-1-tia-10.1177_23312165251322299 - Supplemental material for Two Tests for Quantifying Aided Hearing at Low- and High-Input Levels
Supplemental material, sj-pdf-1-tia-10.1177_23312165251322299 for Two Tests for Quantifying Aided Hearing at Low- and High-Input Levels by Carl Pedersen, Jesper Hvass Schmidt, Ellen Raben Pedersen, Chris Bang Sørensen, and Søren Laugesen in Trends in Hearing
Footnotes
Acknowledgments
Parts of this study were presented in poster format at the International Symposium on Audiological and Auditory Research (ISAAR) 2023. We would like to thank René Gyldenlund Pedersen for his contributions to the initial conceptualization of the test variants. Furthermore, special thanks go to our colleagues at Odense University Hospital, who assisted with indispensable help in the recruiting of participants.
Declaration of Conflicting Interests
The authors declared no potential conflicts of interest with respect to the research, authorship, and/or publication of this article.
Ethical Approval
The project was evaluated by the Research Ethics Committee of Southern Denmark and judged not to need approval.
Funding
The authors disclosed receipt of the following financial support for the research, authorship, and/or publication of this article: The project was funded by Innovation Fund Denmark Grant no. 9090-00089B and the William Demant Foundation Grant No. 19-1251 as part of the UAud study (Sidiras et al., 2021).
Supplemental Material
Supplemental material for this paper is available online.
References
Supplementary Material
Please find the following supplemental material available below.
For Open Access articles published under a Creative Commons License, all supplemental material carries the same license as the article it is associated with.
For non-Open Access articles published, all supplemental material carries a non-exclusive license, and permission requests for re-use of supplemental material or any part of supplemental material shall be sent directly to the copyright owner as specified in the copyright notice associated with the article.