
Abstract
This study investigated the effects of noise and hearing impairment on conversational dynamics between pairs of young normal-hearing and older hearing-impaired interlocutors. Twelve pairs of normal-hearing and hearing-impaired individuals completed a spot-the-difference task in quiet and in three levels of multitalker babble. To achieve the rapid response timing of turn taking that has been observed in normal conversations, people must simultaneously comprehend incoming speech, plan a response, and predict when their partners will end their turn. In difficult conditions, we hypothesized that the timing of turn taking by both normal-hearing and hearing-impaired interlocutors would be delayed and more variable. We found that the timing of turn starts by talkers with hearing impairment had higher variability than those with normal hearing, and participants with both normal hearing and hearing impairment started turns later and with more variability in the presence of noise. Overall, in the presence of noise, talkers spoke louder and slower, increased the duration of their pauses but decreased their rate of occurrence, and produced longer interpausal units, that is, units of connected speech surrounded by silence. However, when compared to previous studies of conversations between normal-hearing partners, the pattern of changes in conversational behavior by the normal-hearing participants was very different in the most challenging noise condition. The extent to which these adaptations are made to reduce the difficulty experienced by their partner with hearing impairment vs. the difficulty they experience themselves is not clear.
Introduction
Traditionally, speech understanding and speech production have been investigated in isolation. In speech perception studies, a common task has been to ask participants to repeat back what they heard or provide a response or judgment after having listened to a stimulus. In speech production studies, talkers are often asked to read text aloud but to no apparent listener. However, real conversation is not just the sum of production and listening; it is an interaction between two or more participants who use dynamic feedback and adaptation to engage in this verbal dance. Thus, as suggested by Carlile and Keidser (2020), to appropriately test hearing abilities in a way that addresses the difficulties people with hearing impairment (HI) experience in everyday interactions, one has to measure performance using tasks that are similar to everyday interactions to ensure that similar neural activity is engaged. In the present study, we investigated conversational turn-taking between young normal-hearing (NH) and older HI interlocutors engaging in a Danish-translated version (DiapixDK, Sørensen, 2021) of the DiapixUK task (Baker & Hazan, 2011) in quiet and in multitalker babble noise conditions presented at three different levels: 60, 65, and 70 dBA-weighted sound pressure level (i.e., dBA SPL). We hypothesized that hearing loss and noise interference should increase listening difficulty, potentially reducing the resources available for speech planning and turn-end prediction. Furthermore, the effects of hearing loss and noise could reduce the saliency of cues used to predict the end of turns. Either cause would influence the distribution of the timing of turn starts. An increase in average delay would lead to a shift in the distribution and more variable response times would lead to a broader distribution. Below, we elaborate on these hypotheses.
Timing of Turn-Taking in Conversational Interaction
A key element of conversational interaction is the switching of turns between interlocutors (conversational partners). Figure 1 illustrates the basic conversational states between talkers in dialogue that is based on the nomenclature of Levinson and Torreira (2015). A switch in the conversational turn is termed a floor transfer, and we measure the floor-transfer offset (FTO) as the duration from when the first person stops talking to when the next person starts talking. We define interpausal units, or IPUs, as sequences of connected speech in which any included acoustic silences are < 180 ms. In Figure 1, there are two-floor transfers between IPUs from Talker A and Talker B: the first one occurs with an overlap between the talker's IPUs (overlap-between), and the next occurs with a gap between the IPUs of the two talkers. Both of these are examples of FTOs, where overlaps-between are negative FTOs and gaps are positive FTOs (for a justification of pooling overlaps-between and gaps, see Heldner & Edlund, 2010). Finally, we define pauses as joint periods of silence between talkers that are not followed by a floor transfer, and overlaps-within as joint speech during an IPU of one talker that does not result in a floor transfer.

Illustration of the classification of gaps, overlaps-within, overlaps-between, pauses, and interpausal units (IPUs) during conversations between two talkers: Talker A and Talker B. The nomenclature for this classification follows that of Levinson and Torreira (2015). There are two floor-transfer offsets (FTOs): the overlap-between (resulting in a negative FTO) and the gap (resulting in a positive FTO). We define an IPU as a unit of connected speech with a minimum duration of 70 ms surrounded by silence of at least 180 ms. A pause is an acoustic silence greater than 180 ms that is surrounded by IPUs from the same person and does not include a floor transfer. An overlap-within is a speech stream occurring completely within the other person's IPU that does not result in a floor transfer. The figure is adapted from Sørensen et al. (2021).
Investigations of the distributions of FTOs have shown that in dialogue, the average response time is slightly positive with a peak in the distribution occurring around 250 ms, and that both acoustic overlaps and gaps can occur during floor transfers (Aubanel et al., 2011; Brady, 1968; Heldner & Edlund, 2010; Levinson & Torreira, 2015; Norwine & Murphy, 1938; Stivers et al., 2009). In their model of conversational turn-taking, Levinson and Torreira (2015) outlined the following overlap between comprehension and production involved in initiating a turn while listening to the interlocutor's incoming turn (see Figure 3 by Levinson & Torreira, 2015, for their model). First, listeners need to receive enough information from their interlocutor's turn to understand the action required from them. As soon as they receive enough information, they start planning their turn (Barthel et al., 2016, 2017; Bögels, Magyari, et al., 2015; Gisladottir et al., 2015). Next, people start formulating their response while they continue to process the incoming turn. Simultaneously, they monitor their interlocutor's turn for possible syntactic, prosodic, or other cues that signify an upcoming turn end. Single-word preparation has been found to take at least 600 ms, while the preparation of multiword utterances takes over one second (Indefrey & Levelt, 2004; Magyari et al., 2014), so this process must take place at least 600 ms before launching a response. While still monitoring for turn-end cues, immediately before providing a response, people prepare their articulators and deliver their responses. Thus, given these latencies involved in taking a turn, the modal response time of approximately 250 ms should not be enough time to include response preparation and articulation, and some speech planning and turn-end prediction must occur while a conversational partner is talking. Thus, we expect to observe delays and more variability in the timing of turn starts in the presence of noise compared to in quiet and for HI participants compared to NH participants, as the presence of noise or hearing loss may (a) require more resources for speech perception and (b) reduce the saliency of to turn-end prediction cues. Below, we elaborate on this hypothesis.
Increased Cognitive Effort When Speech Is Degraded by Interfering Noise or Hearing Impairment
Barthel and Sauppe (2019) argued that the preparation of responses in parallel with comprehending the incoming turn is cognitively demanding, as the processing resources used for the production and comprehension of speech can interfere with and use resources from the same neurological system (Menenti et al., 2011; Segaert et al., 2012). There is evidence that prediction is important for comprehending speech in real-time. When a mismatch between the expected and the actual word uttered is encountered, additional resources are recruited to support the ongoing interpretation process (for a review, see Hagoort & Indefrey, 2014). The Ease of Language Understanding (ELU) model (Rönnberg et al., 2013, 2008) argues that when the sensory input is degraded, as a result of hearing loss or noise interference, there is a high probability that the perceived phonological input will not match stored phonological representations in long-term memory. When that happens, there is a shift from an implicit, automatically controlled process to an explicitly controlled process in which additional resources are recruited to infer meaning from the missing information. In the context of conversation, the point in time at which an interlocutor can start preparing their response may be delayed as the critical information to understand the response action may be perceived later and as they have to draw on top-down information to understand the incoming speech.
Thus, when conversations are conducted in more difficult listening conditions, the shifts in the processing of the incoming speech would result in speech planning starting later and at more variable points in time. Consequently, we expect to observe delayed and less precise timing of turn starts if interlocutors exert increased effort in response preparation.
Turn-End Prediction Cues
The following acoustic cues have been found to be associated with the end of turns (i.e., turn-yielding): a drop in loudness; a rising or falling pitch contour; an increase in vocal jitter, shimmer, and noise-to-harmonic ratio; longer IPUs; and a drawl on the final syllable or the stressed syllable of a terminal clause, the use of stereotyped expressions such as “or something,” and the completion of a grammatical clause (Brusco et al., 2020; Duncan et al., 1972; Gravano & Hirschberg, 2011; Hjalmarsson, 2011). Duncan et al. (1972) proposed a summing-of-cues theory stating that the more turn-yielding cues that are present, the more likely it is that a switch of turns is impending; however, if any turn-holding cues are present simultaneously, such as sustained pitch, a switch of turns is implausible. The summing-of-cues theory has been supported by evidence from Gravano and Hirschberg (2011) and Hjalmarsson (2011).
Hearing loss has been demonstrated to reduce frequency discrimination, intensity discrimination, and modulation discrimination and to increase speech reception thresholds (Moore, 1996). For NH listeners, noise interference has also been shown to reduce intensity discrimination (Schneider & Parker, 1990) and frequency discrimination (Li & Jeng, 2011). Thus, we hypothesized that for a person with hearing loss and for both NH and HI individuals in noise, the acoustic cues described above, such as changes in frequency (pitch and jitter), intensity (loudness and shimmer), and the completion of grammatical clauses (because of reduced audibility), may be less salient. If these cues are harder to utilize to predict the upcoming end of a turn, this could manifest as both a delay and more variability in turn-timing. A delay could be introduced if cues are not perceived or are misjudged, and a person has to react to silence after their partner has finished their turn. If the cues are less salient, providing their response at the “correct” time would be more difficult, increasing the variability in the timing of turn starts.
Methods
Participants
Twelve unacquainted mixed- and same-sex pairs of young NH and older HI interlocutors were recruited (nine females and seven mixed-sex pairs). The NH group (age min, mean, max, std = 23, 26, 30, 2.7 years) had hearing threshold levels below 20 dB HL between 125 Hz and 8 kHz. The HI group (age min, mean, max, std = 65, 73.5, 79, 4.4 years) had symmetrical, mild-to-moderate presbyacusis with N2/N3 audiograms (Bisgaard et al., 2010), and participants in this group were unaided during the experiment. The audiograms for both groups are plotted in Figure 2. NH participants had no professional experience talking to HI individuals, and they did not know prior to the experiment that they were going to communicate with a person with hearing loss. When introduced to each other before the experiment, the HI participants did not wear hearing aids; therefore, they did not reveal their hearing status to their NH interlocutors. However, it was evident that there was an age difference between them. All participants provided informed consent to participate in the experiment, and the experiment was approved by the Science-Ethics Committee for the Capital Region of Denmark (reference H-16036391). The participants were compensated for their time.

Audiometric pure-tone thresholds of participants with normal hearing and hearing impairment. The solid line indicates the mean hearing threshold, the colored regions indicate one standard deviation, and the dashed lines indicate minimum and maximum measured thresholds.
Setup and Presentation Level
Participant pairs were placed in separate audiometric booths wearing Shure SM35 head-worn wireless cardioid microphones (transmitted by a Shure GLXD14 wireless system) and Sennheiser HD650 open headphones, with which they communicated with each other. In conditions in which interlocutors were to converse in the presence of background noise, participants heard noise played back over their headphones mixed with their interlocutor's microphone signal. The background noise was 20-talker babble created by taking 20 min of recordings from 20 talkers balanced in sex from an NH-NH corpus previously recorded by the author (Sørensen et al., 2018). Pauses were removed using voice activity detection (VAD), and the recordings were normalized to the same root-mean-square (RMS) level as the recording with the lowest RMS level. Finally, these were added together. The first author listened to the recording and ensured it was impossible to resolve any words from the individual talkers.
The presentation level of the noise in the headphones was calibrated by placing them on a headphone coupler (consisting of a B&K 4149 microphone preamplified by a B&K 2619) connected to a B&K 2636 sound level meter (SLM). Babble noise was played back in the headphones, and the dBA level (10-s integration time) on the 2636 SLM was noted, along with the dB FS digital RMS of the babble snippet played back. The digital gain of the babble was adjusted to reach an SPL of 70 dBA on the SLM.
The levels of the participants’ head-worn microphones were adjusted such that the resulting presentation levels over the headphones were the same as if the listener were one meter away from the talker in the same room. This was achieved by adjusting the gain of the head-worn microphone to match that of a reference microphone placed one meter away from the talker.
Task and Procedure
To elicit dialogue between pairs, participants were asked to complete the DiapixDK task (Sørensen, 2021), a translated version of the DiapixUK task (Baker & Hazan, 2011). In this task, participants are given a pair of almost identical pictures. Each participant can see their own picture but not that of their partner. Their task is to work together to find the differences between the two pictures by describing them to each other. Here, solving the task was finding 10 differences between a pair of pictures. In the experiment, pairs of NH and HI participants conducted the DiapixDK task in each of four conditions: in quiet or in the presence of 20-talker babble background noise presented at 60, 65, and 70 dBA SPL. Participants repeated each of the conditions three times (using a different pair of pictures in each replicate), separated into three blocks, and had a break in between each block. The four conditions were randomized within each block. Across all their conversations, participant pairs saw each DiapixDK pair only once. The order of pictures was varied across participants so that each of the 12 Diapix picture pairs appeared an equal number of times in each condition.
Before the test, a training round was conducted outside the booths where the participant pairs sat together and conducted the task using a picture pair from the original Diapix task (Van Engen et al., 2010) under the experimenter's supervision. This was performed to familiarize participants with the task. Separated in their booths, the participants had another test round with another picture pair from the original Diapix task in 65 dBA SPL background noise to familiarize them with the setup, the noise, and the procedure. The experimenter sat outside, monitored all conversations, and provided feedback when participants had completed the task (i.e., found 10 differences) or that they still needed to find more (in some cases participants miscounted the number of differences they had found). In the test, the participants were given a maximum of 10 min to find 10 differences between the Diapix pictures. If they did not complete the task within 10 min, the experiment continued to the next condition. In total, 144 conversations (3 Replicates × 4 Conditions × 12 Pairs) were elicited. Of these, 11 were stopped after 10 min, but before 10 differences had been found. Overall, the experiment took approximately 2 to 3 hours per participant pair, including introduction, training, breaks, and the experiment.
Analysis of Recordings
For each of the conversations, VAD was performed to obtain a binary speech activity array. The VAD used was energy-based with a window length of 5 ms with 1 ms of overlap. The VAD threshold was set to 30 dB below the peak power observed over a conversation. According to Heldner and Edlund (2010), silent portions shorter than 180 ms were bridged to avoid mistaking periods of silence during plosive consonants for actual pauses. Heldner and Edlund (2010) removed bursts of activity shorter than 90 ms as they were assumed to be nonspeech, and Beechey et al. (2018) used a threshold of 75 ms. We found that for our corpus, 70 ms was appropriate to avoid excluding short “yes”-responses but still remove nonspeech elements like short coughs or the impact noise if a person hit the microphone inadvertently.
A Praat script was used to automatically detect syllables in the conversations (de Jong et al., 2021). This script is an updated version of the algorithm introduced by de Jong and Wempe (2009). The default parameters were used to find the syllable nuclei of each talker in each conversation. Sørensen et al. (2021) analyzed the accuracy of automated syllable estimation for Danish talkers and found no difference in speech produced in quiet versus noise.
The VAD output from each talker was processed to identify IPUs. The number of syllable nuclei in each IPU was counted and recorded. The sequences of IPUs for the two talkers in a conversation were then processed to identify floor transfers and pauses. For each floor transfer, the duration and number of syllables for both the preceding and following IPUs were recorded along with the FTO. For each pause, the duration of the preceding and following IPU was recorded along with the duration of the pause.
The data generated from these preprocessing steps have been posted to a data repository (Sørensen & MacDonald, 2024).
Statistical Procedure
Unless otherwise noted, the first step in the statistical analysis was to fit either a linear mixed model (LMM) or generalized LMM (GLMM) to the variables in R using the lmer and glmer functions in lme4. REML and ML were used for fitting the LMMs and GLMMs, respectively.
After fitting a model, the marginal means of the fixed effects were back transformed from the model coefficients using the emmeans package. The lmerTest package was used to estimate confidence intervals for the model coefficients and to conduct one-sided t tests using Satterthwaite's method. For LMMs, an analysis of variance was conducted on the model. Post-hoc comparisons of the estimated marginal means from models were conducted using the contrast function, which performed t tests using Kenward-Roger approximation for the degrees of freedom and the multivariate t distribution (mvt) for controlling for multiple comparisons.
For many of the metrics analyzed (e.g., level, articulation rate, speaking time, FTO interquartile range [IQR], etc.), we are limited to one observation per talker per conversation. As there are only 12 Diapix picture pairs, using this paradigm limited us to three conversations per condition. For these metrics, including a random slope of the condition by the talker to the model resulted in warnings of singular fits. For these cases, plots of individual talker means were compared to the estimated marginal means to confirm that a large majority of the talkers exhibited the same pattern as that observed overall.
Comparison With Results of Conversations Between NH Interlocutors
Two of the experimental conditions of the present study are quite similar to a pair of conditions in a study that investigated the effects of noise and second language on conversation by Sørensen et al. (2021). In that study, pairs of native-Danish-speaking NH interlocutors conducted a Diapix task in both quiet and noise (70 dBA), in both Danish (L1) and English (L2). The pictures used were the original DiapixUK pictures (where any text in the pictures was in English). The noise used in that study was a six-talker speech-shaped noise (ICRA 7, Dreschler et al., 2001). Thus, the results from the Danish conversations in that study provide an interesting comparison to the results from the quiet and 70 dBA conditions in the present study.
The recordings of the conversations between NH interlocutors in this experiment (Sørensen et al., 2018) were downloaded and the Danish conversations were processed in the same way as the recordings in the present study. This data will be referred to as NH-NH data.
In the results, we will use the following terms. NH-HI data will refer to data from the present experiment and NH-NH data will refer to the analysis of recordings from Sørensen et al. (2021). For individual talker measures, NH and HI will be used to refer to the talkers in the present experiment and NH-NH will refer to the NH talkers in Sørensen et al., 2021. For measures involving pairs, NH-HI will refer to the pairs in the present experiment and NH-NH will refer to those from Sørensen et al. (2021).
Results
Speech Levels
For the NH-HI data, estimated average speech levels one-meter away from the talker were calculated for each talker in each conversation. An LMM was fitted with the following model equation: Speech Level ∼ Condition × Hearing Status + (1|Talker) + (1|Replicate). The main effect of Condition [F(3, 256) = 589.61, p < .00001] and interaction of Condition × Hearing Status [F(3, 256) = 15.90, p < .00001] were found to be statistically significant.
The estimated marginal mean speech levels for the fixed effects of condition and hearing status are plotted in Figure 3. The parameters of the fixed effects from the fitted model are given in Supplemental Table 8.

Mean speech levels 1 m from the talker. The estimated marginal means of the talkers with normal hearing (NH, blue) and hearing impairment (HI, red) are from the linear mixed model of speech levels fitted to the NH-HI data. The error bars indicate 95% confidence intervals.
The results of pairwise comparisons of means are given in Supplemental Table 9. For both NH and HI, the differences in speech levels produced in each condition were significantly different from all the other conditions. However, the difference between the two groups was not significant in any condition.
In summary, both NH and HI talkers produced speech with levels that increased with higher levels of background noise. While not significantly different in an individual condition, an interaction between the condition and hearing status was observed.
Articulation Rates
Articulation rates were estimated for each talker in each conversation by dividing the total number of syllables produced by a talker by the total length of time that talker spoke during the conversation (i.e., the sum of the durations of all IPUs produced by the talker during the conversation).
For the NH-HI data, an LMM was fitted with the following equation: Articulation Rate ∼ Condition × Hearing Status + (1|Talker) + (1|Replicate). The estimated marginal mean articulation rates for the fixed effects of condition and hearing status are plotted in Figure 4. The parameters of the fixed effects from the fitted model are given in Supplemental Table 10.

Mean articulation rates, as defined by the number of syllables produced per unit of time the talker spoke. The estimated marginal means of the talkers with normal hearing (NH, blue) and hearing impairment (HI, red) are from the linear mixed model fitted to the NH-HI data. The estimated marginal means for NH talkers conversing with NH partners (NH-NH, green) are taken from the linear mixed model fitted to the data from the analysis of recordings from Sørensen et al. (2021). The error bars indicate 95% confidence intervals.
The main effect of Condition [F(3, 256) = 11.81, p < .00001] was found to be statistically significant. Neither the main effect of Hearing Status [F(1, 22) = 1.70, p = .21] nor the interaction of Hearing Status × Condition [F(3, 256) = 1.67, p = .17] was found to be statistically significant.
The results of pairwise comparisons are given in Supplemental Table 11. For the HI, the articulation rate in quiet was significantly higher than all the other noise conditions, but the differences in rates between pairs of noise conditions were not significant. For the NH, the articulation rate in quiet was significantly higher than in both the 65 and 70 dBA noise conditions. As well, the rate in 60 dBA was significantly higher than in the 70 dBA noise condition.
For the NH-NH data, an LMM was fitted with the following equation: Articulation Rate ∼ Condition + (1|Talker). The model's intercept (quiet) was 4.39 (95% CI [4.30, 4.48]; t(43.2) = 95.35, p < .0001) and the effect of condition was significant and positive (b = 0.1, 95% CI [0.05, 0.14], t(187.1) = 3.83, p < .001). The estimated marginal mean articulation rates from this model are plotted in Figure 4.
In summary, in the present experiment, both NH and HI talkers reduced their rate of articulation in the presence of noise. In contrast, the analysis here of the NH talkers in Sørensen et al. (2021) showed they increased their rate of articulation in the presence of noise.
Speaking Time
The proportion of time speaking was calculated by summing the total time each talker produced speech (i.e., the sum of the durations of all IPUs the talker produced) in a conversation and then dividing by the length of that conversation.
For the NH-HI data, a GLMM using a beta distribution (glmmTMB with beta_family) with the following equation: Proportion of Time Speaking ∼ Condition × Hearing Status + (1|Talker) + (1|Replicate). The estimated marginal mean proportion of time speaking for the fixed effects of condition and hearing status is plotted in Figure 5. The parameters of the fixed effects from the fitted model are given in Table 1.

Mean proportion of time talkers produced speech during a conversation. The estimated marginal means of the talkers with normal hearing (NH, blue) and hearing impairment (HI, red) are from the generalized linear mixed model fitted to the NH-HI data. The NH talkers in Sørensen et al. (2021) were split into groups based on who spoke the most/least in each pair across all conversations. The estimated marginal means for the talkers that spoke the least (NH-NH-least, darker green) and the most (NH-NH most, lighter green) are taken from the generalized linear mixed model fitted to this data. The error bars indicate 95% confidence intervals.
Fixed Effects of Generalized Linear Mixed Model of Proportion of Speaking Time (NH-HI Data).

Abbreviations: NH = talker with normal hearing; HI = talker with hearing impairment.
None of the coefficients for the three noise conditions are significantly different from zero. The coefficient for the fixed effect of hearing status is negative and significantly different from zero. Finally, all the coefficients of interactions of Condition × Hearing Status are negative. However, the only coefficients that are significantly different from zero are for the interactions of 60 dBA × Hearing Status and 70 dBA × Hearing Status.
When participating in a Diapix task, it is reasonable to assume that one talker in a dyad may lead the conversation and thus, speak more than their partner. Thus, for the NH-NH data, the talkers were split into groups based on who spoke the most/least in each pair across all conversations. A GLMM using a beta distribution (glmmTMB with beta_family) was fitted with the following equation: Proportion of Time Speaking ∼ Condition × Talked Most or Least + (1|Talker) + (1|Replicate). The estimated marginal mean proportion of time speaking for the fixed effects of condition for each group are plotted in Figure 5 to compare with estimates from the NH-HI data. The parameters of the fixed effects from the fitted model are given in Table 2. Neither the effect of condition nor the interaction of condition and talked most/least are significantly different from zero.
Fixed Effects of Generalized Linear Mixed Model of Proportion of Speaking Time (NH-NH Data).
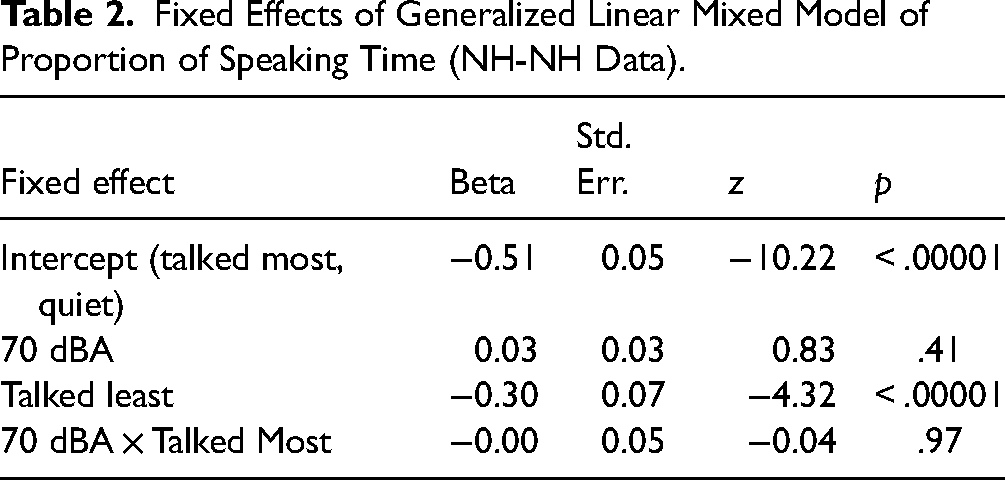
In summary, the proportion of time HI participants spoke during a conversation remained the same across all conditions. The proportion of time the NH participants spoke during a conversation was less than the HI talkers, and this proportion decreased in the highest noise condition. For the NH talkers in Sørensen et al. (2021), the proportion of time speaking did not change with noise.
Rate of Floor Transfers
For each conversation, the number of floor transfers was counted and divided by the duration of the conversation. An LMM was fitted to the NH-HI data with the following equation: FT Rate ∼ Condition + (1|Pair) + (1|Replicate). The estimated marginal mean rate of floor transfers per minute for the fixed effects of condition are plotted in Figure 6. The parameters of the fixed effects from the fitted model are given in Supplemental Table 12. A significant effect of condition was found [F(3, 127) = 22.25, p < .00001]. The results of pairwise comparisons of the means can be found in Supplemental Table 13. Except for 60 dBA versus 65 dBA and 65 dBA versus 70 dBA, all pairwise comparisons were significant (p < .001).

Mean rate of floor transfers in different levels of noise. The estimated marginal means of the pairs of talkers with normal hearing and hearing impairment (NH-HI) are from the linear mixed model fitted to the NH-HI data. The estimated marginal means for normal-hearing talkers conversing with normal-hearing partners (NH-NH, green) are taken from the linear mixed model fitted to the common conditions of the NH-HI and NH-NH data. The error bars indicate 95% confidence intervals.
In addition, an LMM was fitted to the common conditions of the NH-HI and NH-NH data using the following equation: FT Rate ∼ Condition × Experiment + (1|Pair) + (1|Replicate). The parameters of the fixed effects from the fitted model are given in Supplemental Table 14. Both the main effect of Condition [F(1, 148.4) = 63.13, p < .00001] and interaction of Condition × Experiment [F(1, 148.4) = 7.6, p < .01] were statistically significant. The estimated marginal mean floor transfer rates from both models are plotted in Figure 6 and pairwise comparisons are given in Supplemental Table 15.
In summary, the rate of floor transfers in the present experiment decreased with increasing levels of noise. While the rates of floor transfers in conversations between NH and HI talkers were similar to those between NH talkers in quiet, the effect of noise was larger for conversations between NH and HI talkers.
Floor-Transfer Offsets
For the NH-HI data, kernel density distributions of FTOs (computed using geom_density from the ggplot2 R package using a smoothing bandwidth of 50 ms) are plotted in Figure 7. From the figure, it appears that the FTO distributions are broader and shifted slightly rightwards with increasing levels of background noise. Furthermore, the distributions of the HI talkers appear broader than those of NH talkers.

Distributions of floor transfer offsets produced by talkers with normal hearing (NH, blue) and hearing impairment (HI, red) in each of the four background noise conditions ranging from quiet (darkest) to 70 dBA (lightest). The vertical gray line indicates where the distributions were truncated (with observations left of the line removed) in order to fit a generalized linear mixed model with a gamma distribution.
As the observed distributions of FTOs are skewed, a GLMM using a gamma distribution was selected to be fitted to the data. This approach was chosen as it allows for the control of other factors that have been found to influence FTO duration, such as articulation rate and IPU duration (Roberts et al., 2015) at the level of each FTO observation. However, as gamma distributions only include positive observations, it is necessary to preprocess the observations to remove any negative observations before fitting. Here, we shifted the FTO distribution to the right by adding a fixed value to each FTO observation and then removed all observations that remained negative after this shift. For a gamma distribution, the mean can be estimated from the variance and skewness. The mean of a gamma distribution with the same variance and skewness as the distribution of all the observed NH-HI FTOs was found to be 577.9 ms. The mean of all the observed NH-HI FTOs was 446.1 ms. Thus, the difference between these two means (131.8 ms) was added to NH-HI FTO observations and any that remained negative (8.5% of all NH-HI FTOs) were then removed. When later calculating the estimated marginal means, a correction for this shift was applied.
A GLMM using a gamma family (with a log link) was fitted to the shifted NH-HI data using the following equation: FTO ∼ Condition FTO × Hearing Status + Pre FT Number of Syllables × Hearing Status + Post-FT Number of Syllables × Hearing Status + Pre-FT Articulation Rate × Hearing Status + Post-FT Articulation Rate × Hearing Status + (1+ Condition | Talker) + (1 | Replicate). Here, Pre- and Post-FT Number of Syllables indicate the number of syllables estimated in the IPU preceding and following the floor transfer, respectively. Furthermore, the articulation rates of the IPUs preceding (pre-FT articulation rate) and following (post-FT articulation rate) were computed by dividing the number of syllables estimated in the preceding or following IPU divided by the duration of that IPU. These predictors were included as they have been observed to influence FTO duration (Roberts et al., 2015). The estimated marginal mean FTO for the fixed effects of condition and hearing status are plotted in Figure 8. The parameters of the fixed effects from the fitted model are given in Table 3.

Mean floor transfer offset (FTO) across noise conditions. The estimated marginal means of the talkers with normal hearing (NH, blue) and hearing impairment (HI, red) are from the generalized linear mixed model fitted to the NH-HI data. The estimated marginal means of NH talkers conversing with NH partners (NH-NH, green) are taken from the generalized linear mixed model fitted to the common conditions of the data from the present study and data from Sørensen et al. (2021). The error bars indicate 95% confidence intervals.
Fixed Effects of Generalized Linear Mixed Model of FTO (NH-HI Data).

Abbreviations: FTOs = floor transfer offsets; FT = floor transfer; NH = talker with normal hearing; HI = talker with hearing impairment.
For the effect of condition, each coefficient is positive and significantly different from both zero and each other. The coefficient for the effect of hearing status is positive but not significantly different from zero. None of the coefficients for the interaction of Hearing Status × Condition are significantly different from zero.
The coefficient for the number of syllables in the preceding IPU was negative and significantly different from zero (i.e., IPUs with more syllables were followed by shorter FTOs). The coefficient for the number of syllables in the following IPU was positive and significantly different from zero (i.e., FTOs were longer before IPUs with more syllables). The coefficients for the articulation rates of the IPU preceding and following were positive and negative, respectively, and both were significantly different from zero.
To investigate the behavior of NH talkers, the FTO observations from the conditions common to the NH talkers in the present study and those from the NH-NH data were pooled. The kernel density distributions of the observed FTOs produced by NH talkers (using a smoothing bandwidth of 50 ms) are plotted in Figure 9.

Distributions of floor transfer offsets produced by normal-hearing talkers speaking to partners with hearing impairment (NH-HI data, blue) or normal-hearing partners (NH-NH data, green) in quiet (darker) or 70 dBA noise (lighter). The vertical gray line indicates where the distributions were truncated (with observations left of the line removed) in order to fit a generalized linear mixed model with a gamma distribution.
The mean of a gamma distribution with the same variance and skewness as the distribution of the pooled NH FTO data was found to be 469.9 ms. The mean of the pooled NH FTOs was 388.6 ms. Thus, the difference between these two means (81.3 ms) was added to the NH FTO observations and any that remained negative (9.5%) were then removed. When later calculating the estimated marginal means, a correction for this shift was applied.
A GLMM using a gamma family (with a log link) was fitted to the shifted pooled NH data using the following equation: FTO ∼ Condition × Partner Hearing Status + Pre-FT Number of Syllables + Post-FT Number of Syllables + Pre-FT Articulation Rate + Post-FT Articulation Rate + (1 + Condition | Talker) + (1 | Replicate). Here, Pre- and Post-FT Number of Syllables, as well as Pre- and Post-FT Articulation Rate are calculated in the same way as in the GLMM for NH-HI FTO data above. The estimated marginal mean FTO for the fixed effects of condition for the NH-NH talkers are plotted in Figure 8 to compare with the means from the NH-HI data. The parameters of the fixed effects from the fitted model are given in Table 4.
Fixed Effects of Generalized Linear Mixed Model of FTOs Produced by NH Talkers Across Both Experiments (NH-NH Data Pooled With Observations From NH Talkers in NH-HI data).

Abbreviations: FT = floor transfer; FTOs = floor transfer offsets; NH = talker with normal hearing; HI = talker with hearing impairment.
The coefficient for the main effect of noise is positive and significantly different from zero. The coefficient for the main effect of partner hearing status was not significantly different from zero. However, the coefficient for the interaction of Noise × Partner Hearing Status is positive and significantly different from zero. The pattern of effects of Pre-/Post-FT articulation rates and number of syllables are the same as those observed for the NH-HI data.
As a measure of the spread of the FTO distributions, the IQR of each talker's FTOs in each conversation was computed for both NH-HI and NH-NH data.
For the NH-HI data, an LMM was fitted with the following equation: FTO IQR ∼ Condition × Hearing Status + (1|Talker) + (1|Replicate). The estimated marginal mean FTO IQR for the fixed effects of condition and hearing status are plotted in Figure 10. The parameters of the fixed effects from the fitted model are given in Supplemental Table 16. Both main effects of Condition [F(3, 256) = 26.43, p < .00001] and Hearing Status [F(1, 22) = 10.99, p < .01] were found to be statistically significant. The interaction of Hearing Status × Condition [F(3, 256) = 0.87, p < .47] was not statistically significant.

FTO interquartile range across noise conditions. The estimated marginal means of the talkers with normal hearing (NH, blue) and hearing impairment (HI, red) are from the linear mixed model fitted to the NH-HI data. The estimated marginal means of NH talkers conversing with NH partners (NH-NH, green) are taken from the linear mixed model fitted to the NH talker data pooled from the common conditions of the NH-NI and NH-NH data. The error bars indicate 95% confidence intervals.
To compare the results from NH talkers, the IQR estimates of NH talkers for the common conditions of the NH-HI and NH-NH data were pooled. For this pooled data, an LMM was fitted with the following equation: FTO IQR ∼ Condition × Partner Hearing Status + (1|Talker) + (1|Replicate). The parameters of the fixed effects from the fitted model are given in Supplemental Table 17. The estimated marginal mean FTO IQRs of the NH-NH talkers are plotted in Figure 10.
Both the main effect of Condition [F(1, 240.6) = 72.78, p < .00001] and interaction of Partner Hearing Status × Condition [F(1, 240.6) = 29.0, p < .00001] were found to be statistically significant. The main effect of Partner Hearing Status [F(1, 16.3) = 1.66, p = .22] was not statistically significant.
In summary, in the present experiment, FTO distributions became broader and were shifted to the right in the noise conditions for both NH and HI talkers. In comparing data across experiments, when talking to both NH and HI partners, the FTO distributions of NH talkers were similar in quiet. However, when talking in noise, the FTO distributions of the NH talkers speaking to HI partners were broader and shifted to the right compared to those of NH talkers speaking to NH partners.
Interpausal Units
We defined IPUs as stretches of speech surrounded by 180 ms of silence. IPUs that had been classified as overlaps-within were removed and not included in any of the following analyses.
For the NH-HI data, kernel density distributions of IPU duration (computed using geom_density from the ggplot2 R package using a smoothing bandwidth of 50 ms) are plotted in Figure 11.

Distributions of IPU durations produced by talkers with normal hearing (blue) and hearing impairment (red) in each of the four background noise conditions ranging from quiet (darkest) to 70 dBA (lightest).
In the VAD processing, the minimum IPU duration was set to 70 ms (i.e., IPUs shorter than 70 ms were assumed to be nonspeech and ignored). Thus, prior to fitting a GLMM, 70 ms was subtracted from all IPU duration observations. When calculating the estimated marginal means, a correction for this offset was applied to compensate for this shift.
A GLMM using a gamma family (with a log link) was fitted to the shifted NH-HI data using the following equation: IPU duration ∼ Condition × Hearing Status + (1 + Condition | Talker) + (1 | Replicate). The estimated marginal mean IPU duration for the fixed effects of condition and hearing status are plotted in Figure 12. The parameters of the fixed effects from the fitted model are given in Table 5.

Mean IPU duration. The estimated marginal means of the talkers with normal hearing (NH, blue) and hearing impairment (HI, red) are from the fitted generalized linear mixed model. The error bars indicate 95% confidence intervals.
Fixed Effects of Generalized Linear Mixed Model of IPU Duration.
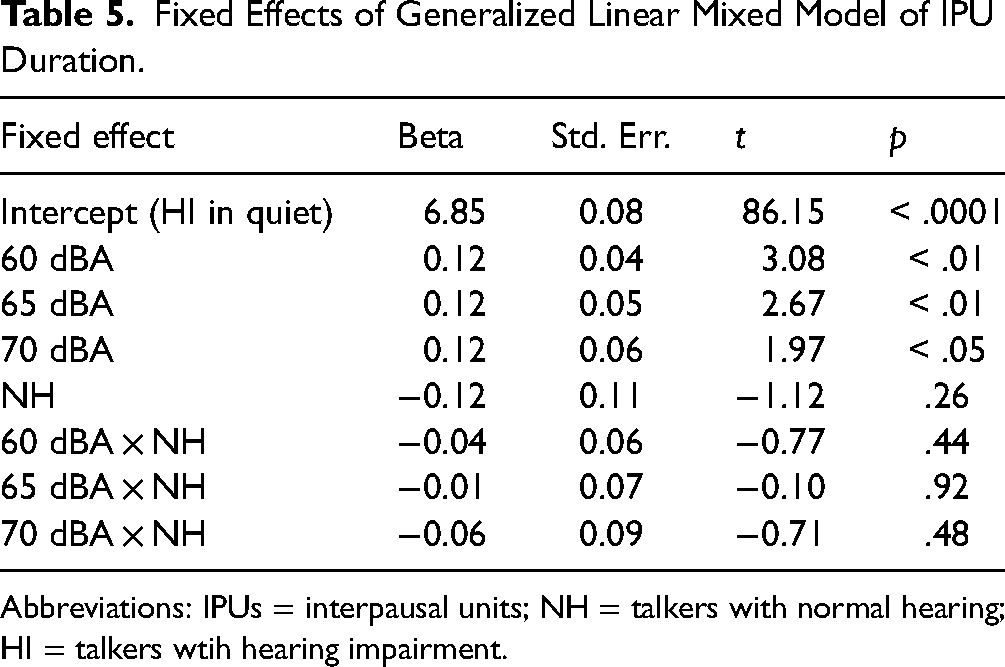
Abbreviations: IPUs = interpausal units; NH = talkers with normal hearing; HI = talkers wtih hearing impairment.
The coefficients for the three noise conditions are positive, significantly different from zero, and similar to each other. None of the other coefficients were significantly different from zero.
To control for the observed change in articulation rate with noise, a follow-up analysis of the number of syllables per IPU was conducted. A GLMM using a Poisson distribution (with a log link) was fitted using the following equation: Number of Syllables ∼ Condition × Hearing Status + (1 + Condition| Talker) + (1 | Replicate). The estimated marginal mean number of syllables per IPU for the fixed effects of condition and hearing status is plotted in Figure 13. The parameters of the fixed effects from the fitted model are given in Table 6.
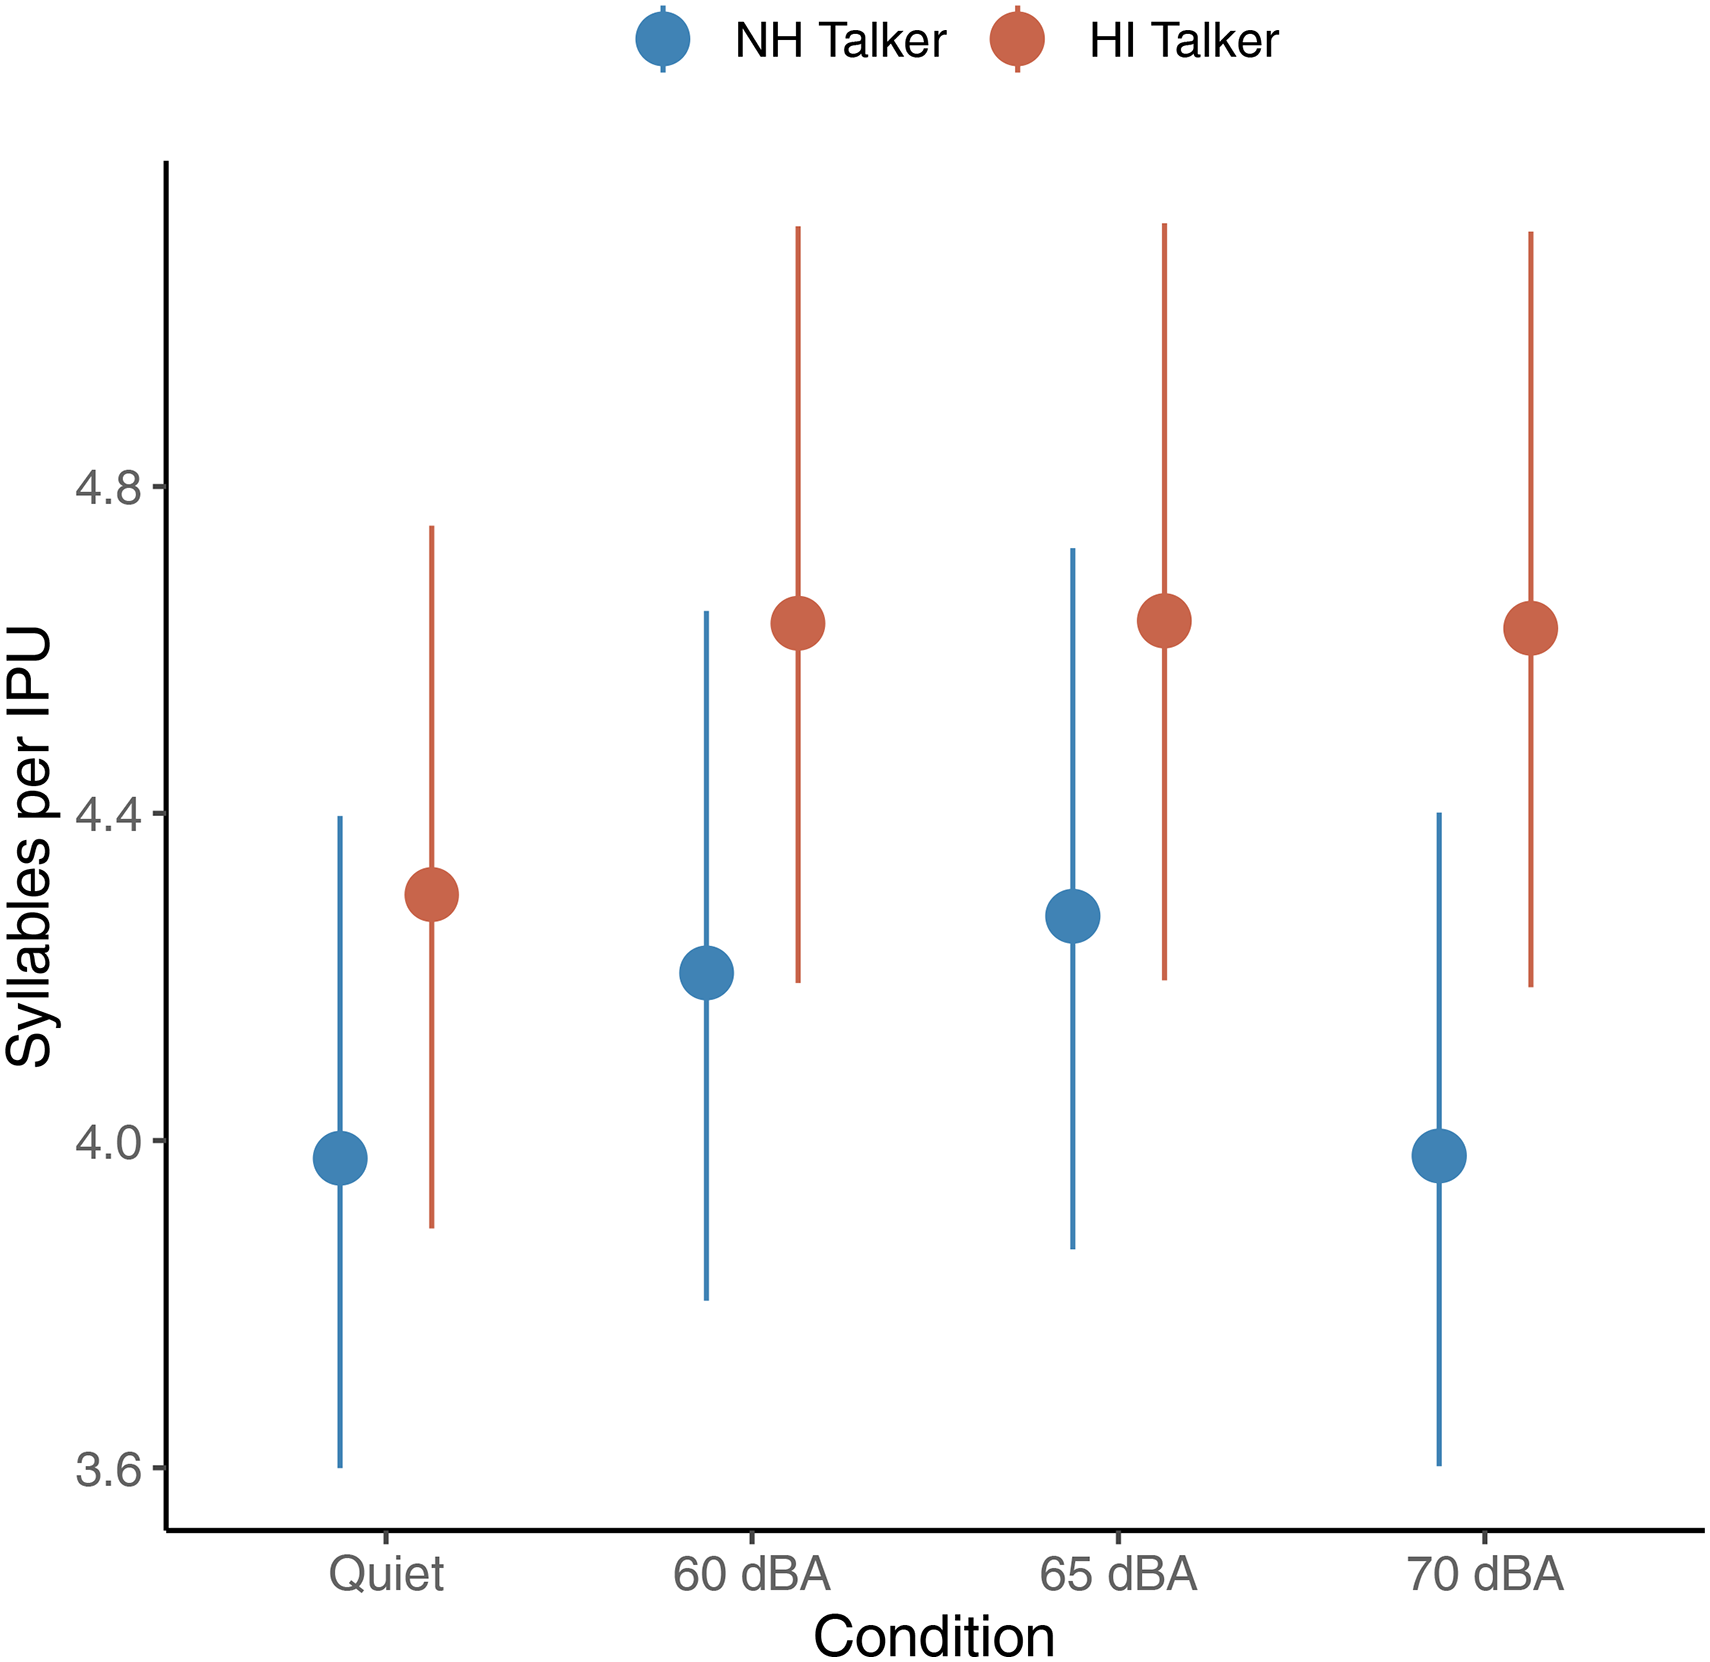
The mean number of syllables per IPU. The estimated marginal means of the talkers with normal hearing (NH, blue) and hearing impairment (HI, red) talkers are from the fitted generalized linear mixed model. The error bars indicate 95% confidence intervals.
Fixed Effects of Generalized Linear Mixed Model of Number of Syllables per IPU.
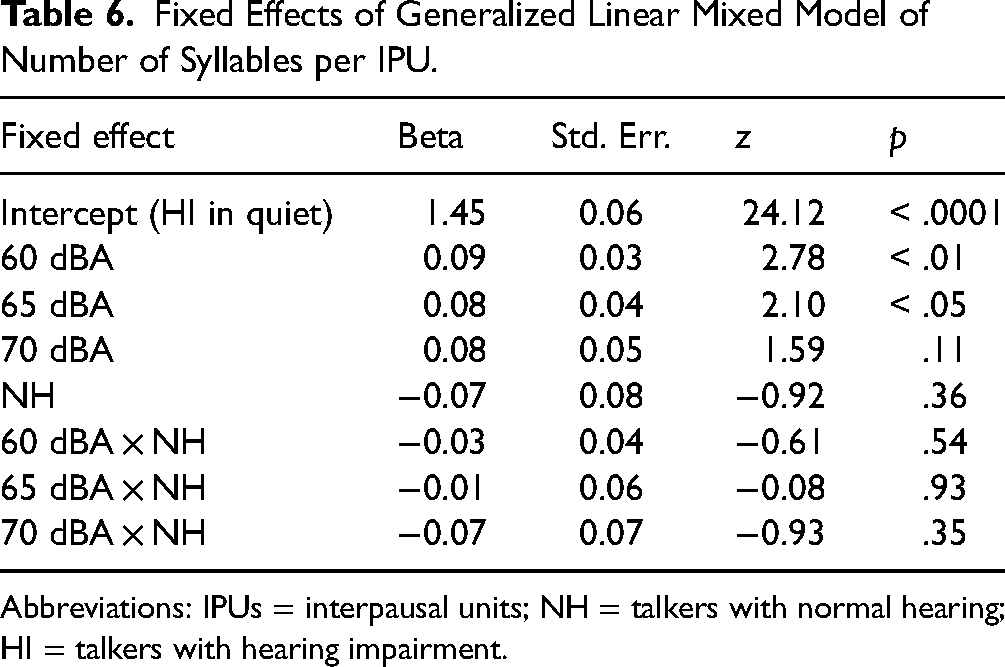
Abbreviations: IPUs = interpausal units; NH = talkers with normal hearing; HI = talkers with hearing impairment.
The coefficients for the three noise conditions are positive, significantly different from zero, and similar to each other. The coefficient for the interaction of 70 dBA × NH was negative and significantly different from zero. None of the other coefficients were significantly different from zero.
In summary, the presence of background noise resulted in increased IPU durations (with more syllables per IPU) for both NH and HI participants. However, in the highest noise condition, the number of syllables did not differ from quiet.
Pause Duration and Rate
The kernel density distributions of pause duration (computed using geom_density from the ggplot2 R package using a smoothing bandwidth of 50 ms) are plotted in Figure 14.

Distributions of pause durations produced by talkers with normal hearing (blue) and hearing impairment (red) in each of the four background noise conditions ranging from quiet (darkest) to 70 dBA (lightest).
In the VAD processing, the minimum pause duration was set to 180 ms (i.e., silences shorter than 180 ms were assumed to be related to the production of stop consonants and ignored). Thus, prior to fitting a GLMM, 180 ms was subtracted from all pause duration observations. When calculating the estimated marginal means, a correction for this offset was applied to compensate for this shift.
A GLMM using a gamma family (with a log link) was fitted to the shifted NH-HI data using the following equation: Pause duration ∼ Condition × Hearing Status + Pre-Pause Articulation Rate × Hearing Status + Post-Pause Articulation Rate × Hearing Status + Pre-Pause Number of Syllables × Hearing Status + Post-Pause Number of Syllables × Hearing Status + (1 + Condition | Talker) + (1 | Replicate). As the number of syllables and articulation rates have been observed to influence FTO duration, we anticipated that these factors might also influence pause duration. The parameters of the fixed effects from the fitted model are given in Table 7. The estimated marginal mean pause duration for the fixed effects of condition and hearing status are plotted in Figure 15.

Mean pause duration. The estimated marginal means of the talkers with normal hearing (NH, blue) and hearing impairment (HI, red) are from the fitted generalized linear mixed model. The error bars indicate 95% confidence intervals.
Fixed Effects of Generalized Linear Mixed Model of Pause Duration (NH-HI Data).
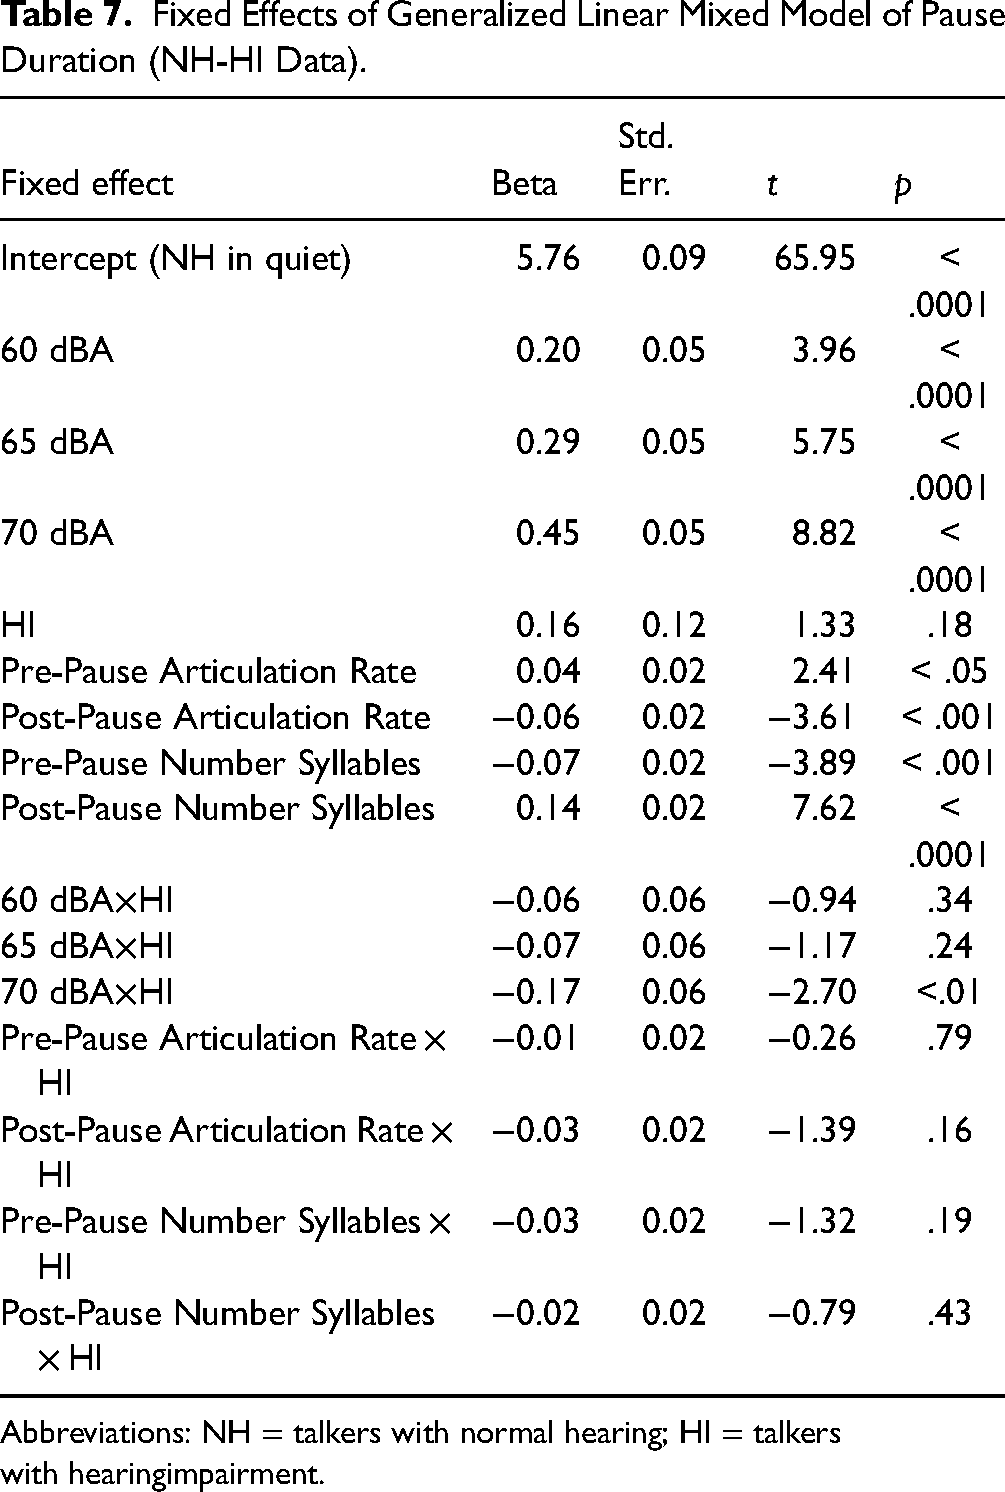
Abbreviations: NH = talkers with normal hearing; HI = talkers with hearingimpairment.
For the effect of the condition, each coefficient is positive and significantly different from zero. The coefficient for the effect of hearing status is positive but not significantly different from zero. The coefficients for the interaction of condition and hearing status are all negative, but only the 70 dBA × Hearing Status coefficient is significantly different from zero. The coefficients for the number of syllables in the preceding IPU and following IPU were negative and positive, respectively, and both were significantly different from zero. The coefficients for the articulation rates of the IPU preceding and following were positive and negative, respectively, and both were significantly different from zero. None of the coefficients of the Predictors × HI were significantly different from zero.
For each talker in each conversation, the pause rate was calculated by counting the total number of pauses and dividing it by the sum of the durations of all IPUs and pauses produced by that talker in that conversation. An LMM was fitted with the following equation: Pause Rate ∼ Condition × Hearing Status + (1|Talker) + (1|Replicate). The parameters of the fixed effects from the fitted model are given in Supplemental Table 20. The estimated marginal mean pause rates are plotted in Figure 16.

The mean pause rate is defined by the total number of pauses divided by the sum of all interpausal units (IPUs) and pause durations of a talker during a conversation. The estimated marginal means of the talkers with normal hearing (NH, blue) and hearing impairment (HI, red) are from the fitted generalized linear mixed model. The error bars indicate 95% confidence intervals.
The main effect of Condition [F(3, 258) = 12.14, p < .00001] and interaction of Condition × Hearing Status [F(3, 258) = 2.78, p < .05] were statistically significant. The main effect of Hearing Status [F(1, 22) = 2.13, p = .09] was not statistically significant.
Pairwise comparison results are given in Supplemental Table 21. For the NH talkers, the pause rate in quiet was significantly higher than in all other noise conditions (p < .0001). For the HI talkers, the pause rate in quiet was higher than in 60 and 65 dBA (p < .05). The pause rate of NH talkers was lower than that of HI talkers in the 70 dBA condition (p < .05). No other statistically significant pairwise comparisons were found.
In summary, the mean pause duration increased for both NH and HI talkers with increasing levels of noise. In general, the rate at which talkers produced pauses was lower in the noise conditions compared to that in quiet. For NH talkers, this rate was similar across the three noise conditions. However, for the HI talkers, the rate at which they produced pauses was higher in the 70 dBA condition compared to the other two noise conditions and was similar to that produced in quiet.
Discussion
The purpose of the present experiment was to investigate the influence of noise and hearing impairment on conversational dynamics between young NH participants and older HI participants when they were completing the DiapixDK task, a spot-the-difference task. In general, in the presence of noise, both NH and HI talkers spoke louder and more slowly, produced longer IPUs (with more syllables), switched turns at a reduced rate, increased the duration of their pauses, and the timing of the start of their turns was more delayed and had a larger variability. Compared to NH talkers, the variability in the timing of the turn starts by HI talkers was larger and HI talkers spoke for a higher proportion of the time. Below we elaborate on these observations and discuss their implications.
Speech Levels
Both NH and HI talkers produced higher speech levels in noise, consistent with the Lombard effect. While a statistically significant interaction of Condition × Hearing Status was found, none of the pairwise comparisons of mean levels of NH versus HI talkers in each noise condition were significantly different.
In a similar setup to this experiment (Sørensen et al., 2021) native-Danish pairs of NH friends conducted the same Diapix task, but with DiapixUK pictures instead of the DiapixDK pictures used here (the pictures differ only in the language of the text that appears within them). On average, those NH pairs communicated at a signal-to-noise ratio (SNR) of −2.5 dB in 70 dBA SPL background noise. In the present study, NH participants produced an average SNR of 1.7 dB in the presence of the 70 dBA masker. It should be noted that the noise used by Sørensen et al. (2021) was 6-talker speech-shaped noise (ICRA7; Dreschler et al., 2001), whereas in the present study a 20-talker babble masker, which has more energy in the 1–3 kHz band, was used. However, Watson et al. (2020) used the same 20-talker babble masker in conversations between unacquainted native-Danish NH participants who conducted a Diapix task in English (their second language). In that study, participants communicated with an average SNR of −0.3 dB when the masker was presented at 70 dBA. Thus, when talking to an HI conversational partner in the presence of a 70 dBA masker, the NH talkers in the present study produced an SNR that was 4.2 dB higher than that observed by Sørensen et al. (2021) and 2 dB higher than that reported by Watson et al. (2020). This outcome was expected, as HI listeners have been shown to have higher speech reception thresholds (SRTs) than NH listeners (Nielsen & Dau, 2011). It has been argued that people aim to reduce their effort to the minimum that is required to obtain effective communication (e.g., Hazan & Baker, 2011). Here we observed that with increasing noise levels, the SNR decreased for both the NH and HI talkers, which is in line with Weisser and Buchholz (2019) and Pearsons et al. (1977). This supports that people exhibit a trade-off between physical effort and comprehension.
Articulation Rates
In general, both NH and HI talkers reduced their rates of articulation in noise and the differences in articulation rates between the two groups of talkers were not significantly different. In contrast, the analysis here of the NH talkers in Sørensen et al. (2021), who communicated with an NH talker, showed they increased their rate of articulation in the presence of a 70 dBA masker. Similarly, Beechey et al. (2018) found that NH interlocutors spoke faster in noise when communicating with an NH partner.
The demands in more challenging communication conditions may lead to slower speech planning. By talking more slowly, speakers allow themselves more time to prepare their responses.
Speakers might speak at a slower rate to facilitate easier speech understanding by their partner. In addition, a reduction in articulation rate may be a signal to a partner to speak more slowly to ease speech understanding. Piquado et al. (2012) investigated the effect of hearing impairment on sentence recall in younger HI listeners with mild-to-moderate hearing loss compared to age-matched NH listeners. They found that NH listeners had significantly better recall than HI listeners when listening to a speech at a normal pace, even though the sentences were adjusted for audibility. However, when given the ability to pause the recording at every clause or sentence boundary, HI listeners performed as well as NH listeners. This suggests that pausing can help HI individuals alleviate their decreased working memory performance, likely because they have a longer time to draw on top-down information to fill in the gaps of what they cannot hear.
Assuming the speech understanding and cognitive abilities of the NH talkers were similar between the present study and those of Sørensen et al. (2021) and Beechey et al. (2018), then the reduction in articulation rate of the NH talkers in the two highest noise conditions is most likely related to their HI partner's behavior. This suggests that NH talkers talk more slowly because their HI partner is talking more slowly (i.e., mimicking the reduction in articulation rate) and/or as an adaptation to ease speech understanding of their HI partner.
In the analyses conducted here, syllables were not counted by hand. Although the results from the automated process used to estimate the number of syllables are likely to be biased, any bias should be similar across conditions (and this is supported by analyses conducted by Sørensen et al., 2021). Thus, the discussion above is based on the comparison of results across conditions and studies rather than absolute terms.
Speaking Time
In challenging communication situations, a participant who experiences difficulty may attempt to dominate the conversation (i.e., hold the floor longer than others) as this reduces the amount of speech understanding they need to perform (Jaworski & Stephens, 1998; Stephens & Zhao, 1996). Conversely, a participant may withdraw from active participation in a conversation and pretend to follow by producing nonspeech responses such as nodding, smiling, or laughing. Engaging in either of these strategies would alter the proportion of time a participant spoke during a conversation. Across all the conversations, the proportion of time that HI talkers spoke was more, on average, than their NH partner (∼ 40% vs. 30% of the total conversation duration, respectively). Thus, it is tempting to immediately jump to the conclusion that the HI talkers employed a maladaptive strategy to dominate the conversation. However, the Diapix task could inherently lead to unequal contributions by each talker. For example, a viable approach to solving this task could be to have one talker lead the conversation by describing what they see and have the other talker only speak to confirm whether they see the same thing or not. This would naturally lead to an unequal proportion of speech produced by the two talkers. Thus, to provide context, we measured the speaking time of the NH talkers in Sørensen et al. (2021). We split data from those participants into two groups based on who spoke the most (NH-NH most) versus least (NH-NH least) in each pair across all conversations. We found that the proportions of speech produced by the two groups (∼ 38% and 32%) were similar to the proportions produced by the HI and NH talkers in the present study. Thus, while 10 of the 12 HI talkers in the present study spoke more than their NH partner (as computed by summed IPU duration across all conversations), on average, they did not appear to dominate the conversation more than an NH talker does when talking to an NH partner. Thus, the overall average difference in the speaking times observed between the HI and NH talkers in the present study is likely a result of the dynamics inherent to conducting a Diapix task rather than the effect of hearing loss.
While the proportion of time that the HI participants spoke was similar across all conditions, the proportion of time that NH participants spoke decreased significantly in the highest noise condition. Thus, it appears that NH talkers withdrew somewhat in the 70 dBA condition. It is unlikely that this withdrawal is a result of poor speech understanding by NH in noise. Instead, we speculate that this withdrawal by the NH talkers may have been an adaptive strategy to reduce the amount of speech their HI partner had to process, which is functionally similar to allowing their HI partner to dominate the conversation. This is discussed further below in connection with the observed changes in IPU duration and average numbers of syllables per IPU.
Timing of Turn Starts
Our primary hypothesis was that when NH and HI participants experienced difficulties communicating due to noise interference and hearing loss, they would produce more positive and more variable FTOs. Indeed, we found that for both groups, FTO distributions shifted towards more positive values and became broader in noise, and the shift and broadening increased with increasing levels of noise. Furthermore, the variability was higher for HI participants compared to that of NH participants. We interpret these outcomes as indications that HI participants experienced increased difficulty compared to NH participants and that both NH and HI participants experienced an increase in difficulty in noise. The increase in difficulty may have led to an increase in speech processing load (including missed information) and/or a decreased sensitivity to turn-end cues, altering the distribution of FTOs.
Previous work has demonstrated that FTOs are influenced by factors such as turn duration and speech rate (Roberts et al., 2015; Sørensen et al., 2021). To control for these factors, we estimated the number of syllables and rate of articulation of the last IPU from the talker that ceded the floor (pre-FT IPU) and the first IPU from the talker that took the floor (post-FT IPU) and included these as predictors in the fitted GLMM. All four of these predictors were found to be significant. With respect to the talker who took the floor, we interpret the number of syllables in the post-FT IPU as a proxy for the amount of speech planning needed to produce that utterance. Thus, one would expect that a larger number of syllables in a post-FT IPU would require more planning and result in a longer FTO and this was observed in our data. Similarly, we interpret the number of syllables in the pre-FT IPU as a proxy for the amount of processing needed by the talker who took the floor to understand that utterance. Thus, one might expect that utterances that have more syllables would require more processing and lead to longer FTOs. However, the rate at which people can understand speech has been estimated to be three times faster than the rate at which it is articulated (Calvert, 1986). Thus, although utterances with more syllables may have more content to decode, they can allow more time for speech processing (Roberts et al., 2015). Here, we observed that IPUs with a larger number of syllables were followed by shorter FTOs. With regards to articulation rate, we observed that a faster articulation rate by the talker that ceded the floor was associated with longer FTOs. This supports the interpretation that faster articulation by the talker that cedes the floor provides less time for speech processing by the talker that takes the floor, resulting in higher processing demands. Finally, we observed that for talkers who take the floor, utterances that are produced quickly occur with shorter FTOs. If a talker has a target syllable rhythm (e.g., Auer et al., 1999), then the talker might aim to achieve an FTO that is similar in duration to that of a single syllable. Alternatively, if a talker is experiencing high demands on processing resulting in a longer FTO, the talker may also slow their articulation rate to provide more time for planning of later speech. Either of these would result in the observed relationship between FTO duration and the articulation rate of the IPU by the talker who took the floor.
As with the previous measures investigated above, we compared the distributions of FTOs produced by the NH talkers in the present study to those produced by NH talkers in the study by Sørensen et al. (2021). For the quiet condition in both studies, the distributions of FTOs produced by both groups of NH talkers were similar. However, in the 70 dBA masker condition, the distribution of FTOs produced by NH talkers conversing with an HI partner (present study) was shifted and more broad than those produced by NH talkers conversing with an NH partner (Sørensen et al., 2021). This would suggest the NH participants in the present study experienced more difficulty than those in the earlier study. As discussed above, the masker used in the current study was potentially more challenging than that used by Sørensen et al. (2021). However, in the 70 dBA condition, the average SNR of the speech received by the NH participants from their HI partners was 1.1 dB. This is higher than the SNR of −0.3 dB for pairs of NH talkers conducting a similar task with the same background masker as the present study presented at 70 dBA which was observed by Watson et al. (2020). Thus, it is unlikely that the elevated difficulty experienced by the NH participants in the present study was due to difficulty in understanding the words spoken by their HI partners. We speculate that challenges related to maintaining fluent interactions (e.g., repair of break downs) are a more likely explanation.
Interpausal Units
In general, both NH and HI talkers produced longer IPUs (i.e., units of connected speech surrounded by silence) in noise. As both groups of talkers reduced their rates of articulation in noise, some increase in IPU duration in noise would be expected. However, the average number of syllables per IPU also increased in the two moderate noise conditions. Beechey et al. (2018), Sørensen et al. (2021), and Watson et al. (2020) all observed that NH talkers lengthened their IPUs in noise when conversing with NH partners. In the present study, an exception to this general pattern of increased IPU duration and mean number of syllables was observed in the 70 dBA condition. In the most challenging condition, both groups of talkers produced IPUs with an average number of syllables that were similar to those produced in quiet. We will first consider the general finding of increased IPU length in noise before considering the behavior in the most challenging condition.
Brusco et al. (2020) found that the duration of IPUs was longer for IPUs preceding turn-holds than for IPUs preceding turn-switches and backchannels and that people tended to speak slower before turn-holds. The authors interpreted this as planning slowing down speech before holds. If people have not had sufficient time to fully plan their turn before launching a response within a typical response time, planning may continue while they are producing their response. In return, individuals may need a longer time to process what they are going to say when they have a hearing loss or are communicating in the presence of background noise. Clark and Fox Tree (2002) found that upon detecting a delay in one's planning of a sentence, people use filler words such as “uh” for the prediction of short delays and “um” for long delays to signal they want to take the turn or continue an ongoing turn. Slowing speech and increased use of filler words would naturally increase IPU durations. While not examined in this study, we speculate that people might increase their use of filler words in more challenging conditions. Inserting filler words at the start of a phrase boundary or starting speech production and then adding filler words may be a strategy to maintain a target for the timing of turns if more time for speech planning is needed. Beechey et al. (2018) argued that NH interlocutors adopted a “holding the floor” strategy in noise by increasing the duration of IPUs and overlapping more, as it reduced the need to listen to and comprehend their interlocutor's speech.
While increased IPU durations may be related to the difficulty the talker is experiencing, an alternative explanation is that talkers might increase the length of their utterances to ease the speech perception of their partner. Talkers may more fully articulate their utterances (i.e., reduce the number of contractions they produce). Talkers might also generate constructions with higher degrees of redundancy (i.e., producing utterances where individual words can be more easily guessed based on other words in the utterance).
In the most challenging noise condition, speech understanding by the HI participants is likely to have been very difficult. We have argued above that longer IPUs can provide more redundancy to ease speech understanding. However, in cases of very challenging conditions, where many phonemes may be missed, the benefit from the increase in redundancy may be outweighed by the increase in the amount of speech processing that needs to be conducted. Under these conditions, it may be more efficient to produce less speech where the potential uncertainty can be constrained (e.g., replies of yes/no are likely easier for an HI partner to decode than more complex, open-set constructions). As discussed earlier, the NH talkers decreased the amount of time they spoke in the most challenging noise condition, but the change in the amount of speaking time cannot be explained purely by changes in IPU length.
Pause Duration and Rate
For both NH and HI talkers, the mean pause duration during speech increased with increasing levels of noise. While none of the differences between the groups were statistically significant, a significant interaction was observed in the GLMM for the most challenging noise condition. This coefficient indicated a relative increase in pause duration for the NH talkers. In general, the rates at which both groups produced pauses were lower in noise compared to quiet and were similar across noise levels. Furthermore, the rates were similar across groups except for the most challenging noise condition, where the rate of pauses was higher for the HI talkers.
In the analysis of the recordings, a pause was defined as a silent interval with a duration of at least 180 ms and no floor transfer occurred (i.e., the same talker spoke before and after the silent interval). Thus, a pause could be produced by a talker when needing more time to plan their next utterance or to provide an opportunity for their partner to take the floor (and their partner does not take it). The pattern of results for pause duration observed in this experiment is consistent with both possibilities. With increasing levels of noise, both groups experienced increasing levels of difficulty, which could result in longer pauses to provide time for speech planning. If a talker is providing an opportunity for a partner to take the floor, they must wait a certain period until they are reasonably certain their partner will not take the floor, and this period would be related to the average FTO of their partner in the conversation. The observed increase in pause duration with increasing levels of noise is consistent with and similar in magnitude to the increase in average FTO observed with increasing levels of noise.
As with FTOs, we included four other predictors when fitting the GLMM to the pause observations. These predictors were based on the articulation rate and number of syllables of the IPUs immediately prior to or following the pause. All four predictors were found to be statistically significant. Pre-pause IPUs with fewer syllables and post-pause IPUs with more syllables were both associated with longer pause durations. This is consistent with a talker using a pause duration to plan their next utterance. Faster articulation of the pre-pause IPU and slower articulation of the post-pause IPU were both associated with longer pause durations. Since faster articulation provides less time for planning, the observation related to the articulation rate of the pre-pause IPU is consistent with the pause being used to plan utterances. An explanation for the relationship between the post-pause articulation rate and pause duration is not clear.
In the noise conditions, where difficulty is increased compared to quiet, one might expect that the rate of pauses should increase. However, the opposite was observed. A potential explanation is that the presence of noise acts, in general, as a stressor, leading talkers to reduce pauses. The analysis here of the NH talkers in Sørensen et al. (2021) showed they increased their rate of articulation, which would not aid intelligibility but is consistent with trying to communicate more quickly. Although articulation rates of both groups of talkers in the present study decreased, it remains likely that the noise acted as a stressor. Compared to the other noise conditions, the rate of pauses produced by HI talkers increased in the most challenging condition. As discussed above, NH talkers produced shorter utterances in this condition. Thus, they may have taken the floor less often when a turn-relevant transition occurred, leading to more turn continuations after longer pauses by the HI.
Age Versus Hearing Loss
The HI participants recruited for this study were much older than the NH participants in this study. Thus, age, in addition to hearing loss, may also have had an impact on our results. In addition to potential age-related changes in hearing, the difference in age between the two groups may have created an environment with different social norms than would be present for conversations between talkers of a similar age. The aim of the present study was to investigate the effect of noise on the timing of turn taking in HI listeners. This study was not designed to disentangle the effects of hearing loss and age. We recruited participants to be homogenous within hearing status groups to reduce variability from different degrees of hearing loss. However, a small age span within the HI group allowed us to perform some preliminary investigations of the relationship between our objective measures and the age of the participants. We added age as a predictor in all the mixed-effects models but found no statistically significant effect of age on any of the objective parameters we analyzed in this article. However, this null result should not be taken as evidence against age as a factor. Further work is needed to investigate and disentangle any potential effects of age and hearing loss.
Reactive Versus Adaptive Changes in Behavior
While a wide range of changes in behaviors were observed in both groups of talkers in the present study, due to the interactive nature of the conversation, it is challenging to disentangle cause from effect. As discussed above, many of the changes in behavior that we have observed can be seen as either a reactive behavior of a talker in response to the difficulty they are experiencing themselves or an adaptive behavior in response to the difficulty they perceive their partner to be experiencing. Nevertheless, reasonable assumptions regarding the differences between groups (e.g., that HI participants experience more difficulty understanding speech in noise than their NH partners) and the differences in patterns observed across studies can be used to disentangle some of these effects.
Barthel and Sauppe (2019) found that people planned speech responses in parallel with processing their interlocutor's turn, despite the increased cognitive demands demonstrated by increased peak and mean pupil dilation responses as well as longer peak latencies. The authors argued that, in conversation, people optimize for fast response times at the expense of increased processing load. Previous studies have found that dispreferred responses are associated with turn starts that occur after longer intervals (Bögels, Kendrick, et al., 2015; Kendrick & Torreira, 2015). Comparing the results of the present to previous studies (Heldner & Edlund, 2010; Levinson & Torreira, 2015; Norwine & Murphy, 1938), the FTO distributions appear quite similar across English, Dutch, Swedish, and Danish. For yes–no responses, turn-taking has been found to have a universal pattern across languages and cultures (Stivers et al., 2009). Interlocutors who exhibit short FTOs are perceived to be more connected with their conversational partners (Templeton et al., 2022). Together, this evidence suggests that the timing of turns is a socially important aspect of conversation. The results of the present study and others (e.g., Sørensen et al., 2021; Watson et al., 2020) demonstrate that, in more challenging conditions, the distribution of FTOs widens and shifts towards more positive values. Thus, in challenging conditions, changes in talker behavior that reduce difficulty would have an opposite effect on FTO distributions, and these changes could also be seen as reactions or adaptations that are conducted to achieve more smooth turn-taking (i.e., producing FTOs within some target range).
Several metrics of conversational behavior that have been investigated here are interrelated. For example, an increase in IPU duration should lead to an increase in the turn duration, decreasing the rate of floor transfers. Similarly, the rate and duration of pauses would also influence turn length. However, the behavior of one talker also influences the behavior of their partner. Thus, while the metrics we present may not be independent, the relationship between them is complex and not always straightforward.
Conclusion
In this study, we investigated the effects of noise and hearing impairment on conversational dynamics between pairs of NH and HI interlocutors. The interlocutors were separated from each other in two booths while they completed a spot-the-difference task, either in quiet or in the presence of multitalker babble presented at three noise levels: 60, 65, and 70 dBA SPL. Talkers decreased their speech rates and increased their speech levels with increasing noise levels. We found that in noise, the distributions of FTOs of both NH and HI interlocutors shifted towards more positive values and increased in breadth, suggesting the participants experienced increased difficulty and/or a decreased saliency of turn-end prediction cues. The FTO distributions of the HI talkers were broader than those produced by their NH partners. In general, both groups of talkers increased their IPU durations in noise. However, in the most challenging noise condition, the NH talkers produced IPUs with durations and an average number of syllables that were similar to what they produced in quiet. Unlike previous studies that have observed an increase in articulation rates by NH partners when conducting a similar task in noise, both the HI and NH talkers reduced their rates of articulation. A comparison of the FTO distributions produced by NH talkers conversing with HI talkers to those observed in previous studies involving only NH participants suggests the NH talkers experienced more difficulty when conversing with an HI talker. Thus, it is not clear to what extent the observed changes in the behavior of the NH participants in noise are a result of adaptations to ease the difficulty their HI partner experienced or the increased difficulty the NH participants experienced in conducting a conversation with an HI partner.
Studying conversational interactions between people is important when trying to understand the difficulties HI people experience in everyday communication and to help develop hearing-assistive technologies that can alleviate some of their difficulties. The results of the current and previous studies suggest that measuring some aspects of speech, such as the timing of turn taking, could be a promising approach for unobtrusively measuring communication difficulty when talkers are exposed to challenging conditions.
Supplemental Material
sj-docx-1-tia-10.1177_23312165241296073 - Supplemental material for Conversational Dynamics in Task Dialogue Between Interlocutors With and Without Hearing Impairment
Supplemental material, sj-docx-1-tia-10.1177_23312165241296073 for Conversational Dynamics in Task Dialogue Between Interlocutors With and Without Hearing Impairment by A. Josefine Munch Sørensen, Thomas Lunner and Ewen N. MacDonald in Trends in Hearing
Footnotes
Declaration of Conflicting Interests
The author(s) declared no potential conflicts of interest with respect to the research, authorship, and/or publication of this article.
Funding
The author(s) disclosed receipt of the following financial support for the research, authorship, and/or publication of this article: This work was supported by William Demant Fonden (grant number 16-3968).
Data Availability Statement
The data analysed in this study has been made available on Borealis (Sørensen & MacDonald, 2024).
Supplemental Material
Supplemental material for this article is available online.
References
Supplementary Material
Please find the following supplemental material available below.
For Open Access articles published under a Creative Commons License, all supplemental material carries the same license as the article it is associated with.
For non-Open Access articles published, all supplemental material carries a non-exclusive license, and permission requests for re-use of supplemental material or any part of supplemental material shall be sent directly to the copyright owner as specified in the copyright notice associated with the article.