
Abstract
This study provides a framework for measuring conversational dynamics between conversational partners (interlocutors). Conversations from 20 pairs of young, normal-hearing, native-Danish talkers were recorded when speaking in both quiet and noise (70 dBA sound pressure level [SPL]) and in Danish and English. Previous studies investigating the intervals from when one talker stops talking to when the next one starts, termed floor-transfer offsets (FTOs), suggest that typical turn-taking requires interlocutors to predict when the current talker will finish their turn. We hypothesized that adding noise and/or speaking in a second language (L2) would increase the communication difficulty and result in longer and more variable FTOs. The median and interquartile range of FTOs increased slightly in noise, and in L2, there was a small increase in interquartile range but a small decrease in the median of FTO durations. It took the participants longer to complete the task in both L2 and noise, indicating increased communication difficulty. The average duration of interpausal units, that is, units of connected speech surrounded by silences of 180 ms or more, increased by 18% in noise and 8% in L2. These findings suggest that talkers held their turn for longer, allowing more time for speech understanding and planning. In L2, participants spoke slower, and in both L2 and noise, they took fewer turns. These changes in behavior may have offset some of the increased difficulty when communicating in noise or L2. We speculate that talkers prioritize the maintenance of turn-taking timing over other speech measures.
Traditionally, hearing research involving speech has focused mainly on experiments where either speech perception or production is measured in isolation. However, conversation is a complex collaborative effort involving an overlap between comprehension and production, along with feedback and adaptation processes that occur both within and between interlocutors (i.e., conversational partners). These adaptations can include responses to the environment and each other’s behavior, such as the opportunity to repair errors by signaling difficulties in understanding (Schober & Clark, 1989; Wilson & Wilson, 2005). While the field of conversational analysis has investigated many aspects of interactive communication, it has traditionally focused on conversations conducted in favorable acoustic environments with normal-hearing (NH) interlocutors. However, recent studies have started to investigate how some factors, which are known to affect speech intelligibility, influence conversational behavior (e.g., Aubanel et al., 2011; Beechey et al., 2018, 2019, 2020; Hadley et al., 2019). The motivation for the present study was to investigate if more challenging communication conditions influenced the timing of turn-taking in conversation.
The fundamental organization of a conversation is based on a structure where people take turns in an alternating fashion with each other. The timing in turn-taking can be quantified by the floor-transfer offset (FTO), which is defined as the interval from when one person stops talking to when the next person starts talking. This interval can either be negative, indicating an acoustic overlap of the interlocutors’ speech signals, or positive, indicating an acoustic gap between the speech signals. The FTO distribution from Levinson and Torreira (2015) can be seen in Figure 1 and is representative of the distributions that have been observed in other studies (e.g., Aubanel et al., 2011, Brady, 1968; Heldner & Edlund, 2010; Norwine & Murphy, 1938; Stivers et al., 2009). In general, these distributions are unimodal and right-skewed, with a peak around 200 ms.

Distribution of floor-transfer offsets (FTOs) from about 38 hr of spontaneous dialogue in English from The Switchboard Corpus taken from Levinson and Torreira (2015). Bin width = 100 ms. Data have been adapted to show the density instead of frequency of FTOs.
To achieve the FTOs observed in these studies, it has been argued that talkers predict when interlocutors will end their turns, and this is supported by the results from many different studies. First, the latency of speech production is larger than the modal response times observed in FTO distributions. Preparing to articulate a single word takes about 600 ms and well over one second for multiword utterances (Indefrey & Levelt, 2004; Magyari et al., 2014). When investigating the timing of in-breaths prior to answers, Torreira et al. (2015) observed that when preparing for a short response, participants answered on residual air, whereas for longer responses, they inhaled, and the average in-breath timing was 15 ms after the end of the questioner’s utterance. They argue that because initiating inhalation takes 140–320 ms (Draper et al., 1960), this implies that the duration of the response was planned during an interlocutor’s utterance. Bögels et al. (2015) studied event-related brain potentials from electroencephalogram data during an interactive quiz. They manipulated the placement of the critical information for answering quiz questions either midway through or near the end of a sentence. In one condition, participants had to respond to the questions, and in the other, they listened only to the sentences. Compared to passive listening, when listeners had to respond, positivities in the event-related brain potentials at the point of the critical information (either early or late in the question) were observed in brain areas that are associated with language production. This suggests that people start planning their response as soon as they can. Further, Bögels et al. (2015) found evidence of switches in attentional resources between comprehension and production in the conditions where the critical information was presented early in the question (i.e., when participants started planning their response in parallel with listening to the remainder of the question). When conducted as a divided attention task, Boiteau et al. (2014) found evidence of deteriorated visuomotor tracking-performance near the end of an interlocutor’s turn or the start of one’s own turn, corresponding to the points in conversation that are most cognitively demanding. For further review of the evidence of response planning and a model of comprehension and production during turn-taking, see Levinson and Torreira (2015).
Some studies have identified acoustic cues that are used to predict turn ends. De Ruiter et al. (2006) asked participants to press a button when they anticipated that a talker’s turn would end when listening to excerpts from recorded conversations that had been processed in different ways. By comparing the prediction performance across the conditions, they demonstrated that both lexicosyntactic and prosodic cues are used to predict turn ends. Gravano and Hirschberg (2011) identified several acoustic cues that they associated with turn yielding. They compared utterances that led up to turn-switches with utterances leading up to turn holds. They found the following cues to predict turn-switches well: a point of textual completion (i.e., the point where an utterance can be grammatically complete), a reduction in intensity level, a reduction in pitch level, a falling or rising intonation at the end of an utterance, a reduced lengthening of the final words in an utterance, as well as increased vocal jitter, shimmer, and noise-to-harmonic ratio. They further found that the larger the number of these cues that were present in the utterance, the more likely it was to yield a turn-switch.
As outlined earlier, to respond rapidly and maintain fluid turn-taking in conversation, listeners must simultaneously process the incoming acoustic signal to understand what is being said, plan a response, and predict when their interlocutors will end their turns. In the present study, we hypothesized that reducing processing resources by making conversation more challenging would alter turn-taking behavior. In this study, we tested this by manipulating the degree of expected communication difficulty. Conversations were recorded both in the absence and presence of background noise, with talkers speaking both in their native language (L1; Danish) and in a second language (L2; English). Given that interlocutors have limited processing resources, we hypothesized that making conversation more challenging would alter the FTO distribution. For example, listening to speech in the presence of noise or in a second language may require increased listening effort, reducing the resources available to plan speech and predict turn ends. This could both delay the articulation of responses (shifting the FTO distribution to the right) and increase the variability in the timing of the floor transfers (broadening the FTO distribution). In isolation, while speaking in noise should not increase the difficulty of speech planning, speaking in L2 may be more difficult (e.g., García Lecumberri et al., 2017; Wester et al., 2014), resulting in longer and more variable FTOs. The ability to predict the timing of turn ends may also be reduced in noise or in L2. Previous studies have demonstrated that listeners use both lexicosyntactic and prosodic cues to predict the timing of turn ends (Brusco et al., 2020; De Ruiter et al., 2006; Gravano & Hirschberg, 2011; Riest et al., 2015). Compared to when listening in L1, processing the lexicosyntactic cues used to predict turn ends may be more difficult in L2. Depending on how similar they are between languages, the saliency of the prosodic cues may or may not differ between L1 and L2 (e.g., Brusco et al., 2020). Thus, the impact of L2 on predicting the timing of turn ends may vary between languages. Compared to when listening in quiet, listening in noise may reduce the saliency of both lexicosyntactic and prosodic cues. Increased variability in predicted timing of turn ends, due to noise or conversing in L2, could lead to more variable timing of floor transfers (i.e., a broader FTO distribution).
Methods
Participants
In this study, 40 NH native-Danish talkers (µage = 26 years, σ = 3.7 years, 12 women) participated in pairs (4 mixed-gender pairs). Participants within each pair knew each other well. Standard audiograms were measured for all participants ensuring their hearing threshold levels were below 20 dB HL between 125 Hz and 8 kHz. All participants reported being “comfortable” in English and had all participated in at least one university-level class taught in English. All participants provided informed consent, and the experiment was approved by the Science-Ethics Committee for the Capital Region of Denmark (reference H-16036391). The participants were compensated for their time.
Conversational Task and Conditions
Dialogue was elicited by conducting the DiapixUK task (Baker & Hazan, 2011), a spot-the-difference task in which pairs are given almost identical cartoon pictures, and they have to work together to find the differences between them. Using this task provides several advantages. First, the completion time can be measured. Second, the content is more limited than free conversations, making the conversational content more homogenous across pairs. Finally, the task requires both talkers to communicate, potentially leading to both talkers speaking more equally compared to free conversation, where one talker might dominate the conversation.
In total, the participants conducted the DiapixUK task in four different conditions: in L1 and L2, both in quiet and in a noise background, consisting of a six-talker speech-shaped noise (ICRA 7, Dreschler et al., 2001).
Setup
The talkers sat in two separate sound-treated booths and communicated over headphones and microphones. The talkers were unable to see each other during the experiment. Thus, the participants had access only to acoustic turn-taking cues. Each participant wore Sennheiser HD650 open headphones and Shure WH20 headset microphones placed close to the mouth at the position recommended by the manufacturer.
Recordings
An operator sat outside the booths monitoring the experiment and could communicate with the participants through an operator microphone. In the headphones, the participants heard a mix of (a) themselves, (b) their interlocutor, (c) the operator (only if the operator needed to talk), and (d) the background noise (only in the noise conditions). The signals from this headphone mix, the individual Shure microphones, and the operator microphone were recorded on four separate channels using an RME Fireface 802 soundcard. Each signal was sampled at 48 kHz with a bit depth of 24, using MATLAB 2016a. All the recordings for which we have received consent have been made publicly available (Sørensen et al., 2018).
Calibration
The noise was calibrated to an average presentation level of 70 dBA SPL in the headphones. The level was calibrated by placing the headphones on a B&K 4149 microphone preamplified by a B&K 2619 (hereafter called the headphone coupler) connected to a B&K 2636 sound level meter (SLM). As the level of the ICRA7 noise fluctuates continuously, a 10-s integration time was used in the SLM to obtain an overall presentation level of 70 dBA SPL.
The levels of both microphones were calibrated such that the broadband, A-weighted levels presented over the headphones were the same as if their interlocutor was 1 m away from them in the same room. To do this, a Nor140 SLM was placed 1 m from a talker, and the headphones were placed on the headphone coupler (connected to the B&K SLM). While a talker produced a prolonged vowel, the gain from the headset microphone was adjusted in RME TotalMix such that the A-weighted levels measured from both SLMs were equal.
Procedure
Prior to the test session, a two-step training session was conducted. First, to familiarize participants with the task, they conducted a Diapix task using pictures from the original Diapix corpus (Van Engen et al., 2010) while facing each other outside the audiometric booths and under the operator’s supervision. Following this, they moved to the two separate booths and conducted a second Diapix task, again using different pictures from the original Diapix corpus. During this part of the training, background noise was added to the communication channel.
The test session consisted of three blocks (repetitions) of four conditions consisting of the combinations of conversing in either their first (L1; Danish) or second language (L2; English) in quiet or noise. The order of the conditions was randomized within each block. After each block, the participants had a break. For each condition in each block, the pairs looked for 10 differences in a pair of DiapixUK pictures. The participants were not instructed in any particular strategy or encouraged to solve the task as quickly as possible. They were only instructed that they had 10 min to find 10 differences and that the experiment would proceed to the next condition if not completed within that time frame. However, all pairs were able to complete the task in less than 10 min in every condition. The 12 image pairs of the DiapixUK were counterbalanced across conditions and pairs. Thus, over the entire experiment, each DiapixUK image pair appeared five times in each condition, and 12 conversations were recorded from each participant pair.
Analysis of Recordings
Each wave file was processed to automatically categorize and label the speech segments of each talker into different conversational categories following variations of the algorithms used by Heldner and Edlund (2010) and Levinson and Torreira (2015). An illustration of the categorization of conversational states can be seen in Figure 2.

Illustration of the classification of gaps, overlaps-within, overlaps-between, pauses, IPUs, and turns during conversations between Talker A and B. A person’s turn is measured from the onset of the IPU following a floor transfer to the offset of the IPU followed by a floor transfer. There are two floor-transfer offsets (FTOs): the overlap-between and gap.
First, the individual microphone tracks for each talker were processed to determine when each person spoke using Voice Activity Detection (VAD). The speech streams were buffered into segments of 5 ms with 1 ms overlap, and the root-mean-square (RMS) in each segment was computed. Based on a threshold value, segments were either labeled with 1 (speech) or 0 (no speech). The threshold value was determined individually for each talker in each conversation by hand. Following the procedure in Heldner and Edlund (2010), gaps smaller than 180 ms were bridged to minimize the risk of mistaking stop consonants for pauses between speech units. Any sound bursts shorter than 70 ms were set to 0 as they were assumed to be nonspeech (e.g., coughs).
Next, for each conversation, the binary speech/no-speech streams from the two talkers were fed into a conversational state classification algorithm developed for this study. The algorithm labeled speech into the following categories: gaps (joint silences of both talkers during a floor transfer), overlaps-between (overlapping speech during a floor transfer), overlaps-within (speech where the utterance of one talker is completely overlapped by speech from the other and there is no floor transfer), pauses (joint silence not followed by a floor transfer), interpausal units (IPUs; units of connected speech in which any included acoustic silences are less than 180 ms), and turns (sequences of IPUs by one talker surrounded by floor transfers). The FTO distributions were measured, along with the rate at which floor transfers occurred. Moreover, the rate at which overlaps-within occurred was measured. To verify that the state classification algorithm worked as intended, one conversation was manually labeled with the categories presented previously (and in Figure 2) and compared to the automated analysis to make sure they agreed. Further, approximately 60% of all the overlaps-within (3,210 out of the total 5,171) across the four conditions were manually annotated to investigate differences in those overlaps across conditions. In this process, it was confirmed that the algorithm had labeled the overlaps-within correctly.
To estimate the speech levels for each talker, the following procedure was used. First, the RMS of the headphone mix of noise-only segments in conversations carried out in background noise was calculated. Because the noise was presented at 70 dBA SPL, this RMS was used to calculate a conversion factor from dB full scale (FS) to dBA SPL for the headphone mix wav file. Next, for each talker, the recordings of conversations in quiet were examined to identify segments where only speech from that talker was present in the headphone mix. For these segments, the RMS from the headphone mix was compared to that from the talker’s close mic. Based on this and the previously calculated conversion factor for the headphone mix, a conversion factor from dB FS to dBA SPL was calculated for the talker’s close mic. Finally, the speech level for each individual was calculated by measuring the RMS recorded by the close mic for all the speech units excluding pauses, and the conversion factor was used to convert the RMS to estimated speech levels in dBA SPL.
In all conversations, the number of syllables produced by the individual talkers were computed using the Praat (Boersma & Weenink, 2017) script presented in De Jong and Wempe (2009) with default parameter settings. The algorithm detects syllable nuclei (the peak within the syllable) using measures of intensity and voicedness. It extracts the intensity and considers only peaks above a threshold corresponding to the median intensity over the whole sound file. Of these peaks, only the peaks that have a preceding dip of at least 2 dB with respect to the current peak are considered. Finally, to exclude voiceless consonants, the syllable nuclei are extracted by excluding unvoiced peaks found by the pitch contour. Using an interface between Praat and MATLAB 2020b, the Praat-detected syllable nuclei were extracted from Praat TextGrids for each person in each of their conversations. To estimate the articulation rate of each talker, the number of syllables identified using the Praat script was divided by the phonation time determined by the VAD described earlier.
Statistical Procedure
For analyzing the effects of noise, second language, and replicate on various measures, linear mixed-effects regression models were fitted to the variables of interest using the lme4 package in R (Bates et al., 2014). Unless otherwise stated, the starting model consisted of background (quiet, noise), language (L1, L2), and replicate (1, 2, 3) as fixed effects with up to third order interaction, and a random intercept varying among pair and person within pair, that is, the starting model was:

Results
Speech Production and Task Completion Time
The levels of speech 1 m from the talkers were estimated from the individual recordings and are plotted in Figure 3. The final selected model describing the speech level was as follows: speech level ∼ background + replicate + (1 | pair/person). The speech level increased by an average of 9.4 dB in noise, F(1, 437) = 6061, p < .001, but there was no effect of L2 on the speech level (the language factor was eliminated from the full model by the step function, F(1, 436) = 2.27, p = .132). There was a significant effect of replicate, F(2, 437) = 4.76, p < .01. A post hoc analysis showed that this effect was driven by a significant decrease of 0.46 dB between Replicates 1 and 3, t(437) = 3.07, p < .01. The average speaking level in noise was 67.5 dBA SPL, resulting in an average signal-to-noise ratio (SNR) of –2.5 dB.

Boxplots of average speech levels 1 m away from the talkers (in dBA SPL). The results are presented as averages across participants in the three replicates of the four conditions: quiet in first language (L1), quiet in second language (L2), noise in L1, and noise in L2. Here and in later plots, the boxplots show the 25th, 50th (median), and 75th percentile, and the whiskers indicate minimum and maximum observations. Outliers are observations above or below 1.5 times the interquartile range.
To estimate the reliability of the Praat script developed by De Jong and Wempe (2009) that was used to calculate the articulation rates, the number of syllables in three IPUs per replicate for all participants in all conditions were manually counted (MC) and compared to the number of syllables computed by the Praat script (PC). As a selection criterion, a person’s first three utterances in a conversation that Praat had detected to have a minimum of 0 and a maximum of 11 syllables were selected for the analysis. The lower bound was chosen because the seldom occurring ingressive “ja” (“yes”) in Danish does not have a syllable nucleus and will not be detected by the script as a syllable. The upper bound made it easier for the listener to maintain the syllables in memory when manually counting them. For L1 in quiet, L1 in noise, L2 in quiet, and L2 in noise, the average PC/MC ratios were 0.97, 0.97, 0.98, and 0.98 (with standard deviations of 0.077, 0.067, 0.079, and 0.081), respectively. A linear mixed-effects model showed that there was no effect of language, F(1, 475) = 2.03, p = .155, background, F(1, 475) = 0.06, p = .81, or interaction between the two factors: F(1, 475) = 0.04, p = .837, and no effect of person: F(1, 475) = 1.52, p = .218, on the ratios.
Boxplots of the articulation rates are depicted in Figure 4. The final selected model was as follows: articulation rate ∼ language + (1 + background + replicate | pair) + (1 + language | pair/person). An average decrease in articulation rate by 0.5 syllables/second in L2 compared to L1 was statistically significant, F(1, 39) = 302, p < .001.

Boxplots of articulation rates of the talkers measured in syllables/second in the four conditions: quiet in first language (L1), quiet in second language (L2), noise in L1, and noise in L2. Syllable nuclei were detected per person using the Praat script presented in De Jong and Wempe (2009) and were divided by the person’s phonation time.
The task-completion time, that is, the time it took each pair to find 10 differences between the Diapix, was measured. Figure 5 shows boxplots of the completion time in the four conditions and three replicates. A random intercept for the Diapix picture pairs was added to the starting model as the difficulty of the task could vary across Diapix picture pairs. The final model was as follows: completion time ∼ background + language + replicate + (1+ replicate | pair) + (1 | picture). There was a statistically significant training effect, that is, the average completion time decreased with replicate, F(2, 29.6) = 12.6, p < .001. A pairwise comparison post hoc analysis revealed a significant difference between the first and second replicate, t(20.5) = 3.91, p < .001, and between the first and third replicate, t(18.9) = 5.03, p < .001, but only a borderline significant decrease between second and third replicate, t(68.6) = 1.96, p = .054. During the experiment, the operator observed that over the course of the first block, pairs discovered that the primary differences between images often involved signs or colors. As a result, they changed the order in which they searched the images and became quicker at solving the task. The completion time in noise compared to quiet increased significantly by, on average, 31 s, F(1, 186) = 16.8, p < .001. Similarly, the task completion time increased significantly by, on average, 47 s in L2 compared to L1, F(1, 186) = 39.9, p < .001.

Boxplots of the time it took the pairs to complete the task in the three replicates of the four conditions: quiet in first language (L1), quiet in second language (L2), noise in L1, and noise in L2.
In summary, the participants spoke louder and took longer to complete the task in noise. When comparing L2 to L1, they spoke at the same level, but slower and took longer to complete the task. Finally, they completed the task faster in the second and third replicate compared to the first, and they spoke slightly softer in the third replicate.
Floor-Transfer Offsets
The overall hypothesis was that with increased processing demands, we would see a delay and more variability in the timing of people’s turn-taking. As a measure of centrality of the distribution, the median was used rather than the mean as FTO distributions are slightly positively skewed. For the same reason, the interquartile range (IQR) was used rather than the standard deviation as a measure of variability.
Kernel density plots (computed using geom_density from the ggplot2 R package) were computed for the FTOs in each condition pooled across all pairs (see Figure 6). Descriptive statistics of the distributions are provided in Table 1. As seen in Figure 6, the pooled distributions look highly similar. The final selected model for analyzing the median of FTOs was as follows: median FTO ∼ background + language + (1 + background | pair). There was a borderline significant increase of 21 ms in noise: F(1, 19) = 4, p = .06, and a significant decrease of 19 ms in L2: F(1, 439) = 9, p < .01. We observed that the proportion of overlaps during turn-taking increased in L2, F(1, 81.4) = 38.5, p < .001, contributing to the observed decrease in median FTO in L2.

Kernel density plots of the floor-transfer offsets (FTOs) pooled across pairs and replicates in the four conditions: quiet in first language (L1), quiet in second language (L2), noise in L1, and noise in L2. Negative FTOs indicate acoustic overlap of the two talkers, while positive FTOs indicate acoustic gaps.
Descriptive statistics of the floor-transfer offsets (FTOs) in ms in the four conditions: quiet in first language (L1), quiet in second language (L2), noise in L1, and noise in L2.

Note. IQR = interquartile range.
aModes are calculated by taking the max of Gaussian kernels computed using the density function in R.
Boxplots of the IQR are plotted in Figure 7, right panel. The analysis was done on log-transformed IQRs to meet the residual-normality assumption of the linear model. The final model for analyzing the IQR of FTOs was the following: log (IQR FTO) ∼ background + language + (1 + background | pair/person). There were significant increases in IQR in L2, 14 ms, F(1, 399) = 4.5, p < .05, and in noise, 41 ms, F(1, 39) = 15.6, p < .001. We computed the floor-transfer rate on a pair-level (see Figure 8). The final selected model describing the number of floor transfers per minute was the following: FT rate ∼ background + language + replicate +(1 + background + language + replicate | pair). The rate of floor transfers per minute decreased by 1.6 in noise, F(1, 19) = 18.3, p < .001, and by 2.6 in L2, F(1, 23) = 57.5, p < .001, and increased with replicate, F(2, 20.5) = 4,6, p < .05. There was a significant increase between Replicates 1 and 3 of 1.3 occurrences/minute, t(19.5) = –2.8, p < .05, and of 1 occurrence/minute between Replicates 2 and 3, t(22.3) = –2.31, p < .05.
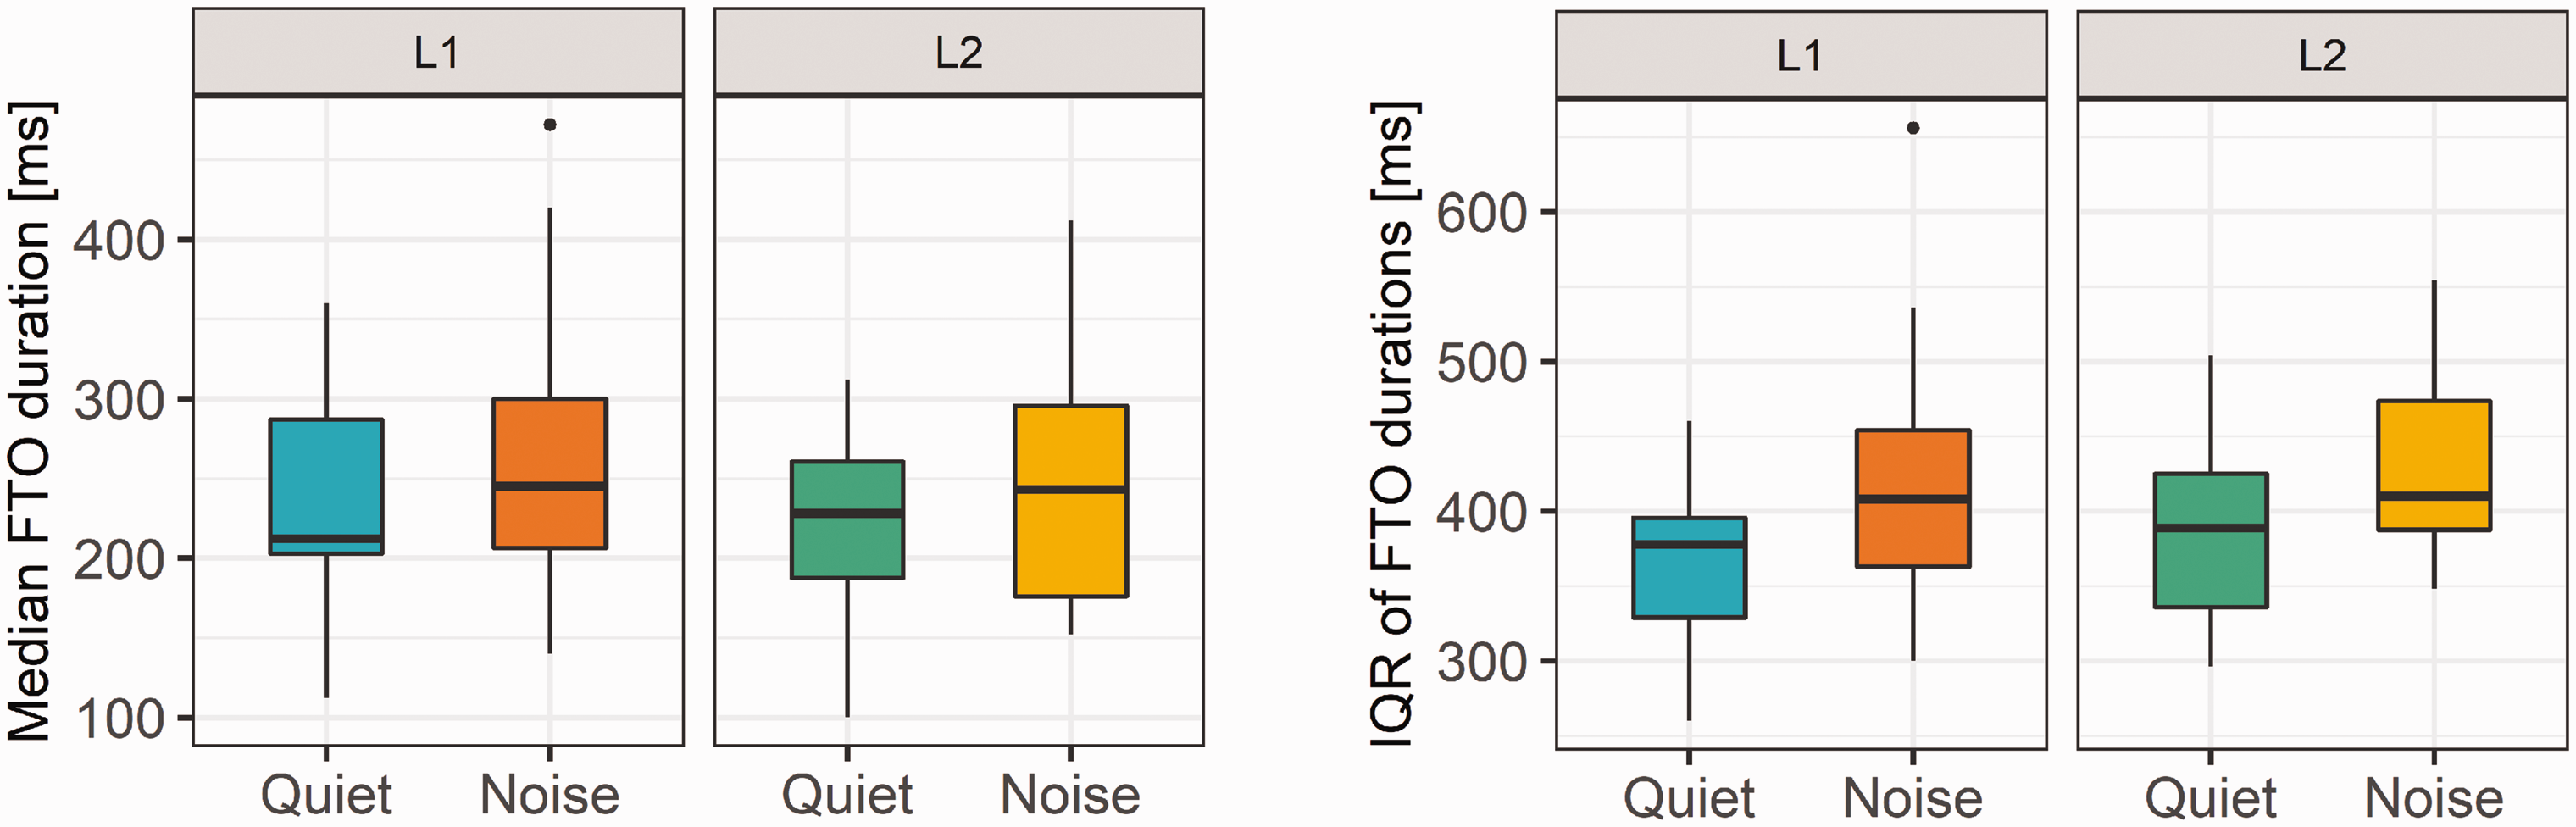
Boxplots of median FTO (left panel) and interquartile range of FTOs (right panel) in each of the four conditions: first language (L1) and language (L2) in quiet and noise.
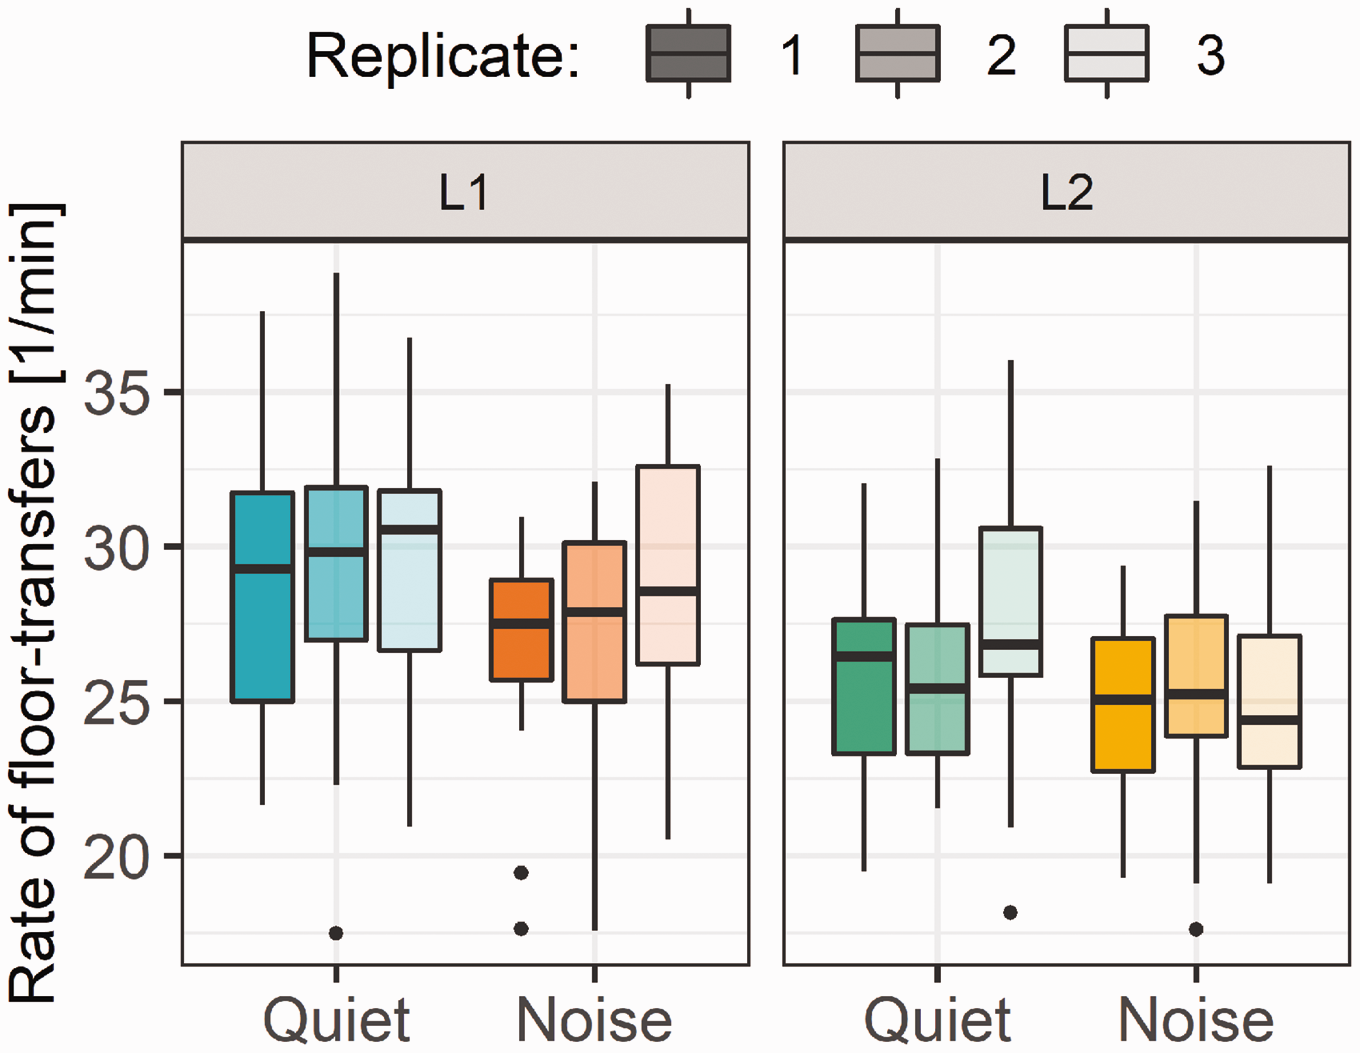
Boxplots of the number of floor transfers per minute in the four conditions: quiet in first language (L1), quiet in second language (L2), noise in L1, and noise in L2.
IPU Durations
The final model for analyzing the duration of IPUs was as follows: median IPU ∼ background + language + (1+ background+ language+ replicate | pair/person). There was a statistically significant increase of the median IPU duration of about 18% in noise, F(1, 50) = 86.7, p < .001, and of about 8% in L2: F(1, 40) = 15.4, p < .001. The increase in median duration appears to be driven by a general lengthening of all IPUs rather than just a reduction in the frequency of very short (e.g., one syllable) IPUs. This is indicated by a shallower slope of the pooled IPU durations across pairs as seen in Figure 9, left panel, where the density has been log-transformed to more easily compare the distributions.

Kernel density plots with a logarithmic y-axis of the IPUs pooled across pairs and replicates (left panel), and boxplots of median durations of IPUs (right panel) in the four conditions: quiet in first language (L1), quiet in second language (L2), noise in L1, and noise in L2.
Overlaps-Within
The duration of overlaps-within, that is, utterances from talkers that temporally occur completely within utterances of their interlocutors (see Figure 2), had a small but significant increase of 15 ms in L2, F(1, 438) = 5.4, p < .05 (see Figure 10, left panel). The analysis was performed on log-transformed overlaps-within durations, and the final model was as follows:

Boxplots of durations of overlaps-within (left panel) and number of overlaps-within per minute (right panel) in the four conditions: quiet in first language (L1), quiet in second language (L2), noise in L1, and noise in L2.
To further investigate possible differences across the four conditions, we listened to a subset of the overlaps-within (3,210 out the total of 5,171) across the four conditions and annotated them using a combination of the categories introduced in Gravano (2009), Levinson and Torreira (2015), and Schegloff (2000). The following categories were used and are not mutually exclusive (e.g., an overlap-within could feature an attempt to take a turn and also exhibit repeated syllables/words):
Simultaneous start: Overlap occurs within 200 ms from the onset of the overlapped talker’s utterance Verbal backchannels or agreements: for example, “yeah,” “right,” “uh-huh” Nonverbal backchannel: for example, laughter Continuation: The overlapping interlocutor continues his previously acoustically terminated turn while the other talker took the floor before the onset of the overlap-within Attempt to take the turn Incomplete turns: turns ending midword/midutterance Repeated syllables/words: repetition of words or syllables during or close to the overlap interval.
In Table 2, the pooled frequency of the different overlap-within features can be found. Mixed-effects models with language and background as fixed effects with interaction and pair as random intercept were fitted to six of the seven features. Again, the step function in R was used to reduce the models, and an ANOVA analysis was performed with Satterthwaite-approximated denominator degrees-of-freedom (df) corrected F-tests for the fixed effects.
Frequency of overlap-within features, hand labeled from judging 3,695 overlaps-within (N L1 in quiet = 801, N L2 in quiet = 801, NL1 in noise = 803, N L2 in noise = 805).

There was no difference between conditions in the frequency of verbal backchannels. As the occurrence of nonverbal backchannels was very rare, there were many conversations in which this did not occur, and therefore no statistical test was performed. In noise, there were significantly more attempts to take the turn, F(1, 58) = 25.8, p < .001, incomplete turns, F(1, 59) = 20.6, p < .001, and repeated words/syllables, F(1, 58) = 7.9, p < .01. In L2, a decrease in the rate of simultaneous starts bordered significance: F(1, 58) = 3.86, p = .054, and there were significantly more repeated words/syllables, F(1, 58) = 14, p < .001. There was a significant interaction between background and language on the frequency of continuations, F(1, 57) = 6.93, p < .01. A post hoc analysis showed that there were fewer continuations in noise in L1 than in quiet in L1 and significantly fewer continuations in quiet in L2 than in L1.
FTO Versus IPU Duration
In Figure 11, the distribution of FTOs for different quartiles of IPU durations preceding floor transfers (left panel) and following floor transfers (right panel) is plotted. For the IPUs preceding floor transfers, the tendency is that the longer their duration, the shorter and less variable the FTO was, indicated by the narrower distribution and slightly shifted peak. For the IPUs following floor transfers, we see the opposite: The shorter in duration they were, the shorter and less variable the FTO, indicated by the narrower distribution and slightly shifted peak. A statistical analysis of the changes in median and IQR of FTOs for the four quartiles of IPU durations before and after floor transfers in the four conditions confirmed this trend (see supplementary materials).

Distribution of FTOs for the four quartiles of preceding IPU duration (left panel) and following IPU duration (right panel) across all conditions.
Discussion
The goal of this study was to investigate how turn-taking behavior changes when communication becomes more challenging. Here, two manipulations were used to increase the difficulty of communication: the presence of a background noise and conversing in L2. Talker pairs were asked to find 10 differences between pairs of almost identical pictures. As expected, participants took longer to complete the task both in the presence of noise and when talking in their second language, indicating that both manipulations increased the difficulty of communication. While both noise and L2 influenced several other aspects of communication behavior, the effects differed for some of the measures between the two manipulations.
In Figure 2, we illustrated the temporal dynamics between interlocutors in a dialogue. We presented data from three of these temporal dynamics in this study: IPUs, FTOs, and overlaps-within. We define IPUs as units of connected speech by the same person surrounded by silence of min. 180 ms. FTOs are durations of turn-takings measured from when the first person stopped talking to the next person started. Overlaps-within are talkspurts from one person that temporally occur completely within IPUs of their interlocutor and, thus, do not involve a floor transfer. Compared to when they spoke in quiet, talkers in noise increased their speech level and produced longer IPUs. The FTO distributions of conversations in noise were slightly broader, and the peak was slightly shifted to the right, with medians that were approximately 21 ms longer. The rate at which floor transfers occurred decreased in noise. There was no change in the rate at which overlaps-within occurred in noise, but they consisted of more attempts to take a turn, more incomplete turns, and more repeated syllables. In L1, there were fewer continuations in noise than in quiet. The frequency of verbal backchanneling in these overlaps-within did not increase compared to the conversations in quiet.
Compared to when they spoke in their native language, talkers in L2 spoke slower, floor transfers occurred at a reduced rate, and they produced longer IPUs. The FTO distributions in L2 were slightly broader and were shifted slightly to the left, with medians that were approximately 19 ms shorter. The rate as well as the duration of overlaps-within increased in L2. For these overlaps-within, there were fewer simultaneous starts, and the frequency of utterances with repeated syllables increased. In quiet, there were fewer continuations in L2 compared to L1.
Timing of Turn-Taking
While conversing, listeners must simultaneously process the incoming acoustic signal to understand what is being said, plan a response, and predict when their interlocutors will end their turns. Given that interlocutors have limited processing resources, we hypothesized that making conversation more challenging would alter turn-taking behavior, which could be observed in changes in the FTO distribution. For example, increased listening effort could reduce the resources available to plan speech and predict turn ends, shifting the FTO distribution to the right and/or broadening the FTO distribution. Further, the perceptual saliency of the acoustic cues used to predict the timing of turn ends may be affected by both noise and L2. This could also increase the variability in the timing of floor transfers, resulting in a broader FTO distribution.
We observed slightly longer FTOs of 21 ms in noise compared to quiet, and the IQR of FTOs increased by 41 ms in noise. In L2, the IQR increased slightly by 14 ms. However, the median of FTOs decreased by 19 ms in L2, opposite to what we hypothesised. While three of the four observations were in the hypothesised direction, the effects were relatively small.
While the present study was designed to investigate potential changes in the distribution of FTOs in response to the presence of noise or conversing in a second language, other factors can be considered. Roberts et al. (2015) investigated factors that influenced FTO duration and found that FTOs were shorter when replies were shorter, and for interactions that involve a response action, the FTO was shorter in replies to utterances that were longer in duration. Both of these observations suggest that FTOs are affected by planning and/or listening effort. For the first observation, shorter replies should require less motor planning and lead to shorter FTOs. The second observation, that longer utterances provide more time to complete speech and response planning, is somewhat counterintuitive. It has been estimated that both speech understanding and speech planning are 3 to 4 times faster than the articulation of speech (Calvert, 1986; Wheeldon & Levelt, 1995). This could be suggest that, the rate of speech communication is limited by the rate of articulation, and not planning or understanding. As a result, a longer IPU from one’s interlocutor can provide more time to complete speech understanding and response planning as those processes are faster than the rate of articulation produced by the interlocutor. Based on this, replies in response to long IPUs should occur quicker (i.e., with shorter FTOs) than those in response to short IPUs, as observed by Roberts et al. (2015), and we observed longer IPUs both in noise and L2. For the results in the present study, we conducted a similar investigation by comparing FTOs before and after IPUs of different durations. As was seen in Figure 11, the overall pattern was that when talkers produced longer IPUs, their interlocutors were more “on-time” with their responses, and there was less variability in this timing, likely because they had more time to plan their response. Further, for IPU durations after floor transfers, shorter “response” IPUs resulted in shorter and less variable FTOs, likely because shorter IPUs require less planning. Thus, this analysis suggests that FTO distributions are influenced by the processing demands of speech understanding and speech planning.
A potential explanation for why we did not observe large changes in FTO distributions in the present study was that the more difficult conditions were not sufficiently challenging. On average, it took participants longer to complete the spot-the-difference task in the more challenging conditions (approximately 10% longer in noise, 15% longer in L2, and 25% longer in both), which suggests that these manipulations did, indeed, have an effect on communication. In noise, participants spoke significantly louder, and in L2, they spoke significantly slower. While the manipulations increased the completion time and changed aspects of their speech production, they may not have been challenging enough to see large delays or increases in the spread in turn-timing. Aubanel et al. (2011) found that when interlocutors conversed in the presence of a background conversational pair, they delayed their responses. They further observed both increased speech levels as well as decreased speech rates in the presence of a background pair. Moreover, in conversations between NH and hearing-impaired interlocutors, Sørensen et al. (2020b) found that both participant groups had delayed and more variable responses, as well as decreased speech rates and increased speaking levels in the presence of background noise. Beechey et al. (2018) concluded that acoustic-phonetic speech production changes are most sensitive to low to moderate degrees of communication effort rather than higher-level, turn-taking behavior. Thus, it is possible that while the challenges faced in this experiment were sufficient to alter other aspects of speech communication, they may not have been sufficient to observe large changes in turn-timing between interlocutors.
However, a second possibility for why we did not observe the larger hypothesized changes in the FTO distributions is that some of the other changes in speech production and conversational behavior that was observed in the more challenging conditions may have reduced processing demands. For example, when speaking in L2, talkers spoke slower, produced longer IPUs, and floor transfers occurred at a slower rate compared to L1. Wester et al. (2014) and García Lecumberri et al. (2017), also found that speakers of L2, when solving the Diapix task, adopted more hesitant speech with a lower proportion of speech turns, a slower speech rate, more elongations as well as more pauses. When speaking in noise, talkers increased the length of their IPUs and floor transfers occurred at a slower rate compared to in quiet. As described earlier, because the rate of speech articulation is slower than the rates of speech understanding and planning, longer IPUs can reduce processing load. Further, the rate at which floor transfers occurred was lower in noise than in quiet. Overall, these adaptations could reduce processing load for both the talker and the listener, allowing the talkers to achieve turn-taking timing that is more similar to that achieved in quiet in their first language.
Bögels et al. (2015) found that the participants in their quiz game started the planning of their responses as soon as they received the critical information. However, even if talkers may be able to reply well before their interlocutors have finished their turns, they may wait to take their turn at a specific, more socially appropriate time. It has been shown that people are sensitive to the timing of turn-taking, and FTO distributions are similar across languages and cultures (Kendrick & Torreira, 2015; Levinson & Torreira, 2015; Sacks et al., 1974; Stivers et al., 2009). For example, Kendrick and Torreira (2015) and Roberts et al. (2011) found that small increases in gap length are more associated with negative/dispreferred responses. Thus, we speculate that maintaining the timing of turn-taking behavior is important to achieve socially appropriate interactions, and when faced with more challenging communication conditions, interlocutors modify other aspects of their speech production and interaction that may help them to maintain the timing of their turn-taking behavior.
IPU Durations
In the present study, we define IPUs as connected portions of speech that are separated by acoustic silences with durations of at least 180 ms. In noise and L2, talkers increased the duration of their IPUs, with the median length increasing by approximately 18% in noise and 8% in L2. Further, the observed increase in median duration appears to be driven by a general lengthening of all IPUs rather than just a reduction in the frequency of very short (e.g., one syllable) IPUs.
The increase in IPU duration may be due to an increase in filler words. Clark and Fox Tree (2002) outline how talkers predict upcoming delays in their speech planning and prepare to insert filler words, such as “uh” for short delays or “um” for longer delays, as well as prolonging syllables to signal they are continuing an ongoing delay. These filler words occur both at the phrase boundary and midutterance. When produced midutterance, talkers plan when to insert the filler words into their sentences. They argue that a talker can use filler words midsentence to signal that they want to keep the floor despite a delay in speech planning. We speculate that in challenging conditions where speech planning may be delayed, interlocutors can also make use of filler words at the start of their turn to achieve socially acceptable timing of floor transfers.
Other studies of conversations have observed that in noisier and more complex acoustic environments, talkers increase IPU durations, consistent with a strategy of holding the floor (Beechey et al., 2018; Sørensen et al., 2020b; Watson et al., 2020). As was found earlier, holding the floor for longer may consequently provide both the talker and the listener with more time to prepare their responses. Beechey et al. (2018) argued that a holding-the-floor (p. 25, Section 4.1, 4th paragraph) strategy by increasing utterance durations and speaking faster (which was observed in their study) may ease communication for the individual, because it reduces the need for the talker to listen in adverse environments. In contrast, Hadley et al. (2019) found that interlocutors shortened their utterances with increasing noise level. They argue that the differences observed between their results and other studies may be due to task differences. In Hadley et al. (2019), interlocutors held free conversations based on predefined topics, whereas in Beechey et al. (2018), Sørensen et al. (2020b), and the present study, interlocutors collaboratively solved a puzzle. However, Watson et al. (2020) observed an increase in IPU duration in noise both when interlocutors held free conversations and solved the DiapixUK task together. Unlike the other studies where background levels were held relatively constant over the entire course of a conversation, in Hadley et al. (2019), the average background level changed randomly between 54, 60, 66, 72, and 78 dB SPL every 15–25 s. One could speculate that while talkers may adopt a “holding-the-floor” strategy in relatively constant background noise levels, they may adopt a strategy that is more flexible when communicating in more variable background noise (e.g., Aubanel et al., 2012; Aubanel & Cooke, 2013). However, we note that in Hadley et al. (2019), acoustic pauses in speech streams that were shorter than 1.25 s were bridged. Thus, they defined utterances as portions of speech separated by pauses of at least 1.25 s. In contrast, the present study and some others (Heldner & Edlund, 2010, Watson et al., 2020) used an acoustic pause criterion of 180 ms to define utterances. Similarly, in Beechey et al. (2018), a 300-ms criterion was used. Using the criterion of 1.25 s as was used by Hadley et al. (2019), we reanalyzed the recordings from the present study and those from Watson et al. (2020) and found that utterance durations decreased in noise (as opposed to increasing when a 180-ms criterion was used). When inspecting the segmentation produced when using a criterion of either 1.25 s or 180 ms, we find that, for our recordings, the shorter criterion is more sensitive at classifying connected versus unconnected utterances. Many conversational floor transfers remain undetected when using the longer criterion, because individual shorter utterances are glued together into a single long utterance. As the conversations in Watson et al. (2020) included both free conversation and solving the Diapix task, we speculate that the increase in utterance length in noise observed by Hadley et al. (2019) is due to the much longer criterion used to segment connected utterances.
Overlaps-Within
In natural dialogue, utterances do not always alternate between talkers. Sometimes an utterance of one talker occurs temporally completely within an utterance of the other talker, who continues to maintain the floor. We refer to these types of utterances as overlaps-within. The average duration of overlaps-within were around the duration of one syllable (between 228 and 264 ms), and the frequency was quite low (between, on average, 1.68 and 1.95 occurrences/minute per person), which is well in line with the suggestion in Sacks et al. (1974) that interlocutors try to minimize overlaps in conversation.
In L2, the duration of the overlaps-within increased. However, talkers also spoke slower in L2, and the observed increase in the duration of overlaps-within is similar to the increase in average syllable lengths between L1 and L2. In L2, the rate at which overlaps-within occurred increased. In L2 as well as in noise, the proportion of overlaps-within that included repeated words or syllables increased. We speculate that this may reflect increased difficulty in speech planning. Further, in noise, there were significantly more attempts to take a turn, suggesting that talkers had more difficulty in achieving fluid turn-taking behavior.
Across all the conversations, over half of the overlaps-within were verbal backchannels, which serve as markers for agreement or other presence feedback. We had expected that when communication became more challenging, verbal backchanneling would increase, as the need for the listener to acknowledge understanding or indicate presence may be increased. However, the proportion of overlaps-within that was verbal backchannels was similar across all four conditions. In the study by Watson et al. (2020), they observed that, when talkers solved the Diapix task, they produced shorter IPUs and fewer overlaps-within than when they held free conversation. This suggests that the Diapix task elicits conversations in which the characteristics of overlaps-within differ from those of free conversation. We speculate that when solving the Diapix task, interlocutors can adopt a question/response or statement/affirmation type of interaction reducing the utility of verbal backchannels. This might explain why we did not observe an increase in the proportion of verbal backchannels in the more challenging conditions.
Speech Levels and SNR
As anticipated, talkers increased their speech level in the presence of noise. On average, the speech levels estimated 1 m from the talkers (i.e., the levels reproduced over the headphones) were 58.1 dBA SPL in quiet and 67.5 dBA SPL in the presence of the 70 dBA SPL noise. In speech listening studies, it is common for experimenters to manipulate the SNR and observe changes in performance or measure the SNR needed to achieve some fixed level of performance such as speech reception thresholds (SRTs). However, the noise level was fixed in the present study. Thus, the SNR of the acoustic signal received by a listener was determined by the speech level of the talker, and the talker was free to adapt this level. In the present study, the conversations in noise were held with an average SNR of –2.5 dB. Other studies involving interactive conversations have observed similar average SNRs during conversations between normal-hearing listeners in noise (–2.5 dB in Mansour et al., 2021; –1.64 dB in Weisser & Buchholz, 2019).
Previous listening experiments have found that listeners perform worse on speech intelligibility tasks in L2. For example, van Wijngaarden et al. (2002) found Dutch speakers had SRTs that were 1 to 7 dB higher in their second (English) and third (German) languages compared to their native language. Thus, in the present study, we expected higher average SNRs for conversations in L2 compared to L1. However, talkers spoke at the same average levels in L2 as they did in L1, and thus, the SNR was similar between conditions.
A possible explanation for this could be that, in the presence of the 70 dBA SPL noise, talkers were operating near their physical limit and could not further increase their speech levels to achieve a more favorable SNR in L2. However, as the average level produced in noise was 67.5 dBA SPL, we think this is very unlikely. Other studies have observed that participants are able to produce conversational speech well above 70 dB SPL (e.g., Beechey et al., 2019; Weisser & Buchholz, 2019). Through an informal listening of the recordings in noise, all of the authors had the subjective impression that participants were capable of further increasing the level of their voice (i.e., they had not reached their physical limit).
All of the participants reported that they were comfortable holding a conversation in English and had participated in at least one course at a university level where the instruction was given in English. The results in van Wijngaarden et al. (2002) suggest that there is a relationship between language proficiency and SRT. Thus, it is possible that the participants in this study were sufficiently proficient in English so as to be equally good at understanding English and Danish speech in noise. However, we observed a decrease in articulation rate of approximately 11% in L2, which suggests they were less fluent in L2 than in L1 (De Jong & Wempe, 2009; García Lecumberri et al., 2017). Further, as in García Lecumberri et al. (2017) and Van Engen et al. (2010), it took the participants longer to solve the task when communicating in L2, and floor transfers occurred at a slower rate. Taken together, this suggests that although the participants may have been highly proficient in English, they were less fluent in English conversation than in Danish.
Previous studies suggest that one of the factors leading to higher SRTs in L2 is that native listeners gain more benefit from linguistic context (Golestani et al., 2009; Mayo et al., 1997). However, in this study, the pictures used in the Diapix task provided the participants with context information independent of the language spoken. The scene (beach, farm, or street) and the objects present in each picture could aid listeners in a manner similar to that provided by linguistic context. Because these visual cues were equally available when talkers spoke in L1 and L2, their presence may have reduced differences in listening effort across the language conditions.
In the L2 conditions of the present study, both talkers spoke in their second language and shared the same L1. It is possible that the participants in the present study benefitted from a matched accent (e.g., Peng & Wang, 2016; Van Engen et al., 2010). However, the native-Dutch speakers in van Wijngaarden et al. (2002) did not benefit from a matched accent. Their SRTs were slightly higher for matched-accented English than for native-English. In van Wijngaarden et al. (2002), native talkers of the participants’ L2 translated the sentences to have equal complexity across the languages tested. We speculate that in the present study in L2, talkers may have used grammar that was simpler and words that occur with higher frequency than speech produced by native talkers (e.g., Van Engen et al., 2010). This could further reduce differences in listening effort across the language conditions.
Conclusion
The purpose of the present study was to investigate whether turn-taking behavior was affected by manipulations to the expected communication difficulty in dialogue. Overall, participants took longer to solve the task both in L2 and in background noise, suggesting these conditions were more difficult. We hypothesised that the increased difficulty of conversing in L2 and/or in background noise would result in more variable and/or delayed timing of turn-taking. In noise, we saw a small increase in the median and IQR of FTOs. In L2, there was a small decrease in the median FTO, but a small increase in the IQR. Overall, while the effects were statistically significant, they were small. In both noise and L2, talkers increased the duration of their IPUs and took fewer turns. In addition, talkers spoke slower in L2. All of these changes could result in reducing the difficulty for both the listener and talker. Thus, we speculate that either the talkers had spare capacity to overcome the difficulty of communicating in L2 and noise, or that they adapted to the situation by changing other aspects of their communication behavior.
Supplemental Material
sj-pdf-1-tia-10.1177_23312165211024482 - Supplemental material for Effects of Noise and Second Language on Conversational Dynamics in Task Dialogue
Supplemental material, sj-pdf-1-tia-10.1177_23312165211024482 for Effects of Noise and Second Language on Conversational Dynamics in Task Dialogue by A. Josefine Munch Sørensen, Michal Fereczkowski and Ewen N. MacDonald in Trends in Hearing
Footnotes
Authors’ Note
The results from an initial analysis of the study presented here were reported in Sørensen, Fereczkowski, et al. (2020a). Note that this initial analysis used the same threshold in the VAD for all conversations. As a result, there are some differences between the findings from that initial analysis and the ones here that are based on a more accurate segmentation and categorization of talkers’ utterances.
Declaration of Conflicting Interests
The authors declared no potential conflicts of interest with respect to the research, authorship, and/or publication of this article.
Funding
A.J.M.S. and a portion of this study was supported by the William Demant Foundation (16-3968).
Supplemental material
Supplementary material for this article is available online.
References
Supplementary Material
Please find the following supplemental material available below.
For Open Access articles published under a Creative Commons License, all supplemental material carries the same license as the article it is associated with.
For non-Open Access articles published, all supplemental material carries a non-exclusive license, and permission requests for re-use of supplemental material or any part of supplemental material shall be sent directly to the copyright owner as specified in the copyright notice associated with the article.