
Abstract
Almost since the inception of the modern-day electroacoustic audiometer a century ago the results of pure-tone audiometry have been characterized by an audiogram. For almost as many years, clinicians and researchers have sought ways to distill the volume and complexity of information on the audiogram. Commonly used approaches have made use of pure-tone averages (PTAs) for various frequency ranges with the PTA for 500, 1000, 2000 and 4000 Hz (PTA4) being the most widely used for the categorization of hearing loss severity. Here, a three-digit triad is proposed as a single-number summary of not only the severity, but also the configuration and bilateral symmetry of the hearing loss. Each digit in the triad ranges from 0 to 9, increasing as the level of the pure-tone hearing threshold level (HTL) increases from a range of optimal hearing (< 10 dB Hearing Level; HL) to complete hearing loss (≥ 90 dB HL). Each digit also represents a different frequency region of the audiogram proceeding from left to right as: (Low, L) PTA for 500, 1000, and 2000 Hz; (Center, C) PTA for 3000, 4000 and 6000 Hz; and (High, H) HTL at 8000 Hz. This LCH Triad audiogram-classification system is evaluated using a large United States (U.S.) national dataset (N = 8,795) from adults 20 to 80 + years of age and two large clinical datasets totaling 8,254 adults covering a similar age range. Its ability to capture variations in hearing function was found to be superior to that of the widely used PTA4.
Keywords
Introduction
Over the past century, since the advent on the modern electroacoustic audiometer that permitted precise generation and manipulation of pure-tone signals and the application of valid methods to measure threshold (Bunch, 1922, 1941), the pure-tone audiogram has served as a key descriptor of an individual's hearing capability (Fowler & Wegel, 1922; LePrell et al., 2022; Vogel et al., 2007). In the ensuing decades, various measures have been proposed to summarize the detailed information contained within the pure-tone audiogram, focusing primarily on pure-tone-averages (PTAs) of various frequencies and the application of those PTAs to establish the overall severity of the hearing loss [see recent review by Humes (2020)].
Although such hearing-loss severity-classification systems based on various PTAs serve a purpose, are commonplace, and have been advocated for broad application [e.g., Clark, 1981; World Health Organization (WHO), 2021], important information about the hearing loss and the individual's auditory function is often lost. For example, many individuals classified as having “normal” hearing based solely on the PTA may self-report considerable hearing difficulty (Humes, 2021a, 2023a), a persistent observation dating from at least forty years ago (e.g., Gatehouse, 1990; Schow & Gatehouse, 1990; Ventry & Weinstein, 1982, 1983). This was not unique to those classified as having normal hearing. Variation in overall self-reported auditory function is commonplace regardless of the PTA-based hearing-loss severity (e.g., Humes, 2021a).
As reviewed recently in Humes (2021b), the classification of hearing loss severity using a PTA involves several decisions. First, one must decide which frequencies to include. Early severity-classification schemes made use of the PTA for 500, 1000, and 2000 Hz, often referred to as the Fletcher or speech-frequency PTA, as it was thought to capture the frequency range of most importance to the audibility of speech in quiet (Fletcher, 1929). This PTA, referred to here as PTA512, became the basis for the calculation of hearing impairment severity in the early guidelines of the American Academy of Ophthalmology and Otolaryngology in 1959 (AAOO, 1959). The first hearing-impairment (HI) grade system adopted by the World Health Organization (WHO) in 1991 and based on an international working group's expert opinion also made use of PTA512, although a footnote in the table describing the WHO-HI grade system stated that hearing at 4000 Hz was important for understanding speech in noise and should at least be measured (WHO, 1991). Realization grew that the measure of PTA-based hearing loss severity should take into consideration the fact that much of everyday communication takes place in noise and not quiet and that hearing for frequencies above 2000 Hz was critical for this communication. This lead to alternatives to PTA512, most including frequencies above 2000 Hz in the PTA, typically adding 3000 or 4000 Hz, and sometimes removing 500 Hz from the PTA (Kryter, 1970). By 2011, the Expert Group on Hearing Loss of the WHO's Global Burden of Disease project had included 4000 Hz in the PTA, referred to here as PTA4 but by many others as the “speech-frequency PTA,” and this remains the basis for the current WHO-HI grading scale (WHO, 2021).
In addition to deciding which frequencies to include in the PTA, decisions are required as to whether this should be the PTA from the better ear, the worse ear, or some type of average of the two ears. Throughout the various WHO guidelines on hearing loss, the better-ear PTA has been used, initially for PTA512 and most recently for PTA4. The use of the better ear reflects the fact that in many everyday situations, when hearing is possible in both ears, functional performance will be determined mainly by the hearing of the better ear. Of course, there are many everyday situations for which hearing through the better ear may not be possible, including many noisy listening situations. In these situations, the hearing of the worse ear may be more critical to functional performance. As a result, it is not uncommon for epidemiological studies to report the hearing threshold levels (HTLs) for both the better ear and worse ear. Nonetheless, it is the better-ear PTA that has been at the core of the WHO-HI grade system since its inception.
Finally, to ascribe severity labels or adjectives to the measured better-ear PTA values, decibel ranges also had to be established for each severity label. This was done in the 1991 WHO-HI grade system and more recently by the Expert Group on Hearing Loss of the WHO's Global Burden of Disease project (Stevens et al., 2013; WHO, 2021). Based on better-ear PTA4 in dB HL, the 2021 WHO-HI grades and their associated PTA4 ranges are: (1) normal, < 20; (2) mild, 20 to < 35; (3) moderate, 35 to < 50; (4), moderately severe, 50 to < 65; (5) severe, 65 to < 80; (6) profound, 80 to < 95; and (7) complete or total, ≥ 95 dB HL. The functional data underlying the rationale for these severity grades were not presented for the original (WHO, 1991), in Stevens et al. (2013), or most recently in WHO (2021). Statements as to the expected communication difficulties were generated, however, for each severity level by the panel of experts for each WHO-HI grade system. For example, for the 2021 WHO-HI grade system, those with “mild” hearing loss are not expected to have difficulties hearing conversational speech in quiet but may have such difficulties in noise (WHO, 2021; pg. 38). Those with “moderate” hearing loss, on the other hand, “may have difficulty hearing conversational speech” in quiet and will have “difficulty hearing and taking part in conversation” in a noisy environment (WHO, 2021; pg. 38). Humes (2019), using data from several large datasets, showed that each increment on the PTA4 severity scale of the current WHO hearing-impairment grade system led to significant differences in group performance for a range of speech-recognition and self-report measures of hearing difficulty, although this was less consistent across studies at the lower end of the scale (normal vs. mild WHO-HI grades). In addition, Humes (2021b), using data from several large datasets, showed that a hearing loss classification system that combined the 2021 WHO-HI grades with information about the configuration of the hearing loss was more strongly associated with functional measures of hearing than either system alone.
The focus on a single PTA measure for scales of hearing loss severity has been driven in large part by the simplicity of having a single number that characterizes the severity of the hearing loss and the difficulties experienced by the individual. In fact, PTA4 was adopted in 2023 by the US Consumer Technology Association as the preferred measure to be used by consumers when considering various hearing solutions (ANSI, 2023). As noted, there have been various attempts to modify the preferred PTA by adjusting the frequencies involved, typically adding higher frequencies due to their importance to speech-in-noise performance but also due to the high prevalence of hearing loss at higher frequencies. One of the issues with the use of PTA4 is that more severe hearing loss at and above 4000 Hz is averaged out by including very good HTLs at the lower frequencies, 500 and 1000 Hz, in PTA4. Another issue is that only the severity of the hearing loss is captured by a grade based on a single PTA. There is no information about the configuration. The top panel of Figure 1 illustrates both shortcomings of the WHO-HI grade system. Both audiograms shown here are classified by the WHO-HI grade system as 1 or “mild” based on a PTA4 of 30 dB HL. The speech intelligibility index (SII; ANSI, 1997) values shown in the top panel of Figure 1 were calculated for each audiogram for both quiet (Q) and noisy (N; + 6 dB signal-to-noise ratio) listening conditions. For both listening conditions, the sloping loss has lower SII values, which are predictive of worse speech-recognition performance for this configuration. Thus, the WHO-HI grade system misses information about the configuration of the audiogram and this information may be important to the functional performance of individuals with the same PTA4 but differing configurations.

Top : Two of many possible audiograms with a WHO-HI grade of 0 (‘normal’) and the speech-intelligibility index (SII ; ANSI, 1997) values calculated for speech in quiet (Q) and in speech-shaped noise (N). Bottom : Depiction of the LCH Triad classification system developed and evaluated here. PTA512 = PTA for 500, 1000 and 2000 Hz. PTA346 = PTA for 3000, 4000 and 6000 Hz. PT8k = pure-tone threshold at 8000 Hz.
One alternative to the use of a single PTA value has been to succinctly summarize the information from the pure-tone audiogram using five or more clinical descriptors based on the operational definition of audiometric parameters for each descriptor. This approach also has a long history with some of the earliest approaches developed soon after the use of the first electroacoustic audiometers (Carhart, 1945; Guild, 1932). Typically, descriptive adjectives are operationally defined for each of several features of the audiogram, such as severity and configuration of hearing loss, and the audiograms are classified accordingly (e.g., Hederstierna et al., 2007; Pittman & Stelmachowicz, 2003). Margolis and Saly (2007, 2008a, 2008b) provided one of the most comprehensive audiogram-classification systems of this type, which included descriptors of severity (normal, mild, moderate, severe, profound), configuration (rising, flat, sloped, trough, peaked, notched, other), site of lesion (conductive, sensorineural, mixed), and symmetry between the two ears (symmetrical, asymmetrical). Generally, the idea behind these classification systems has been to distill the audiometric information down to a small number of well-defined audiogram descriptors using terminology commonly employed by clinicians. As a result, these classification systems were typically validated against the audiogram descriptions provided by experienced clinical audiologists. Margolis and Saly (2007) validated their classification system against the classifications provided by five experienced clinical audiologists for a set of 231 audiograms. Among the five audiologists, the agreement among pairs of judges was 67.6%, 82.6%, and 74.4% for categorization of configuration, severity, and site of lesion, respectively. Their classification system agreed with the consensus clinical classification for each of these features 84.8 to 92.2% of the time, with consensus corresponding to the feature selected by the greatest number (2 to 5) of the audiologists.
Charih et al. (2020) implemented an automated machine-learning system to classify audiograms using an approach similar in concept to that developed by Margolis and Saly (2007). After first validating their classification system against the expert opinion of three audiologists for a standard set of 320 audiograms, the resulting classification system was evaluated using 15,498 audiograms from the National Health and Nutrition Examination Survey (NHANES). As bone-conduction audiometry was not included in NHANES, site-of-lesion classification was not evaluated, but configuration, severity, and bilateral symmetry were evaluated. Inter-audiologist agreement was again lowest for configuration (kappa = 0.55), followed by symmetry (kappa = 0.84), with severity showing the highest inter-judge agreement (kappa = 0.96). The accuracy of the classification of each audiogram feature by Charih et al. (2020) was comparable to that reported by Margolis and Saly (2007), but no overall evaluation of the combined features was provided by Charih et al. (2020). As in Margolis and Saly (2007), Charih et al. (2020) found that a consensus among the audiologists regarding the configuration descriptors was the most difficult to achieve, with 57.4% of the configurations leading to a consensus among the expert audiologists (at least 2 of 3 audiologists in agreement). This disagreement among clinical experts regarding each of the audiogram's clinical descriptors represents one of the greatest challenges to software (Margolis & Saly, 2007) and machine-learning approaches (Charih et al., 2020) attempting to assign such descriptors to audiograms automatically. Another problem is that each of the various clinical descriptors is assumed to have functional significance, but no direct support of this has been included as a part of the evaluation of the classification schemes. Rather, these classification systems are based on the expert opinion of several experienced clinicians and are designed to capture the features of the audiogram identified by those experts, not necessarily the associated functional significance of those features.
Another approach to the classification of audiograms has been to use statistical methods, typically some form of cluster analysis, to classify groups of audiograms without regard to clinical descriptors. Cluster analysis has been available as a statistical tool for about 80 years (Cattell, 1944; Zubin, 1938) and is well-suited for the identification of clusters or groups of individuals with similar audiometric characteristics. Cluster analysis of audiograms yields cluster centroids, which can essentially be interpreted as an average audiogram for each cluster, and other statistical measures can be used to indicate the variability within a cluster and the separation between clusters. This approach has been used by Ciletti and Flamme (2008) in the evaluation of NHANES data (and local population data), Bisgaard et al. (2010) for a large Swedish clinical dataset, Chang et al. (2019) in the evaluation of Korean NHANES (KNHANES) data, and Cruickshanks et al. (2020) for the evaluation of population data from Beaver Dam, Wisconsin. Depending on the data included in the analyses, both the volume and diversity, the number of audiogram clusters identified and represented by the cluster centroids at each frequency, often referred to as “standard audiograms,” has ranged from a low of 9 (Ciletti & Flamme, 2008; females only) to a high of 29 (Chang et al., 2019). This illustrates one of the challenges with this statistical approach: identifying a reasonable upper limit to the number of clusters and then interpreting or labeling the clusters once identified, the latter often reverting to reliance on nomenclature from the clinic. This process is generally referred to as cluster validation and numerous approaches to such validation have been suggested (e.g., Milligan & Cooper, 1985). In addition, evidence has not been provided regarding the functional significance of the clusters derived. For example, do those with “Cluster 1” audiograms have speech-recognition performance or self-reported hearing difficulties that differ significantly from those “Cluster 2” or “Cluster 3”? This question of functional significance has not been addressed in any studies using cluster analysis.
Visual inspection of the standard audiograms resulting from cluster analyses across the various studies cited above tended to reveal a pattern based on the severity of hearing loss in two frequency regions: 500 through 2000 Hz and frequencies above 2000 Hz (in the typical audiometric range of 3000 to 8000 Hz). This was most apparent in the population-based studies. These two components could be well represented by PTA512 and PTA346 or PTA3468, which could form the basis for a two-PTA audiogram-classification system.
In support of this two-PTA approach, in analyses of the audiograms from a population study of the United Kingdom (UK), Lutman et al. (1987) found that a two-parameter model provided an excellent description of the data for 1,961 ears included in their study. One parameter that emerged was the average hearing loss at 250, 500, 1000 and 2000 Hz. The other parameter was a measure of the slope calculated using that average and an average for the HTLs at 3000, 4000 and 6000 Hz. It should be noted that 6000 Hz was the highest frequency in the dataset analyzed by Lutman et al. (1987). Nonetheless, these analyses suggest that two PTAs, one for frequencies 2000 Hz and lower and the other for frequencies above 2000 Hz, may better capture the information in the audiogram, although the functional importance of a two-PTA versus a single PTA system has not been established.
Finally, in recognition of the limitations of a single-PTA approach to capturing the information in the audiogram, analyses of epidemiological data from US adults have typically made use of two PTAs. The rationale for using two PTAs, one including lower frequencies from 500 to 2000 Hz and the other confined to frequencies at and above 3000 Hz, is not explicitly stated in any of these reports. Presumably, the second higher-frequency PTA was included because it is well known that two of the most common types of hearing loss, age-associated and noise-induced, manifest primarily at frequencies above 2000 Hz (ISO 1999-2013; ISO 7029-2017). Bainbridge et al. (2008), for example, used PTA512 and a PTA for 3000, 4000, 6000 and 8000 Hz, PTA3468, in their analyses of NHANES 1999-2004 data for adults 20–69 years of age whereas Agrawal et al. (2008) used PTA512 and PTA346 in their analyses of these same NHANES data. Hoffman et al. (2017) examined both PTA4 and PTA346 for NHANES 1999-2004 and 2011-12 for 20–69-year-olds and Humes (2023a) did the same for adults 20 to 80 + years of age in NHANES 2011-12, 2015-16 and 2017-20. From the outset, analyses of hearing loss in children and adolescents using NHANES datasets have made use of two PTAs, PTA512 and either PTA3468 or PTA346 (Niskar et al., 1998; Shargorodsky et al., 2010; Su & Chan, 2017). Thus, despite the absence of an explicit rationale for including two PTAs in the analyses of US epidemiological data on audiometric hearing loss, doing so has clearly been the norm in these analyses for many years. The use of two PTAs, specifically PTA512 and PTA346, has been commonplace in recent epidemiological studies in other countries as well (e.g., Aarhus & Engdahl, 2020; Wang et al., 2016; Wang et al., 2021).
A novel audiogram-classification scheme is presented here that makes use of two PTAs: PTA512 and PTA346, as well as the pure-tone threshold at 8000 Hz. The latter is considered separately in this framework, rather than being included in the high-frequency PTA, because it is critical for the separation of two of the most common types of high-frequency hearing loss, age-associated hearing loss (e.g., ISO, 7029-2017) and noise-induced hearing loss (e.g., ISO, 1999-2013). A key audiometric feature often distinguishing these two highly prevalent types of high-frequency hearing loss is the presence of a notched configuration in noise-induced hearing loss (Coles et al., 2000; Flamme et al., 2020; Lowe & Moore, 2021; Meghji & Phillips, 2021; Moore, 2020; Moore et al., 2022; Niskar et al., 2001; Shi et al., 2021; Tambs et al., 2006; Themann & Masterson, 2019; Yang et al., 2023; Zhou et al., 2020). As noted by Flamme et al. (2020), “…thresholds at 8 kHz are particularly important for discriminating between the audiometric configurations commonly associated with aging…and noise exposure.” (pg. S21-22), a point emphasized in all approaches to the identification of noise-notched audiograms (Meghji & Phillips, 2021). It is important that any audiogram-classification scheme be able to distinguish notched from sloping configurations. This led to the inclusion of the threshold at 8000 Hz in the proposed classification scheme as a separate component even though it has long been recognized that acoustic cues in the frequency region near 8000 Hz play a very minor role in everyday speech communication (e.g., ANSI, 1997; Fletcher, 1929, 1953; Kryter, 1970).
In the proposed classification scheme, a grade system was established resembling that used in the WHO-HI grade system. Here, however, rather than progressing in 15-dB steps across the range of dB HL values above 20 dB HL, a step size of 10 dB was used to span the range of HTLs for three primary reasons. First, it has been suggested frequently that a boundary below 20 dB HL should be used for delimiting normal from impaired hearing, especially when the measure is a PTA (e.g., Golub et al., 2020; Clark, 1981; Spankovich et al., 2018). Adding a boundary at 10 dB HL for PTA values enables the identification of very slight hearing loss, including small notches at high frequencies that may reflect early noise-induced hearing loss. Second, for individual cases, a 10-dB difference in HTLs has been used consistently to signify a clinically significant difference (e.g., Bess & Humes, 2008; Dobie, 1983). Although this 10-dB criterion was developed for use with pure-tone HTLs at a given frequency, it is applied here for PTAs. Third, use of a uniform 10-dB range for each grade makes it simpler to translate the calculated PTAs to the single digits used in the proposed system. Thus, PTAs from 10 to 19.99 dB HL are assigned a value of “1”, those from 40 to 49.99 dB HL, a value of “4”, and so on. Single-digit differences across PTAs or between left-ear and right-ear PTAs also reflect clinically significant differences of 10 dB using this scheme. This system, referred to here as the Low (PTA512)-Center (PTA346)-High (PT8k), or LCH, Triad system is illustrated in the bottom panel of Figure 1. For the two audiograms in the top panel of Figure 1, the LCH Triad is 333 for the flat configuration and 257 for the sloping configuration. Severity and configuration, as well as bilateral asymmetry (not shown in Figure 1), are all easily captured in the LCH Triad framework.
The LCH Triad system and the WHO-HI grade system were applied to the data from four datasets, two nationally representative NHANES datasets and two clinical datasets. NHANES is a large and valuable resource with extensive audiological data, but it is not a clinical dataset. NHANES included few functional measures of hearing, confined primarily to a few brief queries about the hearing difficulties experienced by participants. The two clinical datasets included several measures of hearing function. These measures encompassed speech-recognition performance and self-report measures of hearing difficulties, including the Hearing Handicap Inventory for Adults (HHIA; Newman et al., 1990) or the Hearing Handicap Inventory for the Elderly-Screening version (HHIE-S; Ventry & Weinstein, 1982, 1983; Weinstein & Ventry, 1983). All four datasets were used to evaluate the functional significance of the LCH triads, the LC dyads, and the prevailing WHO-HI grade system.
There are several potential uses for an accurate and functionally valid audiogram-classification scheme. Automated audiometry is increasingly commonplace, whether performed in-person or remotely, and the ability to quickly summarize and label the audiogram is of value as an endpoint for the automated assessment (Charih et al., 2020). If audiograms can be readily classified into meaningful groups, it may be possible to tailor the intervention to the audiogram and to discern corresponding differences in intervention outcomes. For sizable datasets from epidemiological studies or large clinics, the efficient and valid sorting of individuals based on their audiograms can provide useful characterizations of the populations of interest. Finally, clinicians often find the explanation of the information on the pure-tone audiogram to others to be challenging, including other healthcare professionals (e.g., Klyn et al., 2021). A simple but relevant 3-digit summary of the audiometric information, presented either numerically or graphically, may prove useful to the individual and to the professional counseling individuals with hearing loss.
Methods
The Datasets
The NHANES 2011-12, 2015-16, and 2017-20 surveys were conducted by the National Center for Health Statistics (NCHS) to monitor the health and nutritional status of the civilian, non-institutionalized US population. Sex and race/ethnicity were self-reported using federal guidelines in existence at that time. Because the surveys enquired about the respondent's sex, either male or female, rather than gender, this variable is referred to here as the participant's self-reported sex. The surveys used a complex, multistage, stratified, cluster design with oversampling of targeted subgroups to produce nationally representative estimates. Complete details for each NHANES dataset can be found at: https://www.cdc.gov/nchs/nhanes/index.htm.
NHANES 2011-12, 2015-16, and 2017-20 included a total of 35,287 participants across all three cycles of whom 8,795 had complete audiograms. They ranged in age from 20 to 80 + years. Those with age designated as 80 + years in NHANES 2017-20 were top coded at 80 by NCHS to protect the participant's identity. The NCHS noted that the mean age for that group in the 2017-20 survey was 85 years. The sex, age, and race/ethnicity of the adults with complete audiograms have been provided recently in detail in Humes (2023a). Humes (2023a) also details the procedures followed for the measurement of HTLs in NHANES, documenting the audiology best-practices employed.
Several self-report questions were completed by the participants in NHANES. These pertained to the self-assessed general condition of hearing (AUQ054), difficulty conversing in noise (AUQ100), and frustration with hearing during conversation (AUQ110). Either 6-point (AUQ054) or 5-point (AUQ100, AUQ110) Likert-type ratings were used for responses with the latter two addressing the frequency of difficulties encountered [“always” (1) to “never” (5)]. General condition of hearing, AUQ054, included response options from “excellent” (1) to “deaf” (6).
Two large clinical datasets were used, one from the Mayo Clinic in Jacksonville, Florida, referred to here as Mayo, and the other from the audiology clinic at the Mountain Home, Tennessee Veterans Administration Medical Center, Department of Veterans Affairs, referred to here as VA. Briefly, complete air-conduction pure-tone HTLs from 500 through 8000 Hz were provided for both ears of 5,231 adults, ranging in age from 21–101 years (M = 67.1 and Median = 68.1 years), 60.6% of whom were male, who were seen at the Mayo Clinic. Monosyllabic word-recognition scores in quiet (CID W-22 25-word lists) were obtained for each ear for speech presented at a level of 30–40 dB above the speech-recognition threshold (SRT). In addition, the total score from the 25-item Hearing Handicap Inventory for Adults (HHIA; Newman et al., 1990) was obtained. Whereas all those with pure-tone HTLs also had HHIA scores, some speech-recognition measures were missing for 297 adults resulting in a total sample size of 4,934.
The VA dataset, as described in Wilson (2011), included 3,430 participants who were consecutive, new patients to the audiology clinic. Sex was not recorded, but only 1.5% of the veterans evaluated in the same clinic during the study period were female (Wilson, 2011). Consequently, results are assumed to be representative of male veterans only. After elimination of those with data-validation issues, “dead ears”, no responses to test stimuli at various frequencies, or incomplete data, in either ear, complete pure-tone data for both ears of 3,023 adults (6,046 ears) remained. The ages of the final dataset ranged from 20 to 93 years with a mean of 62.0 years (SD = 12.8 years). Functional measures of hearing included word-recognition scores obtained in quiet (NU-6, 25-word lists) at each of two different presentation levels [low: either 80- or 90-dB SPL; high: either 104- or 114-dB SPL; see Wilson (2011) for additional details]. In addition, the signal-to-noise ratios corresponding to 50% correct on the Words-In-Noise (WIN) test were measured (Wilson, 2003; Wilson et al., 2007; Wilson & Burks, 2005) and the score from the 10-item HHIE-S (Ventry & Weinstein, 1982, 1983) was obtained. Several individuals with a complete set of pure-tone HTLs did not have a complete set of speech-recognition measures (N = 472) or an HHIE-S score (N = 536). This resulted in a total sample size of 2,551 and 2,487 individuals with complete data for the analyses of speech-recognition measures and HHIE-S scores, respectively.
For all data reported here, audiometric testing was conducted in sound booths. Ambient noise met the standards for maximum permissible ambient noise levels for ears-covered testing from 500 to 8000 Hz (ANSI 3.1, 1999). Audiometers were calibrated to ANSI S3.6 (1996) specifications. HTLs were obtained using a pulsed-tone stimulus and a standard clinical modified method of limits procedure. The transducers used varied across datasets, and sometimes within a dataset, but each was calibrated in accordance with ANSI S3.6 specifications.
Data Analysis
For the NHANES datasets, all prevalence estimates and statistical analyses presented here were performed in accordance with the National Health and Nutrition Examination Survey: Analytic Guidelines, 2011-2014 and 2015-2016 published online on December 14, 2018, by the NCHS and National Health and Nutrition Examination Survey, 2017-March 2020 Prepandemic File: Sample Design, Estimation, and Analytic Guidelines (Akinbami et al., 2022). Statistical analyses for population-weighted estimates were performed using SAS version 9.4 (SAS Institute, Inc., Cary, NC). This included the use of masked strata and cluster variables for the design and the use of the adjusted sample weights provided for each participant by the NCHS. Sample weights for the 2011-12 and 2015-16 datasets were adjusted as recommended when combined (each cycle's 2-year weights divided by 2) whereas the sample weights for the 2017-2020 dataset were unaltered. In addition, as recommended by the NCHS, the lowest common denominator guided the choice of which set of sample weights to use, and, given the focus on audiometric data attained in the Mobile Examination Center (MEC), the MEC sample weights were used here.
The full set of data from 35,287 adults was included in the dataset to be analyzed with restriction to those 6–80 + years of age and with completed audiograms designated via domain specifications in the SAS analyses. Variance estimation was accomplished using the recommended Taylor-series linearization method. The 95% confidence intervals reported here were those generated by SAS 9.4 based on standard errors estimated by linear interpolation of a normal distribution. Analyses of the unweighted NHANES data were completed using SPSS version 29 (IBM Corp., Chicago, IL).
For the Mayo and VA clinical datasets, analysis of the data was completed using SPSS version 29 (IBM Corp., Chicago, IL). These analyses included various descriptive, correlational, General Linear Model (GLM), and regression analyses. Percent-correct scores were transformed to rationalized arcsine units (RAUs; Studebaker, 1985) prior to analyses. Generally, unless noted otherwise, a significance level of p < .05 was used, with Bonferroni adjustment of p values for multiple paired comparisons.
Results and Discussion
Further Examination of LCH Triad Components
We began by performing principal-components analyses (PCAs) of the HTLs in each of the datasets and then for the entire set of audiograms. First, a PCA of the left- and right-ear audiograms from 8,795 adults (17,590 ears) aged 20 to 80 + years was performed using the unweighted data from NHANES 2011-12, 2015-16 and 2017-20. Two principal components were identified, the solution accounting for 80.7% of the variance. As summarized in Table 1, all communalities exceeded 0.73, the Kaiser-Meyer-Olkin (KMO) measure of sampling adequacy was 0.93, and Bartlett's Sphericity test was significant (p < .001). All these results suggest that the two-component model was an excellent fit for the set of 14 HTLs. Oblique rotation was used initially and the between-component correlation for the oblique rotation was 0.7 which reflects the general tendency of all pure-tone HTLs from the same person to be at least moderately correlated. This was followed by orthogonal rotation using the varimax criterion. The resulting principal component weights after rotation are shown in the top left panel of Figure 2. HTLs for both ears had high loadings (0.80 to 0.97) for frequencies from 3000 through 8000 Hz on the first principal component (PC1) and for 500 and 1000 Hz on the second component (PC2). The HTLs at 2000 Hz in each ear were moderately loaded on both components, indicating that 2000 Hz could be grouped with either component. Grouping the HTLs at 2000 Hz with the lower-frequency component resulted in two components representing all audiometric frequencies available in NHANES, one for 500–2000 Hz and the other for 3000–8000 Hz, consistent with the broadly used two-PTA approach based on PTA512 and PTA346 or PTA3468.

Principal-component (PC) weights for the HTLs from 500 through 8000 Hz for each ear and dataset. Each panel shows the results for a different dataset, the lower-right panel showing the results when all datasets were pooled. The vertical dotted line in each panel separates the results for the left and right ears. Table 1 provides additional details from these analyses.
Summary of Results from the Principal-Components Analyses of HTLs for Each Dataset. NHANES = Unweighted Data from NHANES 2011-12, 2015-16, and 2017-20 for Adults 20 to 80 + Years of Age. KMO = Kaiser-Meyer-Olkin Measure of Sampling Adequacy. Bartlett's Test = Bartlett's Test of Sphericity (all Significant at p < .001). df = Degrees of Freedom. Var = Variance. PC = Principal Component. PT = Pure-Tone. Freq = Frequency in Hz. N/A = Not Applicable. for Ear, L = Left and R = Right.

The remaining panels in Figure 2 show the results of the same analyses for the VA (upper right panel) and Mayo (lower left panel) datasets. The lower right panel of Figure 2 (“ALL”) shows the results for the entire merged dataset. Table 1 provides the details of the results. Three of the four panels in Figure 2 show the same two-component pattern of weights, the higher frequencies loading strongly on PC1, the lower frequencies having the highest weight for PC2, and the HTL at 2000 Hz having a moderate weight for both components. For the Mayo dataset, however, the PCA solution included three PCs.The pattern of weights for PC1 and PC3 in the Mayo dataset mimics the pattern for PC1 and PC2 for all other datasets. The difference for the Mayo dataset is that an additional component, PC2, weighted all left-ear thresholds more heavily than right-ear thresholds. Overall, the results in Figure 2 and Table 1 support the use of two PTAs, PTA512 and PTA3468, to summarize the information available in the audiogram. To our knowledge, there have only been four other attempts to apply PCA to audiometric HTLs and these were confined to small samples (N ≤ 201) of children (Bamford et al., 1980), individuals with hereditary hearing loss (Verschuure et al., 1985), or older adults (Dreschler & Plomp, 1980; van Rooij & Plomp, 1990). Nonetheless, all these studies identified two principal components, one corresponding to low-frequency HTLs and the other to either high-frequency HTLs or the slope of the hearing loss from low- to high-frequency.
The uniformly high PC1 weights for each of the HTLs at 3000, 4000, 6000 and 8000 Hz shown in Figure 2 (except possibly for the right-ear in the VA dataset; top right panel) suggest that the HTL at 8000 Hz could be removed from the high-frequency PTA without much consequence. This was supported by the observation that all r2 values between PTA346 and PTA3468 were greater than 0.95 across ears and datasets, with regression slopes ranging between 0.98 and 1.0. As a result, it is reasonable to use three values to capture the information in the audiogram, PTA512, PTA346, and PT8k, the latter mainly serving the purpose of notched-audiogram identification.
The next question considered was whether 10 severity grades, 0 to 9, for each frequency region showed a reasonable spread across the HTLs of each dataset. Figure 3 shows the cumulative distributions of the L, C, and H grades across the datasets. Although a narrower range of L grades (top panel), 0 to 4, would likely suffice for the NHANES data from 20–69-year-olds, across all four datasets, the distribution of L, C and H grades suggests that the full range of 0 to 9 represents a reasonable categorization of the severity of hearing loss.

Cumulative distribution functions (CDFs) generated from either population-weighted (NHANES) or boot-strapped (VA, Mayo) estimates of the following percentiles: 1, 2.5, 5, 10, 25, 50, 75, 90, 95, 97.5, and 99. CDFs are shown for L (top), C (middle), and H (bottom) grades and for left (left) and right (right) ears for each of the four datasets.
LC dyads and LCH triads can be constructed to represent the audiograms in each dataset. The LC dyad is a two-PTA system and the LCH triad is comprised of two PTAs and a higher frequency (PT8k). Multivariate and univariate GLM analyses were performed on the HTLs at each of the seven frequencies for each ear, both collectively (multivariate) and separately (univariate) for the WHO-HI grade, the LC dyad, and the LCH triad. The effects of each of these grade systems on the HTLs were significant (all p < .001) both for the multivariate GLM analyses and for each of the seven GLM analyses at separate frequencies. The resulting r2 values from the GLM analyses are depicted in Figure 4 for each of the four datasets. The far left r2 value in each panel shows the r2 value for the multivariate solution and is labeled “ALL.” Note that the LCH triad system explains the most variance in HTLs, typically 75–80%, followed by the LC dyad, and lastly, the WHO-HI grade system. This is the case for all datasets and both ears. It is not at all surprising that a 3-value representation of the audiograms is superior to a 2-PTA representation which, in turn, is superior to a single-PTA representation. When the r2 values for each frequency in Figure 4 were examined, both the LC dyad and LCH triad explained considerably more variance in the audiograms than the WHO-HI grade with the differences in r2 values being smallest at those frequencies common to all three PTAs, 500–4000 Hz. The main difference between the r2 values for the LC dyad and LCH triad is at 8000 Hz for which the LC dyad had a considerably lower r2 value than did the LCH triad. Again, this is expected given the frequencies represented in the LC dyad and LCH triad. That is, the HTL at 8000 Hz is included in the LCH triad but not in the LC dyad. Figure 4 simply confirms that additional variance in audiometric HTLs is explained as the classification system includes a larger set of frequencies as separate elements.

Plots of r2 values from multivariate (ALL) and univariate GLM analyses examining the effects of LCH triad, LC dyad, or WHO-HI grade on the pure-tone HTLs in the left (blue) and right (red) ears. Each panel shows the results for one of the four datasets.
Is the added cost in complexity of a 2- or 3-digit audiogram classification system that better captures the variation of HTLs in the audiogram, such as LC dyads and LCH triads, worth it compared to the simpler 1-grade WHO-HI system? As noted in the Introduction, one immediate benefit for the additional digits in the LC dyad and LCH triad classifications is the possibility to not only quantify the severity of the hearing loss, but also the configuration of that loss. In addition to this benefit of a 2- or 3-digit classification system, are there differences in functional significance between 1-, 2-, and 3-digit representations of the audiometric HTLs? There are many approaches to answering this question. The next section details some of the approaches pursued here and the results of each.
Evaluating the Functional Significance of LCH Triads, LC Dyads, and WHO-HI Grades
The inclusion of PT8k, H in the LCH Triad classification, was primarily added to distinguish notched from sloping audiometric configurations thereby facilitating the separation of likely age-associated hearing loss from possible noise-induced hearing loss. Generally, the information in speech around 8000 Hz contributes very little to speech understanding (ANSI, 1997; Fletcher, 1953; Kryter, 1970) or to self-reported hearing difficulties, at least for self-reported speech-communication performance (Dobie, 2011). As a result, we assume there to be no differences in the associations between functional performance and the LC dyad or LCH triad. To evaluate this, for each of the four datasets in these analyses, correlations were computed for each functional measure included in each dataset and both the LC dyad and the LCH triad.
Table 2 presents the Spearman rho correlations between each functional measure and the LC dyads and LCH triads for the left (upper portion of table) and right (lower) ears. Very similar results were obtained with Pearson-r correlations, but the Spearman-rho correlations were preferred due to the less restrictive assumptions about the distribution of the data. Table 2 also shows the 95% confidence intervals. In all but one case, the correlation for each measure with the LC dyad is the same as the corresponding correlation with the LCH triad. Thus, in terms of capturing the functional importance of the LCH Triad classification, no gain is associated with including the H component in the LCH triad. Hence, when subsequently evaluating the functional significance of the classification system, the LC dyad is compared to the WHO-HI grade.
Spearman rho Correlations of Each Functional Dependent Variable (Measure) with LC Dyad and LCH Triad. L95 and U95 Represent Lower and Upper 95% Confidence Intervals, Respectively, for the rho Values. NHANES Datasets Were Unweighted. L = Left. R = Right. WIN = Words-in-Noise. WRSQ = Word-Recognition Score in Quiet. HHIE-S = Hearing Handicap Inventory for the Elderly-Screening Version. HHIA = Hearing Handicap Inventory for Adults. Gen.Cond.=General Condition. Diff.=Difficulty. Frustr.=Frustration. SNR = Signal-to-Noise Ratio.

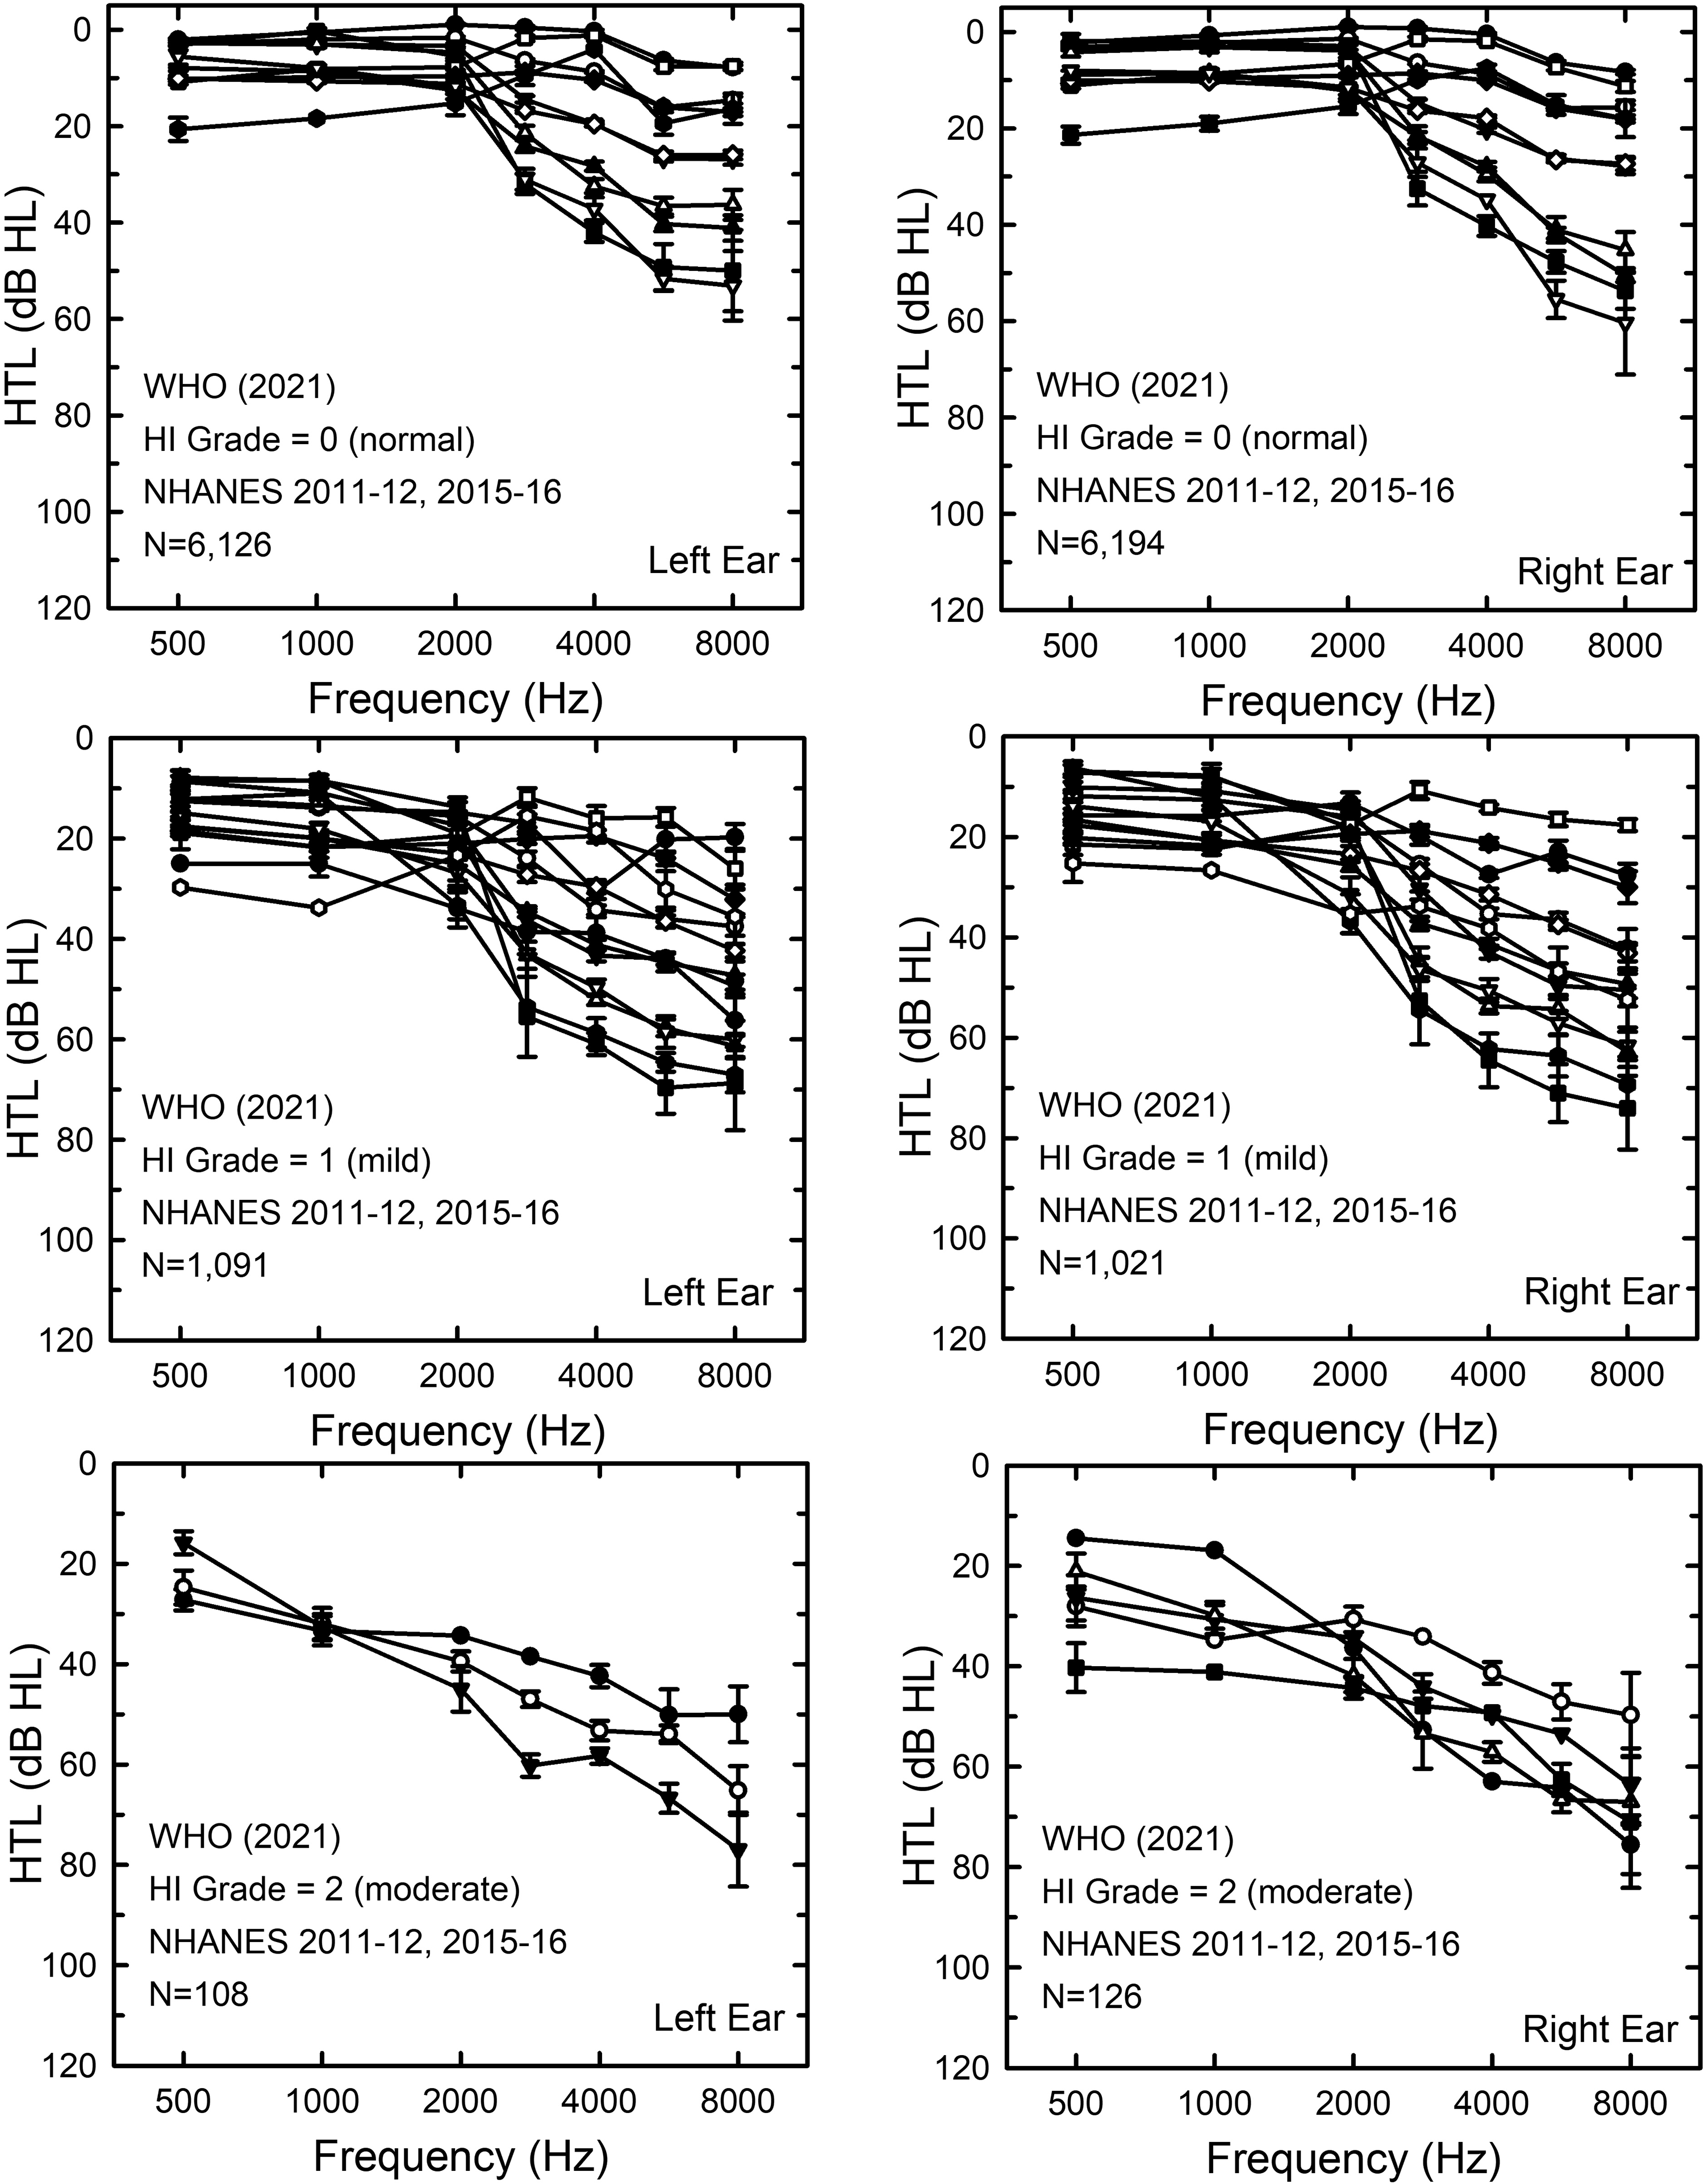
In the next set of analyses, subsets of individuals in each of the datasets were formed based on the WHO-HI grade for each ear. The number of LC dyads within each subset with results from at least 20 ears was determined. Figure 5 presents the audiograms for each of these LC dyads for the VA dataset. Clearly, there is wide variation in the HTLs within a given WHO-HI grade, the widest variations typically confined to frequencies above 2000 Hz. To illustrate the labeling of audiograms as LC dyads, the mean audiograms in the left panels of Figure 5 have been color-coded. It is clear that several LC dyads were identified within each WHO-HI grade. For example, in the top-left panel, 6 LC dyads fell within the WHO-HI grade of 0 or “normal.” Do the LC dyads within a given WHO-HI grade capture meaningful differences in hearing function?

Means and standard errors for LC dyads within subsets of the VA dataset formed by grouping those in the same WHO-HI grade. WHO-HI grades, top to bottom, are: 0 (normal), 1 (mild), 2 (moderate), and 3 (moderately severe). Left panels show HTLs for the left ears and the right panels shown the HTLs for the right ears. To be included in the subgroup analyses, LC dyads had to include at least 20 ears. In the left panels, the individual LC dyads have been color-coded to illustrate the categorization into LC dyads by the LCH Triad system.
To answer this question, the functional measures available in each dataset were examined as a function of LC dyad for each WHO-HI-grade subset. These analyses began with the speech-recognition measures. The VA dataset had the greatest number of speech-recognition measures. The results for the speech-recognition measures from the VA dataset are presented in Figure 6 and the results of GLM univariate analyses on the effects of LC dyad on performance within each WHO-HI-grade subset are provided in Table 3. Figure 6 provides the estimated marginal means and 95% confidence intervals from the GLM analyses for each measure of speech-recognition performance and for each WHO-HI-grade subset. Table 3 presents the results of each of the univariate GLM analyses of the data in Figure 6. Except for three of the four NU6 scores at high levels and those with WHO-HI grades of 0 or “normal”, indicated by the black symbols in each panel of Figure 6, significant amounts of variance in performance were explained by the LC dyads within each WHO-HI-grade subset (Table 3). Roughly an additional 10–20% of the variance in performance could be explained by the LC dyad above that explained by the WHO-HI grade alone. The WHO-HI grade did account for variance: the systematic decrease in speech-recognition performance with increasing WHO-HI grade is readily apparent in Figure 6. Figure 6 and Table 3 demonstrate that there are variations in function associated with the variation in audiograms within a given WHO-HI grade. Moreover, these variations in functional performance are substantial and statistically significant except for some of those within the WHO-HI grade of “normal” (0).
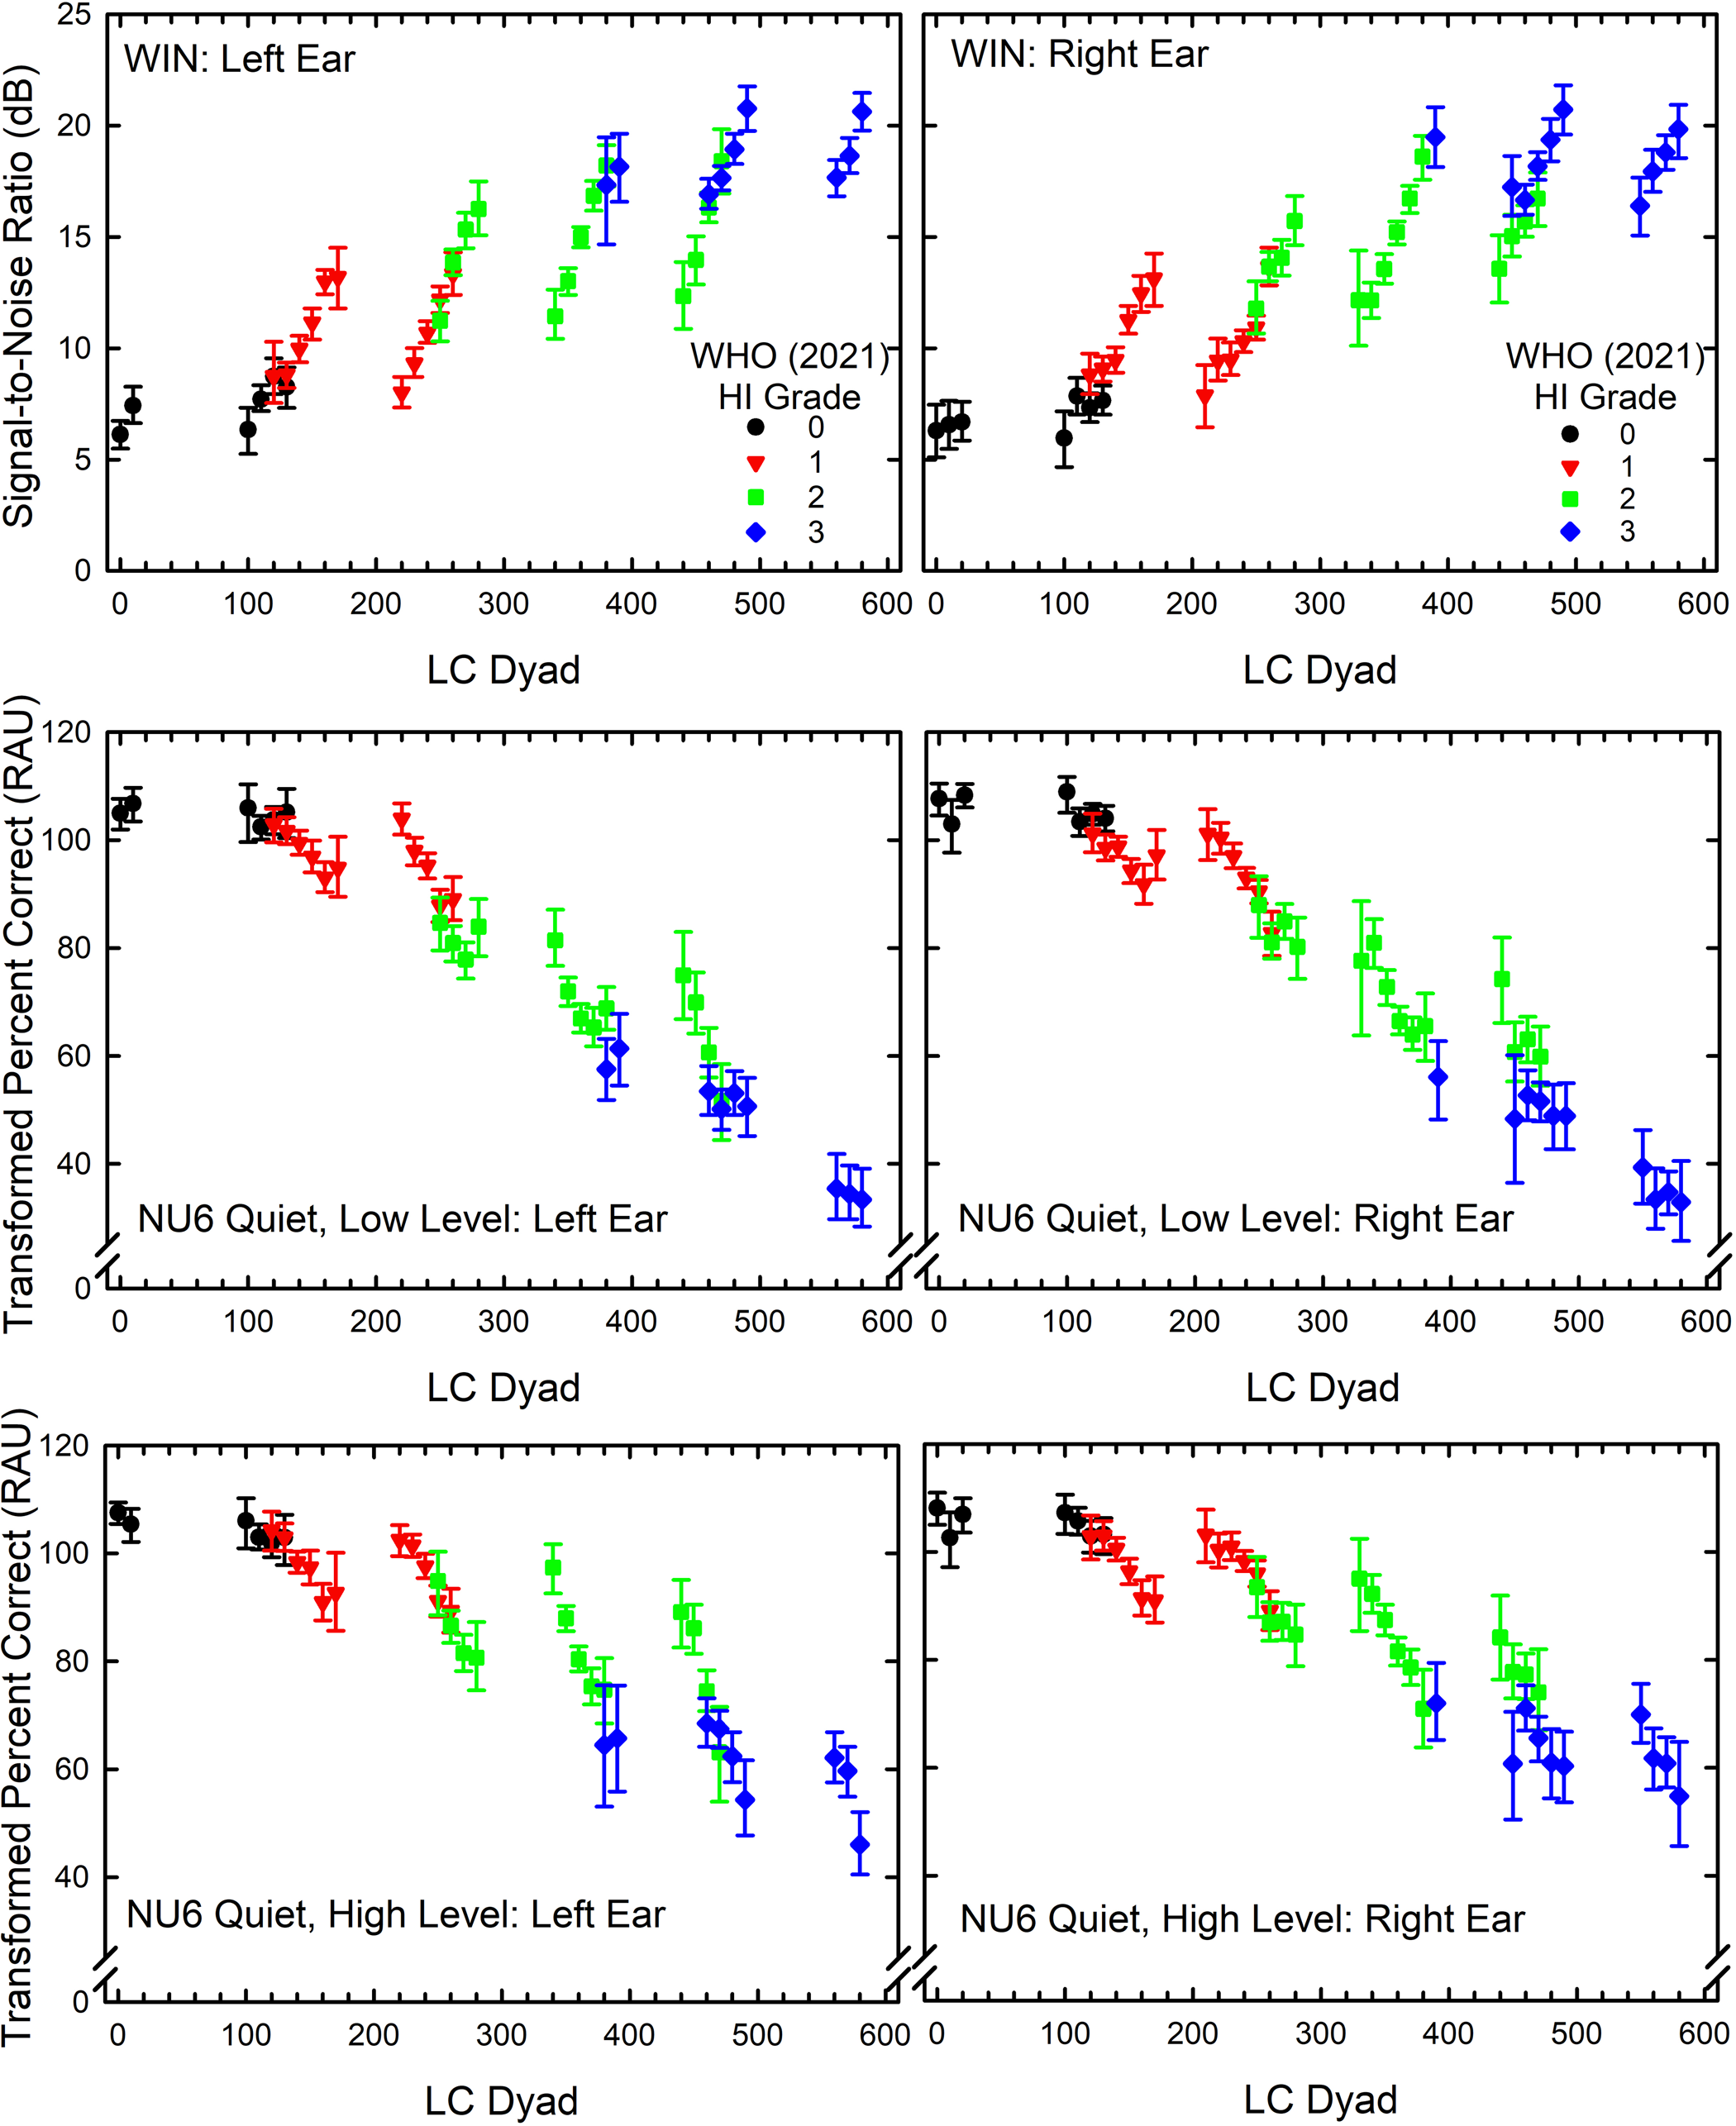
Words-in-Noise (WIN) signal-to-noise ratios (top) and transformed percent-correct scores in rationalized arcsine units (RAUs) for the NU6 monosyllables in quiet at low (middle) and high (bottom) presentation levels as a function of LC dyad. Each WHO-HI grade from 0 to 3 is color-coded. Values plotted are the estimated marginal means and 95% confidence intervals from the GLM analyses shown in Table 3.
Results of Univariate Analyses of Variance for the Effects of LC Dyad on Each Measure of Speech-Recognition Performance (WIN-Words in Noise, NU6 Quiet at Low Level, NU6 Quiet at High Level) and for Each Ear (L = Left; R = Right) for a Given WHO (2021) Hearing-Impairment (HI) Grade. A Minimum of 20 Ears was Needed to Include an LC Dyad in the Analyses. NU6 Word-Recognition Scores Were Transformed to Rationalized Arcsine Units (RAUs) Prior to Analyses. df = Degrees of Freedom for F. p = Significance Level. Partial Eta Squared and r2 are Measures of Effect Size and Indicate Proportion of Variance Explained by LC Dyads Within a Given WHO Grade.

Figure 7 shows the variations in audiograms within a given WHO-HI-grade subset for the Mayo dataset. Once again, there are wide variations in HTLs, especially above 2000 Hz, within a given WHO-HI grade. Figure 8 and Table 4 show the variations in functional performance, here just for the transformed word-recognition scores obtained in quiet, as a function of LC dyad. The various WHO-HI-grade subsets with LC dyads of 20 or more ears are color-coded in Figure 8 as for Figure 6. Although Table 4 shows that within a given WHO-HI grade, the effect of LC dyad was significant for all WHO-HI grades and both ears, relatively small amounts of variance were explained by the LC dyad for those with the best (0) and worst (3) WHO-HI grades. For those with mild (1) or moderate (2) WHO-HI grades, however, 13–16% additional variance in speech-recognition performance was explained by the LC dyad within each WHO-HI grade.

Means and standard errors for LC dyads within subsets of the Mayo dataset formed by grouping those with the same WHO-HI grade. Left panels show HTLs for the left ears and the right panels shown the HTLs for the right ears. To be included in the subgroup analyses, LC dyads had to include at least 20 ears.

Transformed percent-correct scores in rationalized arcsine units (RAUs) for the W22 monosyllables in quiet as a function of lc dyad. Each WHO-HI grade from 0 to 3 is color-coded. Values plotted are the estimated marginal means and 95% confidence intervals from the GLM analyses shown in Table 4.
As Table 3, But for the Mayo Dataset. A Minimum of 20 Ears was Required to Include an LC Dyad in the Analyses. W22 Word-Recognition Scores were Transformed in Rationalized Arcsine Units (RAUs) Prior to Analyses. df = Degrees of Freedom for F. p = Significance Level. Partial Eta Squared and r2 are Measures of Effect Size and Indicate Variance Explained by LC Dyads Within a Given WHO Grade.

A second and slightly different approach to the comparison of the relationship between each audiogram classification and speech-recognition performance was pursued next. In these GLM analyses, the effects of LC dyad and WHO-HI grade were examined without restricting the data to subsets having equivalent WHO-HI grades. The results from these GLM analyses are summarized in Table 5. For the VA dataset, the effects of LC dyad on the six speech-recognition measures available consistently explain 6–10% more variance than the effects of WHO-HI grade. For the Mayo dataset, the LC dyads again explain more variance in the two speech-recognition scores than the WHO-HI grades but only about 3% additional variance is explained.
Results of GLM Univariate Analyses of Variance for the Effect of LC Dyad or WHO Hearing Impairment (HI) Grade on Each Measure of Speech-Recognition Performance (WIN, NU6 Quiet at Low Level, NU6 Quiet at High Level, Word Recognition Score-WRS) for Each Dataset and Each Ear (L = Left; R = Right). df = Degrees of Freedom for F. p = Significance Level. r2 are Measures of Effect Size and Indicate Variance Explained by Each Effect for Each Dependent Variable. Only Those LC Dyads with at Least 20 Ears Were Considered.

In the final comparison of the LC dyads to WHO-HI grades, self-report measures of hearing difficulties from all four datasets were used. Figures 9 and 10 show the NHANES population-weighted median audiograms for LC dyads with at least 20 cases within a given WHO-HI-grade subset. Once again, wide variations in high-frequency hearing occur within a given WHO-HI grade.
Population-weighted medians and standard errors for LC dyads within subsets of the NHANES 2011-12 and 2015-16 dataset formed by grouping those with the same WHO-HI grade. Left panels show HTLs for the left ears and the right panels shown the HTLs for the right ears. To be included in the subgroup analyses, LC dyads had to include at least 20 ears.

Population-weighted medians and standard errors for LC dyads within subsets of the NHANES 2017-20 dataset formed by grouping those with the same WHO-HI grade. Left panels show HTLs for the left ears and the right panels shown the HTLs for the right ears. To be included in the subgroup analyses, LC dyads had to have at least 20 ears.
Table 6 shows the results of univariate GLM analyses for each dataset and self-report measure. Both LC dyad and WHO-HI grade had significant relationships with each self-report measure. The variance explained was always greater for the LC dyads than for the WHO-HI grades, the advantage ranging from 3 to 10% additional variance explained across the comparison of the eight GLM analyses in Table 6. These analyses of functional measures of hearing indicate that the LC dyad better accounts for differences in hearing function than the WHO-HI grade system.
Results of GLM Univariate Analyses of Variance for the Effect of LC Dyad or WHO Hearing Impairment (HI) Grade on Each Self-Report Measure of Hearing Difficulty Used in Each of the Datasets (AUQ054-General Condition of Hearing; AUQ100 Difficulty in Noise; AUQ110 Frustration with Hearing; HHIE-S, Hearing Handicap Inventory for the Elderly-Screener; HHIA, Hearing Handicap Inventory for Adults). df = Degrees of Freedom for F. p = Significance Level. r2 is a Measure of Effect Size and Indicates Variance Explained by Each Effect for Each Dependent Variable.

Application of the LCH Triad System to Bilateral Symmetry and Audiometric Configuration
As noted in the Introduction, in addition to classification of hearing loss severity and configuration, the bilateral asymmetry of hearing loss is often of interest. Bilateral asymmetry was calculated here by subtracting the two L, C, or H grades for the right ear from those for the left ear. On average, a 1-point difference in L, C, or H grades corresponds to a bilateral asymmetry of about 10 dB. Figure 11 shows the prevalence of bilateral differences in L, C, and H grades for each of the four datasets. The distribution for H grades (bottom panel) is slightly broader than either of the other two distributions for PTA512 (L grade) and PTA346 (C grade). Generally, most bilateral differences across grades and datasets ranged between −1 and 1 corresponding to a ± 10-dB difference. Using this range of bilateral differences to define bilateral symmetry, Table 7 shows the prevalence of bilaterally symmetrical audiograms for each LCH Triad grade and dataset. Generally, the prevalence of bilateral symmetry was highest for L grades. For C grades, the prevalence of symmetry was considerably lower for the two clinical datasets than for the two NHANES datasets.

Population-weighted (NHANES; NH) or bootstrapped (VA, Mayo) distributions of prevalence of bilateral differences in L (top), C (middle), and H (bottom) grades. Error bars show 95% confidence intervals.
Bilateral Differences Within ± 1 (± 10 dB), Left Grade – Right Grade, for L, C and H Grades in Each Dataset. All Values are Percentages. L95 and U95 Represent the Lower and Upper Bounds of the 95% Confidence Intervals. Population-Weighted Estimates Were Generated for the NHANES Datasets and Bootstrapped Estimates Were Used for the VA and Mayo Datasets.

Bilateral symmetry has been defined in a wide variety of ways across studies, which makes comparison to other classification results challenging. Using < 10 dB bilateral difference in cluster centroids averaged across frequency to define symmetrical configurations, Ciletti and Flamme (2008) reported an overall prevalence of bilaterally symmetrical audiograms of about 82% for 20–69-year-olds in NHANES 1999-2004, which is in good agreement with the prevalence estimates obtained here. On the other hand, in a large clinical sample, Margolis and Saly (2008b) reported that about 50% of the audiograms were asymmetrical. As noted, a lower prevalence of bilateral symmetry was observed here in the clinical datasets, especially for C grades derived from PTA346, although these prevalence estimates of 77% do not approach the 50% reported by Margolis and Saly (2008b).
With L, C, and H grades of 0–9 for each frequency region in the LCH triad, there are 1000 possible triads and 100 possible dyads. Across the four datasets, 63–74% of the possible LC dyads and 21–34% of the possible LCH triads occurred (for at least one ear). Table 8 shows the top 25 dyads for each of the four datasets. About 44–47% of the top LC dyads in NHANES 2011-12 and 2015-16 were either 00 or 01, reflecting the high prevalence of very good hearing. The prevalence of either of these dyads did not exceed 5% in any of the other datasets.
Top 25 LC Dyads for the Left and Right Ears from NHANES, Mayo, and VA Datasets. All Values are Population-Weighted Percentages for NHANES and Bootstrapped Percentages for Mayo and VA Datasets. L95 and U95 = Lower and Upper Bounds for the 95% Confidence Intervals, Respectively. Entries with Missing Confidence Intervals for NHANES had Relative Standard Errors > 30% Indicating Unreliable Population Estimates.

Figure 12 shows the distributions of LC dyads for the left (blue) and right (red) ears for each of the datasets. The majority of LC dyads in NHANES 2011-12 and 2015-16 (top) were low in number, reflecting very good hearing. The two clinical datasets had distributions with LC dyad prevalences shifted to higher values, reflecting greater hearing loss for these datasets. Finally, the distributions of LC dyads for left and right ears among the nationally representative sample of those 70 to 80 + years of age in NHANES 2017-20 fell between those from a similar sample of younger adults (NHANES 2011-12 and 2015-16) and the two clinical samples.

Distributions of LC dyads for the left (blue) and right (red) ears of each of the four datasets. Pop.-Wtd.=population-weighted and applies only to the two NHANES datasets. All 90 LC dyads with non-zero counts for at least one ear and dataset are shown on the X-axis in each panel.
With three grades available, L, C, and H, there are nine possible configurations capturing the shape of the audiogram. The following rules were applied to assign LCH triads to clinical descriptors for each shape or audiometric configuration: (S) sloping, L < C & C < H; (F) flat, L = C & C = H; (R) rising, L > C & C > H; (P) peaked, L > C & C < H; (FS) flat with slope to 8000 Hz, L = C & C < H; (FR) flat with rising to 8000 Hz, L = C & C > H; (N) notched, L < C & C > H; (SF) sloping then flat to 8000 Hz, L < C & C = H; (RF) rising then flat to 8000 Hz, L > C & C = H.
Figure 13 presents the population-weighted prevalence values for each of the nine audiometric configurations identified above. The top two right-hand panels show the prevalence for the NHANES 2011-12 and 2015-16 datasets but split into younger, 20–44 years, and older, 45–69 years, subgroups. When combined with the distribution at the bottom right of Figure 13, the changes in the distributions of audiometric configurations among the general population as age increases are clear. The prevalence of flat-sloping (FS) and flat (F) configurations steadily decreases with advancing age while the prevalence of sloping (S) configurations increases. For the two clinical datasets in the left two panels, the configurations from the Mayo dataset are predominantly sloping (S) whereas those from the VA dataset have almost equal 30% prevalence values for S, N and SF configurations. The relatively high prevalence of the N (notched) configurations most likely represents the higher probability of noise exposure among those in the VA dataset compared to the other datasets. The higher prevalence of the notched configurations within the VA dataset is not surprising given the likely exposure of many military personnel and veterans to intense noise (Grant et al., 2021; Humes et al., 2006). In addition, it has been found that veterans who use VA health care services are more likely to have served longer in the military and in combat than veterans who did not avail themselves of these services (Meffert et al., 2019). The S, N1, SF and FS configurations are all variations of sloping configurations and when the prevalence of each of these configurations is averaged for the left and right ears and then summed, about 70–90% of the audiometric configurations across the datasets are sloping.

Population-weighted (NHANES) or bootstrapped (VA, Mayo) prevalence of each of the nine audiometric configurations identified in the LCH Triad system. In the two top-right panels the data for 20-69-year-olds in NHANES 2011-12 and 2015-16 were split into two age ranges, 20-44 years, and 45–69 years, to show the clear shift in configurations with advancing age among the general US population.
N configurations typically emerge early in noise exposure and with increasing length of exposure and advancing age often change to SF configurations or even S configurations with a “bulge” rather than a clear “notch” in the audiogram (Dobie, 2005; Humes et al., 2006; Moore, 2020). It is expected that noise exposure would increase the odds of having an N audiometric configuration. To investigate this, the noise-exposure metric from Humes and Moore (2022) was used to classify noise-exposure type. Noise-exposure type was established using responses to noise-exposure questions in NHANES 2011-12 and 2015-16 to classify the noise exposure into one of four types. These four types were: (1) one due solely to firearm use with little or no use of hearing protection devices while shooting; (2) one due to loud work noise only; (3) one due solely to off-work exposure to very loud noise; and (4) various combinations of these exposure types. Humes and Moore (2022) identified four specific combined-exposure conditions. These combined exposures, however, were not all experienced by females. As a result, the fourth noise type used in the present analyses was simply any combination of the three noise-exposure types. Population-weighted binary logistic-regression analyses were performed to determine whether self-reported noise exposure affected the odds of having an audiometric configuration of N. This was done for either ear and for both ears with odds ratios (ORs) adjusted for sex and age decade.
The global tests for the logistic-regression solutions indicated that the models were significant (Beta differed significantly from 0) with both F (6,29) > 6.8 and p < 0.001. Type-3 analyses of the main effects of noise-exposure type in each model were significant in both cases [either ear: F (4,29) = 2.81, p = 0.04; both ears: F (4,29) = 4.79, p = 0.004]. The effect of age decade was only significant for the case of either ear having an N configuration [F (4,29) = 9.16, p < 0.0001] whereas sex effects were significant for both dependent measures [F(1,32) > 18.70, p = 0.0001]. For an N configuration in either ear, the significant age effect resulted in odds ratios (OR) for an N configuration in either ear for 60–69-year-olds that were about half as great (OR = 0.52; 95% CI = 0.34, 0.81) as for 20–29-year-olds. No other significant ORs were observed for age. For sex, the odds of males having an N configuration were two times greater than for females whether this was in both ears (OR = 2.63; 95% CI = 1.67, 4.15) or in either ear (OR = 2.03; 95% CI = 1.73, 2.38). More importantly, regarding the ORs for noise exposure, bilateral N was 3–4 times greater for those exposed to loud work noise (OR = 3.85; 95% CI = 1.96, 7.56) or to various combined noise exposures (OR = 2.87; 95% CI = 1.38, 5.94) than for those with no noise exposure. For an N configuration in either ear, the OR for combined noise exposures was 1.62 (95% CI = 1.13, 2.32), which was the only significant effect of noise exposure in this case. In summary, noise exposure significantly increased the age- and sex-adjusted odds for the occurrence of N audiometric configuration for either or both ears. This validates the association of the N configuration with noise exposure. Recall that this was the primary rationale for including the H grade as a part of the LCH triad system.
General Discussion
The LCH Triad system developed and evaluated here resulted in prevalence estimates for the severity, configuration, and bilateral asymmetry of hearing loss that were generally consistent with prior findings using a variety of classification systems. In addition, the two-PTA-based LC dyads were demonstrated to sufficiently capture the variations in HTLs and to have greater functional relevance than the single-PTA WHO-HI grade system. This was true both for measures of speech-recognition performance and for self-report measures of hearing difficulties.
In some respects, it is not surprising that a two-parameter model of the audiogram, the LC dyad, accounted for more variance in performance than a one-parameter model, the WHO-HI grade. The two parameters of the LC dyad, however, were grounded in the results of the principal-components analyses and captured meaningful information in the audiograms. An arbitrary two-parameter model that was not grounded in the same fashion would not be expected to emerge as superior to the one-parameter WHO-HI grade simply because it has more parameters.
There are several limitations to the evaluation of the LCH Triad classification system described here. First, the number and type of functional measures of hearing were somewhat limited, except for the VA dataset. Second, HTLs at 250 Hz, an audiometric frequency typically included in clinical audiograms, were not included here for uniformity with the population data from NHANES. The exclusion of air-conduction pure-tone threshold measurement at 250 Hz is common in large-scale population studies, as hearing at this frequency is most influenced by the presence of background noise during testing often resulting in artificially high HTLs. The two clinical datasets included air-conduction pure-tone HTLs at 250 Hz and these HTLs were strongly correlated with PTA512, such that there was no need to additionally consider the threshold at 250 Hz within the classification system. Third, bone-conduction pure-tone HTLs were not included in NHANES at any frequency. Again, this is typically the case in large-scale epidemiological studies due to the complexity of the testing, the time required for that additional testing, and the somewhat limited additional information provided by these HTLs. As a result, bone-conduction thresholds were not considered in any of these analyses. Bone-conduction HTLs are typically used to aid in establishing the site of lesion as either outer/middle ear versus inner ear and epidemiological studies often include more efficient immittance measurements for this purpose (e.g., Humes, 2023b; McManus et al., 2022). Although there has been no evaluation of the suitability of the LCH Triad classification system for bone-conduction HTLs, it could be used to examine the differences between L and C grades for air- and bone-conduction, with a grade difference of 1 corresponding to a clinically significant air-bone gap of 10 dB.
Footnotes
Declaration of Conflicting Interests
The authors declared no potential conflicts of interest with respect to the research, authorship, and/or publication of this article.
Funding
The authors disclosed receipt of the following financial support for the research, authorship, and/or publication of this article: Support for open-access publication charges was provided by IU Libraries.