
Abstract
The use of in-situ audiometry for hearing aid fitting is appealing due to its reduced resource and equipment requirements compared to standard approaches employing conventional audiometry alongside real-ear measures. However, its validity has been a subject of debate, as previous studies noted differences between hearing thresholds measured using conventional and in-situ audiometry. The differences were particularly notable for open-fit hearing aids, attributed to low-frequency leakage caused by the vent. Here, in-situ audiometry was investigated for six receiver-in-canal hearing aids from different manufacturers through three experiments. In Experiment I, the hearing aid gain was measured to investigate whether corrections were implemented to the prescribed target gain. In Experiment II, the in-situ stimuli were recorded to investigate if corrections were directly incorporated to the delivered in-situ stimulus. Finally, in Experiment III, hearing thresholds using in-situ and conventional audiometry were measured with real patients wearing open-fit hearing aids. Results indicated that (1) the hearing aid gain remained unaffected when measured with in-situ or conventional audiometry for all open-fit measurements, (2) the in-situ stimuli were adjusted for up to 30 dB at frequencies below 1000 Hz for all open-fit hearing aids except one, which also recommends the use of closed domes for all in-situ measurements, and (3) the mean interparticipant threshold difference fell within 5 dB for frequencies between 250 and 6000 Hz. The results clearly indicated that modern measured in-situ thresholds align (within 5 dB) with conventional thresholds measured, indicating the potential of in-situ audiometry for remote hearing care.
Keywords
Introduction
With in-situ audiometry, hearing thresholds are measured through the patient's hearing aid. A built-in sound generator in the hearing aid delivers the sounds, and the sound presentations can be controlled using the manufacturer's fitting software. Since the thresholds are measured “in-situ” or “in place,” it directly considers the patient's ear canal characteristics and real-ear acoustics (Keidser et al., 2011; Kiessling et al., 2015; O’Brien et al., 2010). The approach was originally introduced by Widex to improve the accuracy of the hearing aid fitting (Ludvigsen & Tøpholm, 1997) and has gained further attention in recent years in the context of connected hearing care or teleaudiology. Its lower resource and equipment requirements, compared to the recommended clinical standard involving conventional audiometry and real-ear measurements (REM), make it appealing and potentially suitable for remote hearing aid fitting and locations lacking standard audiometric equipment (Boymans & Dreschler, 2017; Convery et al., 2019; Glista et al., 2023; Wong, 2011).
The established standard for verifying appropriate hearing aid gain involves assessing hearing thresholds using conventional audiometry, followed by REM (American Speech and Hearing Association, 2023; Valente et al., 2006), with the prescription formulas based on conventional thresholds. During REM, the sound pressure level in a patient's ear canal is measured using a thin probe while wearing the hearing aid in order to assure that the hearing aid output is in line with the rationale of the prescriptive targets. While REM fittings, compared to the manufacturer's initial fit, offer significant positive effects on speech intelligibility and user preference, it remains uncertain whether its clinical significance justifies the associated costs, training, and clinical time investment (Almufarrij et al., 2021). Moreover, only half of the audiologists perform REM (Abrams et al., 2012). Modern hearing aid fitting software allows indicating a conventional audiogram, an in-situ audiogram, or both.
While the test-retest reliability of in-situ audiometry aligns with that of conventional audiometry (O’Brien et al., 2010; Smith-Olinde et al., 2006), concerns about its validity have been raised. Notably, substantial differences between the two audiograms have been detected (DiGiovanni & Pratt, 2010; Kiessling et al., 2015; O’Brien et al., 2010), often attributed to the real-ear-to-dial difference (REDD), representing the difference between the sound level indicated by the audiometer dial setting and the sound pressure level measured in the real ear. O’Brien et al. (2010) concluded that in-situ audiometry is only valid when a REDD correction is applied. Without such a correction, significantly higher low-frequency thresholds are measured in-situ compared to those measured with insert earphones.
Especially when using open-fit hearing aids, the REDD differences can be substantial (O’Brien et al., 2010). Open-fit hearing aids incorporate large vents in the earmolds or dome to reduce the occlusion effect and improve the own-voice perception and naturalness of the sound (Winkler et al., 2016). Open-fit hearing aids are typically prescribed for patients with normal to mildly increased hearing thresholds at lower clinical audiological frequencies, often associated with age-related hearing losses (Schlauch & Nelson, 2015), a major cause of hearing loss (World Health Organization, 2023). However, the vents used for open fittings can lead to low-frequency leakage (Dillon, 2012; Kiessling et al., 2005). Even closed-fit hearing aids, without vents, may experience leakage due to an imprecise fit of the earmold or dome in the patient's ear (O’Brien et al., 2010; Winkler et al., 2016). Kiessling et al. (2015) reported that fitting software modules of the manufacturers involved in their study appeared to not use any REDD-based corrections. The latter study suggested that hearing aid manufacturers should implement device-specific calibration offsets or that clinicians should apply individual REDD corrections to better leverage the potential advantages of in-situ audiometry. However, in a large retrospective analysis of clinical hearing aid fitting logs in 2020, a mean difference of less than 1 dB was found between conventional and in-situ thresholds for Phonak devices (Vercammen, 2020).
Furthermore, hearing aid manufacturers hold varying philosophies regarding in-situ audiometry. Some, like Widex, advocate for using in-situ thresholds for all hearing aid fittings, accompanied with always performing a feedback analysis to estimate the vent effect. Phonak, for example, argues that a fitting based on in-situ thresholds offers a swift and accurate fitting method. Some, such as GN Resound, recommend in-situ audiometry only when conventional audiometry is not feasible, or as a means of making flexibility to the fitting process (as suggested by Oticon, Signia, Rexton). GN Resound's software specifically instructs clinicians to use a closed dome for measuring in-situ thresholds, regardless of whether the patient wears an open or occluded hearing aid. All these hearing aids offer the option of fitting hearing aids based on in-situ audiometry. In our clinic, audiologists observed similar hearing thresholds when testing patients with conventional audiometry compared to in-situ audiometry shortly after. Considering prior recommendations for individual REDD corrections (Kiessling et al., 2015), there arose a need to comprehensively understand the current in-situ processes across various manufacturers, and to enhance the transparency of the fitting process from a clinical standpoint. The investigation explored the following aspects: (1) The current integration of REDD corrections into hearing aid fitting software, considering whether they operate as adjustment of the prescribed gain (Experiment I) or if they are directly incorporated as compensation in the in-situ stimuli (Experiment II). (2) For real patients wearing open-fit hearing aids, an examination was conducted to identify any discrepancies between the hearing thresholds measured using conventional and in-situ audiometry (Experiment III).
Experiment I: Recording Hearing Aid Output Using a Test Box
Methods
The investigation focused on the hearing aid output of receiver-in-canal devices from six manufacturers. All hearing aids were programmed using the latest version of the manufacturers’ fitting software (indicated in Table 1). The selection of hearing aids was based on their classification as high-end and widespread use during the investigation in 2021, and all were capable of performing in-situ audiometry. However, there were variations in the range of frequencies and hearing levels covered by the in-situ audiometry feature. Most hearing aids could conduct in-situ audiometry for frequencies of 250, 500, 750, 1000, 1500, 2000, 3000, 4000, and 6000 Hz. Widex, however, excluded 250 Hz for open-fit hearing aids, and Oticon and Widex included 8000 Hz in their in-situ audiometry.
The Used Hearing Aid Models and Manufacturers’ Hearing Fitting Software Employed in This Study, and the Selected Receivers to Address the Hearing Losses Based on Standard Audiograms N1, N2, and N3.

All hearing aids were configured to align with the NAL-NL2 prescription as indicated by the hearing aid software (Keidser et al., 2012) for a 50-year-old female with precise average real-ear-to-coupler difference, long-term hearing aid experience, and a sensorineural hearing loss in the right ear. A monaural fit for the right ear was chosen to report. These settings were kept the same across fittings and brands, as these parameters affect the target curves and, consequently, the hearing aid output. Three variables were adjusted by manipulating in the hearing aid fitting software: (1) the degree of hearing loss, (2) the audiogram type, and (3) the acoustic coupling.
The degree of hearing loss was manipulated by programming the hearing aids to standard audiograms N1, N2, or N3 (Bisgaard et al., 2010), representing common degrees of hearing loss currently used for in-situ audiometry. These standard audiograms range from mild to moderate sensorineural hearing loss. The audiogram type was either the in-situ audiogram, the conventional audiogram, or both (only for N2), set in the hearing aid fitting software. To investigate whether the hearing aid software would prioritize a specific audiogram type to calculate the hearing aid gain, hearing aid output was measured either with the standard audiograms alone given as conventional audiogram in the fitting software, or together with the N2 audiogram given as the in-situ audiogram in the software. One measurement was also performed with the N2 audiogram as the in-situ audiogram, without indicating the conventional audiogram. To additionally explore whether REDD corrections were implemented as prescription target gain corrections, the N2 and N3 audiograms were indicated in the software given as either the conventional audiogram or the in-situ audiogram. By manipulating the degree of hearing loss, achieved by indicating different standard audiograms in the software, one can determine whether the software calculates the gain based on the audiogram of the conventional thresholds or based on the thresholds provided by the in-situ audiogram. If the choice of transducer was available (for Oticon, Phonak, GN Resound, and Widex), insert earphones with a foam tip were chosen as the used transducer. The acoustic coupling was either a standard open dome or a closed (double or power) dome.
Prior to conducting the hearing aid output measurements, a feedback analysis was performed using the Bruël and Kjær Type 4128 Head and Torso Simulator (HATS) to estimate the vent effects. Even though the domes used, as indicated in Table 1, were not directly comparable in size, they all fit well in the ear of the HATS.
The hearing aid output for each combination of hearing aid, degree of hearing loss, audiogram type, and acoustic coupling was then measured using the Interacoustics Affinity Compact test box and the Affinity Suite version 2.16.0 (REM440 software module) with a HA-1 2cc coupler and putty. The hearing aid output, or real-ear aided response (REAR), was recorded for the International Speech Test Signal presented at 65 dB SPL for 15 s (Holube et al., 2010). Domes were not used during the recordings with the Affinity Compact; they were employed only for the feedback analysis with the HATS. Consequently, the measurements in Experiment I essentially had a closed coupling between the hearing aid and the coupler. Ten measurement recordings were conducted for each condition, and efforts were made to keep the position of the coupler, hearing aid, and external microphone as stable as possible to account for potential inaccuracies during measurement, small ambient noise variations, hearing device effects, and microphone location effects.
The data were saved as XML files and analyzed in Python 3.8.3. To determine whether the hearing aid output curves were significantly different from each other, the output curves had to exceed 3 dB root mean square (RMS) across all frequencies, or more than 10 dB at a single frequency (Keidser et al., 2011).
Results
Initially, the measurements were utilized to calculate differences between REARs measured using the conventional audiogram in the hearing aid software, the in-situ audiogram, or both. The goal was to investigate whether hearing aid fitting software prioritizes either the conventional or the in-situ audiogram. The RMS differences across frequencies are presented in Table 2. The RMS deviations exceeded 3 dB across all hearing aid models when comparing the REAR using the conventional audiogram N2 with the REAR using the conventional audiogram N1 or the conventional audiogram N3 (grey columns in Table 2). Consequently, and as expected, the measured REAR differed depending on the provided standard audiogram (i.e., the degree of hearing loss).
RMS Differences in Real-ear Aided Response (REAR) for all Tested Hearing aid Models, Domes, and Conditions, Measured When Indicating the Conventional Audiogram, the In-situ Audiogram, or Both in the Hearing Aid Fitting Software.

The 3.1 dB deviation for the Phonak open-fit is unlikely caused by the conventional audiogram. See text for details.
The grey columns indicate RMS deviations exceeding 3 dB.
However, the REAR differences between the REAR when indicating only the in-situ N2 audiogram and the REAR when indicating both a conventional audiogram and the in-situ audiogram N2 resulted in RMS deviations lower than 3 dB across all hearing aid models, except for the Phonak open-fit. Conclusions were the same for all conventional audiograms N1, N2, and N3 (columns 5–7). The median RMS difference was 0.7 dB (min 0.16, max 3.1 dB) between the REAR using the in-situ audiogram only and that using both the conventional and in-situ audiogram. This represents a clear difference compared to the two first rows in Table 2, which can be viewed as control conditions. Further inspection by calculating the maximum REAR deviations instead of the RMS showed that the 3.1 dB RMS difference observed for the Phonak open-fit (in the 6th column) was caused by a deviation of up to −12.9 ± 0.4 dB near 1500 Hz. Similar deviations of up to −14.9 ± 0.5 dB were observed for the Phonak open-fit 2.8 dB RMS deviation (5th column). However, as this effect was a localized deviation only at 1500 Hz, it is unlikely caused by the conventional audiogram.
As a result, the measurements suggest that the hearing aid fitting software from the different manufacturers prioritizes the in-situ audiogram, thereby overwriting the conventional audiogram when both are provided to the hearing aid fitting software.
Secondly, to investigate whether any adjustments were made in the prescribed target gains, differences were calculated between the REAR when indicating either the conventional audiogram or the in-situ audiogram. Figure 1 provides an example of the REAR curves obtained with an open-fit hearing aid. For the same standard audiogram, the REARs were similar when indicating either the in-situ or the conventional audiogram in the hearing aid fitting software.

Example of an open-fit hearing aid (Oticon) programmed for two standard audiograms (N2 and N3). For each standard audiogram, the hearing aid is configured either using in-situ or using the conventional audiogram. The left panel shows the measured real ear aided response (REAR), while the right panel shows the differences between these REAR curves for each degree of hearing loss (i.e., for each standard audiogram). Each curve represents the mean of ten measurements. Shaded areas, omitted for clarity in the left panel, indicate ± one standard deviation.
Table 3 presents an overview of the maximal REAR differences between these conditions for all hearing aid models and the two acoustic coupling type settings. In general, the REAR measured with either the conventional audiogram or the in-situ audiogram were similar, and only the Widex closed condition was deviating more than 10 dB at a single frequency (Keidser et al., 2011). Visually, some deviations were seen for the Phonak closed-fit measurements and the Widex closed-fit measurement for audiogram N3, and values of maximal REAR differences exceeding 5 dB are therefore indicated in grey in Table 3. Note that these differences were not found for the other closed-fit hearing aids.
Maximal REAR Differences in dB From the Real Ear Aided Response (REAR) Output Curves Obtained When Indicating Only the Conventional Audiogram N2 (or N3) Versus When Indicating Only the In-situ Audiogram N2 (or N3).

The measurements were done for all hearing aid models and two acoustic coupling types. Only rear differences for frequencies below 1000 Hz were considered. Values exceeding 5 dB are marked in grey.
In summary, REAR was unaffected by audiogram type in most cases, and for all open-fit measurements, suggesting that any in-situ corrections were not implemented as corrections to the prescribed gain.
Experiment II: Recording in-Situ Stimuli Using a Manikin
Methods
Given that the set-up from Experiment I with the Affinity Compact test box inherently had a closed connection, the Bruël and Kjær Type 4128 HATS was employed in this experiment to directly record the in-situ stimuli. The hearing aids were placed behind the ear of the HATS, and the receivers and domes in the ear of the HATS, with the hearing aids connected to fitting software. A realistic feedback analysis with either open or closed domes in the ears of the HATS could thus be performed, which was considered important because at least some manufacturers use the feedback analysis to estimate the vent effect. After feedback analysis, the in-situ stimuli were recorded using Audacity version 3.0.0, and the HATS was connected to a Bruël and Kjær Type 2250 sound level meter. All recordings took place in a soundproof booth. The hearing aids were programmed as in Experiment I. Three conditions were investigated based on whether measurements were conducted using open or closed domes (see Table 4).
The Three Conditions That Were Used in Experiment II, Each Depending on the Selection in the Software and on Whether the Recording Measurement was Performed Using Open or Closed Domes.
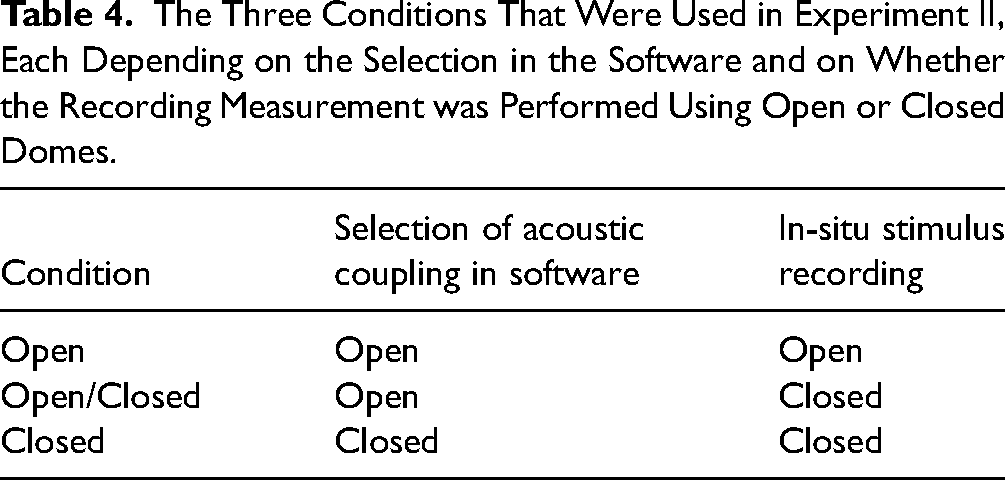
Anticipating potential leakage in the open condition, a comparison between the open and open/closed condition enabled an estimation of the amount of leakage associated with an open dome compared to a closed dome. To explore whether the intensity of the in-situ stimuli depended on the acoustic coupling selected in the software, a comparison was made between the open/closed and closed conditions. If no corrections were applied for the open-fit, it was expected that the open/closed and closed conditions would be similar.
It was assumed that higher stimulus intensities would yield more stable results, however, the in-situ fitting range varied among the different hearing aid models and acoustic couplings. Therefore, the frequency ranges tested were 250–6000 Hz, with the exception of the Oticon and Widex hearing aids that could also test at 8000 Hz, and the Widex hearing aid that did not include 250 Hz. The hearing levels used, as indicated in the hearing aid software, for the in-situ tones were 70, 45, 45, 50, 50, and 45 dB HL for GN Resound, Signia, Rexton, Phonak, Oticon, and Widex, respectively. At 500 Hz, 30 dB HL was used for the Widex hearing aid as that was the upper limit at that frequency. Note that these hearing levels represent the dial settings used for stimulation. In-situ tones were played for 5–10 s. Given that the Widex software did not allow manual control of the tone duration, four pulsed tones were presented and played ten times for each test frequency.
Each recording was repeated five times to address potential recording errors associated with the placement of the dome in the ear of the HATS. Means and standard deviations were then calculated as a function of frequency. Between each recording measurement, the hearing aids and domes were entirely removed and replaced. For each hearing aid, the relative behavior of the sound level recordings for the conditions outlined in Table 4 was compared. It is important to note that absolute sound pressure levels between the hearing aid models should be avoided, as input levels varied.
The Audacity recordings were analyzed in Python 3.8.3 and initially saved as WAV-files in 32-bit floating-point format, representing dimensionless values between −1 and +1. These data were then converted to dB using the formula 20log10. Calibration involved a ten-second recording of the Bruël and Kjær Type 4230 sound level calibrator producing 94 dB SPL at 1000 Hz. Wav files were corrected by subtracting the mean of the converted peak heights from 94 dB. The standard deviation of this estimate was added to additional measurement errors using the law of error propagation.
Results
For all hearing aid models except ReSound, a visual examination of the recorded SPL for the in-situ stimuli of each hearing aid indicated that the SPL was highest for the open/closed condition, and often similar for the open and closed condition. However, Signia and Rexton in-situ stimuli exhibited differences of 11 ± 5 dB and 15.5 ± 0.5 dB, respectively, between open and closed conditions at 250 Hz. A different pattern was observed for ReSound hearing aids, where the SPLs of the in-situ stimuli in the open condition were lower than those of both the open/closed and closed conditions, with differences of up to 27 dB at 250 Hz.
Figure 2 illustrates that leakage occurs in the low frequencies when using an open dome, as a difference of up to 30–35 dB SPL across hearing aid models was observed in in-situ stimuli between the open/closed and open conditions. The extent of low-frequency loss was comparable across hearing aid models, except for Widex, where a difference of 9 ± 3 dB at 500 Hz was noted. However, the measurement reliability at this frequency for Widex was more questionable than for other measurements due to the limitations of the stimulus intensity level, which was only 30 dB HL in this case.
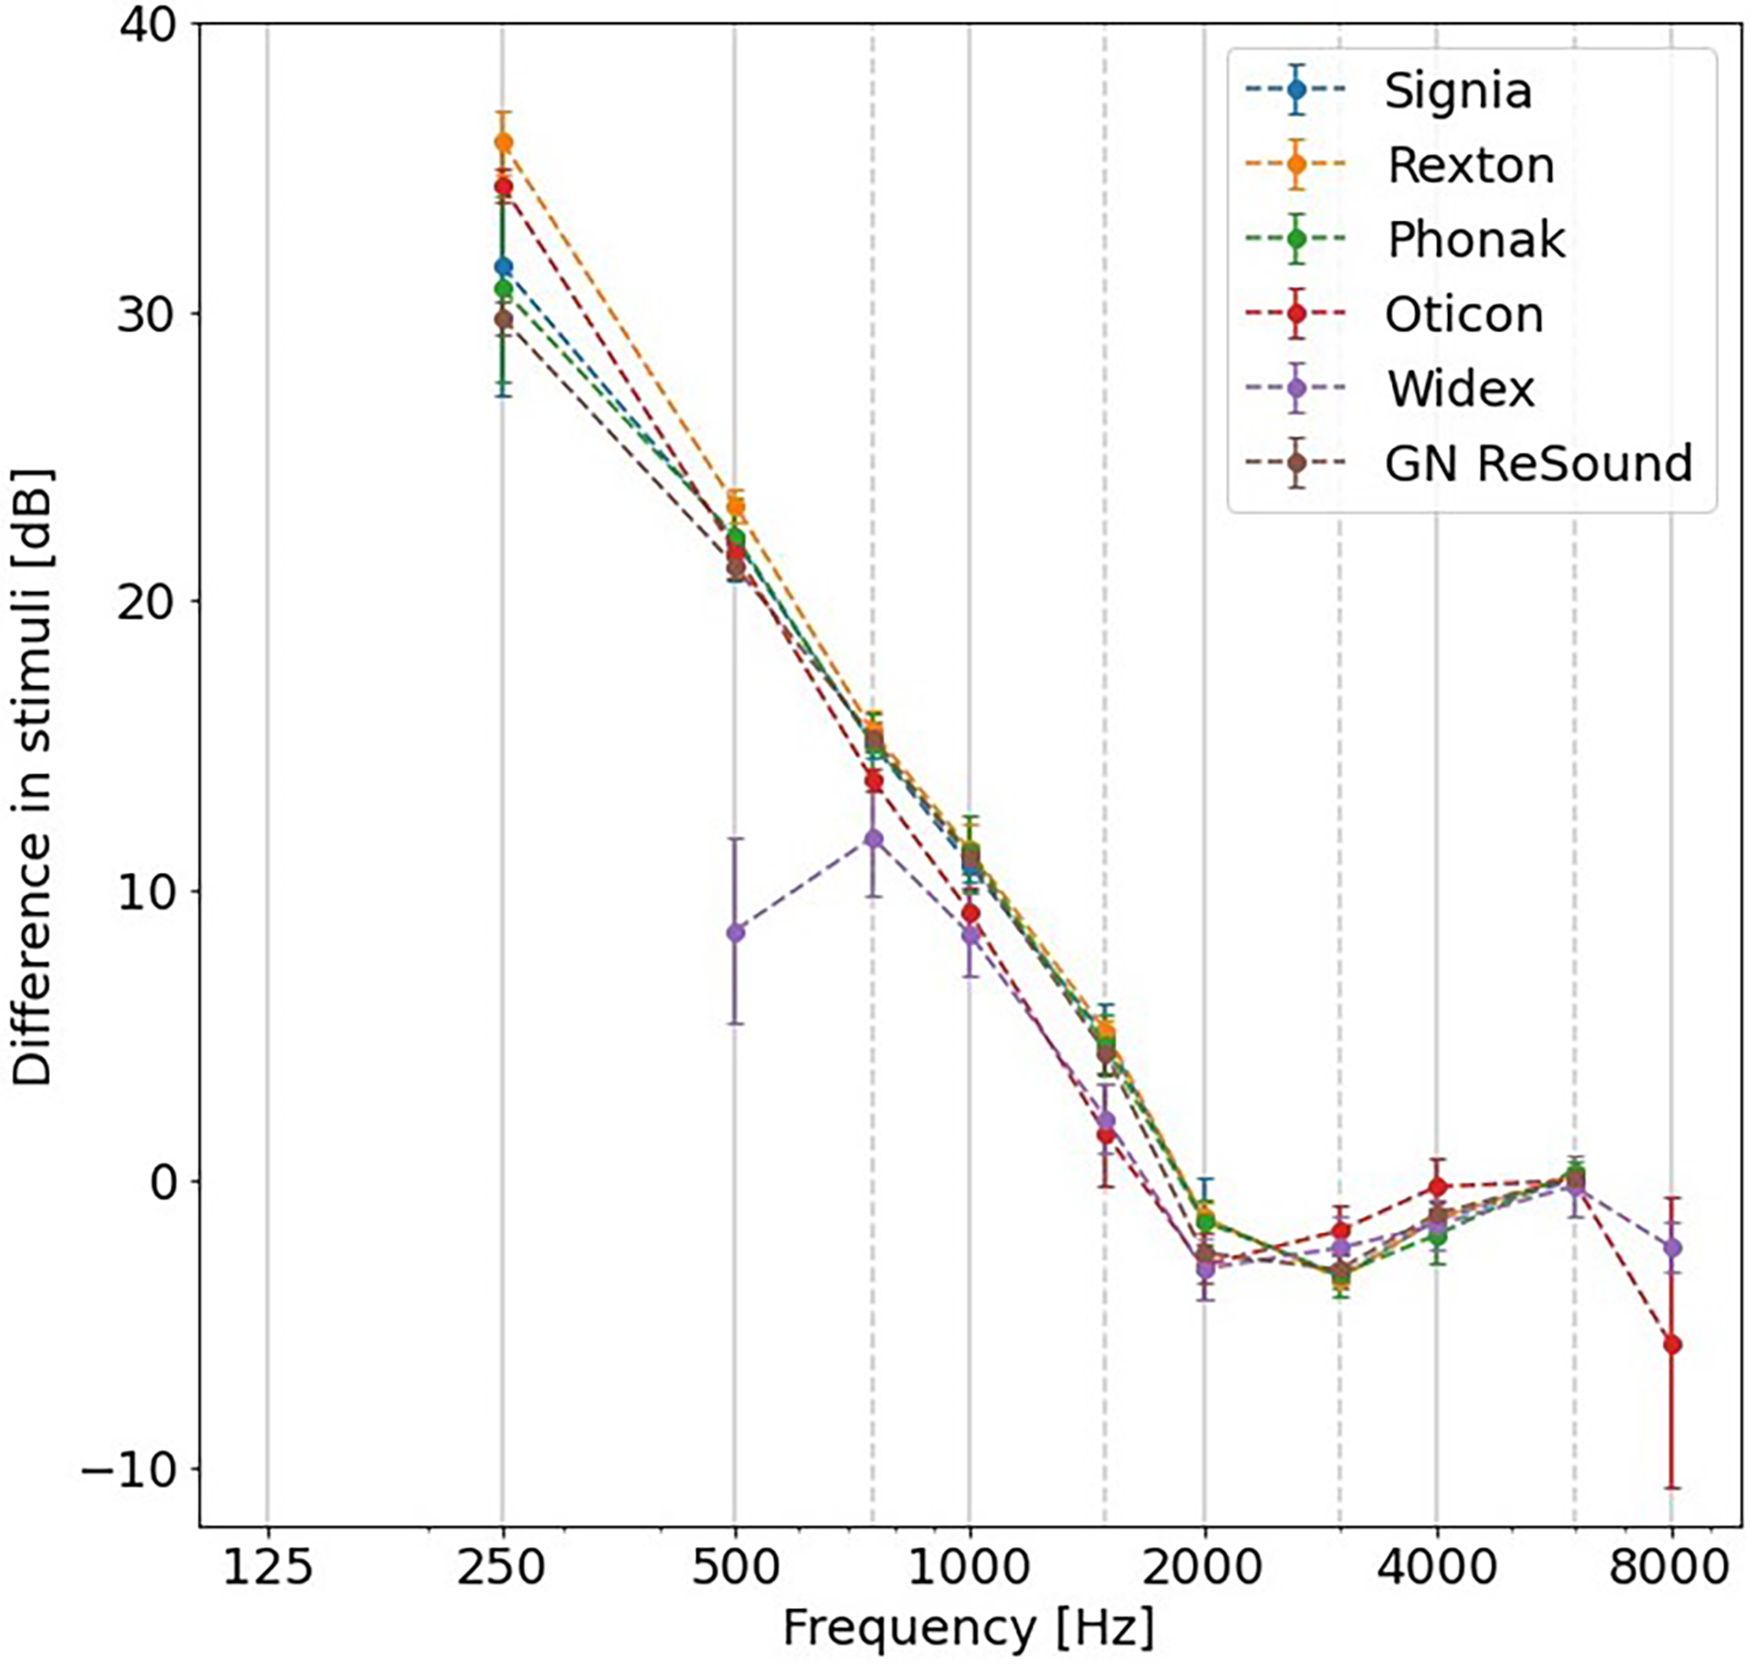
The difference in SPL between open/closed and open conditions for each hearing aid model. Error bars represent ± one standard deviation.
To investigate whether the delivered SPL of the in-situ stimuli itself was adjusted when indicating an open fit in the hearing aid software, the open/closed and closed conditions were compared, as shown in Figure 3. For GN ReSound, the differences in SPL between these conditions were within 5 dB across frequencies, indicating that the stimuli in the open/closed condition were similar to those in the closed condition. However, for all other hearing aid models, an SPL difference up to 30 dB was observed between the stimuli of the two conditions for frequencies at and below 1000 Hz. This suggests that the in-situ stimuli itself are corrected when indicating an open-fit acoustic coupling in the hearing aid fitting software.
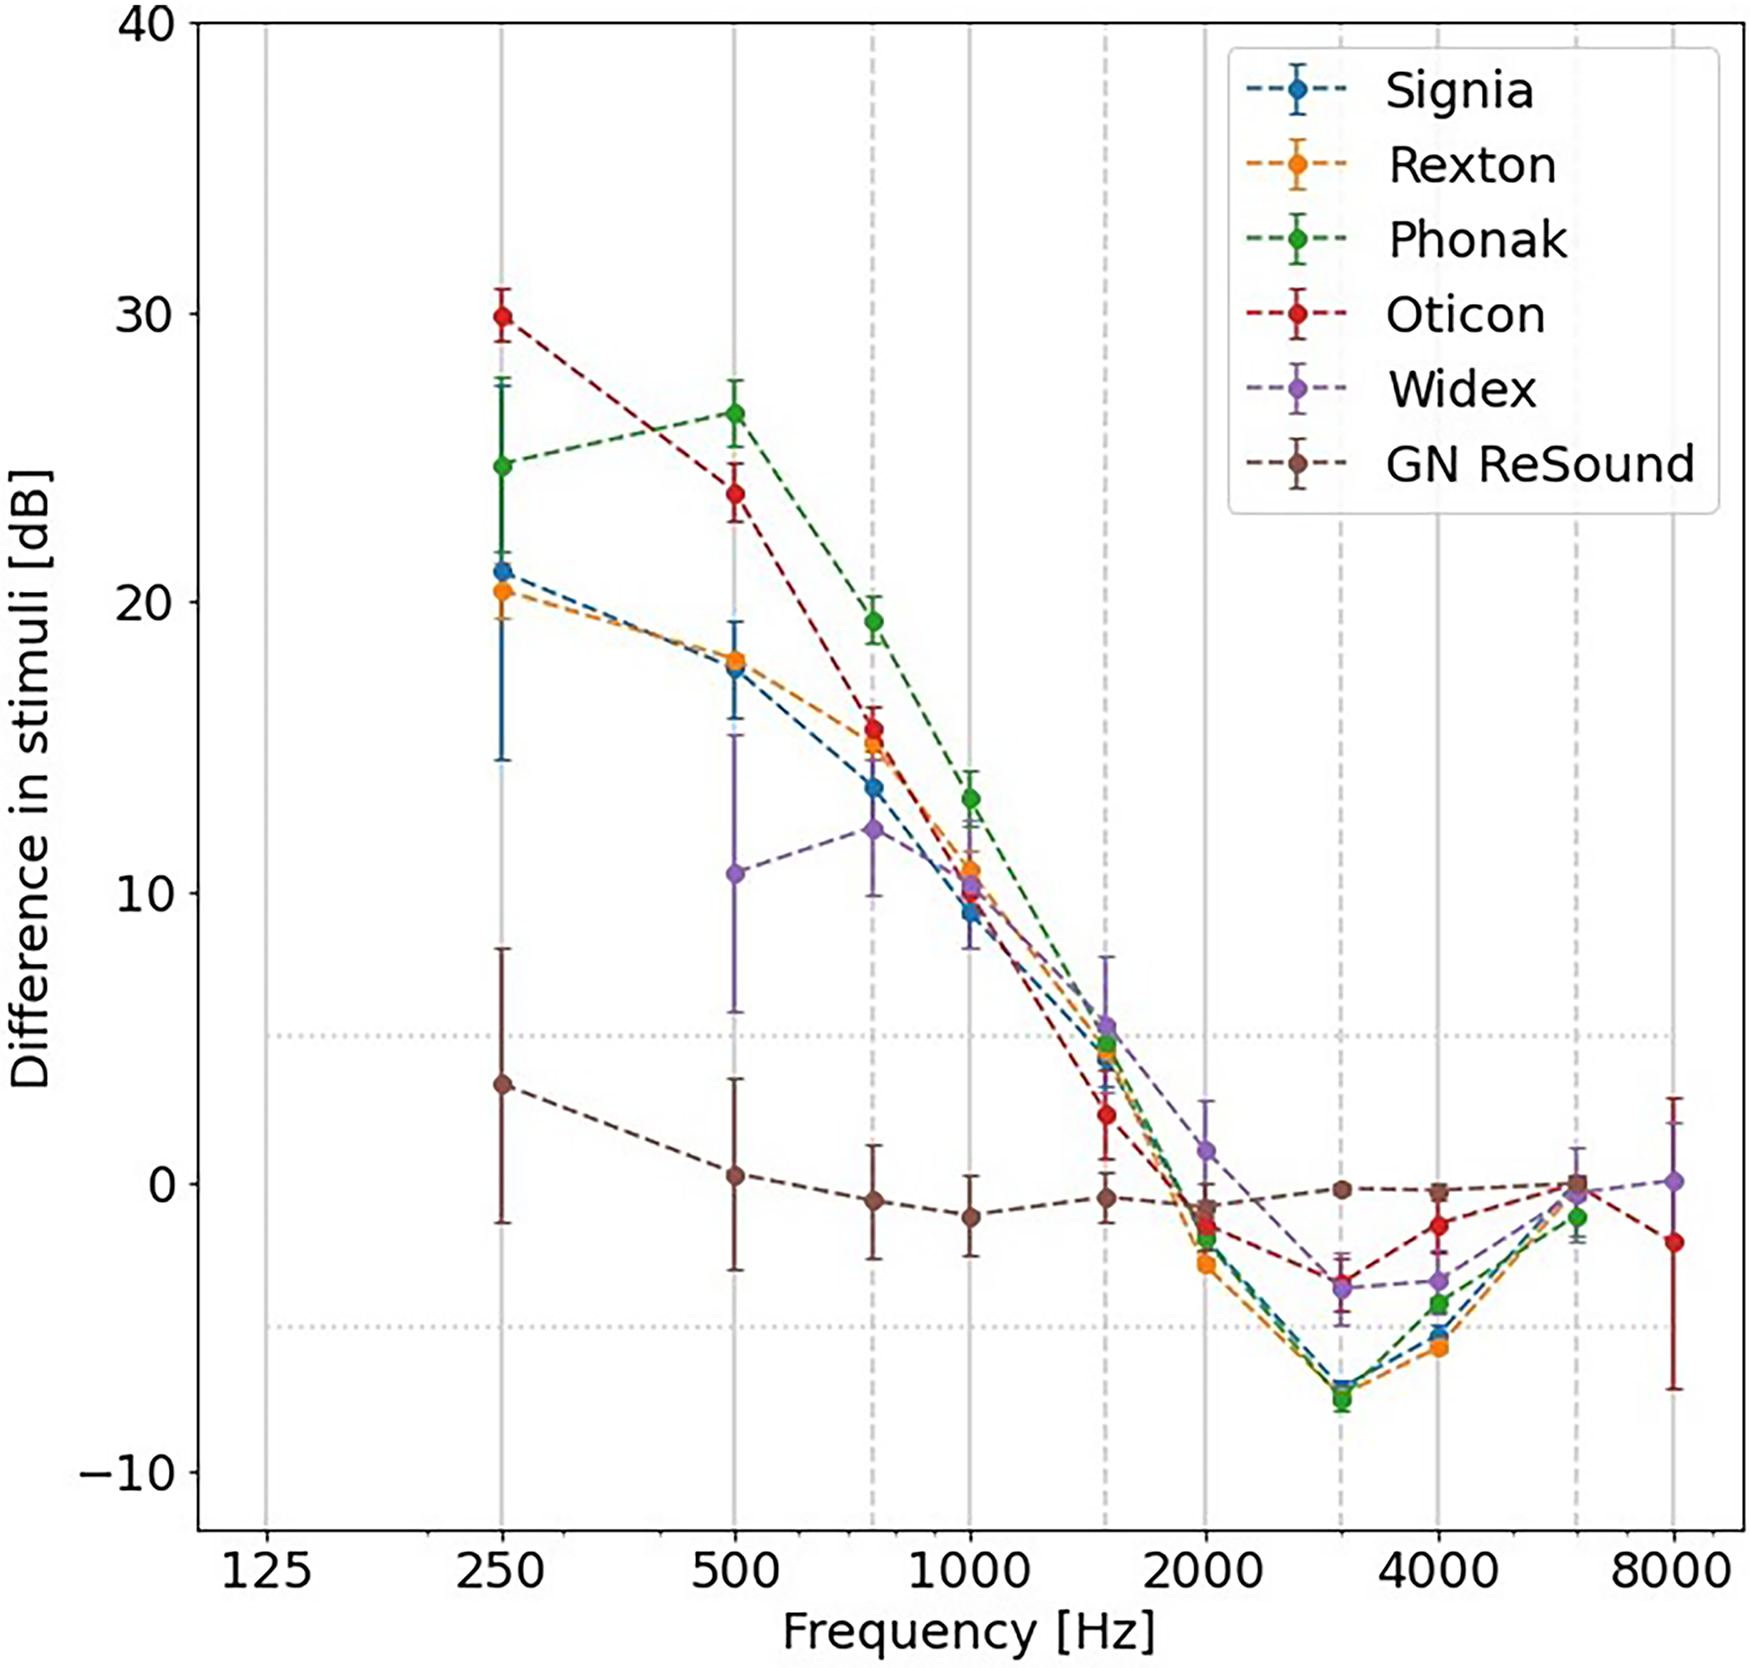
The difference in SPL between open/closed and closed conditions for each hearing aid model. Error bars indicate ± one standard deviation.
The results are thus in line with the companies’ philosophies, as GN ReSound encourages to use closed domes for in-situ audiometry, even when the patient is using hearing aids with open domes.
Experiment III: Audiometry With Real Patients
Methods
For the final experiment, the audiometric thresholds of real participants were compared, measured either with conventional audiometry or with in-situ open-fit audiometry. Eleven participants (five female, six male) with an average age of 66 years (range 31–74 years) were recruited from the Ear, Nose, Throat and Audiology department at Bispebjerg Hospital (affiliated to Rigshospitalet, Denmark). All recruited participants were known in the hospital for having symmetrical, mild-to-moderate, high-frequency sloping, sensorineural hearing loss. The audiograms conducted during a clinical appointment within the past six months from the time of the research appointment indicated that their thresholds did not exceed 25 dB between air conduction of the worst hearing ear and bone conduction of the best hearing ear at any frequency. This ensured that masking of in-situ audiometry was not necessary in the present study. All participants were experienced and current hearing aid users. Ten participants wore receiver-in-canal hearing aids, and one participant used in-the-ear hearing aids. However, the participants’ own hearing aids were not used for his study. Written informed consent was obtained from all participants, and the experiments received approval from the Science-Ethics Committee for the Capital Region of Denmark (reference H-16036391). The participants were compensated for their time.
Otoscopic examination was conducted for all participants before testing to ensure unobstructed ear canals. Conventional audiometric thresholds were obtained with ER-3A insert earphones at audiometric test frequencies between 125 and 8000 Hz using the Hughson-Westlake 5-up 10-down procedure (Carhart & Jerger, 1959) and the Interacoustics AC40 audiometer. In-situ audiometric thresholds were obtained using the same Hughson-Westlake 5-up 10-down procedure with the Rexton, Phonak, Oticon, and Widex hearing aids used in Experiment I and II (see Table 1). We did not select a hearing test with GN Resound devices because we could not locate any corrections in Experiment II, and this manufacturer also recommends the use of closed domes for open fittings. Additionally, we omitted a hearing test with Signia hearing devices, as the software appeared very similar to that of Rexton hearing aids, and both brands are owned by Signia (now WS Audiology). Therefore, hearing tests were conducted with four out of six hearing aids from Experiments I and II, to avoid participant fatigue. Receiver and dome size were chosen based on clinical judgment appropriate for each participant, but all measurements were performed with open domes and either S or M receivers.
Test frequencies were selected to closely match those used for conventional audiometry, but were contingent on hearing aid fitting software limitations (see Experiment II). In-situ thresholds were measured at test frequencies ranging from 250 Hz to 6000/8000 Hz. The threshold at either 6000 Hz or 8000 Hz was measured, depending on which frequency was the highest allowed in the in-situ module.
Consequently, each participant underwent a total of five audiometric hearing tests in one ear (once with conventional audiometry and four times with different hearing aids using in-situ audiometry). The chosen test ear was counterbalanced across participants, and the test order was randomized within each participant. Testing took place in a sound-treated test booth.
Four repeated-measures ANOVAs were performed for each tested hearing aid model, with threshold as the dependent variable and frequency and transducer (insert earphone or in-situ) as the repeated-measures independent variables. One participant was omitted from the ANOVAs for the Rexton, Phonak, Widex, and Oticon analysis because the thresholds above 4000 Hz could not be obtained, and two more participants were omitted from the Widex ANOVA because thresholds at 500 and 8000 Hz could not be obtained. Even though omitted from the statistical analysis, all of the three participants’ thresholds that were obtained in-situ fell within 5 dB of their conventional thresholds. The data of 125 Hz was not included in the statistical analysis because only two participants had thresholds within in-situ range at this frequency. p-Values were adjusted for multiple comparisons using the Holm correction.
Results
Based on the results of the conventional audiometry, participants exhibited a mean pure tone average of 36 dB HL (range 22–55 dB HL), calculated at 500, 1000, and 2000 Hz, with all participants demonstrating a sloping, high-frequency hearing loss. As illustrated in Figure 4, the mean interparticipant threshold difference was within ± 5 dB for frequencies between 250 and 6000 Hz. Due to the limited in-situ range at 125 Hz (stimulus levels of 0 to 30 dB HL), only two participants could be tested who obtained thresholds within this range for Oticon devices.

Participants’ in-situ audiometry thresholds measured with four different hearing aid models relative to the participants’ thresholds measured with conventional audiometry. Note that only two data points were collected at 125 Hz. Error bars are shifted for better visibility.
The four independent repeated-measures ANOVAs revealed that frequency significantly influenced the hearing thresholds (with F(5,45) = 25.9, p < .001, F(5,45) = 31.3, p < .001, F(5,45) = 26.7, p < .001, and F(4,28) = 25.0, p < .001, respectively, for Rexton, Phonak, Oticon, and Widex). However, the transducer did not have a significant effect on the hearing thresholds (with F(1,9) = 3.16, p = .220, F(1,9) = 5.38, p = .135, F(1,9) = 9.24, p = .056, and F(1,7) = 1.29, p = 0.290, respectively). Thus, the thresholds measured using insert phones or in-situ audiometry were not significantly different.
Discussion
The results from the experiments in this study suggest that all hearing aid companies, despite variations in their philosophies and implementations, address the issue of low-frequency leakage (<1000 Hz) that may occur with open-fit hearing aids. Consequently, modern in-situ thresholds reflect compensated “in-situ” thresholds to align them more closely with conventional thresholds In Experiment I, we observed that corrections were not applied directly to the delivered gain, and that the fitting software typically prioritizes the in-situ audiogram over the conventional audiogram when calculating gain prescriptions, especially for open-fit target prescriptions and sensorineural hearing losses. In Experiment II, it was evident that all hearing aid models, except GN ReSound, compensate for low-frequency leakage by adjusting the delivered in-situ stimulus for open fittings. This entails presenting higher sound levels presented at low frequencies for open domes compared to closed domes. GN ReSound, in line with its philosophy, does not implement such correction and recommends performing in-situ audiometry with closed domes even when patients use hearing aids with open domes to prevent low-frequency leakage during the procedure. In Experiment III, no significant differences were found between the hearing thresholds measured with real participants using conventional audiometry or in-situ audiometry with open domes for all tested hearing aid models. A limitation of this study is that we could only include 11 participants though, instead of the suggested 15 participants as calculated by sample size estimation. It should also be noted that the absence of a statistically significant difference between the thresholds does not equate to confirming their similarity. However, the results of all experiments taken together suggest effective compensation for low-frequency leakage.
The in-situ hearing thresholds measured in this study closely aligned with conventional hearing thresholds, in contrast to previous studies (Kiessling et al., 2015; O’Brien et al., 2010). Similar to the frequency-dependent REDD differences reported by O’Brien et al. (2010), the corrections identified in this study were most pronounced for frequencies below 1000 Hz. Additionally, in Experiment I, we observed REDD corrections for in-situ measurements through closed domes with the Phonak and Widex hearing aids used in this study, consistent with findings by O’Brien et al. (2010). The difference in sound pressure level between the open/closed and open conditions in Experiment II was comparable in magnitude to the average REDD difference between the insert earphone and in-situ through open domes condition reported by O’Brien et al. (2010). Given that Kiessling et al. (2015) reported that REDD corrections appeared to not be used by their study's software modules, it seems that in-situ audiometry has evolved, marking a clear departure from the findings in their study.
Our results are in line with the findings from more recent studies (Boymans & Dreschler, 2017; Vercammen, 2020). In Vercammen (2020), thresholds measured with conventional and in-situ audiometry using Phonak hearing aids exhibited a high correlation, with a mean difference of less than 1 dB HL across a substantial sample of 167,722 hearing aid logs. Ninety-five percent of the differences fell within 15 dB HL. Boymans & Dreschler (2017) reported good test-retest reliability for in-situ audiometry (SD < 3.7 dB), and it compared favorably to conventional audiometry (SD < 5.2 dB). In our study, the mean interparticipant differences between conventional and in-situ audiometry were within ± 5 dB for all tested hearing aids across frequencies of 250–6000 Hz, which are crucial frequencies for speech. This 5 dB error is clinically acceptable, consistent with the expected measurement error using the Hughson-Westlake 5-up 10-down procedure, and is in agreement with deviations reported for clinical audiometry (Flamme et al., 2015).
This study delved into the application of in-situ audiometry for hearing aid fitting. It is essential to highlight that in-situ audiometry should not replace conventional audiometry for diagnostic purposes, as it lacks the capability for masking and bone conduction measurements. Therefore, the participants recruited for Experiment III in this study had known, symmetrical, sensorineural hearing losses, typically associated with age-related hearing loss causes (Schlauch & Nelson, 2015). This limitation remains a hurdle for implementing in-situ audiometry in the context of providing remote hearing care to new patients.
However, in-situ audiometry has regained attention in the context of remote hearing health care and self-fitting hearing aids (Boymans & Dreschler, 2017; Convery et al., 2019; Wong, 2011), or when REM equipment is not available or feasible (Almufarrij et al., 2021). In this setting, in-situ audiometry should be valid and reliable. While the reliability of in-situ audiometry was previously deemed equivalent as that of conventional audiometry (O’Brien et al., 2010; Smith-Olinde et al., 2006), this study specifically focused on its validity. It is worth noting that experiment III took place in a soundproof booth, a facility that is unlikely to be available at many remote fitting locations, such as a patient's home, where potential background noise could affect the measured hearing thresholds. However, some studies have found that when the testing occurs in a typical room environment without audible environmental noise or with real-time monitoring of the environmental noise, comparable audiometric results can be obtained (Behar, 2021; Swanepoel et al., 2013; Wong et al., 2003). Another consideration for remote hearing aid fitting is the variation in sound pressure level produced by the hearing aid transducer with changes in air pressure at different altitudes. Measuring the pressure-related variations in transducer output and correcting them in in-situ audiometry can enhance the precision of the results. However, as our test location was near sea level in Copenhagen, Denmark, we do not anticipate altitude-related effects in our results.
Conclusions
Hearing thresholds obtained in-situ through standard open domes were found to be equally valid as conventional thresholds, provided that the correct acoustic coupling is specified in the software settings or that one adheres to the company's guidelines (e.g., using closed domes for in-situ measurement with GN Resound devices, even if the patient wears open domes during hearing aid usage). The enhanced validity of in-situ audiometry, compared to studies in the past, clearly showed that in-situ audiometry has evolved across manufacturers, demonstrating its potential for connected hearing care.
Footnotes
Acknowledgments
This work was conducted at the Copenhagen Hearing and Balance Centre (CHBC) and supported by Region Hovedstaden and the Technical University of Denmark (DTU). Parts of this work were presented at the International Symposium on Auditory and Audiological Research (ISAAR 2023), at Nyborg Stranden, Denmark. The authors wish to thank Robert H. Margolis and an anonymous reviewer for their helpful comments on an earlier version of the manuscript.
Declaration of Conflicting Interests
The authors declared no potential conflicts of interest with respect to the research, authorship, and/or publication of this article.
Funding
The authors received no financial support for the research, authorship, and/or publication of this article.