
Abstract
Listening to speech in noise can require substantial mental effort, even among younger normal-hearing adults. The task-evoked pupil response (TEPR) has been shown to track the increased effort exerted to recognize words or sentences in increasing noise. However, few studies have examined the trajectory of listening effort across longer, more natural, stretches of speech, or the extent to which expectations about upcoming listening difficulty modulate the TEPR. Seventeen younger normal-hearing adults listened to 60-s-long audiobook passages, repeated three times in a row, at two different signal-to-noise ratios (SNRs) while pupil size was recorded. There was a significant interaction between SNR, repetition, and baseline pupil size on sustained listening effort. At lower baseline pupil sizes, potentially reflecting lower attention mobilization, TEPRs were more sustained in the harder SNR condition, particularly when attention mobilization remained low by the third presentation. At intermediate baseline pupil sizes, differences between conditions were largely absent, suggesting these listeners had optimally mobilized their attention for both SNRs. Lastly, at higher baseline pupil sizes, potentially reflecting overmobilization of attention, the effect of SNR was initially reversed for the second and third presentations: participants initially appeared to disengage in the harder SNR condition, resulting in reduced TEPRs that recovered in the second half of the story. Together, these findings suggest that the unfolding of listening effort over time depends critically on the extent to which individuals have successfully mobilized their attention in anticipation of difficult listening conditions.
Keywords
Introduction
Listening to and understanding speech can require substantial mental effort, even if the words are ultimately correctly perceived (McCoy et al., 2005), indicating that speech-intelligibility measures alone are insufficient to characterize the difficulty of the listening process. Listeners must use a limited set of cognitive resources to simultaneously maintain attention to the target speaker, process the linguistic content, and comprehend the intended message (Carroll et al., 2016; Kidd et al., 2014). The effort required to accomplish this can further be compounded in adverse listening conditions, such as in the presence of background noise or competing speakers (Alain et al., 2018; Killion et al., 2004; Mattys et al., 2012), even for normal-hearing younger adults (Zekveld et al., 2010). In such contexts, listeners must engage in auditory stream segregation, tuning in to the target speaker based on low-level acoustic features (e.g., pitch) and/or high-level semantic content (e.g., topic) while tuning out irrelevant acoustic signals (see Snyder & Alain, 2007 for a review and discussion).
Sustained Attention to Listening
A further source of difficulty arises when listening for long periods of time—such as having a conversation in a crowded restaurant or attending a poster session in a noisy convention center. In cases of prolonged listening, sustained attention may lead to fatigue and reduced deployment of cognitive resources to meet task demands (McGarrigle et al., 2017). Sustained attention has been defined in terms of an individual's readiness to detect rare or unpredictable signals over time (Sarter et al., 2001). Depending upon one's model of cognition (for a review, see Fortenbaugh et al., 2017), sustained attention has been viewed as a separable subtype of attention (tonic and phasic alerting; Posner & Peterson, 1990), as involving multiple subtypes of attention (e.g., alerting and orienting; Tang et al., 2015) or as a function of multiple sensory and cognitive functions to sustain processing to internal or external information across long periods of time (Chun et al., 2011).
There is increasing awareness within the hearing sciences of the need for laboratory stimuli and tasks that better reflect real-world listening situations, which includes listening to extended connected discourse (for a consensus paper, see Keidser et al., 2020). However, much of the research on sustained attention outside the domain of listening has focused on simple vigilance tasks (Kristjansson et al., 2009; Martin et al., 2022), and most research on listening effort has focused on short sentences (Winn, 2016; Winn & Moore, 2018; Zekveld et al., 2010), although some work has expanded to longer listening situations, such as strings of three connected sentences (McGarrigle et al., 2017) and 25-s long tone streams (Zhao et al., 2019). In an auditory decoding study, greater listening effort, as indicated by variation in average pupil dilation and in parietal alpha power, was observed to predict endogenous attention switches as individuals listened to 60-s-long audiobook passages (Haro et al., 2022). In two studies of hearing aid users, listeners attended to speech stimuli that were ∼30-s news stories presented in 4-talker background babble while EEG and pupillometry were recorded (Fiedler et al., 2021; Seifi Ala et al., 2020). Seifi Ala et al. (2020) observed larger mean pupil sizes in the more challenging signal-to-noise ratio (SNR) condition (−5 vs. 0 dB SNR in 4-talker babble), both overall and across 5-s time bins. Fiedler et al. (2021) found an interaction between noise reduction and SNR (+3 vs. +8 dB SNR) on mean pupil size, such that a larger benefit of noise reduction was observed at the more challenging SNR. Thus, while substantial research has focused on examining listening effort in response to single words and sentences in adverse conditions (for a review, see Zekveld et al., 2018), there has been less work investigating how attention and effort are mobilized and sustained throughout extended durations of connected speech, particularly within individual listening trials for younger adults with normal-hearing thresholds.
Examining the relationship between sustained attention and listening effort with longer stimuli may ultimately be more reflective of real-world listening situations for two reasons. First, longer passages of connected discourse may more adequately reflect listeners’ day-to-day experiences with language (i.e., verisimilitude; Franzen & Wilhelm, 1996). Second, single words and disconnected sentences lack some of the higher-level semantic and pragmatic processes that are often crucial to understanding longer stretches of speech, such as keeping track of different types of information (e.g., topics, referents, and events) over long periods of time (see Sparks & Rapp, 2010 for a review and discussion). Importantly, if the listener misses crucial information due to adverse listening conditions or to the effects of fatigue, for example, then this can have downstream consequences for comprehension (Winn, 2023).
Pupillometry Measures of Sustained Attention to Listening
The extent to which an individual allocates their attentional resources to a listening task at a given point in time is determined by a number of factors laid out in the Framework for Understanding Effortful Listening (FUEL; Pichora-Fuller et al., 2016). FUEL defines listening effort in terms of the allocation of capacity-limited mental resources to demands of a listening task. This definition highlights that listening effort is a function of listening demands, listener capacities, and a so-called effort allocation policy. Motivation and arousal, which may be particularly expected to change over extended listening epochs, are key determinants of that policy, affecting how much and when available mental resources are applied to a task, partly determined by “the demands imposed by the activities in which the organism engages, or prepares to engage” (Kahneman, 1973, p. 17). This suggests that comprehensive measures of listening effort should incorporate indices of arousal, particularly as to the extent that changes are expected over time.
While subjective measures of effort, intelligibility, and attention have provided useful insights into behaviors and perceived effort during listening tasks, these measures may not adequately reflect a listener's current arousal state or the amount of effort that was ultimately used to accomplish the task (Winn & Teece, 2021, 2022). Alternatively, changes in pupil dilation have been used as an online, objective measure of cognitive effort, attention, and arousal (Wagner et al., 2019; Zekveld et al., 2010; Zekveld & Kramer, 2014) and have been linked to locus coeruleus (LC) activity in the brain (Elman et al., 2017; Murphy et al., 2014; Rajkowski et al., 1994) and LC-driven patterns of behavior (Gilzenrat et al., 2010). Increased activity in the LC results in increased concentrations of norepinephrine (NE) that are present during periods of high attentional allocation and arousal (Aston-Jones & Cohen, 2005).
Pupillometry Measures of Interactions Between Arousal State and Task-Evoked Listening Effort
Two distinct modes of LC activation—tonic and phasic—have also been linked to different aspects of the pupil response that, in turn, reflect different attentional states. Pupil size during a neutral baseline period (before stimulus onset) has been argued to reflect tonic LC activity and can serve as an indicator of general arousal (in an inattentive, engaged, or distractible state) as well as anticipatory arousal (Ayasse & Wingfield, 2020) or attention mobilization (Seropian et al., 2022)—the readying of cognitive resources in preparation to carry out an upcoming task. Expectations about upcoming listening challenges, as may be experienced when listening in poorer SNRs or with a hearing impairment, have been observed to alter attention mobilization as indexed by baseline pupil size (Seropian et al., 2022). For example, Ayasse and Wingfield (2020) examined baseline pupil dilation over the course of a 160-trial auditory sentence comprehension task in both normal-hearing and hearing-impaired individuals. While hearing-impaired listeners began the task with larger baseline pupil sizes compared to normal-hearing listeners, baseline pupil size gradually decreased, with the two groups becoming more similar by the end of the task. Importantly, response accuracy increased across the task, suggesting that this decline was not due to fatigue or disengagement, but rather to “an increased level of arousal reflecting task anxiety or a lack of confidence in likely success” (Ayasse & Wingfield, 2020, p. 5) or to an increase in attention mobilization in anticipation of a difficult task.
The task-evoked pupil response (TEPR) is a measure of the relative change in pupil dilation that is time locked to the onset of an attended stimulus that is thought to reflect, in part, phasic LC activity (Joshi et al., 2016). Larger TEPRs are often associated with increased attention and task difficulty, as well as with more salient stimuli (Zekveld et al., 2018). In listening tasks, larger task-evoked pupil sizes have been shown to reflect increased listening effort, with increasing pupil size associated with greater task difficulty (McGarrigle et al., 2017; Winn, 2016; Zhao et al., 2019). Previous research has suggested that poorer SNRs result in increased TEPRs—until a tipping point when listeners begin to give up and disengage—indicative of the increased effort required to comprehend a degraded speech signal (Koelewijn et al., 2015; Ohlenforst et al., 2018). While “giving up” is generally associated with reductions in both pupil size and performance, patterns of relative disengagement (and thus reductions in effort) can also be observed with relatively good performance. Following the “principle of least effort” (Ayasse et al., 2021), individuals may exert only the minimum effort needed to perform a task when they do not feel motivated to process the speech more deeply, such as when listening to extended boring monologues (Herrmann & Johnsrude, 2020). Reductions in pupillary measures of listening effort have also been observed with increasing stimulus familiarity, such as when encountering more commonly used lexical items (Papesh & Goldinger, 2012) or repeatedly encountering the same auditory (Marois et al., 2018) or visual (Ferrari et al., 2016) stimulus.
Tonic and phasic LC activity—and, by extension, baseline pupil size and the TEPR—are not independent of one another (e.g., Knapen et al., 2016), with their nonlinear relationship reflected on a Yerkes–Dodson curve (Yerkes & Dodson, 1908). Low tonic LC activity is related to inattentiveness and under-mobilization of attentional resources, which is associated with poorer performance, lower baseline pupil sizes, and reduced TEPRs. Intermediate levels of tonic LC activity have been linked to optimal arousal states and task performance (McGinley et al., 2015), such that intermediate baseline pupil sizes result in the largest TEPRs (Murphy et al., 2011). This state may reflect the optimal mobilization of attentional resources (i.e., exploitative rather than explorative; Jepma & Nieuwenhuis, 2011). Lastly, high tonic LC activity (also known as a hyperactive tonic state) has been associated with increased distractibility, task disengagement, and decreased task performance (Kane et al., 2017; McGinley et al., 2015; Murphy et al., 2011; Unsworth & Robison, 2016). Additionally, in human models, high LC-NE tonic activity has also been associated with higher rates of self-reported mind wandering (i.e., off-task thoughts) during reading (Franklin et al., 2013). As such, this state is associated with higher baseline pupil sizes but reduced TEPRs, and may reflect overmobilization of attentional resources (i.e., explorative rather than exploitative).
Recently, Relaño-Iborra et al., (2022) examined the relationship between baseline pupil size and the TEPR, using pupil recordings from a speech-intelligibility task with blocked SNRs (Wendt et al., 2018). The authors found that baseline pupil size was not only modulated by time-on-task effects and SNR but also significantly modulated the shape the shape of the TEPR derived from a growth curve analysis (GCA) model. Baseline pupil size was found to increase with poorer SNRs for both four-talker babble and speech-shaped noise. The authors suggested that the increase in baseline pupil size in the more difficult conditions may have reflected preparatory control: because SNR conditions were blocked, participants could anticipate the difficulty of upcoming trials. Interestingly, however, the effects of SNR tended to diminish as the task progressed, which may indicate that “[a]fter sufficient exposure, listeners seem able to gauge whether effort deployment would result in a successful completion of the task, thus disengaging from it if success could not be achieved” (Relaño-Iborra et al., 2022, p. 12).
Together, these studies suggest that one's arousal state has a critical, and strongly nonmonotonic, impact on effort allocation to task demands. However, more research is needed to understand potential interactions between anticipated acoustic difficulties and stimulus repetition effects, particularly at the level of individual listening trials. Furthermore, studies that have examined the TEPR as a measure of listening effort have predominantly utilized trial-by-trial baseline pupil size to account for trial- and participant-level variability—either to be subtracted from or to normalize TEPR values (Mathôt et al., 2018). However, as noted, baseline pupil size has been observed to not only affect the height of the TEPR, but also its shape (Knapen et al., 2016; Relaño-Iborra et al., 2022). Previous research has also suggested that baseline pupil size and the TEPR may reflect different processes (Micula et al., 2021, 2022). Thus, to the extent baseline pupil size reflects anticipatory attention mobilization and effort for known upcoming listening demands, traditional baseline correction procedures may obscure or, worse, overcorrect for meaningful differences between listening conditions.
Goals of the Present Study
The present study examines the relationship between attention mobilization—how individuals prepare their attention in anticipation of an upcoming task—and listening effort allocation—how listeners deploy and use their attentional resources during the task—when listeners can anticipate the difficulty of the upcoming trial. Extending the results of Relaño-Iborra et al. (2022), the present study focuses on trial-level variation in attention mobilization for a sustained listening task involving exact stimulus repetitions. Participants listened to three presentations of several 60-s long audiobook passages and were instructed to attend to one of two competing speakers in an easy or difficult listening situation, determined by SNR. Participants were told that specific passages would be blocked in this fashion and thus, the first presentation effectively served as a cue regarding task difficulty for the two subsequent presentations. Longer passages were chosen both to examine longer-term changes in the TEPR and to more adequately approximate real-world listening scenarios (i.e., longer stretches of connected discourse). Our research questions (RQ) and hypotheses (H) are as follows:
RQ1. How is attention mobilization modulated by task difficulty to the extent that listeners can anticipate how difficult the upcoming stimulus will be?
H1. Attention mobilization—and thus baseline pupil size—will be larger for the harder compared to the easier SNR condition. In addition, subsequent repetitions (i.e., the second and third presentation) will increase attention mobilization, and this increase will be larger for the harder compared to the easier SNR condition. RQ2. How is listening effort allocation modulated by task difficulty to the extent that listeners can anticipate how difficult the upcoming stimulus will be?
H2. Listening effort allocation—and thus the TEPR—will be greater for the harder compared to the easier SNR condition. Stimulus repetitions will decrease listening effort, and this decrease will be larger for the harder compared to the easier SNR condition (i.e., a steeper linear decline in the TEPR). RQ3. How does attention mobilization interact with listening effort allocation to the extent that listeners can anticipate how difficult the upcoming stimulus will be?
H3. Attention mobilization (baseline pupil size) will modulate listening effort allocation (via the TEPR) in the following ways: (1) at lower baseline pupil sizes (i.e., lower tonic LC activity), the TEPR for both SNR conditions (0 dB and −6 dB) will be diminished, as will differences in the TEPR between the two conditions; (2) at intermediate baseline pupil sizes (i.e., intermediate tonic LC activity), the TEPR for both conditions will be largest, with the harder SNR condition eliciting larger TEPRs compared to the easier SNR condition; and (3) at higher baseline pupil sizes (i.e., higher tonic LC activity), while the TEPR may be elevated, differences between the two conditions will again be diminished.
Methods
Participants
Nineteen participants (12 women, 7 men; Mage = 21.1 years, SD = 2.16, range: 18.5–26.1) were enrolled in the study, which was approved by the University of Maryland's Institutional Review Board. Participants received monetary compensation for their participation. Participants were administered an audiogram in each ear that included third octave band tones from 0.125 to 14 kHz. All participants had audiometric thresholds within normal limits of ≤25 dB HL from 0.25 to 4 kHz in their better ear. Participants self-reported having normal or corrected-to-normal vision, no psychiatric or neurological conditions, not taking psychoactive stimulants or depressants, and were native English speakers with no exposure to a second language before the age of 12. A score in the normal range of 26 or better on the Montreal Cognitive Assessment (MoCA) was also required for participation.
Measures and Stimuli
The audiobook listening task was part of a larger study where magnetoencephalography (MEG) data were also collected during the audiobook listening task on the same participants. The method and discussion of the MEG data are reported in Karunathilake et al. (2023). The audiobook task consisted of 60-s long audiobook segments from a nineteenth century short story available in the public domain (male recording: Irving, 2006; female recording: Irving, 1977). Stimuli were presented across four blocked SNR conditions: 0 dB, −6 dB, Babble, and Clean. In the 0 dB and −6 dB conditions, participants heard two different passages in each block with each passage presented three times in a row. To avoid using a fixed order of audiobook passages (e.g., all participants hearing the same passages in the same order), four lists of stimuli were created such that, within each list, the order of the individual audiobook passages was pseudorandomized. These lists were then divided into four blocks, one for each of the SNR conditions. In the current study, only the 0- and −6-dB blocks were analyzed because they always occurred before the Babble and Clean blocks, with the order of the 0 dB and −6 dB blocks counterbalanced across lists (i.e., some participants heard the 0 dB block first while others heard the −6 dB block first). These two SNRs also showed the greatest difference in the neural reconstruction of the speech envelope in a prior MEG study using these same speech materials (Presacco et al., 2016, Fig. 6). Additionally, the Clean condition utilized repeated segments from the other conditions, while in the Babble condition the competing speech was multitalker babble that does not convey any meaning, unlike the competing talkers in the 0 dB and −6 dB conditions. Given this difference, we opted to exclude the Clean and Babble blocks from our analyses and instead focus on the effects of SNR between two competing speakers.
Stimuli in the 0 dB and −6 dB conditions had participants attend to either a female or a male speaker in the presence of a competing speaker of the other gender speaking a different portion of the audiobook that was not present in any other stimuli in these conditions. In the 0 dB condition, both speakers were presented at 70 dB SPL. In the −6 dB condition, the target speaker remained at 70 dB SPL while the competing speaker was presented at 76 dB SPL. For both conditions, half of the stimuli had participants attend to the female speaker and half to the male speaker. This resulted in two audiobook segments for each SNR condition.
As mentioned above, to allow for signal averaging in an MEG study of auditory encoding (Karunathilake et al., 2023), each stimulus was repeated three times in a row. While repetition allows for stability in MEG measures of auditory processing, shifts in attention may occur as listeners anticipate and habituate to the upcoming difficulty and content of the passage. Participants also completed a separate speech-perception-in-noise (SPIN) task at these same SNRs using sentences extracted from the audiobook that did not overlap with those used in the audiobook task. The SPIN task along with the behavioral findings from the audiobook task served as a manipulation check; for more detailed information about the SPIN task, see Karunathilake et al. (2023).
The minimum time between the offset of one auditory passage and the onset of the baseline epoch for the next passage was 69 s. This period included time for the experimenter to ask the comprehension question and, for the first presentation, an intelligibility rating as well as to wait for the MEG signal to stabilize again following the participant's verbal responses. Specifically, after every presentation, participants answered a short comprehension question designed only to ensure participants attended to the story. There was a different question for each repetition of the audiobook passage which could be a true-or-false, open-ended, or multiple-choice question. Participants were not given feedback about their response accuracy. After the first presentation of each new audiobook segment, participants were also asked to provide a subjective intelligibility rating indicating how much of the passage they understood. The rating was on a scale of 0–10, where 0 indicated that the participant understood none of the passage while 10 indicated that they understood all of the passage.
Procedure
The initial session took place in a laboratory setting. Intake assessments were administered in person as part of recruitment efforts for a larger study of neuroplasticity in auditory aging. Individuals were contacted about potential enrollment in the current study if they met the aforementioned language, audiogram threshold, vision, psychiatric and neurological history, and MoCA score requirements to be eligible for the study. In a subsequent session, participants completed the audiobook listening task. During this task, pupillometry and MEG data were collected; however, only the pupillometry data are presented here (refer to Karunathilake et al., 2023 for a detailed analysis of the MEG and behavioral data). Participants were situated in a magnetically shielded chamber, lying down with their eyes 790 mm from the top of a projector screen (772 mm wide × 457 mm tall) and 914 mm from its bottom. The ambient room lighting was dimmed, and visual stimuli were chosen (medium gray screen, RGB value of 128, 128, 128) to yield a luminance of 62 lux, to ensure pupil recordings were collected in the approximate middle of an average individual's expected dynamic range. Auditory stimuli were administered diotically via insert headphones that were also used by the experimenter to communicate task instructions. Finally, the SPIN task described above was administered on a separate day.
Pupil size data were collected using an MEG-compatible SR Research EyeLink 1000 Plus eye-tracker with a long-range mount with a sampling rate of 1000 Hz using monocular tracking. Before the start of the audiobook listening task, participants completed a calibration procedure in which participants were asked to fixate on a square as it moved around the screen on a nine-point grid. For the audiobook listening task, participants were instructed to focus on the center of a medium gray screen where a cartoon image of either a male or female face would be displayed to indicate the upcoming target speaker. Each of the images was an equi-luminant black line drawing centered on the screen measuring 183 mm wide by 137 mm tall. The image appeared 2 s before the onset of the passage (i.e., the baseline window) and remained onscreen throughout the 60-s story.
An experimenter verbally explained that the participant's task was to listen to the target speaker and that they would be asked questions after each presentation. The experimenter provided verbal instructions about the subjective intelligibility ratings, informed participants to respond aloud, and noted that the experimenter would record responses. The experimenter began each trial (consisting of a 2-s prestimulus baseline and presentation of a 60-s audiobook passage) by first verbally indicating whether the participant should attend to the male or female speaker and then manually started the trial. The verbal cue was provided in addition to the visual cue (male or female face) as redundancy to ensure participants knew which speaker to attend to (because, e.g., the participant might not see the screen clearly due to having removed their glasses for the MEG scan). At the conclusion of the first presentation of each audiobook segment, the experimenter asked the comprehension question followed by the subjective intelligibility rating question. For the remaining two presentations, only the comprehension question was asked. After recording the responses, the experimenter again informed the participant which speaker to attend to and then manually began the next trial.
Analyses
Data Preprocessing and Cleaning
Pupil size data were extracted starting from the 2 s baseline period before stimulus onset and 60 s after stimulus onset for each presentation. Preprocessing of pupil data consisted of the following: first, samples during blinks and saccades were removed, as were any periods of excessive distortions (e.g., Winn et al., 2018, p. 20). As discussed below, gaze position was modeled as a two-dimensional univariate smooth (van Rij et al., 2019). As such, data were not excluded when samples fell away from central fixation (i.e., fixations away from the center of the screen or off of the image cue) because this multivariate smooth was able to account for the effects of gaze position on pupil size (Gagl et al., 2011). Before filtering, linear interpolation was performed to fill in missing data as the pupil size data could not be filtered with missing values. These data were then low pass filtered with a cutoff frequency of 5 Hz using a finite impulse response (FIR) filter (Hamming window of order 50). Interpolated data were removed after filtering. Data were then downsampled to 10 Hz.
For a given trial, if 30% or more of the pupil size data were excluded during the 2-s baseline period or 45% or more of the pupil size data were excluded during the 60-s stimulus period, that trial was excluded from analysis. Of the 228 total trials, 69 (30.26%) were excluded based on the above criteria (0 dB SNR: 33 trials excluded; −6 dB SNR: 36 trials excluded). Participants were excluded entirely if two or more trials for a given SNR were excluded, eliminating two of the 19 participants (total percent trials excluded: 31.58%). Analyses on the pupillometry and behavioral data included only these 17 participants.
Behavioral Analyses
All analyses were conducted in R (V. 4.2.2; R Core Team, 2024). The R script in its entirety, as well as the data necessary to replicate these analyses, are available on the Open Science Framework (https://osf.io/r396t/). Accuracy to the SPIN task, as well as accuracy to the comprehension questions following each presentation of the 60-s audiobook passages, were analyzed using logistic mixed-effects regression using the glmer function in lme4 (V. 1.1-31; Bates et al., 2015). The model for the SPIN task predicted the proportion of correctly recalled words in each sentence by SNR (0 dB, −6 dB) and included a random intercept of subject (including a random slope of SNR by subject caused the model to not converge). The model for the comprehension questions predicted accuracy by the interaction between SNR (0 dB, −6 dB) and presentation (first, second, and third) and a random intercept of subject with a random slope of SNR (including random slopes of the interaction between SNR and presentation or the main effects of SNR and presentation caused the model to not converge). Self-reported intelligibility ratings after the first presentation of the 60-s audiobook passages were analyzed using a cumulative link mixed-effects model (CLMM) using the ordinal package (Christiansen, 2022). The model predicted self-reported intelligibility ratings by SNR (0 dB, −6 dB) and included a random intercept of subject (including a random slope of SNR by subject caused the model to not converge).
Pupil Size Analyses
Pretrial baseline pupil size has been shown to reflect attention or arousal states (Ayasse & Wingfield, 2020; Wagner et al., 2019) and the study design includes stimulus repetition that may influence such processes. As such, linear mixed-effects regression was performed using the lmer function in the lme4 package (V. 1.1-31; Bates et al., 2015), and p-values were calculated using lmerTest (Kuznetsova et al., 2017). This model predicted baseline pupil size (the median pupil size during the 2 s before stimulus onset) by the interaction between SNR (0 dB, −6 dB) and presentation (first, second, and third) and included a random intercept of participant (including the interaction between SNR and presentation or the main effects of SNR and presentation caused the model to not converge). Pairwise comparisons were conducted using the emmeans function in the emmeans package (V. 1.8.4-1; Lenth, 2023).
The TEPR was analyzed using a generalized additive mixed model (GAMM), which allows for the modeling of nonlinear trends in time series data while simultaneously accounting for autocorrelation—of particular importance for the TEPR (van Rij et al., 2019). All models were created using the bam function in the mgcv package (V. 1.8-41; Wood, 2003, 2011, 2017), while model criticism, testing, and visualization were performed using the itsadug package (V. 2.4.1; van Rij et al., 2022). The model predicted the TEPR by the ordered factor variables of presentation (first [reference level], second, and third), SNR (0 dB [reference level], −6 dB), and their interaction. These ordered factors were specified in both the parametric terms—which estimate overall height differences of the TEPR across conditions—and in the smooth terms. The smooth terms also included baseline pupil size as an additional continuous predictor alongside time (see below). Importantly, since baseline pupil size was included in the model—and because baseline correction can change the shape of the TEPR (i.e., by baseline normalization) or can inadvertently obscure or even invert differences between conditions (i.e., by baseline subtraction), baseline correction was not performed on the TEPR (van Rij et al., 2019, p. 4; see also Reilly et al., 2019). As such, the TEPR is measured as raw pupil size in arbitrary units (a.u.).
Ordered factor smooths estimate differences between specific conditions (or combinations of conditions) similarly to linear regression but implemented within the GAMM framework. A “reference smooth” estimates the TEPR for the chosen reference level (e.g., first presentation, 0 dB SNR) and has no factor specified in the “by” argument (analogous to the intercept in the summary of a linear regression). Subsequent smooths are called “difference smooths” and estimate the difference between the reference smooth and the condition represented by each difference smooth using an ordered factor specified in the “by” argument (analogous to the estimates presented below the intercept in a linear regression). For example, the ordered factor term “SNR6.ord” is true for all data points in the −6 dB SNR condition and false for all data points in the 0 dB SNR condition. If this term were the only term in the model, the reference smooth would estimate the TEPR for the 0 dB SNR condition, while the difference smooth specified by the term “SNR6.ord” would estimate the difference between the 0 dB SNR condition and the −6 dB SNR condition (e.g., what must be added to the 0 dB SNR smooth to get the −6 dB SNR smooth). This is particularly useful given that the p-values provided by a GAMM indicate only if the fitted smooth is significantly different from 0.
The smooth terms were specified using tensor product interactions to examine both how the TEPR changes over time and also how the shape of this trajectory changes as a function of baseline pupil size. Tensor product interactions allow for modeling multiple independent variables with different scales, as a separate penalty matrix is calculated for each variable (Wood, 2017, pp. 325–328). In the present study, these variables are time (e.g., on the x-axis) with units s and baseline pupil size (e.g., on the y-axis) with arbitrary units. Lastly, we included what Sóskuthy (2021) called “random reference/difference smooths.” These smooths are specified to estimate by-subject factor smooths using the same ordered factors specified in the tensor product smooths mentioned above. Random reference smooths can be thought of as analogous to intercept differences between subjects at the reference level of an ordered factor, whereas random difference smooths can be thought of as analogous to random slopes that represent differences between subjects as estimated for each condition comparison (Sóskuthy, 2021). To fully examine the interaction between baseline pupil size, SNR, and presentation on the TEPR, the model was subsequently releveled so that each presentation (first, second, and third) in the 0 dB SNR condition served as the reference level (see Pandža et al., 2020 and Phillips et al., 2021 e.g., of model releveling). An initial model was run to estimate the rho autocorrelation parameter, which was then used in an embedded AR1 model. The rho value was then adjusted manually until the autocorrelation was sufficiently accounted for (Porretta et al., 2018). The number of knots (k) was increased based on recommendations from the gam.check function in the itsadug package. Fitted smooths were visualized using the plot_smooth function in itsadug, fitted heatmaps were created using the fvisgam function in itsadug, and difference heatmaps were created using the plot_diff2 function in itsadug.
Results
Accuracy and Intelligibility Ratings
The generalized linear mixed-model predicting accuracy on the SPIN task showed a significant main effect of SNR, such that the proportion of correctly recalled words was significantly greater in the 0 dB compared to the −6 dB SNR condition (Est. = 2.37, z = 11.78, p < .001). The proportion of correctly recalled words was .81 (SD = .34) in the 0 dB SNR condition and .42 (SD = .25) in the −6 dB SNR condition.
The generalized linear mixed-model predicting accuracy to the comprehension questions following each presentation of the audiobook passage suggested no effect of SNR, presentation, or their interaction (all p-values > .10). Estimated marginal means calculated using the emmeans function in the emmeans package further suggest no effect of SNR when averaged across presentations and no effect of presentation when averaged across SNRs (all p-values > .3). Overall accuracy across SNR and presentation was 69.2% (SD = 46.3%).
Lastly, the cumulative link mixed-model predicting self-reported intelligibility ratings following the first presentation of each audiobook passages showed a significant main effect of SNR, such that ratings were significantly lower in the −6 dB SNR condition compared to the 0 dB SNR condition (Est. = −2.10, z = −4.14, p < .001). Average intelligibility ratings were 5.84 (SD = 1.80) in the 0 dB SNR condition and 4.66 (SD = 1.58) in the −6 dB SNR condition. Combining the results of the SPIN task with the behavioral results from the audiobook task suggest that the SNR manipulation was successful.
Effects of Presentation and SNR on Attention Mobilization via Baseline Pupil Size
The model analyzing baseline pupil size showed a significant main effect of presentation. Pairwise comparisons of estimated marginal means showed that baseline pupil sizes for the first presentation were smaller compared to the second (t = 4.16, p = .04) and third (t = 4.07, p < .001) presentations. There was no difference between the second and third presentations (p = .76) nor any interactions between presentation and SNR. The model summary is provided in Table 1, and model estimates of baseline pupil size are shown in Figure 1.

Model-Estimated Baseline Pupil Size Values by Presentation, Collapsed Across SNR. Baseline pupil size is based on the median pupil size during a 2-s period of silence before the start of the audio with the male or female face cue present on screen. Error bars represent the 95% confidence interval; shaded green regions represent the distribution of raw (e.g., not model-estimated) baseline pupil size values for each presentation. Horizontal lines with asterisks indicate a significant difference between the indicated presentations.
Summary of LMER: Baseline Pupil Size by Presentation and SNR
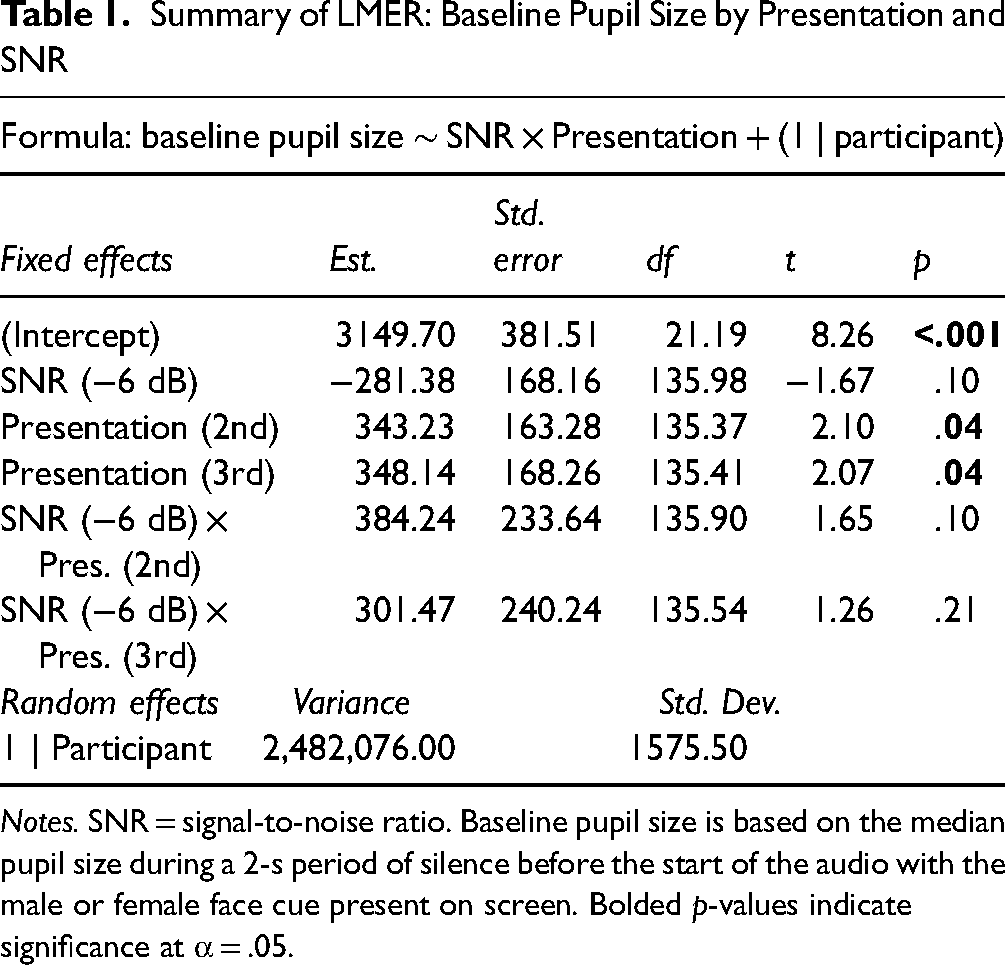
Notes. SNR = signal-to-noise ratio. Baseline pupil size is based on the median pupil size during a 2-s period of silence before the start of the audio with the male or female face cue present on screen. Bolded p-values indicate significance at α = .05.
Effects of Presentation and SNR on Sustained Listening Effort via Dynamic Pupil Response
The summary table for the GAMM used to analyze the TEPR, with the first presentation at 0 dB SNR as the reference level, is presented in Table 2. Summaries for when the model was releveled to the second and third presentations are presented in Appendix A. For the parametric effects, there were no significant effects of SNR or presentation on the overall height of the TEPR. A key reason for this, as detailed below, is that these effects seem to vary greatly depending on both the time within the 60-s passage as well as baseline pupil size. It is also important to note that, consistent with previous literature (Gilzenrat et al., 2010), increasing baseline pupil size was associated with overall larger TEPRs, as can be seen in Figure 2. Shaded regions around the fitted smooths indicate 95% confidence intervals.
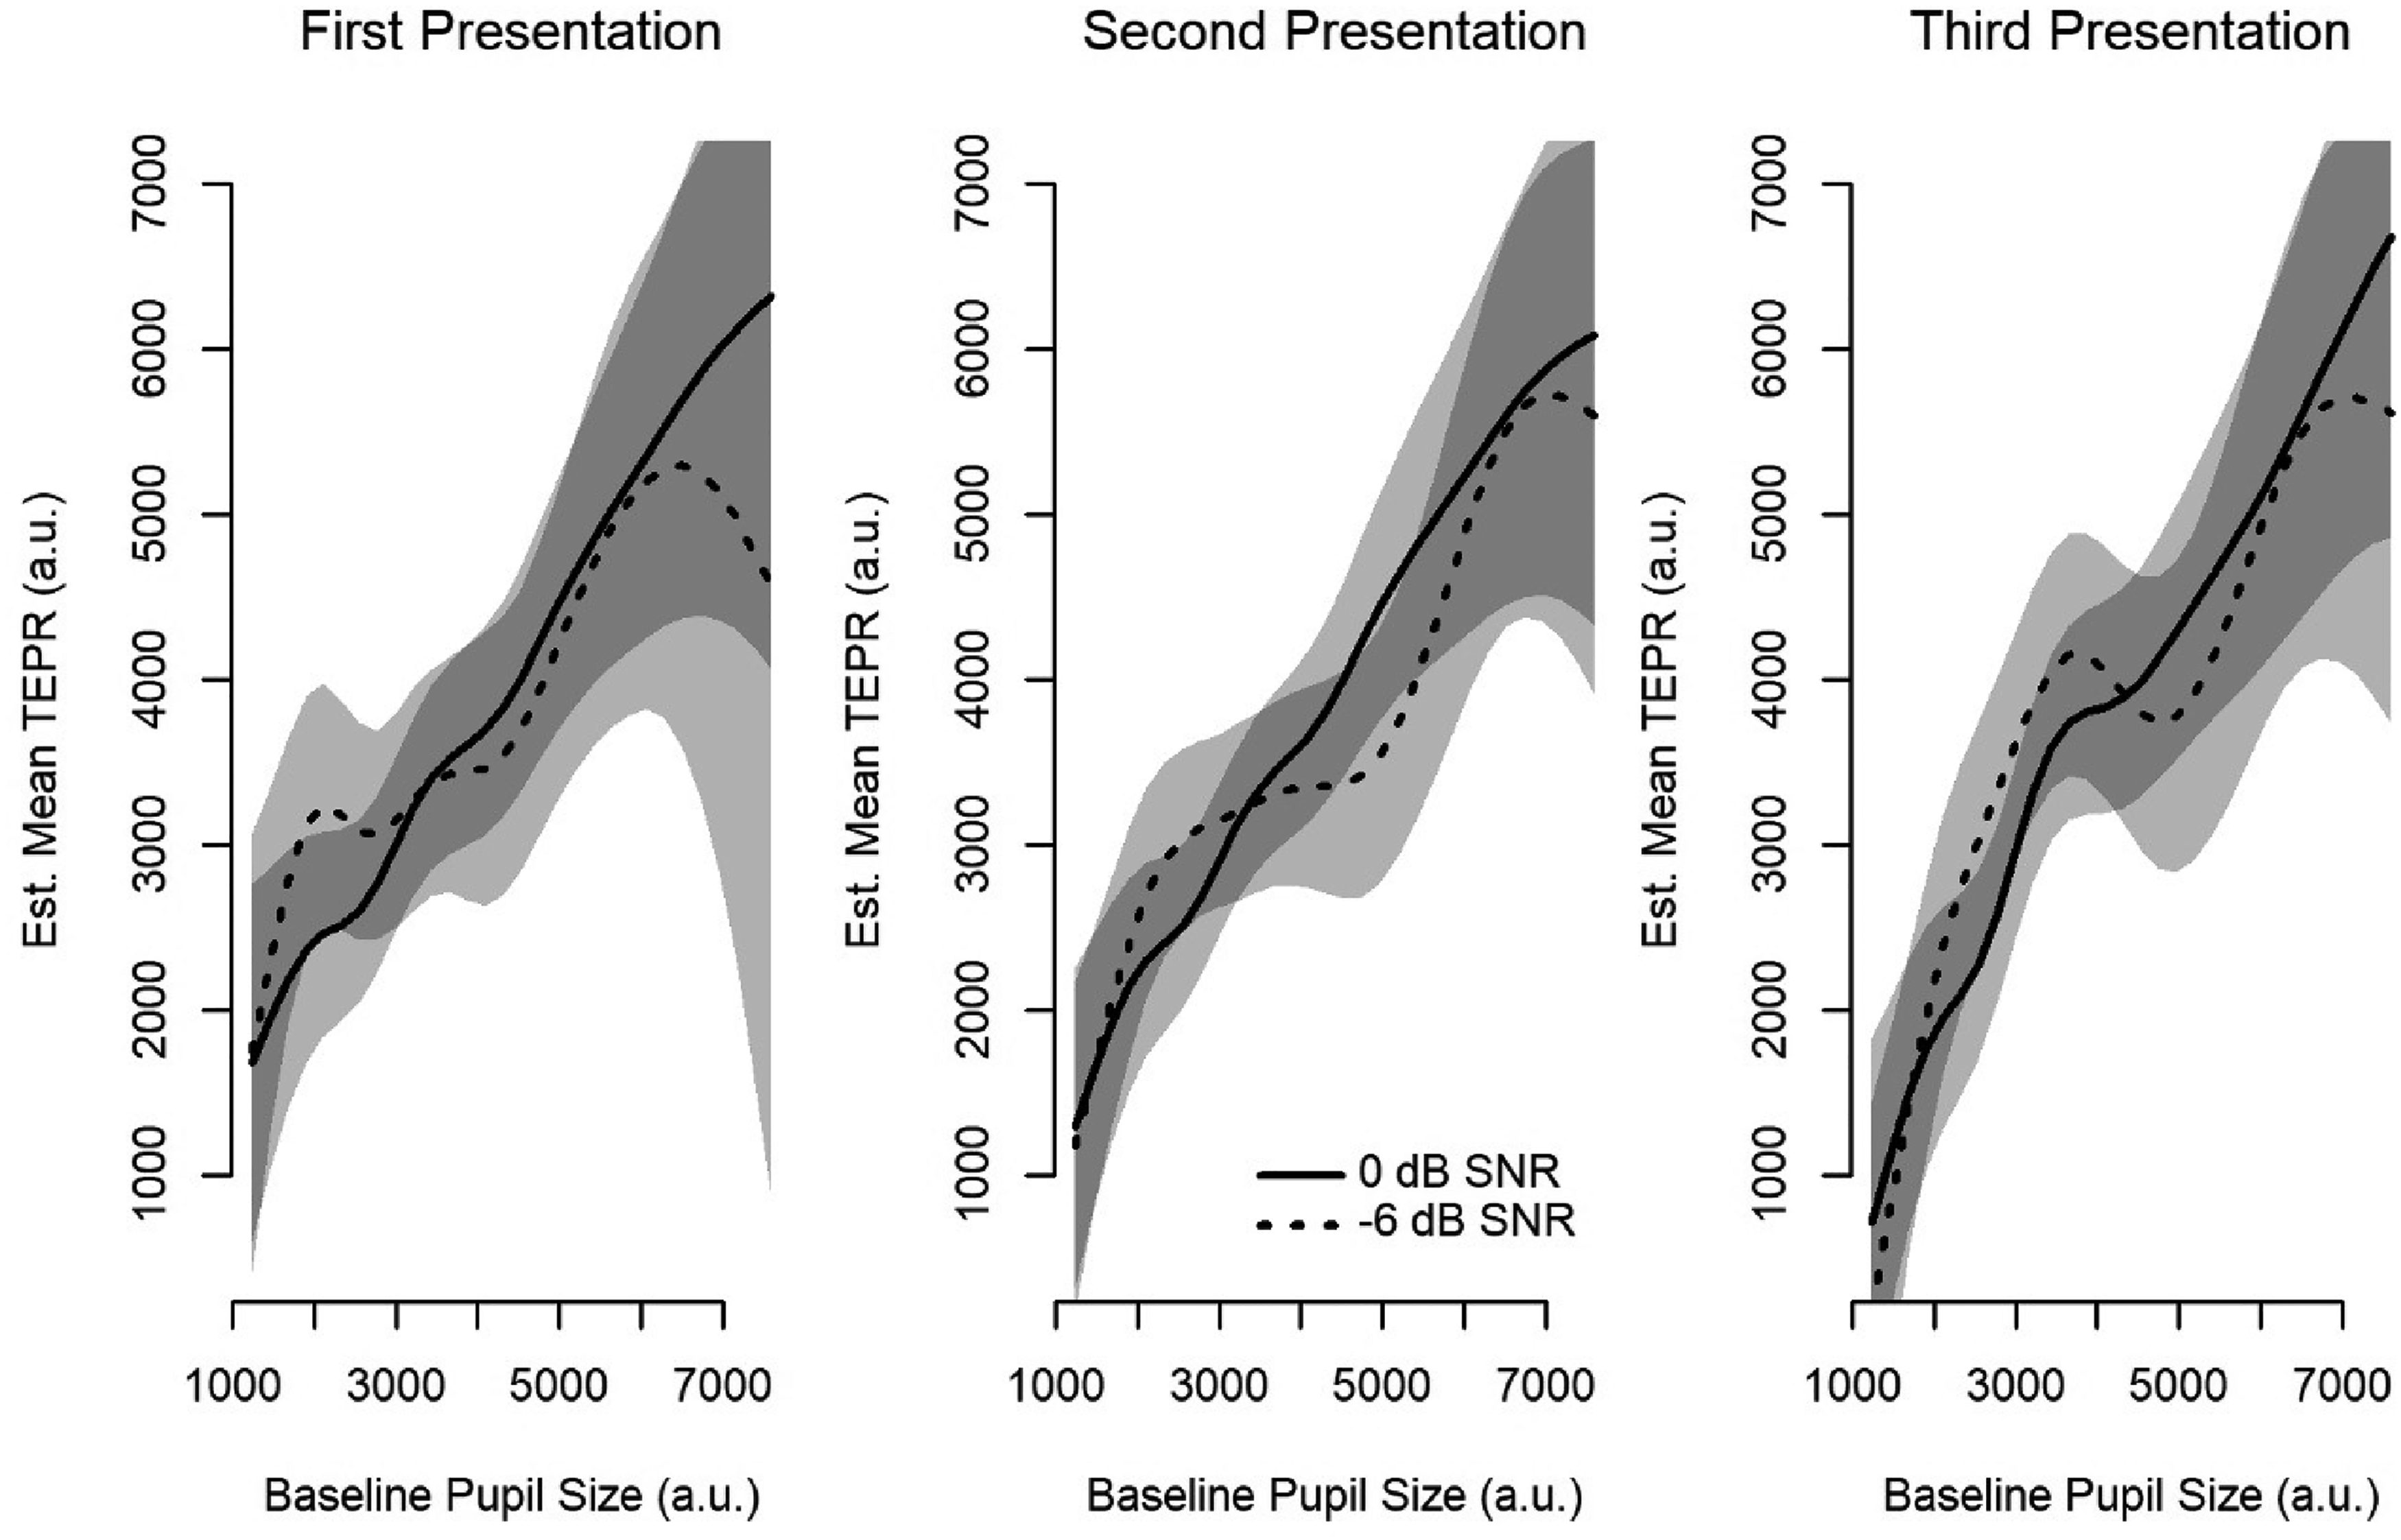
Model-Estimated Mean-Evoked Pupil Size as a Nonlinear Function of Baseline Pupil Size for Each Presentation/SNR Combination.
Summary of GAMM: TEPR by Time, Baseline Pupil Size, Presentation, and SNR

R2 = 0.93; deviance explained = 78.5%; fREML = 59,481.
Notes. Reference level of 0 dB SNR, 1st presentation. SNR = signal-to-noise ratio; BPS = baseline pupil size. Baseline pupil size is based on the median pupil size during a 2-s period of silence before the start of the audio with the face cue present. Bolded p-values indicate significance at α = .05.
The tensor product interactions suggested significant nonlinear interactions between time, baseline pupil size, presentation, and SNR (all p's < .001; see Table 2 and Appendix A for model summaries). Figure A in the appendix is provided to show the model-estimated TEPR as a function of time (on the x-axis) and baseline pupil size (on the y-axis), with color representing the value of the TEPR (on the z-axis) at that time/baseline combination. In other words, the contour plots represent estimated wiggly two-dimensional surfaces such that taking a horizontal slice at a given baseline pupil size value would result in a one-dimensional smooth showing the estimated TEPR across time at that value of baseline pupil size. Density plots to the left of each contour plot show the distribution of baseline pupil sizes (e.g., trials) values for each presentation/SNR combination.
Figure 3 illustrates the effect of SNR as a function of baseline pupil size for each presentation (note that the panels are ordered by column/top-to-bottom rather than by row/left-to-right for Figures 3, 4, and 5). The left-most column in Figure 3 (panels a–c) shows the model-estimated differences between the −6 dB and 0 dB SNR conditions as a function of time (on the x-axis) and baseline pupil size (on the y-axis), with color representing the estimated difference in the values of the TEPR at that time/baseline combination—that is, as if the wiggly two-dimensional surface for the 0 dB SNR condition had been subtracted from that of the −6 dB SNR condition. Highlighted regions indicate significant differences between the two SNR conditions. In addition, the three remaining columns (panels d–l) present horizontal slices at low (1st quartile), median, and high (3rd quartile) baseline pupil sizes for the 0 dB and −6 dB SNR conditions, represented as purple, pink, and orange lines, respectively. Given that baseline pupil size was found to significantly differ between the first and third and second and third presentations, these quartiles were calculated for each presentation separately. These slices were chosen simply to aid in the visualization of the contour plots; baseline pupil size was treated as continuous in all models and not as quartiles. Panels d–l thus show the estimated TEPRs across time at these specific baseline pupil size values. The solid lines represent the 0 dB SNR condition while the dashed lines represent the −6 dB SNR condition. The colored horizontal bars along the x-axis show time windows of significant difference between the two conditions, with green indicating a positive difference (−6 dB > 0 dB) and blue indicating a negative difference (−6 dB < 0 dB). Lastly, density plots show the distribution of baseline pupil size values (e.g., trials) for each presentation collapsed across SNR. Figures 4 and 5 follow this same pattern; however, instead of showing differences between the two SNRs at each presentation, Figure 4 shows the presentation-wise differences for the 0 dB SNR condition, and Figure 5 shows the presentation-wise differences for the −6 dB SNR condition.
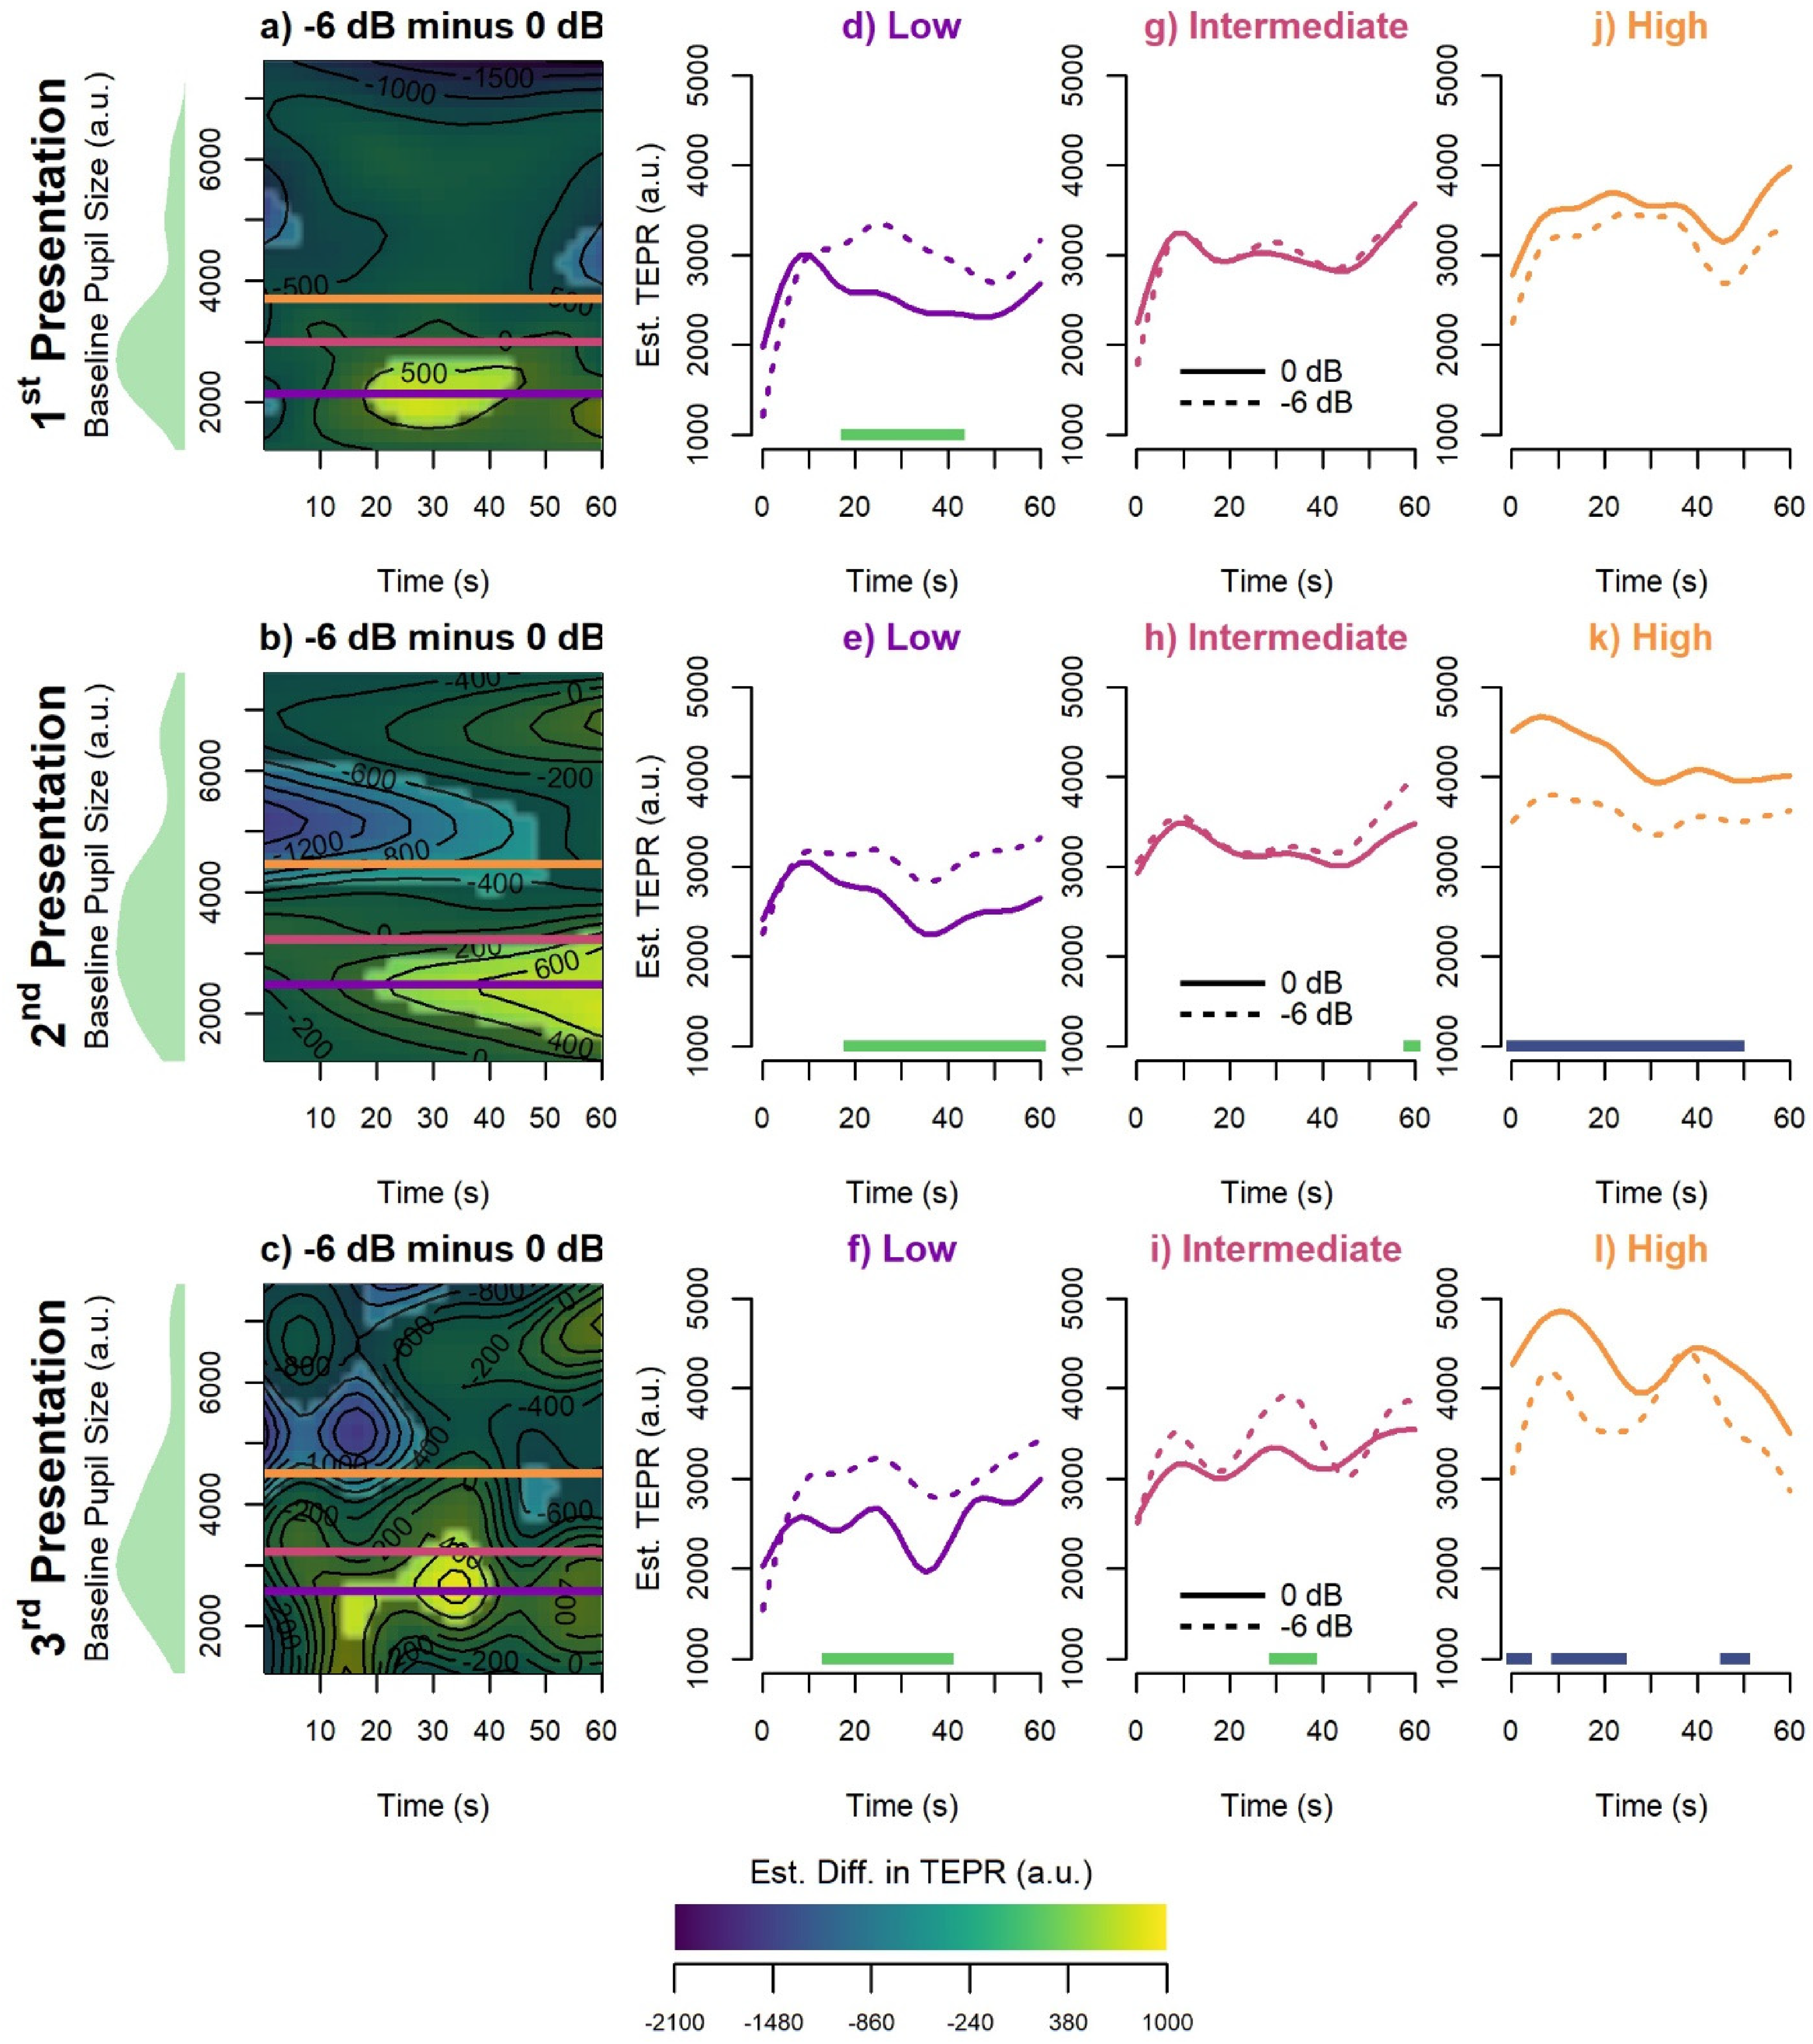
Comparisons Between the 0 dB and −6 dB SNR Conditions Showing the Estimated Difference in Evoked Pupil Size (z-axis) by Time (x-axis) and Baseline Pupil Size (y-Axis). Highlighted regions indicate regions of significant difference between the two presentations. Horizontal lines represent the low (1st quartile, purple line), median (pink line), and high (3rd quartile, orange line) baseline pupil size values. Fitted smooths for 0 dB (solid line) and −6 dB (dashed line) SNR are displayed at low, median, and high baseline pupil size values. Time periods of significant difference are marked by the green (positive difference) and blue (negative difference) bars at the bottom of the plot. An interactive version of this figure is available online at https://michael-johns.shinyapps.io/ynh_pupil_slideshow/.

Additional Visualization of the Interaction Presented in Figure 3 of Presentation-wise Estimated Differences in Evoked Pupil Size (z-axis) by Time (x-axis) and Baseline Pupil Size (y-axis) for the 0 dB SNR Condition. Highlighted regions indicate regions of significant difference between the two presentations (as calculated from the re-referenced model presented in Table 2). Horizontal lines represent the low (1st quartile, purple line), median (pink line), and high (3rd quartile, orange line) baseline pupil size values. Fitted smooths for the two compared presentations are displayed at low, median, and high baseline pupil size values. Time periods of significant difference are marked by the green (positive difference) and blue (negative difference) bars at the bottom of the plot.
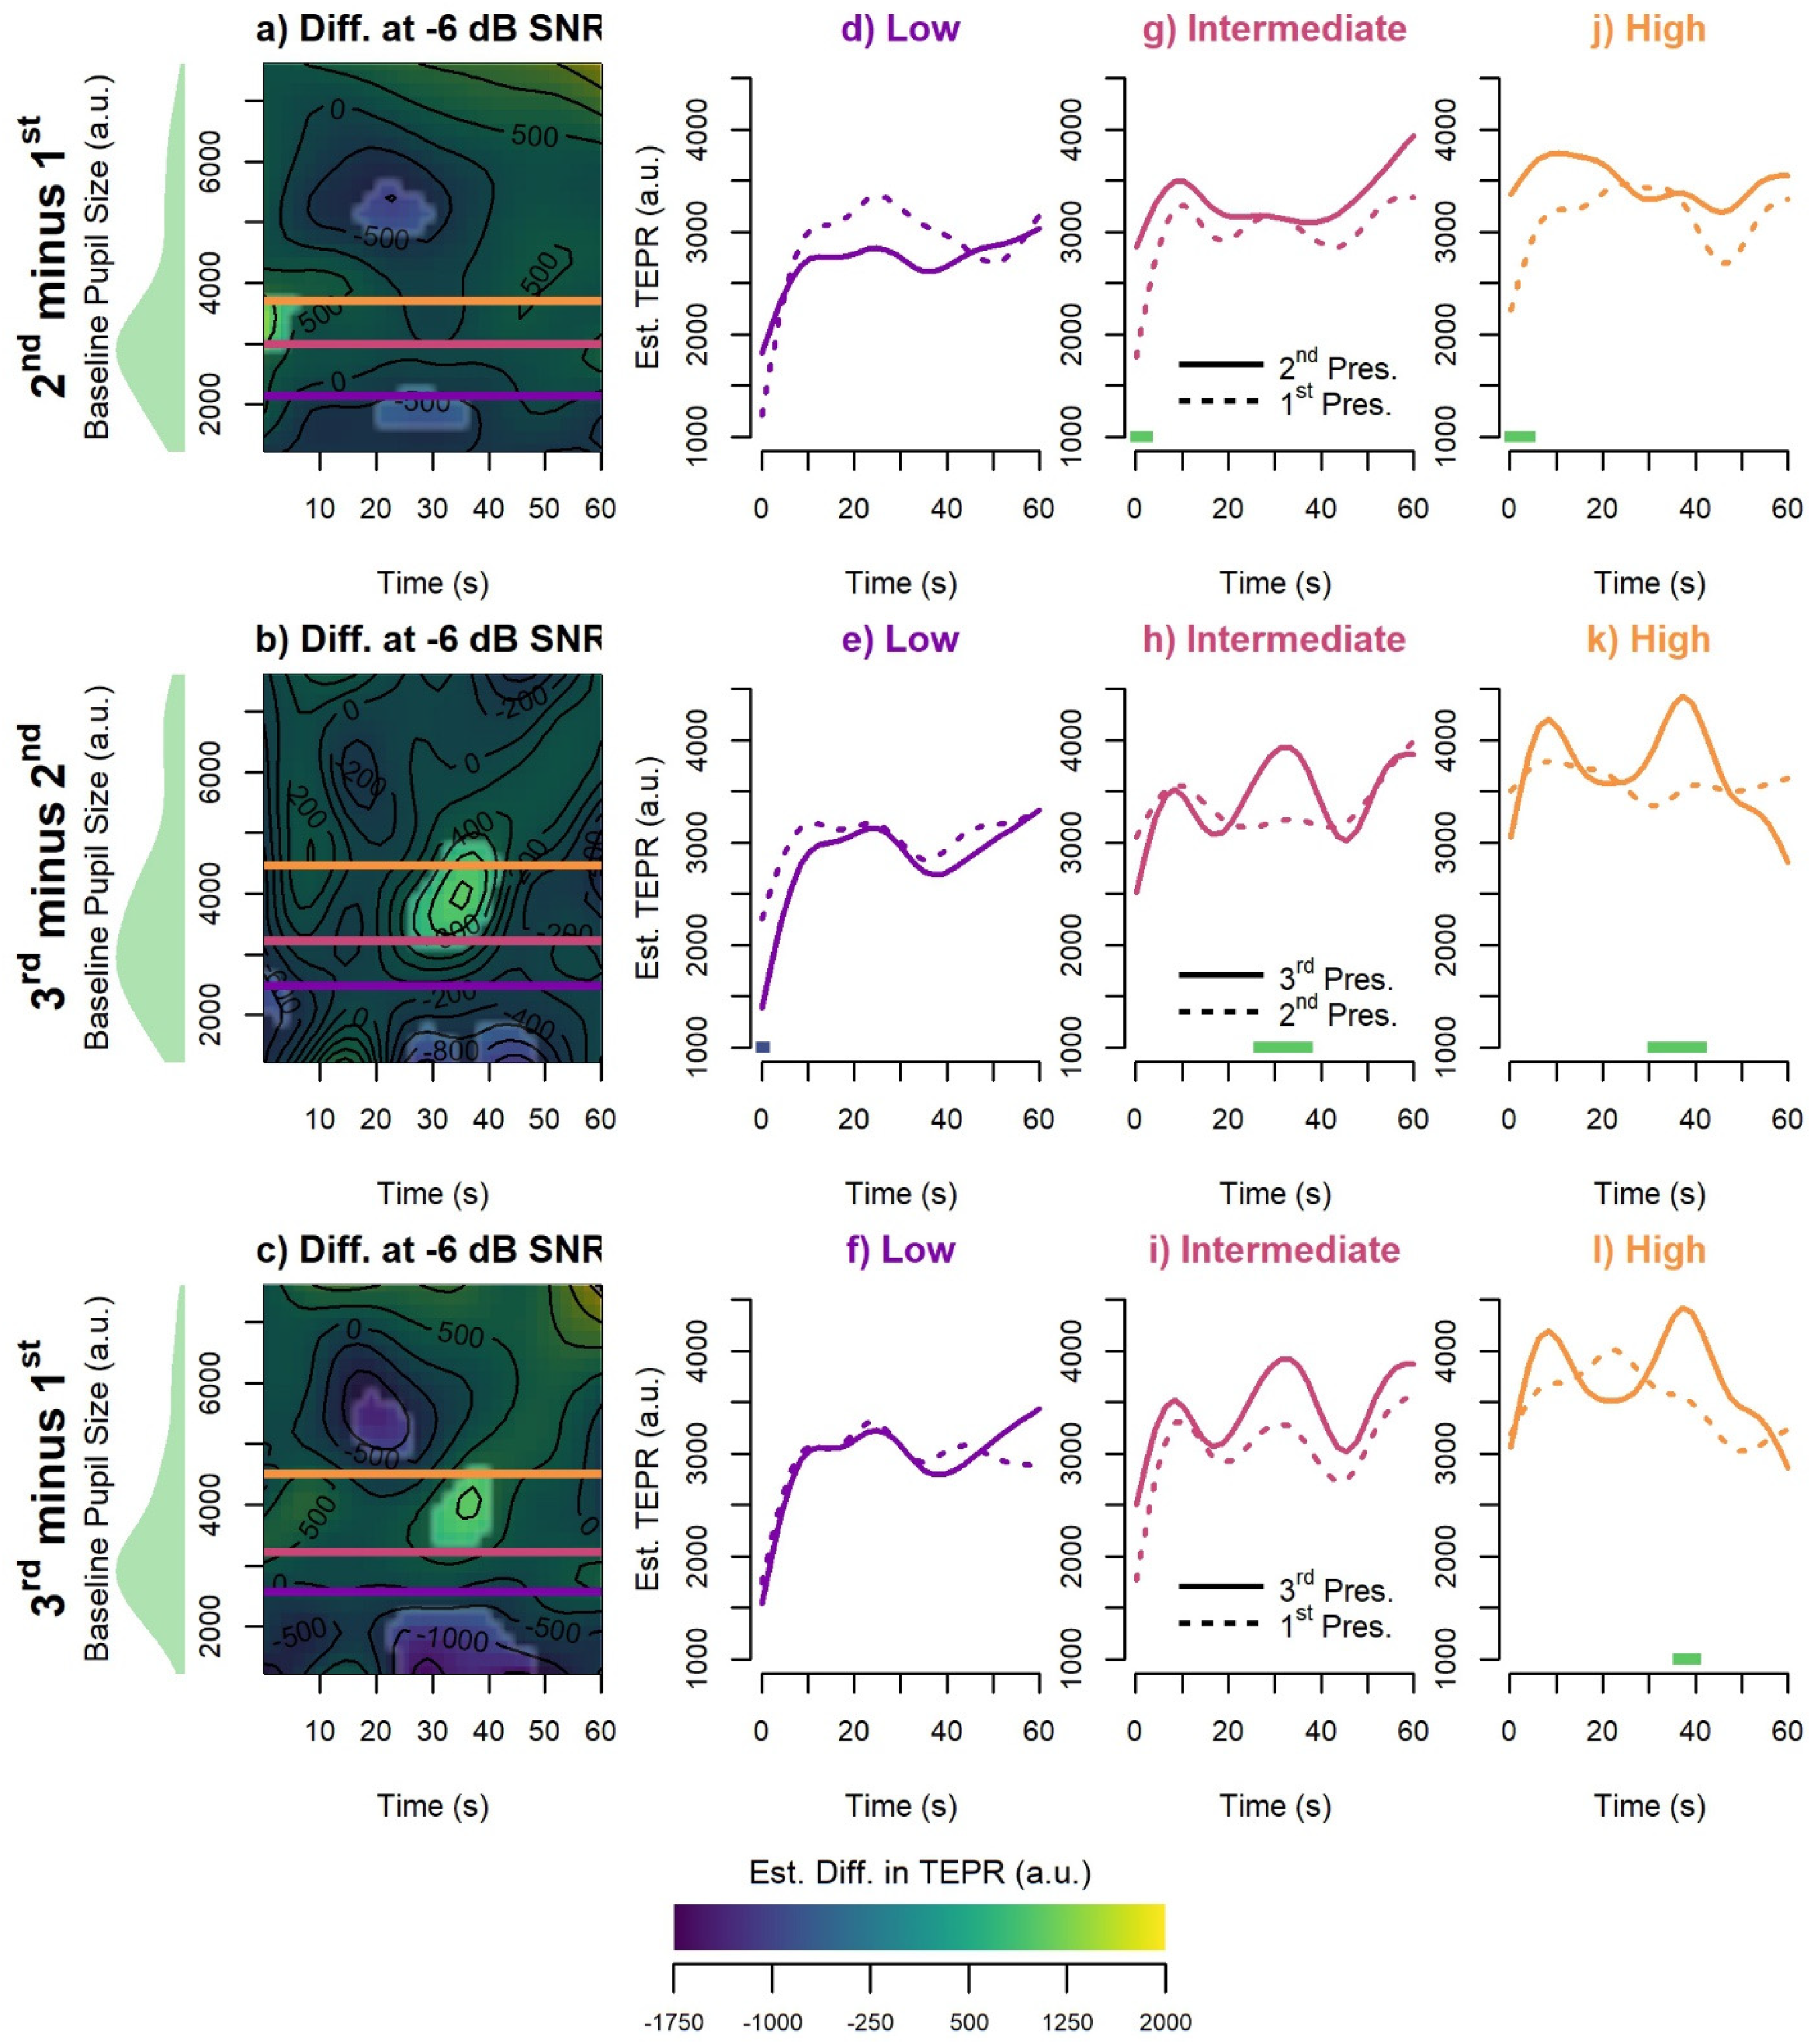
Additional Visualization of the Interaction Presented in Figure 3 of Presentation-wise Estimated Differences in Pupil Size (z-axis) by Time (x-axis) and Baseline Pupil Size (y-axis) for the −6 dB SNR Condition. Highlighted regions indicate regions of significant difference between the two presentations (as calculated from the re-referenced model presented in Table 2). Horizontal lines represent the low (1st quartile, purple line), median (pink line), and high (3rd quartile, orange line) baseline pupil size values. Fitted smooths for the two compared presentations are displayed at low, median, and high baseline pupil size values. Time periods of significant difference are marked by the green (positive difference) and blue (negative difference) bars at the bottom of the plot.
As can be seen in Figure 3 panels d–f, the −6 dB SNR condition elicited larger TEPRs than the 0 dB condition primarily for lower baseline pupil size values. This difference occurred during the approximately middle third of the passage during the first and third presentation but extends from approximately 20 s until the end of the passage during the second presentation. At intermediate baseline pupil size values, such differences between the two SNR conditions are absent during the first presentation and are relatively small and short-lived in the second and third presentations. Lastly, at higher baseline pupil size values, there is evidence that the 0 dB SNR condition elicits significantly larger TEPRs than the −6 dB SNR condition at various points throughout the passage. During the first presentation, this difference was present only in the last ∼10 s of the passage. During the second presentation, however, this difference strengthened and extended for nearly the entire duration of the passage, with larger differences occurring toward the beginning of the passage and ultimately disappearing in the final ∼10 s of the passage. Lastly, during the third presentation, a similar effect could be seen but was instead limited almost entirely to the first half of the passage.
To clarify the nature of the interactions depicted in Figure 3, Figures 4 and 5 provide an alternative visualization of these results, but instead displaying presentation-wise comparisons for the 0 dB and −6 dB SNR conditions, respectively. As in Figure 3, the left-most column presents heatmaps of the presentation-wise differences as a function of time and baseline pupil size, while the three remaining columns show fitted smooths for the two compared presentations at low (1st quartile), median, and high (3rd quartile) baseline pupil size values, represented by the purple, pink, and orange lines, respectively. In the 0 dB SNR condition (Figure 4), the heatmaps show that, at low baseline pupil size values, the TEPR is lower at the third presentation compared to the second and first presentation (panels d–f). In the −6 dB SNR condition (Figure 5), however, there are little-to-no differences between presentations at low baseline pupil size values (panels d–f). This suggests that the effect of SNR seen for low baseline pupil sizes is a result of decreasing TEPRs for the 0 dB condition compared to relatively similar TEPRs for the −6 dB condition.
Discussion
RQ1) How is Attention Mobilization Modulated by Task Difficulty?
This study revealed that prestimulus baseline pupil size varied with stimulus repetition and impacted the TEPR measure of sustained listening effort across 60-s story listening in noise. With respect to our first research question (RQ1), we observed that prestimulus baseline pupil size significantly increased from the first to the second presentation and remained elevated for the third presentation but did not vary by SNR. The fact that the baseline pupil size increased in preparation for the second presentation suggests that listeners increased attention mobilization in anticipation of the subsequent repetitions, and maintained this level of mobilization until a new passage began. As such, the predictions of our first hypothesis (H1) only partially played out.
RQ2) How is Listening Effort Allocation Modulated by Task Difficulty?
With respect to our second research question (RQ2), baseline pupil size was observed to modulate not only the shape of the TEPR but also the effect of both SNR and repetition on the TEPR. However, the effects of SNR and repetition were not consistent with the predictions of our second hypothesis (H2), and instead a more complex interaction unfolded. In what follows, we discuss this interaction between baseline pupil size, SNR, and repetition on the TEPR to explore how these changes in attention mobilization affect the deployment of listening effort allocation over time (RQ3, H3).
RQ3) How Does Attention Mobilization Interact with Listening Effort Allocation?
At lower baseline pupil sizes values—thought to be indicative of inattentiveness or under-mobilization of attentional resources (Hopstaken et al., 2015)—listening effort remained elevated in the harder −6 dB SNR condition compared to the 0 dB SNR conditions, even for the second and third stimulus presentations. For all three presentations, the −6 dB SNR condition elicited larger TEPRs than the 0 dB SNR condition, with the largest and most sustained difference between the two conditions occurring during the second presentation. This finding was observed despite the potential benefits of repetition, such as easier lexical access, which may have otherwise led to a gradual decrease in the SNR effect with each presentation (e.g., Calloway & Perfetti, 2020; Marois et al., 2018; Papesh & Goldinger, 2012; Yang et al., 2007). In other words, when attention mobilization remained low—even when the participant could have anticipated what the upcoming difficulty of the passage would be—the effect of SNR on listening effort allocation persisted in spite of the facilitative effects of repetition (H3).
At intermediate baseline pupil size values, there was evidence that listeners may have begun to mobilize their attention more optimally in both SNR conditions. Overall, differences between the two conditions were largely reduced, rather than exaggerated as originally predicted (H2, H3). While small time windows of significant difference are present for the second and third presentations (Figure 3, panels h and i), it is important to note that this occurs at these specific values of baseline pupil size. Overall, when examining the heatmaps (Figure 3, panels b and c), these differences largely disappeared for baseline pupil size values between approximately 3000 and 4000 a.u.
At higher baseline pupil sizes, attention is thought to have been overmobilized, resulting in a hypertonic state where listeners were more distractible and disengaged from the task (Hopstaken et al., 2015). In such a disengaged state, during the first presentation of a passage, differences between the two SNR conditions on the TEPR were largely absent. On average (i.e., irrespective of time), the TEPR for both conditions was elevated, evidenced by the general effect that increasing baseline pupil size resulted in a higher mean TEPR (Figure 2). During the second presentation (when listeners now had knowledge of upcoming listening difficulty), however, the −6 dB SNR condition elicited a significantly smaller TEPR compared to the 0 dB SNR condition for the majority of the passage—that is, the opposite of what was originally predicted (H2, H3). While this observation may suggest that, in this disengaged state, listeners had “given up” (e.g., Relaño-Iborra et al., 2022, p. 12), the behavioral responses to the comprehension questions do not fully support this interpretation—average accuracy to the comprehension questions was 69.2% (SD = 46.3%) and did not significantly differ between the two SNR conditions or by presentation.
Rather, the observed smaller TEPR in the −6 versus the 0 dB SNR condition following the first presentation may suggest that listeners engaged the least amount of effort required to perform the task (i.e., the principle of least effort; Ayasse et al., 2021) especially in the more aversive listening condition. Because each passage was repeated three times in a row, participants could have extracted enough information during the first presentation (and/or second) to be able to also answer the subsequent comprehension question (second or third presentation). Questions were designed to ensure some attention to the materials (Chapman & Hallowell, 2021), but not to be very difficult. The Model of Listening Engagement (MoLE; Herrmann & Johnsrude, 2020) notes that relative listening disengagement can occur when active participation is not required, “[e]ven when speech comprehension is easy, … for example, when listening to a long, tedious monologue” (p. 5, Fig. 1B) which is arguably the case in the current task. When a listener is in an overmobilized state of attention (higher baseline pupil size), there may be little utility in exerting additional task-related effort (Eckert et al., 2016) to obtain more than a “good-enough” lexico-syntactic representation of the passage (e.g., Ferreira & Patson, 2007). Especially in the −6 dB SNR condition, it may actually be aversive or, minimally, cause displeasure to sustain a deeper level of attention than necessary (Matthen, 2016).
Lastly, at higher baseline values during the third stimulus presentation, the results revealed that the SNR difference in the TEPR was reduced both in magnitude and in duration, localized primarily to the first half of the passage. The observation that this difference is diminished in the latter half of the passage suggests that, even in this overmobilized state, listeners were able to re-engage and allocate more of their listening effort. One reason for this may have been that—similar to what was discussed previously for lower baseline pupil size values—a combination of the anticipation of the upcoming difficulty and the added benefit of an additional repetition led to a facilitative effect, potentially reducing the aversiveness of the −6 dB SNR condition and thus reducing the differences between the two SNR conditions, even in a hypertonic state (H3). Future research to support this interpretation may benefit from manipulations of the depth of processing of the passage materials, such as with comprehension questions that require more integrative processing.
Implications for Theories and Analyses of Listening Effort
In line with FUEL (Pichora-Fuller et al., 2016), the present study highlighted the importance of considering both the input-related external factors (i.e., SNR and stimulus repetition) as well as (internal) arousal state in understanding effortful listening. Particularly in cases where listeners have some knowledge about upcoming listening challenges (e.g., before entering a crowded room, listening with hearing loss), this work suggests it is critical to assess the extent to which listeners mobilize their attention to contextualize measures of listening effort.
From an analytical perspective, this work also highlights that the baseline epoch can contain critical information—not just a bias or noise to be subtracted or normalized out—when trying to understand the time course of effortful listening across different conditions. Although exact stimulus repetition is not a frequent occurrence in real-world listening, attention mobilization comes into play in a variety of scenarios. Listeners develop expectations about upcoming listening challenges based on their knowledge of the probabilistic properties of English (Papesh & Goldinger, 2012), the ease of listening to familiar voices (Papesh et al., 2012), cues about upcoming acoustic conditions (e.g., noise that is informative of an upcoming SNR; Seropian et al., 2022), and experience with hearing loss that leads them to expect difficulty in most conversations (Ayasse & Wingfield, 2020). Furthermore, aligned with previous results (Knapen et al., 2016; Relaño-Iborra et al., 2022), baseline pupil size was observed to affect the shape (not just the height) of the pupil response across time. Thus, performing baseline correction on the TEPR without first examining the impact of the listening condition of interest on the prestimulus pupil size has the potential to minimize, eliminate, or potentially artifactually reverse the expected effects of listening demands on the TEPR.
The current study is novel in its examination of the trial-level pupil response to an extended passage of connected speech at varying SNRs. Previous studies have largely focused on examining listening effort in response to single words (e.g., Kuchinsky et al., 2013), sentences (e.g., Zekveld et al., 2010), or tone streams (Zhao et al., 2019). Some recent work on auditory decoding has examined longer stretches of speech similar to the present study but focused on measures of effort that were predictive of attention switching between speakers (Haro et al., 2022) rather than effort associated with sustained attention to a single speaker. Studies that have examined listening to ∼30 s stories-in-babble in adults with hearing loss have found effects of SNR (Seifi Ala et al., 2020) and an SNR-by-noise-reduction interaction (Fiedler et al., 2021) on mean pupil dilation, but did not observe changes in these effects across time or as a function of baseline states of attention.
This study is also novel in its examination of the effect of baseline pupil size on the temporal dynamics of the TEPR. For example, McGarrigle et al. (2017) observed that pupil size was more sustained while listening to 12 s of speech at an easier (vs. harder) SNR, with the effect emerging around 9 s after onset, but only for the second block of the experiment. However, they concluded that baseline pupil size did not drive their TEPR effects because the baseline was not affected by SNR or block number. However, they did not investigate the potential effects of the baseline on the shape of the TEPR across time, which the current study observed greatly modulates the observability and onset of SNR effects. Thus, to our knowledge, the current study represents a novel investigation of story listening of this length in younger adults with normal-hearing thresholds to better understand the relationship between attention mobilization and how effort unfolds throughout individual sustained listening trials (cf., Haro et al.'s [2022] examination of pupil dilation to predict attention switches).
The findings of the present study build upon prior research examining the relationship between baseline pupil size and the shape of the TEPR. We demonstrated similar findings to those of Relaño-Iborra et al. (2022) despite a few key differences. For example, Relaño-Iborra et al. (2022) found that baseline pupil size generally decreased as the task progressed. This is in contrast to the present study, where subsequent presentations of the same passage led to an increase in baseline pupil size. This discrepancy may largely be due to the design of the tasks: Relaño-Iborra et al. (2022) examined isolated, nonrepeated sentences. As such, the decrease in baseline pupil size across the task may reflect aspects of fatigue or habituation (e.g., gradual overall disengagement from the task). Nonetheless, the authors also found that baseline pupil size increased with task difficulty, suggestive of increased preparatory control. This is in line with the present study: when participants can anticipate the difficulty of the upcoming stimulus (by virtue of already having heard it once), they mobilize or up-regulate their attention in preparation. Similarly, Micula et al. (2021) found that baseline pupil size increased when task difficulty became more unpredictable. At first glance, this too seems to contradict the findings of the present study; however, as Micula et al. (2021, p. 1676) suggest, this increase may not be driven by predictability per se, but rather by participants’ increasing alertness or engagement in response to the more difficult, unpredictable task. Ultimately, Relaño-Iborra et al. (2022), Micula et al. (2021), and the present study all demonstrate the importance of examining baseline pupil size, its relationship to performance, and its effects on the shape of the TEPR as a measure of listening effort deployment across varying listening conditions. Whether listeners can anticipate the difficulty of the upcoming stimulus and can thus determine whether they should mobilize additional resources, or if the task becomes unpredictable and requires listeners to be more alert and attentive, baseline pupil size seems to serve as an informative index of how much listeners mobilize or prepare their attentional resources during adverse listening conditions.
Limitations and Future Directions
One limitation of this study relates to the interpretation of the TEPR: intuitively, it is expected that the more effort a task requires—and thus, the more attention that must be allocated—the larger the TEPR will be. In the present study, however, there were conditions under which the harder −6 dB SNR condition elicited smaller rather than larger TEPRs. We interpreted this somewhat unintuitive finding in the context of the principle of least effort (Ayasse et al., 2021). That is, participants may have had a good-enough (Ferreira & Patson, 2007) understanding of the passage by the second and/or third presentation, such that they only engaged a minimal amount of effort for the −6 dB SNR stimuli that were not enjoyable (Matthen, 2016) or motivating to process more deeply (Herrmann & Johnsrude, 2020). A limitation of the current study is that subjective intelligibility was only assessed after the first presentation, but not the subsequent two presentations of the passage segment. In future studies, collecting presentation-level subjective intelligibility data might help to provide evidence for or against our interpretation: reduced TEPRs in the harder SNR condition correlating with lower ratings may be more indicative of giving up, while similar ratings compared to the easier SNR may be more indicative of good-enough understanding. Collecting measures of listening aversiveness or motivation, or including comprehension questions that require greater depth of story processing may provide related insights into our interpretation.
Another limitation of the current study is that the distribution of baseline pupil size values may not represent the full range from absolute under- to overmobilization, and indeed this may vary on a person-by-person and day-to-day basis. For example, some individuals during the current study may have ranged only from more to less under-mobilized (i.e., they would fall on the left side of the Yerkes–Dodson curve) while others may have ranged only from more to less overmobilized (i.e., on the right side of the Yerkes–Dodson curve). To somewhat limit potential extreme individual differences in the range of tonic arousal, inclusion criteria required that participants reported no psychiatric or neurological conditions and were not taking psychoactive stimulants or depressants. Participants were also allowed to select the time of day they preferred for testing. However, without some way of gauging an individual's attentional state (both generally in their daily lives and at that particular time of testing) or referencing their baseline pupil size values to some known range, it is difficult to ascertain what “low” and “high” baseline pupil sizes values actually reflect. In the present study, we opted for the 1st quartile, median, and 3rd quartile (between participants) as reference points for visually examining the effects of baseline pupil size on the TEPR, although this was modeled continuously, to capture where the majority of the data lie. This group-level way of analyzing the data may not adequately reflect individual differences. In this vein, the limited range of SNRs may also have contributed to a more limited distribution of baseline pupil sizes, as compared to prior studies that sought to capture the full psychometric function (Relaño-Iborra et al., 2022; Wendt et al., 2018).
A minimum of 69 s elapsed between one passage's onset and the next passage's baseline epoch. Especially in future studies in which it is not feasible to include such a long time for the pupil to return to its physiological baseline, it may be more critical to examine the relative contribution of physiological carry-over of the pupil response (Winn et al., 2018) versus attention mobilization in anticipation of difficult listening on baseline pupil size. One way to do this could be to also include blocks in which passage difficulty is not predictable as a control (i.e., SNR and/or exact excerpts are not repeated). Future neuroimaging studies may also provide insight into our contention that any sustainment of pupil size between trials would instead be driven by the continued upregulation of performance monitoring and/or cognitive control processes to support subsequent task processing (e.g., Hsu, Kuchinsky & Novick, 2020; Vaden et al., 2013). Regardless of the extent to which the baseline represents signal or noise, the current study highlights the importance of explicitly examining its impact on the TEPR.
The current study demonstrated that the anticipated difficulty of a sustained listening task modulated not only the extent to which listeners mobilized their attention in advance of listening but also the deployment of listening effort throughout the task. Extending previous studies that have predominantly focused on single words and sentences, often presented in isolation and without context, the present experiment examined changes in effort throughout 60-s-long audiobook passages in the presence of a competing talker. Two SNRs were examined. The results suggested that when listeners had not adequately prepared for the upcoming difficulty of the trial (e.g., they did not know what was next or did not sufficiently mobilize their attention), the TEPR was sensitive to differences in SNR. However, SNR effects were not observed at intermediate baseline pupil sizes, suggesting that listeners had optimally readied their attention for the upcoming task demands. At higher baseline pupil sizes, in which listeners may have overmobilized their attention or may have been in a more distractible state, the effect of SNR was reversed. In the first half of the passage, these potentially overwhelmed listeners showed a reduced TEPR for the harder SNR condition that gradually recovered in the second half. Ultimately, however, listeners in this overmobilized state showed reduced TEPRs to both SNR conditions by the third and final presentation, suggesting a reduction in effort allocation for both SNRs. Together, these findings suggest that the time course of listening effort depends not only on how difficult the listening situation is but also on the extent to which individuals are able to anticipate and prepare for those upcoming challenges. Future work aims to examine how these relationships change with aging and hearing loss, as these individuals in these populations may be predisposed to anticipating such difficulties with listening in their daily lives.
Supplemental Material
sj-docx-1-tia-10.1177_23312165241245240 - Supplemental material for Attention Mobilization as a Modulator of Listening Effort: Evidence From Pupillometry
Supplemental material, sj-docx-1-tia-10.1177_23312165241245240 for Attention Mobilization as a Modulator of Listening Effort: Evidence From Pupillometry by M. A. Johns, R. C. Calloway, I. M. D. Karunathilake, L. P. Decruy, S. Anderson, J. Z. Simon and S. E. Kuchinsky in Trends in Hearing
Footnotes
Acknowledgments
We thank Jason Dunlap and Janani Perera for assistance with data collection and Dr. Ed Smith for audio engineering support. We are grateful to Dr. Martijn Wieling for his consultation on our implementation and interpretation of GAMMs. We also thank the editor and reviewers for their insightful comments. This work was supported by the National Institute on Aging (NIA) Grant P01-AG055365, the National Institute on Deafness and Other Communication Disorders (NIDCD) Grant R01-DC019394 and training Grant DC-00046 (to RCC), and the National Science Foundation (NSF) Grant SMA-1734892 (to JZS). For Dr. Kuchinsky: The identification of specific products or scientific instrumentation is considered an integral part of the scientific endeavor and does not constitute an endorsement or implied endorsement on the part of the authors, DoD, or any component agency. The views expressed in this article are those of the authors and do not necessarily reflect the official policy of the Department of Defense or the U.S. Government.
Declaration of Conflicting Interests
The authors declared no potential conflicts of interest with respect to the research, authorship, and/or publication of this article.
Funding
The authors disclosed receipt of the following financial support for the research, authorship, and/or publication of this article: This work was supported by the National Institute on Deafness and Other Communication Disorders (Grant Numbers DC-00046, R01-DC019394), National Science Foundation SBE Office of Multidisciplinary Activities (Grant Number SMA 1734892), and the National Institute on Aging (Grant Number P01-AG055365).
References
Supplementary Material
Please find the following supplemental material available below.
For Open Access articles published under a Creative Commons License, all supplemental material carries the same license as the article it is associated with.
For non-Open Access articles published, all supplemental material carries a non-exclusive license, and permission requests for re-use of supplemental material or any part of supplemental material shall be sent directly to the copyright owner as specified in the copyright notice associated with the article.