
Abstract
Long stimuli have lower detection thresholds or are perceived louder than short stimuli with the same intensity, an effect known as temporal loudness integration (TLI). In electric hearing, TLI for pulse trains with a fixed rate but varying number of pulses, i.e. stimulus duration, has mainly been investigated at clinically used stimulation rates. To study the effect of an overall effective stimulation rate at 100% channel crosstalk, we investigated TLI with (a) a clinically used single-channel stimulation rate of 1,500 pps and (b) a high stimulation rate of 18,000 pps, both for an apical and a basal electrode. Thresholds (THR), a line of equal loudness (BAL), and maximum acceptable levels (MALs) were measured in 10 MED-EL cochlear implant users. Stimulus durations varied from a single pulse to 300 ms long pulse trains. At 18,000 pps, the dynamic range (DR) increased by
Keywords
Introduction
Signal processing in cochlear implants (CIs) assumes a close relation between stimulation amplitude and perceived loudness. Understanding the exact mechanisms and the influences of different parameters will help find a superior approach to loudness coding. This study investigated how temporal loudness integration (TLI) in CIs is affected by stimulation rate, stimulation level, and electrode location.
In acoustic hearing, TLI describes either the decrease in detection thresholds or the increase in perceived loudness of suprathreshold stimuli, when the stimulus duration is increased up to a critical duration of about 150 ms (Stevens & Hall, 1966; Ogura et al., 1991). By now, TLI measurements have been done with many species, including humans, primates, carnivores, birds, and even fish (reviewed by Heil et al., 2017). The summary revealed—besides interindividual differences—striking similarities in the overall shape of these TLI curves. A power-law function describes the relationship between threshold and time very well for acoustic hearing. This function has a slope of about −2 dB per doubling of duration or approximately −20∕3 dB per tenfold increase of duration (decade).
TLI in electric hearing refers to the observed reduction of detection thresholds, or alternatively, the necessary amplitude reduction of suprathreshold stimuli when increasing the stimulus duration while maintaining a fixed stimulation rate and phase duration. Compared with acoustic stimulation, direct electrical stimulation with a CI allows stimulation paradigms that go beyond what is possible for acoustic signals. First, in electric hearing, stimulation durations as short as a single electric pulse can be applied without spectral broadening. Second, the stimulation rate can be changed without affecting the location of the excitation pattern. While it is assumed that the same central processing takes place in acoustic and electric hearing, only with different neural inputs, slopes of TLI curves are much shallower with electric stimulation, e.g. −0.42 dB per doubling of stimulus pulses (Donaldson et al., 1997) and −1.5 dB per tenfold increase in duration, equivalent to a slope of −0.45 dB per doubling of duration (Gerken et al., 1991). However, direct comparisons between normal-hearing and CI TLI slopes should be made with caution considering the difference in dynamic ranges (DRs) (about 100 dB in acoustic hearing and around 10 dB in electric hearing). Moreover, TLI curves in CI users show a high variability across subjects, and in some cases, across electrodes in a single subject’s cochlea (Donaldson et al., 1997; Shannon, 1990). There have been different attempts to describe and explain the amplitude vs. duration relationship in electric hearing, including models by Shannon (1989), Carlyon et al. (2005), and McKay and McDermott (1998).
A reduction in electric detection thresholds, or increase in the perceived loudness of suprathreshold stimuli, has been observed not only when increasing the pulse train duration while keeping a fixed stimulation rate and phase duration (TLI) but also when increasing the stimulation rate while maintaining the pulse train duration and phase duration fixed. This effect of different pulse rates on the hearing threshold was also termed multi-pulse integration (MPI) in previous investigations (Carlyon et al., 2015; Kreft et al., 2004; Pfingst et al., 2011; Zhou et al., 2015). Carlyon et al. (2015) found a decrease in threshold of 2.7 dB per doubling of the rate between 500 and 3,500 pps for 400 ms pulse trains. A decrease of 2.4 dB and 1.2 dB per doubling of the rate for threshold and maximum acceptable levels (MALs), respectively, was found by Kreft et al. (2004) (200 ms pulse trains) between 200 and 6,500 pps.
A neuron between two electrodes is stimulated by the pulses from both electrodes, which follow at a rate of rate
In this study, we focus on the shape of threshold and suprathreshold curves of equal loudness as a function of stimulus duration. All our measurements relate to the psychophysical measurement of loudness. Therefore, our results describe the effects of TLI in the auditory pathway. We were interested in the characteristics of TLI in CIs, as different peripheral mechanisms are in place compared to normal (acoustic) hearing. In particular, we investigated how TLI curves between a single pulse and 300 ms are affected by stimulation rate, stimulation level, and electrode location. TLI curves were studied at a low (1,500 pps) and a high (18,000 pps) stimulation rate. To the best of our knowledge, TLI curves have not been obtained for stimulation rates as high as the one used here. Additionally, we asked to which extent a simple power-law function is suitable to model electric hearing data up to moderate durations and at different stimulation levels. Power-law functions are frequently used to accurately describe TLI curves in acoustic hearing as well as in other sensory modalities such as electrocutaneous sensation (Higashiyama & Tashiro, 1983; Tashiro & Higashiyama, 1981). Moreover, it has been observed that the amount of TLI varies with stimulation level in normal hearing listeners (Buus et al., 1997; Florentine et al., 1996; Garnier et al., 1999) and listeners with cochlear hearing loss (Buus et al., 1999). To this end, in addition to TLI curves at threshold (THR), we also measured TLI curves at MALs and at a line of equal loudness (BAL) between THR and MAL at an apical and a basal electrode, respectively.
Methods
Subjects
Ten subjects (
Demographic Information of Subjects.
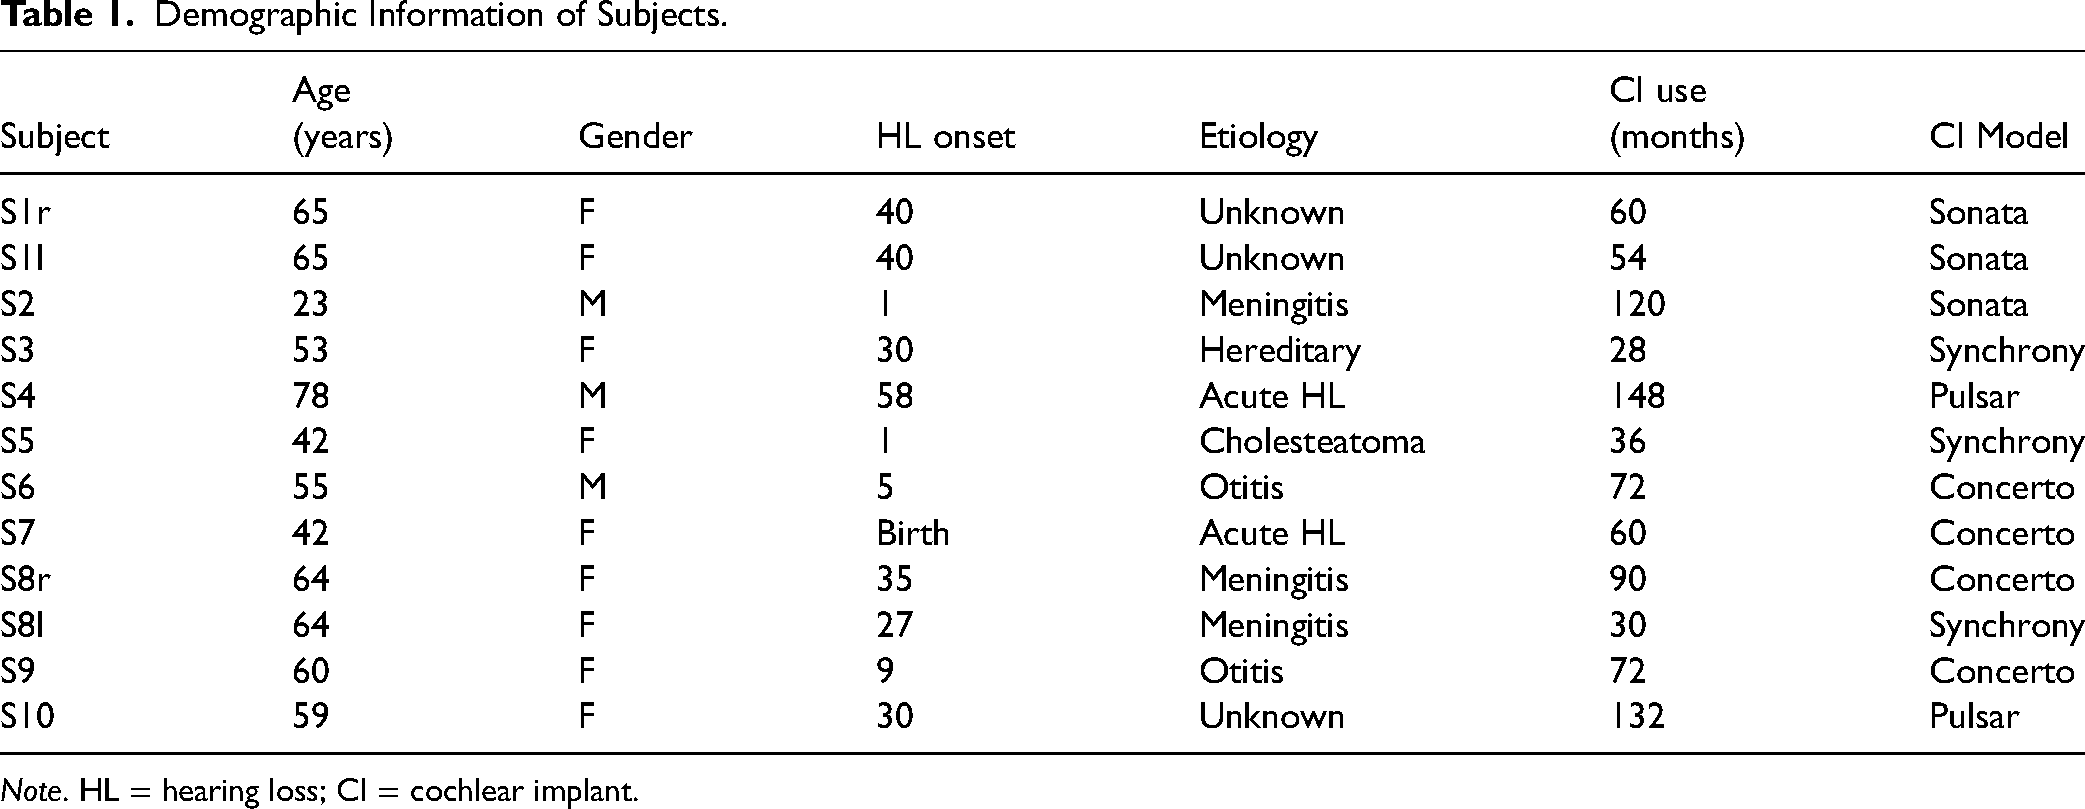
Note. HL = hearing loss; CI = cochlear implant.
All subjects gave their informed written consent for their participation and received monetary compensation. Measurements were conducted in accordance with the Declaration of Helsinki and approved by the medical ethics committee of the Klinikum rechts der Isar (Munich, 2126/08).
Equipment
The core of the experimental setup was a computer equipped with a digital card (Model NI PCIe-6361, National Instruments, Austin, Texas, USA). Pulse trains were created by sending all parameters (phase and gap duration, stimulation rate, pulse train duration, and stimulation amplitude) to the Research Interface Box 2 (RIB2, Institute of Ion Physics and Applied Physics, University of Innsbruck). The RIB2 turns the given information into pulses that are then sent out directly to the implanted parts of a CI. This setup allowed for full control over the stimulation, bypassing the sound processor. Stimuli were checked with a detector box (Institute of Ion Physics and Applied Physics, University of Innsbruck) that emulates a Pulsar implant and was connected to a digital oscilloscope. Subjects responded to the stimuli either by using a computer mouse to click response buttons of a graphical user interface (GUI) on the computer screen or by pressing the respective buttons on a computer keyboard.
Python (Version 2.7, 32-bit) was used to create the stimulation pulses and adapt them in real time, corresponding to the subjects’ responses. For data analysis, MATLAB (Version 9.10.0.1739362, R2021a Update 5, The MathWorks Inc., Natick, Massachusetts) with the Curve Fitting Toolbox (Version 3.5.13, The MathWorks, Inc.) was used. Statistical analyses were performed on IBM SPSS Statistics (Version 28.0.0.0 (190)) and R (The R Foundation for Statistical Computing, R version 4.2.2, “Superpower” Package), also available as an online tool (Superpower’s Power Shiny App, https://shiny.ieis.tue.nl/anova˙power/) developed by Lakens and Caldwell (2021).
Stimuli
For all measurements, monopolar stimulation was applied. Biphasic, charge-balanced pulses with leading cathodic (negative) phase were used. To allow for very high stimulation rates, the phase duration was set to 23.33 µs with a minimally available gap of 2.10 µs between the phases. Stimuli differed in stimulation electrode, rate, and duration (or equivalently, the number of pulses). A stimulation amplitude of 1,200 CU (62 dB re 1 CU) is set as an upper limit for stimulation by both the RIB2 software and the CI. 1 CU is roughly equivalent to 1 µA. Compliance limits were calculated individually in case the selected electrode’s impedances exceeded 5.6 kΩ. The compliance limit for MED-EL devices is 6.8 V. For example, for an impedance of 10 kΩ, the compliance limit is 680 µA. All stimuli were within the safe limits of stimulation. The maximally delivered charge was 27 nC.
In all experiments, the presented pulse trains were separated by a fixed silent gap of 500 ms. Since the longest duration used was 300 ms, the effect of forward masking was presumably reduced to a minimum after the pause. Nelson and Donaldson (2002) found average time constants of 54 ms for the exponential decay of masking after a 320 ms long masker with a frequency of 500 Hz. Even with the largest time constant they found (163 ms), less than 5 % threshold shift would be observed for a 10 or 30 ms probe pulse train after a pause of 500 ms. Regarding the effect of stimulation rate on forward masking time constants, no studies investigated rates as high as the ones we used in this study. However, Adel et al. (2017) showed that masking by pulse trains of high stimulation rate (5,000 pps) was even less pronounced than masking induced by low-rate (250 pps) pulse train maskers, when presented at the same loudness, as measured through the shift in probe detection thresholds 16 ms after the masker offset.
Electrodes
The same measurements were done at two different electrodes on the array. If not hindered by any reason, electrodes 3 (apical) and 10 (basal) were selected out of 12 electrodes in MED-EL CIs. Otherwise, neighboring electrodes were chosen. The selected electrodes had impedances lower than 10 kΩ. Compliance limits were calculated individually for electrodes with impedances larger than 5.6 kΩ.
Stimulation Rates
Two stimulation rates were used. The lower stimulation rate (1,500 pps) represented a typical stimulation rate present at a single contact of the electrode array in normal CI settings (without channel crosstalk). The higher rate (18,000 pps) was chosen to investigate the effect of an increased overall effective stimulation rate of 12 times the single-channel stimulation rate (at 100 % channel crosstalk).
Duration
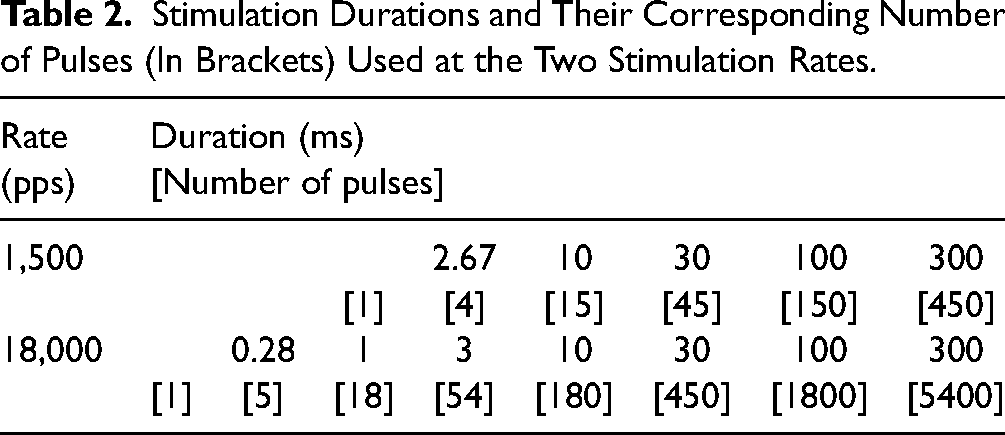
At the higher rate, stimuli with the number of pulses ranging from 1 to 5400 were presented. For the lower rate, the stimuli consisted of 1 pulse to 450 pulses. The longest investigated pulse trains had thus a duration of 300 ms. The maximum duration was chosen as this is approximately the duration of a syllable, and also because it is commonly used as pulse train duration in clinical fittings (Wolfe & Schafer, 2014). Table 2 offers an overview of all tested rate

Exemplary data obtained from subject S1l (A) and S7 (B) for THR, MALs, and loudness balancing (BAL). The solid lines depict power functions (equation 2) fitted to the data points. The dotted lines show the TLI slopes of −20∕3 dB per decade in normal hearing. In case the electrode’s impedance was below 5.6 kΩ, the dashed lines represent the maximum possible stimulation amplitude of 1,200 CU. Else, the individual compliance limit is denoted by the dashdotted line. Top: Apical electrode. Bottom: Basal electrode. Left: 1,500 pps. Right: 18,000 pps. MAL = maximum acceptable level; THR = threshold; TLI = temporal loudness integration.
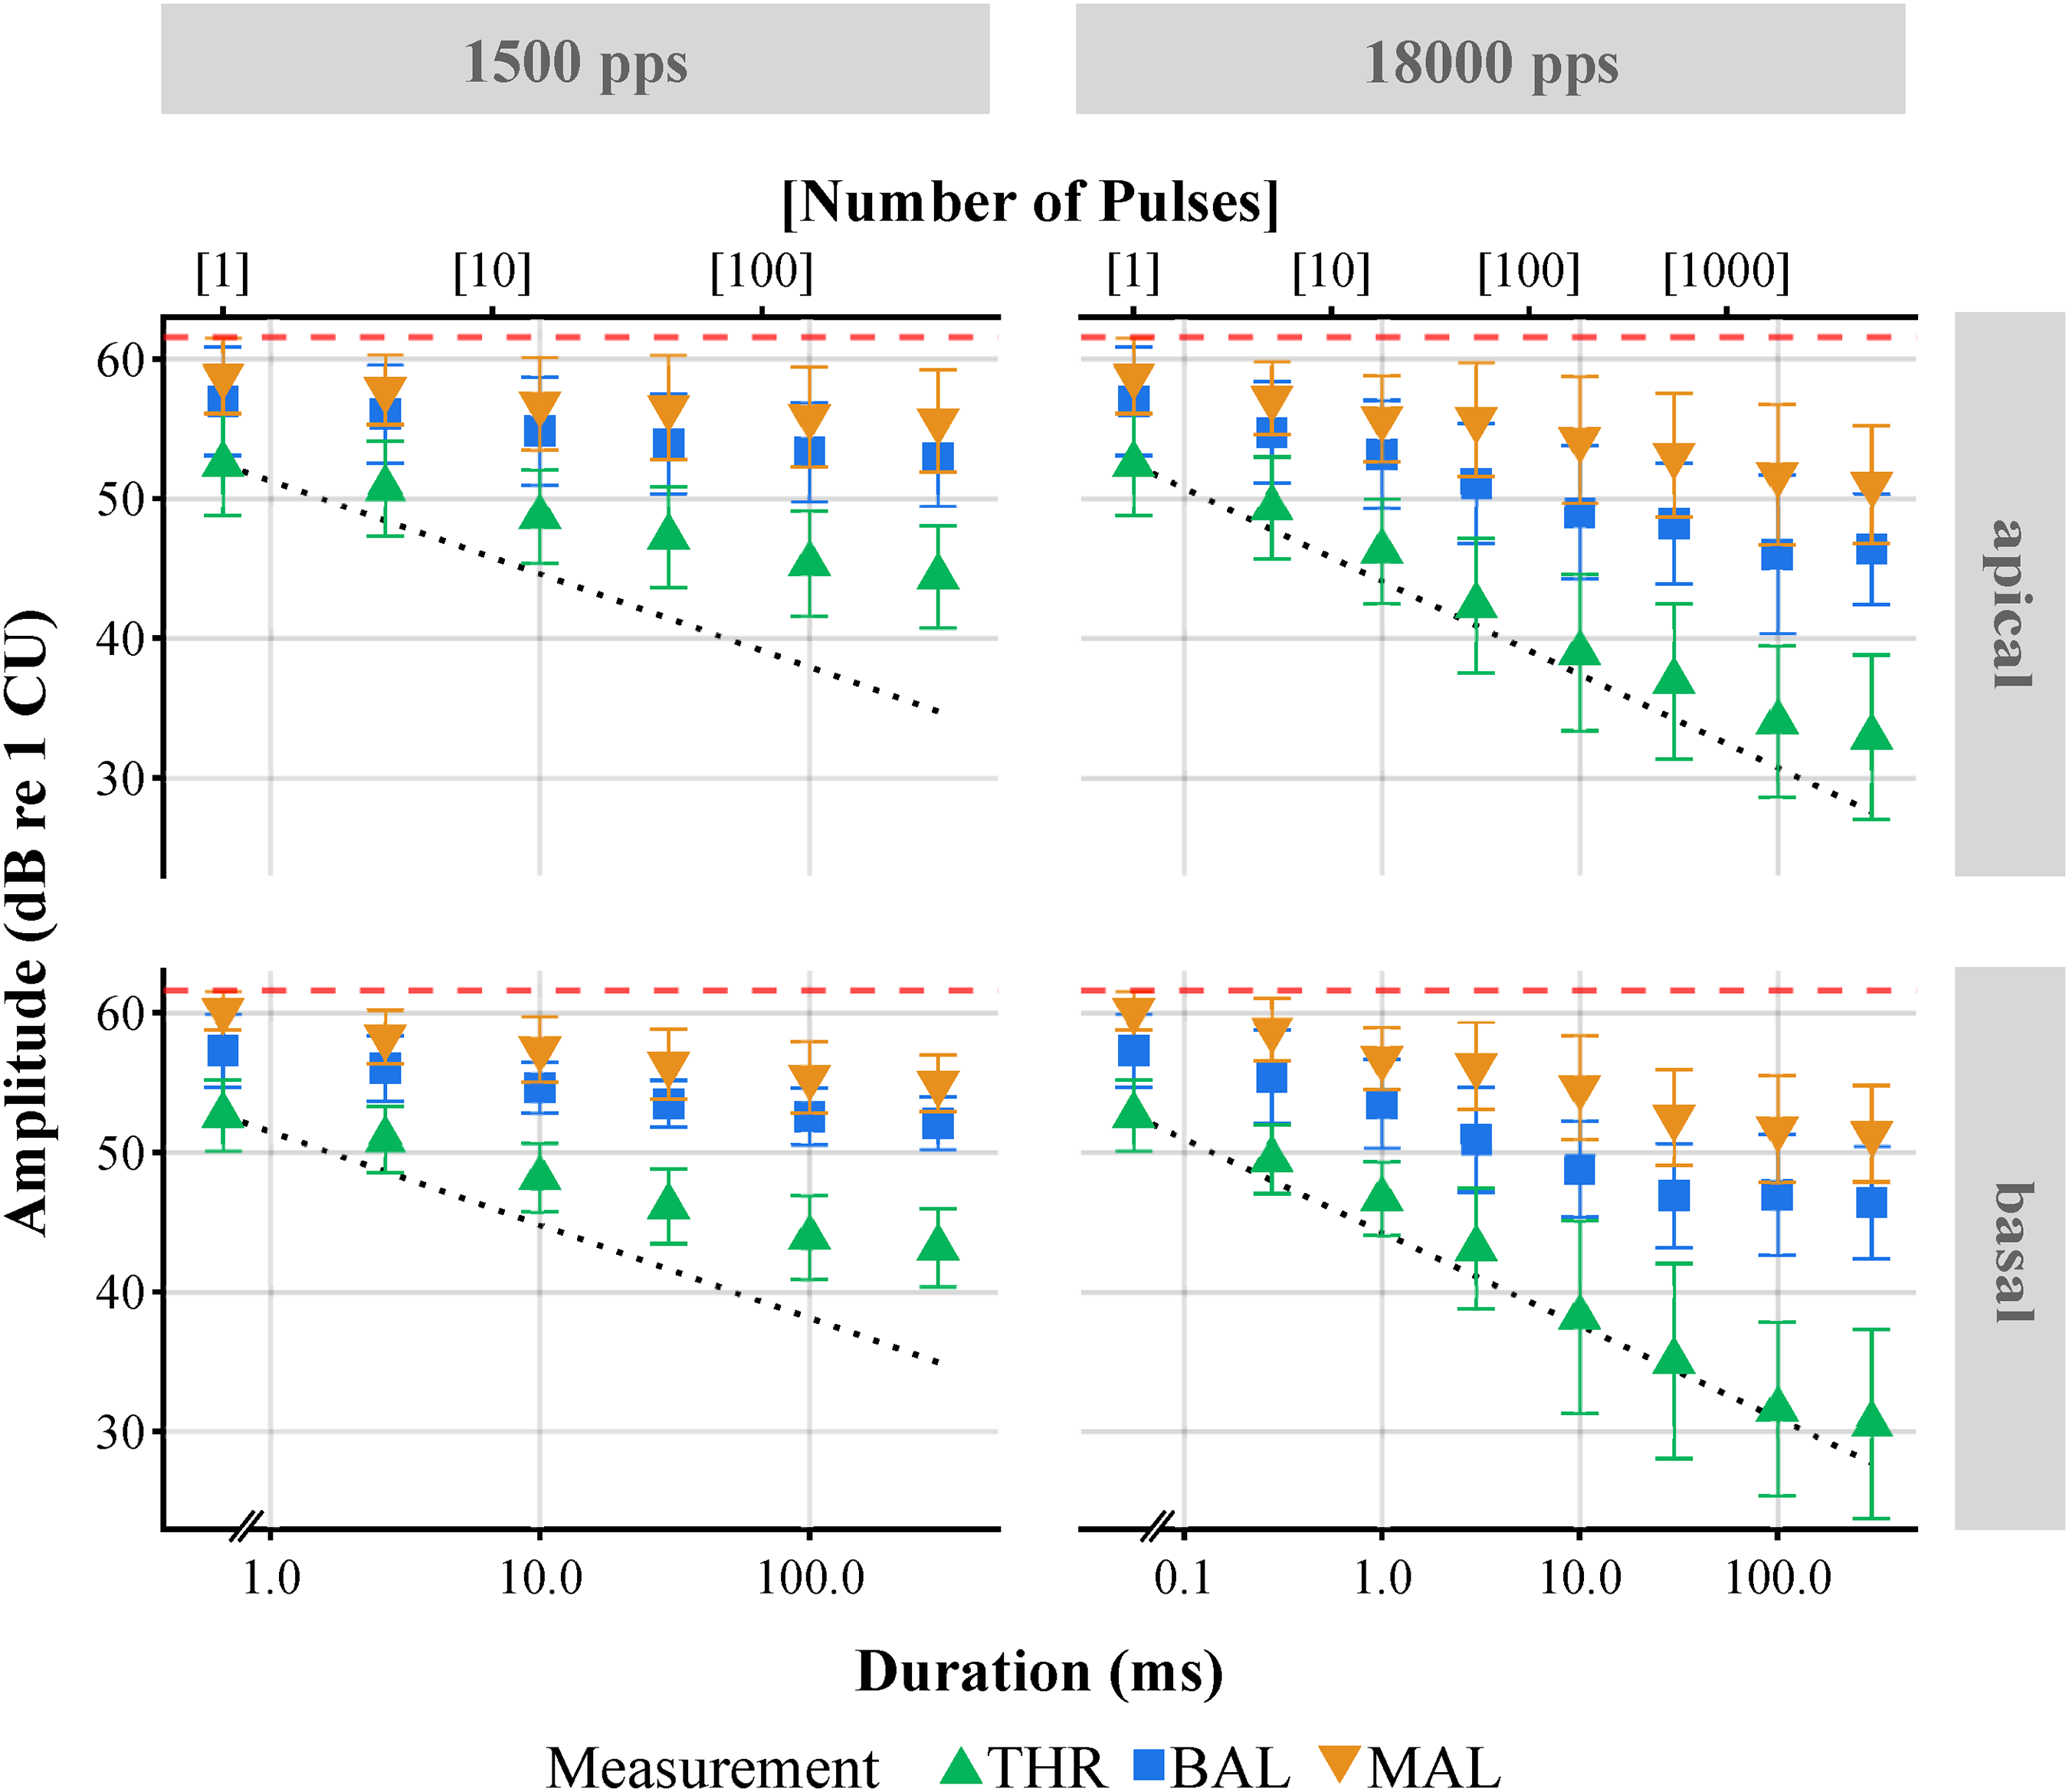
Mean amplitudes as a function of duration for THR, MALs, and loudness balancing (BAL) for all subjects. The dotted lines show the TLI slopes of −20∕3 dB per decade in normal hearing. The dashed lines represent the maximum possible stimulation amplitude of 1,200 CU. Symbols represent the mean over all subjects. Error bars indicate one standard deviation from the mean. Top: Apical electrode. Bottom: Basal electrode. Left: 1,500 pps. Right: 18,000 pps. MAL = maximum acceptable level; THR = threshold; TLI = temporal loudness integration.
Stimulation Durations and Their Corresponding Number of Pulses (In Brackets) Used at the Two Stimulation Rates.
Experimental Procedure
The experiment consisted of three parts. In the first part, current amplitudes corresponding to threshold (THR) were determined. For the second part, subjects adjusted the stimulus levels to the maximum acceptable amplitude, referred to as MAL. The third part consisted of a loudness balancing procedure (BAL). The method of adjustment, in which subjects increased and decreased the stimulation amplitude to the desired value by themselves, was used in all THR, BAL, and MAL measurements, including training trials.
A GUI created with Python was displayed to the subjects. Buttons to increase or reduce the stimulation amplitude in large and small steps were visible, as well as a button to save the adjusted amplitudes. All responses could also be entered via a computer keyboard. The corresponding keys were color-matched to those on the screen. Changing the amplitude in small steps caused an increase or decrease of the current level by 1.18 to 9.45 CU, depending on the amplitude. The large steps changed the level by ±18.90 CU, with one exception. In training trials starting at zero amplitude, large steps increased the current amplitude by 28.35 CU, up until the first reversal. During the training phases of THR and MAL, a representation of the chosen amplitudes was visible to provide feedback for the subjects. No feedback regarding the chosen current amplitude was given outside of training. Throughout the experiment, pauses were automatically initiated every 20 minutes if subjects did not ask for a pause before.
Thresholds
A training phase made sure that the subjects understood the task and familiarized themselves with the setup. From the training trials, which were not used for the experiment, preliminary THR estimates were acquired. Preliminary THRs were measured at three well-separated durations (four at the higher rate) in the duration-threshold curve for each electrode
THRs were measured four times for all possible electrode
Maximum Acceptable Levels
Analogously to the THR measurements, a short training phase ensured that every subject understood the task. During training, preliminary MALs were measured only for the longest pulse train duration (300 ms) for a first estimation of the DR.
MALs were measured four times for all possible electrode
Curve of Equal Loudness
In the third part of the experiment, a loudness balancing (BAL) procedure as a function of stimulus duration for each of the 4 electrode
A flowchart depicting the entire loudness balancing procedure is shown in Figure 3. Foremost (⓪), all 4 electrode

Flowchart depicting the entire loudness balancing procedure. Within each step (dashed box), the first box represents the fixed stimulus, the second box the probe, and the third box the result of the balancing procedure. The order of the balancing procedure is numbered at the lower-right corner of each dashed box (from 0 to 4). At step 0, all 300 ms-references were balanced against the loudness of a main reference stimulus presented with 1,500 pps, 300 ms at 60% of its dynamic range (DR) at the apical electrode. Steps 1 and 3 show the noninverted BALs, where the loudness of the shorter stimuli had to be balanced to the corresponding previously-adjusted 300 ms reference stimuli
After having balanced the four 300 ms-references 
Analyses
For each subject and condition, the mean over the corresponding THR/MAL measurements was taken. The DRs were calculated by dividing the mean THR by the mean MAL and then converted into dB. Equation 1 was used to obtain a single BAL value from the four loudness balancing measurements. For averaging over different subjects, means were calculated. Regular standard deviations were calculated to show variability within and between subjects to allow easier comparisons to other publications.
Conventional nonlinear least squares estimation was used to fit THR, BAL, and MAL amplitudes to a power-law as a function of the number of pulses. All calculations were done with amplitudes in CU and only transformed into dB re 1 CU for visual display and comparisons.
Statistical Analysis
A repeated measures analysis of variance (RM ANOVA) was applied when calculating the effects of several factors on the results. An alpha-level of 0.05 was used. Bonferroni correction was used to correct for multiple testing.
The slopes of the fitted power-laws were tested with a three-way (three within-subject factors) RM ANOVA with the factors
The statistical power of the RM ANOVA was tested by conducting a power analysis in R, also available as an online tool (Superpower’s Power Shiny App, https://shiny.ieis.tue.nl/anova˙power/) developed by Lakens & Caldwell (2021). The Superpower package estimates the power of factorial ANOVA designs based on Monte Carlo simulations of the experimental design. We ran a Monte Carlo simulation (
Results
Effects of Duration, Rate and Electrode
Figure 1 shows exemplary results for two subjects. THR, BAL, and MAL amplitudes decreased with increasing duration (or equivalently, increasing number of pulses). It is also visible that sometimes, for very short durations, no data points for the MAL could be obtained because of the compliance limit. In panel A (S1l), the fitted curves (solid lines) of THR and MAL appear to be almost parallel, while the BAL curve is shallower than the other two. In contrast, in panel B (S7), MAL and BAL seem to drop similarly for increasing duration, whereas the THR curves have different slopes. In general, BAL data needs to be interpreted with caution as many subjects reported having problems comparing the loudness of short and long stimuli precisely.
Figure 2 shows the mean over all subjects’ results for the THR, BAL, and MAL measurements as a function of duration (or equivalently, number of pulses) for each of the 4 electrode
Temporal Loudness Integration
Several phenomenological models for (acoustic) TLI have been proposed in the past (Garner & Miller, 1947; Green et al., 1957; Hughes, 1946; Plomp & Bouman, 1959). Of those, the power function (which appears as a linear dependency on double-logarithmic axes) is one of the simplest options to fit normal-hearing TLI data. The decision to fit this function to our data was not only based on its simplicity but because it also allowed for a direct comparison between the slopes of the fitted functions. On the downside, we found that our data did not cover long enough durations to determine the critical duration, after which loudness does not vary with duration anymore (Munson, 1947; Stevens & Hall, 1966). However, from visual inspection, it seemed like this saturation point was only reached in a few subjects for specific conditions. This possible critical duration was ignored in the following analyses, as it was alno not consistently found in the acoustic literature at similar durations (Florentine et al., 1988; Gerken et al., 1990).
THR, BAL, and MAL current amplitudes (
Results of Data Fits with equation 2 for the Parameters

Note. Means
The slopes of the fitted THR, BAL, and MAL functions for every subject for each rate, and electrode are shown in Figure 4. Within one measurement (THR, BAL, MAL) and electrode position (apical, basal), the data points corresponding to the same subject are connected by a line to better visualize the effect of stimulation rate on the slopes of the TLI curves. An RM ANOVA on the slope of the fitted functions testing the effects of

Slopes
The slope of the fitted functions and the absolute THR amplitudes (in CU) correlated relatively high (Spearman’s
Discussion
In investigations with CI users, often a large variability between the individual subjects’ performance is observed. This was also the case in the present experiment, where a large variability of absolute THR, BAL, and MAL current amplitudes is apparent. This can partly be explained by different progression of diseases (including degeneration of the distal parts of SGNs), different levels of training with the CI due to differing time spans since implantation, residual hearing of the nonimplanted side, or a dissimilar positioning of the electrode array in the cochlea, among different CI users. For this reason, we calculated the slopes of TLI on an individual level. Nonetheless, we measured effects of stimulation duration and stimulation rate that were common to all participants, even if the absolute current amplitudes differed.
Effects of Duration, Rate and Electrode
Overall, BAL and MAL curves in Figure 2 shared similar slopes, whereas the THR curve revealed steeper slopes when compared to the other two. This is reflected in the fitted slope parameters (Table 3, Figure 4). The main effect of stimulation rate (lower amplitudes for the higher rate, MPI) on threshold is in line with previously published results – if not somewhat higher. For pulse trains of 300 ms duration, we found on average 12.0 dB lower threshold amplitudes when stimulating with 18,000 pps instead of 1,500 pps (rate increased by a factor of 12), which is equivalent to a decrease of 3.3 dB per doubling of the rate.
Comparable but slightly lower values were found by Carlyon et al. (2015), with a decrease of 7.7 dB for 400 ms pulse trains after increasing the rate from 500 to 3,500 pps, equivalent to a threshold decrease of 2.7 dB per doubling of the rate. Kreft et al. (2004) found a reduction in threshold of 2.4 dB per doubling of the rate between 200 and 6,500 pps, with a reduced effect beyond 3,250 pps for 200 ms pulse trains. In Zhou et al. (2015), detection thresholds for 250 ms pulse trains showed a median decrease of around 2.6 dB per doubling of the rate for rates higher than 1,000 pps. Lower amplitudes caused by higher rates (MPI) might be attributed to the effects of facilitation. With small interpulse intervals (equivalent to the rates above 1,000 pps), when a single fiber is in its absolute/relative refractory period, a subsequent pulse may still be able to elicit action potentials in other fibers. Even when the subthreshold pulses cannot cause an action potential, they may facilitate it for the subsequent pulses to cause the fiber to fire (Boulet et al., 2016). This facilitative effect has been suggested to be due to the residual partial depolarization of the cell membrane caused by subthreshold pulses (Middlebrooks, 2004).
As also the literature suggested (e.g. Zhou et al., 2012), in this study no systematic effect of stimulation electrode along the tonotopic axis was found for THR amplitudes. Nevertheless, some subjects showed markedly lower THRs for one of the electrodes. An extreme case was S7, for whom THRs at the basal electrode were at least 8.9 dB higher than at the apical electrode, for both of the tested rates (Figure 1B).
MAL decreased, on average, by 4.8 dB between the two rates, or 1.3 dB per doubling of rate (300 ms pulse trains), comparable to the results in Kreft et al. (2004) of 1.2 dB per doubling, and somewhat lower than those in Skinner et al. (2000) of around 1.7 dB per doubling between 1,200 and 2,400 pps.
Temporal Loudness Integration
In electric hearing, differences between threshold and suprathreshold curves have been described by McKay and McDermott (1998). They described that at higher levels, an increase in stimulus amplitude leads to a larger increase in aggregated stimulation than at lower levels. This was investigated by measuring loudness changes evoked by varying the interpulse interval between two pulses in a pair—which was itself repeated at 50 Hz. If it is possible to extend their findings to longer pulse trains, and it is assumed that similar levels of excitation in the nerve lead to similar loudness percepts, then it would be expected that smaller amplitude reductions are necessary at higher levels to compensate for longer pulse trains. This would imply steeper TLI curves at threshold than at higher levels, as was seen in this experiment (Figure 4).
A study with normal-hearing subjects revealed nonmonotonic level dependencies on the slope of TLI curves (Florentine et al., 1996). Both 1 kHz tones and white noise (WN) were investigated at 5 ms, 30 ms, and 200 ms. The strongest TLI was found at medium levels for both tones (around 56 dB SPL) and WN (around 76 dB SPL). Interestingly, they attribute this effect to properties of the loudness function related to the basilar membrane mechanics, which should not play any role in our subjects. In the present study, slopes at threshold were steeper (
Just like reported in other studies, our data contained large interindividual variability. Regarding the slopes of the fitted THR functions, results at conditions of e.g. basal positions at 1,500 pps varied from
Already Donaldson et al. (1997) reported much shallower slopes for CI users when compared to normal-hearing listeners, whose slopes are at about −2 or −3 dB per doubling of duration (see also Shannon, 1983). At a relatively high stimulation rate of 10,000 pps, Saeedi and Hemmert (2020) reported a TLI slope of −1.30 dB per doubling the stimulation duration for CI users, which is equivalent to a slope of −4.32 dB per decade. This slope falls properly between the two slopes of −3.49 and −5.52 dB per decade found in this study for the rates of 1,500 and 18,000 pps, respectively. It seems that only very high stimulation rates, the slopes of CI users become more similar, i.e. as steep, to those of normal-hearing listeners. However, this similarity is more surprising than expected, given that acoustic hearing involves large DR compression by the inner ear mechanics, which is completely missing in electric hearing. The DR in electric hearing is by orders of magnitude lower than for acoustic stimulation and therefore, at the higher rate, the amount of TLI even exceeds the DR. At 18,000 pps, single-pulse (SP) THRs were, on average,
Dynamic Range
The DR increased with increasing stimulation rate for all durations, but even more for longer than for shorter stimulus durations. For the 300 ms pulse trains, an increase in DR of
Bonnet et al. (2012) reported an increase in DR of 1.3 dB for a doubling of the stimulation rate. Our values suggest 2.05 dB for a doubling of the rate. Since the rates we compared (1,500 and 18,000 pps) are much higher than theirs (774 and 3,868 pps), there could be an additional influence of the effect of rate on THR and MAL for rates higher than 3,868 pps. The increase of DR in our data is also much larger than the one found by Zhou et al. (2012). They report an increase in DR of 1.19 dB for a doubling of the stimulation rate, for increasing the rate up to 5,000 pps.
The fact that for both rates the DR increased even more for long durations is reflected by the differences in slopes for the two measures, where THRs decreased with a steeper slope of −0.23, compared to the slope of −0.12 found for MALs (Figure 4). This is in line with the literature, which reported shallower slopes for maximum amplitudes (also called C-levels) when compared to those for the threshold amplitudes (also called T-levels) (Zhou et al., 2012).
For CI fitting in the clinics, only single electrode DRs are set. Since neurons in the cochlea also experience stimulation of neighboring electrodes due to wide electrical current spread, their effective stimulation occurs in bursts, where the burst rate is the single electrode rate times the number of stimulated electrodes (as the high rate in our measurements). For this high rate, the THR values are lower and the DR higher than currently set in clinical CI fittings. Accurate consideration of the TLI at different rates during the fitting process could therefore result in a better usage of the limited DR available in electric hearing and, therefore, could be used to better CI performance.
Conclusions
In the present work, we measured TLI curves in CI users at three different levels, at a moderate and a very high rate, and at two positions in the electrode array. In general, an increase in stimulation rate lowered the current amplitudes at all loudness levels (MPI), and this effect of rate was stronger at THR than at MAL stimulation. This led to an increased DR for the higher rate that seems consistent, if not higher, than those found in the literature.
We also showed that a power-law function can describe the TLI curves in CI users with high accuracy, as also suggested in normal-hearing listeners. The slopes of the TLI curves were also steeper for THR than for BAL and MAL stimuli. The effect of rate itself was stronger on the slopes of THR when compared to those of MAL levels. In comparison to the lower rate, the higher rate led to a steeper THR slope, where, surprisingly, the slope of the TLI curves approached that reported in normal-hearing listeners.
Footnotes
Acknowledgements
We are particularly grateful to the study participants for their important contribution. The Institut für Ionenphysik und Angewandte Physik, University of Innsbruck provided the RIB2. The ENT at Klinikum Großhadern, the Hörzentrum of the Klinikum rechts der Isar, the Therapiezentrum für Hörgeschädigte (Praxis Hanik, Laim) and the Campus Lauscher at Großhadern all collaborated in recruiting volunteer subjects with CIs.
Data Availability
All reported data is available on request.
Declaration of Conflicting Interests
The authors declare no potential conflicts of interest with respect to the research, authorship, and/or publication of this article.
Ethical Approval
Measurements were conducted in accordance with the Declaration of Helsinki and approved by the medical ethics committee of the Klinikum rechts der Isar (Munich, 2126/08).
Funding
The authors disclosed receipt of the following financial support for the research, authorship, and/or publication of this article: This project was funded by a grant from MED-EL (Innsbruck) and the German Research Foundation (DFG, Deutsche Forschungsgemeinschaft) [project number 415658392].
Informed Consent
All subjects gave their informed written consent for their participation and received monetary compensation.
Notes
The following authors have moved to a new institution since completing the research.
1. Anna Dietze, Carl von Ossietzky Universität Oldenburg, Department für Medizinische Physik und Akustik, Oldenburg, Germany.
2. Sonja Karg, Technische Hochschule Ingolstadt, Medizintechnik und Biosignalverarbeitung, Fakultät Elektro- und Informationstechnik, Ingolstadt, Germany.