
Abstract
Speech perception is challenging under adverse conditions. However, there is limited evidence regarding how multiple adverse conditions affect speech perception. The present study investigated two conditions that are frequently encountered in real-life communication: background noise and breathy vocal quality. The study first examined the effects of background noise and breathiness on speech perception as measured by intelligibility. Secondly, the study tested the hypothesis that both noise and breathiness affect listening effort, as indicated by linear and nonlinear changes in pupil dilation. Low-context sentences were resynthesized to create three levels of breathiness (original, mild-moderate, and severe). The sentences were presented in a fluctuating nonspeech noise with two signal-to-noise ratios (SNRs) of −5 dB (favorable) and −9 dB (adverse) SNR. Speech intelligibility and pupil dilation data were collected from young listeners with normal hearing thresholds. The results demonstrated that a breathy vocal quality presented in noise negatively affected speech intelligibility, with the degree of breathiness playing a critical role. Listening effort, as measured by the magnitude of pupil dilation, showed significant effects with both severe and mild-moderate breathy voices that were independent of noise level. The findings contributed to the literature by demonstrating the impact of vocal quality on the perception of speech in noise. They also highlighted the complex dynamics between overall task demand and processing resources in understanding the combined impact of multiple adverse conditions.
Introduction
Speech perception in real-life communication is a challenging task. The complex process involves many adverse and suboptimal conditions that are not represented during standard speech testing in clinical settings. The challenges in the adverse conditions can stem from the multiple components of the speech communication system: the source (e.g., speaker's accent and voice), the environment (e.g., noise), and the receiver (e.g., listener's hearing and language experience). Using this frame, Mattys et al. (2012) reviewed and summarized a wide range of adverse conditions and their respective effects on speech perception. While we know these conditions affect different stages of speech processing (Gordon-Salant et al., 2020) and lead to a variety of consequences, from recognition failure to learning difficulty (Mattys et al., 2012), we know little about the combined effects or potential interactions among these conditions on speech perception. From a theoretical perspective, it is critical to understand how the peripheral, perceptual, and cognitive mechanisms in speech perception interact to cope with multiple adverse conditions. Clinically, this knowledge gap negatively affects the ecological validity of intervention and outcome measures because these adverse conditions frequently coexist in realistic communication scenarios. Thus, their combined effects need to be represented and addressed in clinical protocols. For example, while there is substantial evidence for the effect of background noise on speech perception (e.g., Bronkhorst, 2000; Gallun & Best, 2020; McArdle & Wilson, 2009), the target speech used in these research studies is mostly clear speech with a familiar accent and typical voice. On the other hand, communication in real life frequently happens with someone who speaks with an unfamiliar accent and/or a hoarse voice, and the conversation is taking place in a noisy environment. Although it is reasonable to speculate that this combination of source degradation and environmental factors could result in a greater challenge to speech perception, the exact impact or interaction of their combined effects requires additional research. A study by McLaughlin et al. (2018) examined the impact of a nonnative accent on speech intelligibility in environments with and without background noise. While focused on inter-listener variability in speech perception, their results showed that speech intelligibility was significantly correlated between conditions of native and nonnative speech when these speech stimuli were embedded in background noise. Additionally, there was a strong correlation between speech intelligibility with nonnative speech across the two noise conditions of with and without background noise. This finding suggests the interlistener variability in perceiving accented speech in noise is modulated by two different sources of challenge: source degradation due to the speaker's accent and environmental factor of background noise. Focused on how speech intelligibility is affected by clear speech as compared to conversational speech, Payton et al. (1994) investigated this effect within the context of multiple environmental challenges including noise, reverberation, and both noise and reverberation (Payton et al., 1994). They found an interaction between the speaking style effect and the severity of environmental challenges. Specifically, the difference in intelligibility due to speaking style (clear speech compared to conversational speech) increases as noise and reverberation increases.
Another type of source degradation is impaired or altered vocal quality. This perception of an altered vocal quality, also called ‘dysphonia,’ is frequently heard in individuals who have a voice disorder. Using voices from six speakers with dysphonia and six speakers with typical voices, Ishikawa et al. (2017) measured speech intelligibility in cafeteria noise with two signal-noise ratios (SNRs, Ishikawa et al., 2017). Similar to the findings from Payton et al. (1994), the data from Ishikawa et al. (2017) showed an interaction between the level of background noise and dysphonic voice on intelligibility. The dysphonic speech was less intelligible than the typical speech, and this effect was stronger in the more challenging noise condition. Although the stimuli and background noise were selected based on their ecological validity (i.e., actual recordings of dysphonic voice, cafeteria noise), these selections also have limitations in terms of greater translatability of the findings. First, dysphonic voices vary significantly in their auditory-perceptual characteristics. The standard clinical evaluation of voice in speech-language pathology includes categorizing the severity of dysphonia across multiple auditory-perceptual dimensions, such as overall severity, roughness, strain, and breathiness (Kempster et al., 2009). As dysphonic voices from different speakers may vary significantly in terms of their rating on these dimensions, it is important to know how each of these perceptual changes affects intelligibility. Along the same lines, cafeteria noise is a common environmental challenge that makes speech perception more difficult. The masking effect, however, can stem from both peripheral and perceptual causes (i.e., energetic vs. informational masking). The masking literature has defined informational masking as a mechanism that cannot be accounted for by the masking of energy in speech signals (Kidd et al., 2008). Even with energy overlap controlled for, the speech-like babble in cafeteria noises creates more perceptual interference and is therefore more challenging than the nonspeech noise. To better understand how and why voice quality change affects speech perception in background noise, it is critical to examine specific acoustic variables in voice with noises that are controlled for masking mechanisms.
Breathiness and its Effect on Speech Intelligibility
One of the core perceptual dimensions of vocal quality is “breathiness,” defined as audible air escape during voicing (Kempster et al., 2009). Previous work has indicated that an increased glottic gap, that is, incomplete closure of the vocal folds during voicing, is related to the perception of breathiness (Södersten & Lindestad, 1990). Importantly, this increased glottal gap is found frequently in older adults, as typical aging can result in atrophy, decreased bulk, or a general bowing of the vocal folds (Honjo & Isshiki, 1980; Linville et al., 1989; Mezzedimi et al., 2017). These structural changes are consistent with studies that demonstrated that the voices of older adults are frequently perceived as breathy (Linville et al., 1989; Rojas et al., 2020; Ryan & Burk, 1974). Therefore, the presence of breathiness is one dimension of vocal quality that is prevalent in the geriatric population and is thus frequently encountered in speech communication. Recent work has indicated that breathiness is the most predictive factor in the variance of intelligibility error of dysphonic voices (by predicting 41% of intelligibility errors by Porcaro et al., 2020). In other words, perception of speech with dysphonic voice was found to be more difficult and the intelligibility appeared to be associated with the level of breathiness in voice. However, this contrasts with earlier work suggesting that breathy vocal productions presented in a quiet environment had no effect on the recognition of synthesized words (Javkin et al., 1991) and limited impact on the identification of naturally produced vowels (Thompson, 2011). While this discrepancy in data can potentially be attributed to the difference in methodology, the findings suggest the impact of breathiness may only manifest itself in a complex listening scenario. Specifically, breathiness may not affect speech perception of simple stimuli (e.g., phonemes and words) in a quiet environment. Rather, breathiness may negatively affect speech perception of more complex stimuli (e.g., longer speech signal) in a more realistic environment with background noise. Built on this rationale, the first objective of the present study was to examine the effect of breathiness on speech intelligibility in nonspeech noise by a group of young listeners with typical hearing. Built on the results from Ishikawa et al. (2017), it was predicted the negative effect of breathy voice on speech intelligibility would interact with noise level and become stronger under more adverse SNR conditions.
The Effect of a Breathy Vocal Quality and Background Noise on Listening Effort
Although the literature to date has not provided strong evidence for or against a direct impact of a breathy vocal quality on speech intelligibility in background noise, it is possible that breathiness can affect listeners’ listening effort during speech perception in noise, even when the intelligibility remains unchanged. A recent theoretical framework defined processing effort as resources that are purposefully distributed to address problems or challenges while carrying out a task (Pichora-Fuller et al., 2016). Specifically, listening effort is defined as the processing effort expended while attending to and interpreting information delivered auditorily (McGarrigle et al., 2014). Previous research has shown that acoustic degradations impact listening effort, as measured by a variety of paradigms, including subjective ratings (Brons et al., 2014; Krueger et al., 2017), dual tasks (Picou et al., 2013; Sarampalis et al., 2009; Ward et al., 2017), and task-evoked pupil response (Shen et al., 2022; Winn et al., 2015; Zekveld et al., 2014). Particularly, there is a recent surge in hearing science literature using task-evoked pupil response to examine how acoustic challenges affect listening effort during speech perception. Converging evidence from many studies showed changes in listening effort (as quantified by pupil dilation) under adverse conditions despite no changes in intelligibility. For instance, Winn et al. (2015) found that pupil dilation was elevated as a function of spectral degradation by vocoding, even with speech intelligibility kept consistent and maintained a high level of above 90%. Importantly, Winn et al. (2015) demonstrated the nonlinear effect of signal degradation on the change rate of pupil dilation. In other words, under the more adverse acoustic conditions, the pupil not only dilates more but also dilates faster while the sentence is playing. Focused on the effect of background noise on listening effort, Wendt et al. (2018) examined the effect of background noise on listening effort, showing that pupil dilation is modulated by the amount of informational masking with a fixed speech intelligibility level (Wendt et al., 2018). Similar to Winn et al. (2015), data from Wendt’s study showed linear and nonlinear differences in dilation trajectory due to masker type and SNR, suggesting the effects of background noise during online processing of acoustically degraded speech.
We know speech is perceived and processed in an online manner, while the sound is still unfolding (Brown et al., 2011; Wendt et al., 2016; see a review Van Engen & McLaughlin, 2018). For example, a study by Wagner et al. (2016) demonstrated the negative impact of spectral degradation on lexical selection based on durational cues during the online processing of spoken words. Using the visual world paradigm (Tanenhaus et al., 1995), they found the listeners took a longer time to rule out the competitor and to fixate on the target word with acoustic degradation. Focused on listening effort during word recognition, Kuchinsky et al. (2013) found an interaction between the effects of noise SNR and lexical competition on pupil dilation changes. Importantly, they used growth curve analysis (GCA) to reveal the nonlinear changes in pupil dilation including pupil response delay to peak and pupil size sustainment. It is worth noting the nonlinear effects that were demonstrated by the GCA provided more sensitive measures for revealing the interactive effects across acoustic and cognitive variables (Kuchinsky et al., 2013, p. 31). These findings align with the “Ease of Language Understanding model” (the ELU model, Rönnberg et al., 2013) by suggesting the early processing of speech signals and lexical selection can be interrupted by adverse conditions, which leads to an increased effort for recognizing the words and processing of the sentence. Importantly, while this process happens throughout the presentation of a spoken sentence, these online effects usually only become evident with paradigms such as eye-tracking and pupillometry (Van Engen & McLaughlin, 2018) and with analysis techniques that are sensitive to time-varying nonlinear effects such as GCA or generalized additive mixed model (GAMM; van Rij et al., 2019; Wieling, 2018). Built on this literature, it was hypothesized the changes in pupil dilation trajectory over time can indicate fine-grained changes in effort during this process and can be a more sensitive measure to reveal any effects from adverse conditions.
Built upon this rationale, the second objective of the current study was to examine how increased breathiness in voice and SNR affect linear and nonlinear changes in listening effort in speech perception, as measured by pupil dilation trajectory. Specifically, it was predicted the effect of breathiness would be modulated by SNR conditions, which could be revealed by both linear and nonlinear changes in pupil dilation.
Methods
Participants
Twenty-seven young participants were included in this study (mean age 21.22 years with a range of 18–30 years). Twenty-two participants self-identified as female, three as male, and two as nonbinary. All participants had normal hearing as measured by audiometric testing (with Pure Tone Average across 0.5, 1, 2k Hz < 20 dB HL). All participants were native speakers of General American English, recruited from the Temple University community, and were either paid or awarded course credit for their time. The study protocol was approved by the Institutional Review Board of Temple University.
Stimuli and Procedure
Speech Stimuli
The sentences were originally taken from the IEEE/Harvard sentence corpus (Rothauser et al., 1969), with five keywords in each sentence. The sentences contained neutral subject matter after the removal of items with high emotional valence (Shen, 2021). The stimuli were produced by a female native speaker of General American English. To increase breathiness, the sentences were resynthesized in the Praat program (Version 6.1.23; Boersma & Weenink, 2013) using the “breathiness” script from the Praat toolkit (Corretge, 2022). This function uses linear predictive coding to estimate the spectral envelope of the speech signal. White noise is then shaped using this spectral envelope, with additional attenuation of frequencies below 250 Hz and increasing the frequencies from 500 to 8,000 Hz, centering at 2,000 Hz, thus creating a “whispered” version of the signal. The “whispered” and original signals are then combined to produce the final speech signal used for analysis. Three breathiness conditions were created: original breathiness (1% increase in breathiness), mild-moderate breathiness (40% increase in breathiness), and significant breathiness (80% increase in breathiness). The decision to process the original signal at 1% breathiness (which was not auditorily detectable) was to allow all stimuli to be processed through the same algorithm to avoid any unintended consequences that just processing the signal could have on the perception. A certified speech-language pathologist rated the resynthesized samples from the three conditions using a standard clinical protocol of rating voice, rating them at breathiness levels of “normal,” “mild-moderate,” and “severe.”
The acoustic measure of pitch strength was also calculated to further confirm that the resynthesized breathy speech samples had an expected change in the acoustic signal. Previous work has shown that pitch strength is negatively correlated with perceived breathiness (Eddins et al., 2016; Shrivastav et al., 2012). Pitch strength was calculated using an auditory sawtooth waveform-inspired pitch estimator called “Auditory-SWIPE” (Camacho, 2012), consistent with previous work using this algorithm to examine vocal quality (Eddins et al., 2016; Shrivastav et al., 2012; Vojtech et al., 2019). A one-way analysis of variance (ANOVA) demonstrated that pitch strength was significantly different by breathiness level (F(2, 1950) = 9466.30, p < .001). A post hoc test indicated pitch strength was significant between all the breathiness levels, with the smallest pitch strength (M = 0.08) in the 80% breathiness level, followed by the 40% breathiness level (M = 0.14), and with the largest pitch strength found in the 1% breathiness level (M = 0.28). Figure 1 illustrates the pitch strength values in the three breathiness conditions.

Pitch strength values in the three breathiness conditions. Asterisks indicate significant differences between conditions. The whiskers indicate maximum and minimum, the boxes indicate first quartiles, third quartiles, and medians.
SNR Conditions
The noise stimulus was nonspeech noise that preserved the temporal and spectral characteristics of the 2-talker babble (International Collegium for Rehabilitative Audiology, ICRA 2-talker noise; Dreschler et al., 2001). This noise was chosen because it represents the acoustic characteristics of speech masking while avoiding the confounding factor of informational masking from the linguistic context of speech masking. Two SNRs of −5 and −9 dB were used based on the data from Shen (2021) and piloting to obtain speech intelligibility in the range of 70% to 90% correctly recognized keywords. There were 144 trials in total distributed across six conditions with a full combination of breathiness and SNR conditions. There were three breathiness levels (original, mild-moderately breathy, and severely breathy) and two SNR levels (favorable and adverse), with two blocks of 12 trials for each condition. The breathiness and SNR levels were mixed in each block with condition order randomized across participants. Prior to testing in each block, there was a brief practice session consisting of six trials (with one trial for each of the six breathiness/SNR conditions) to familiarize them with the procedure. Each experiment took about 90 min in total, and participants were given a break every three blocks to prevent fatigue.
Pupillometry Paradigm
The pupil diameter data was collected using an Eyelink 1000 plus eye-tracker in remote mode with head support. The left eye was tracked with a sampling rate of 1000 Hz. During testing, the participant was seated in a dimly lit double-walled sound booth in front of an LCD monitor, with the distance between the eye and screen set at 58 cm. The color of the screen was set to grey to avoid the outer limits of the range of pupil diameter based on previous data (Shen, 2021). The luminance measure was 37 lux at the eye position.
The experiment was implemented with a customized program using Eyelink Toolbox (Cornelissen et al., 2002) in MATLAB. Auditory stimuli were presented over a Sennheiser HD-25 headphone at 65 dBA. The participant was instructed to look at a red "X" sign once it appeared. After 2000 ms of silence, an audio stimulus was played. Because the sentences varied in their duration slightly (mean length 2656 ms, standard deviation 263 ms), they were offset aligned (e.g., Shen et al., 2022; Winn et al., 2015). This method allows each trial to begin with background noise before the onset of sentences, with a constant sound duration across trials (the pupil dilation data was processed in the data processing phase to align to sentence onset with baseline pupil dilation taken immediately before sentence onset). The sentence began about 1,500–2,000 ms after the noise onset, depending on the sentence length. The total length of each audio stimulus was 4,500 ms. There was a retention period of 2,000 ms after the stimulus finished playing. After the retention period, the red “X” sign was replaced by a green “X” sign that was of equal luminance. The participant was instructed to provide a verbal response only after the green “X” sign appeared. The tester scored the intelligibility based on the number of keywords correctly repeated. Once the participant completed a response, the tester terminated the trial with a key press, and a grey box appeared at the center of the screen after 1,000 ms of silence. The participant was instructed to rest their eyes when the grey box was on the screen. The resting period lasted for 5,000 ms before the next trial started. Pupil dilation data were recorded continuously throughout the entire session. The data file was tagged with time stamps that were synchronized with each of these visual and auditory events. Intelligibility data are reported in Figure 2.

Intelligibility data grouped by breathiness level and noise condition. The error bars indicate ± 1 standard error.
Data Processing and Analysis
Speech Intelligibility
To address the first objective of this study, speech intelligibility data were analyzed using mixed effects logistic regression with package lme4 (Bates et al., 2014) in R version 4.0.3 (R Core Team, 2020) to examine the effects of breathiness and SNR. A base model (model 0) that included only SNR [−5 dB (favorable) vs. −9 dB (adverse) SNR] was compared to a model (model 1) that added the factor of breathiness (original, mild-moderate breathiness, and severe breathiness), to test the main effects of both SNR and breathiness. Following the recommended practice of using mixed effects models (Meteyard & Davies, 2020), the primary models were built based on our study objectives, with fixed effects for both variables (SNR and breathiness) added first, followed by interaction between these variables (model 2). In all models, we included variables for block order and allowed for by-participant random intercepts and by-item random intercepts. We also tested all models with by-participant and by-item (i.e., sentence) random slopes, but they failed to converge (Barr et al., 2013). We used a series of model fit statistics including AIC (lower indicating better fit), log likelihood (higher indicating better fit), and p values from chi-square tests to identify the best-fitting model.
Pupil Response
Focused on the second objective regarding listening effort, pupil diameter data were preprocessed using R (Version 3.2.1) with the GazeR library (Geller et al., 2020). As pupil diameter is shown to be altered by fixation location (Gagl et al., 2011; Hayes & Petrov, 2016), a center area of the screen was defined by ± 8° horizontal and ± 6° vertical to obtain pupil alteration rate < 5% (Hayes & Petrov, 2016). Pupil diameter data were removed from further analysis when the fixation location was outside of this area, resulting in the removal of 3.1% of data points. One participant's data was removed from further analysis due to excessive fixation out of the center (more than 50% of data points were out of the center area). Using the Eyelink blink detection algorithm, missing pupil diameter data were marked as blinking. De-blinking was implemented by interpolation during the time window between 100 ms before the blink and 100 ms after the blink. The curve was further linearly interpolated and smoothed using a 20-point moving average. The pupil diameter data were downsampled to 10 Hz (by aggregating data every 100 ms) before statistical analysis. To control for the trial-level pupil diameter variability before speech processing, baseline pupil diameter was calculated based on the mean pupil diameter recorded during the 1,000 ms noise period immediately before the onset of the sentence. The dependent measure was pupil dilation relative to individuals’ baseline pupil diameter of each trial (by subtraction). To take into account the trajectory of pupil dilation during online processing, pupil diameter data from 0 (sentence onset) to 5,000 ms (∼ 2,000–2,500 ms after the end of the sentence) relative to sentence onset were used for building the models. Figure 3 illustrates the mean pupil dilation data for all conditions during this time window, with the time windows marked for baseline, data for analysis, and retention during a trial.

Mean pupil dilation trajectory from sentence onset. The brackets illustrate the timeline in the pupillometry protocol. The error bars indicate ± 1 standard error.
Pupil response data (trial by trial, between 0 and 5,000 ms relative to sentence onset) were first analyzed using a GAMM (van Rij et al., 2019; Wieling, 2018) to examine whether the magnitude of pupil dilation throughout each trial was affected by the severity of breathiness while controlling for the trend of pupil dilation over time. GAMMs are an extension of mixed-effects regression models that allow for the incorporation of random effects to model correlated responses within participants. This is a newer approach that has been used recently for the analysis of pupillometric data (van Rij et al., 2019), with several strengths over traditionally utilized linear mixed models and growth curve analyses (Baayen et al., 2018; Wieling, 2018). The key strength is that the GAMM method can handle nonlinear random effects which will allow us to investigate any potential nonlinear relationships between pupil dilation response to changes in breathiness and SNR. Additionally, GAMM allows us to include an autoregressive error term to account for autocorrelational errors in the data, reducing Type I error. Our models incorporate an autoregressive error model at lag = 1 (AR1) with an autocorrelation coefficient rho = 0.95 estimated from a base model without the inclusion of AR1.
To test our hypotheses, a series of models were constructed. First, a base model (model 0) was built that included linear and smooth terms of SNR to examine its independent effect on speech perception, a second model added in the effect of breathiness in linear and smooth terms (model 1), and a third model included an interaction between SNR and breathiness (model 2). The linear term is used for testing the difference in slope of pupil dilation change over time. The smooth (i.e., nonlinear) term is for testing the differences in the shape of pupil dilation contour across time. For example, if pupil dilation contour in one condition increases more rapidly during a particular time window but converges later in time with the contours in other conditions, this effect can be captured by a smooth term. All the models used ten knots for smooth functions (Sóskuthy, 2017), which allows for a maximum of nine basis functions. The best-fitting models resulting from these comparisons are presented in the Results section. To account for variation across participants and items, we included random effects for subjects and items in all models. All models included a factor smooth modeling of the pupil size over time per participant. Another factor smoothly modeled the individual variation over time by item. To demonstrate the nonlinear effects due to breathiness effects in different SNR conditions, we built another GAMM to test and visualize the nonlinear differences across all six combinations of breathiness and SNR conditions (Wieling, 2018). Specifically, difference plots were created to identify time windows of significant differences in pupil size over time for each of the breathiness contrasts by SNR combinations (Figure 4). All models were built in R version 4.0.3 (R Core Team, 2020) using packages mgcv and itsadug (Wood, 2011).
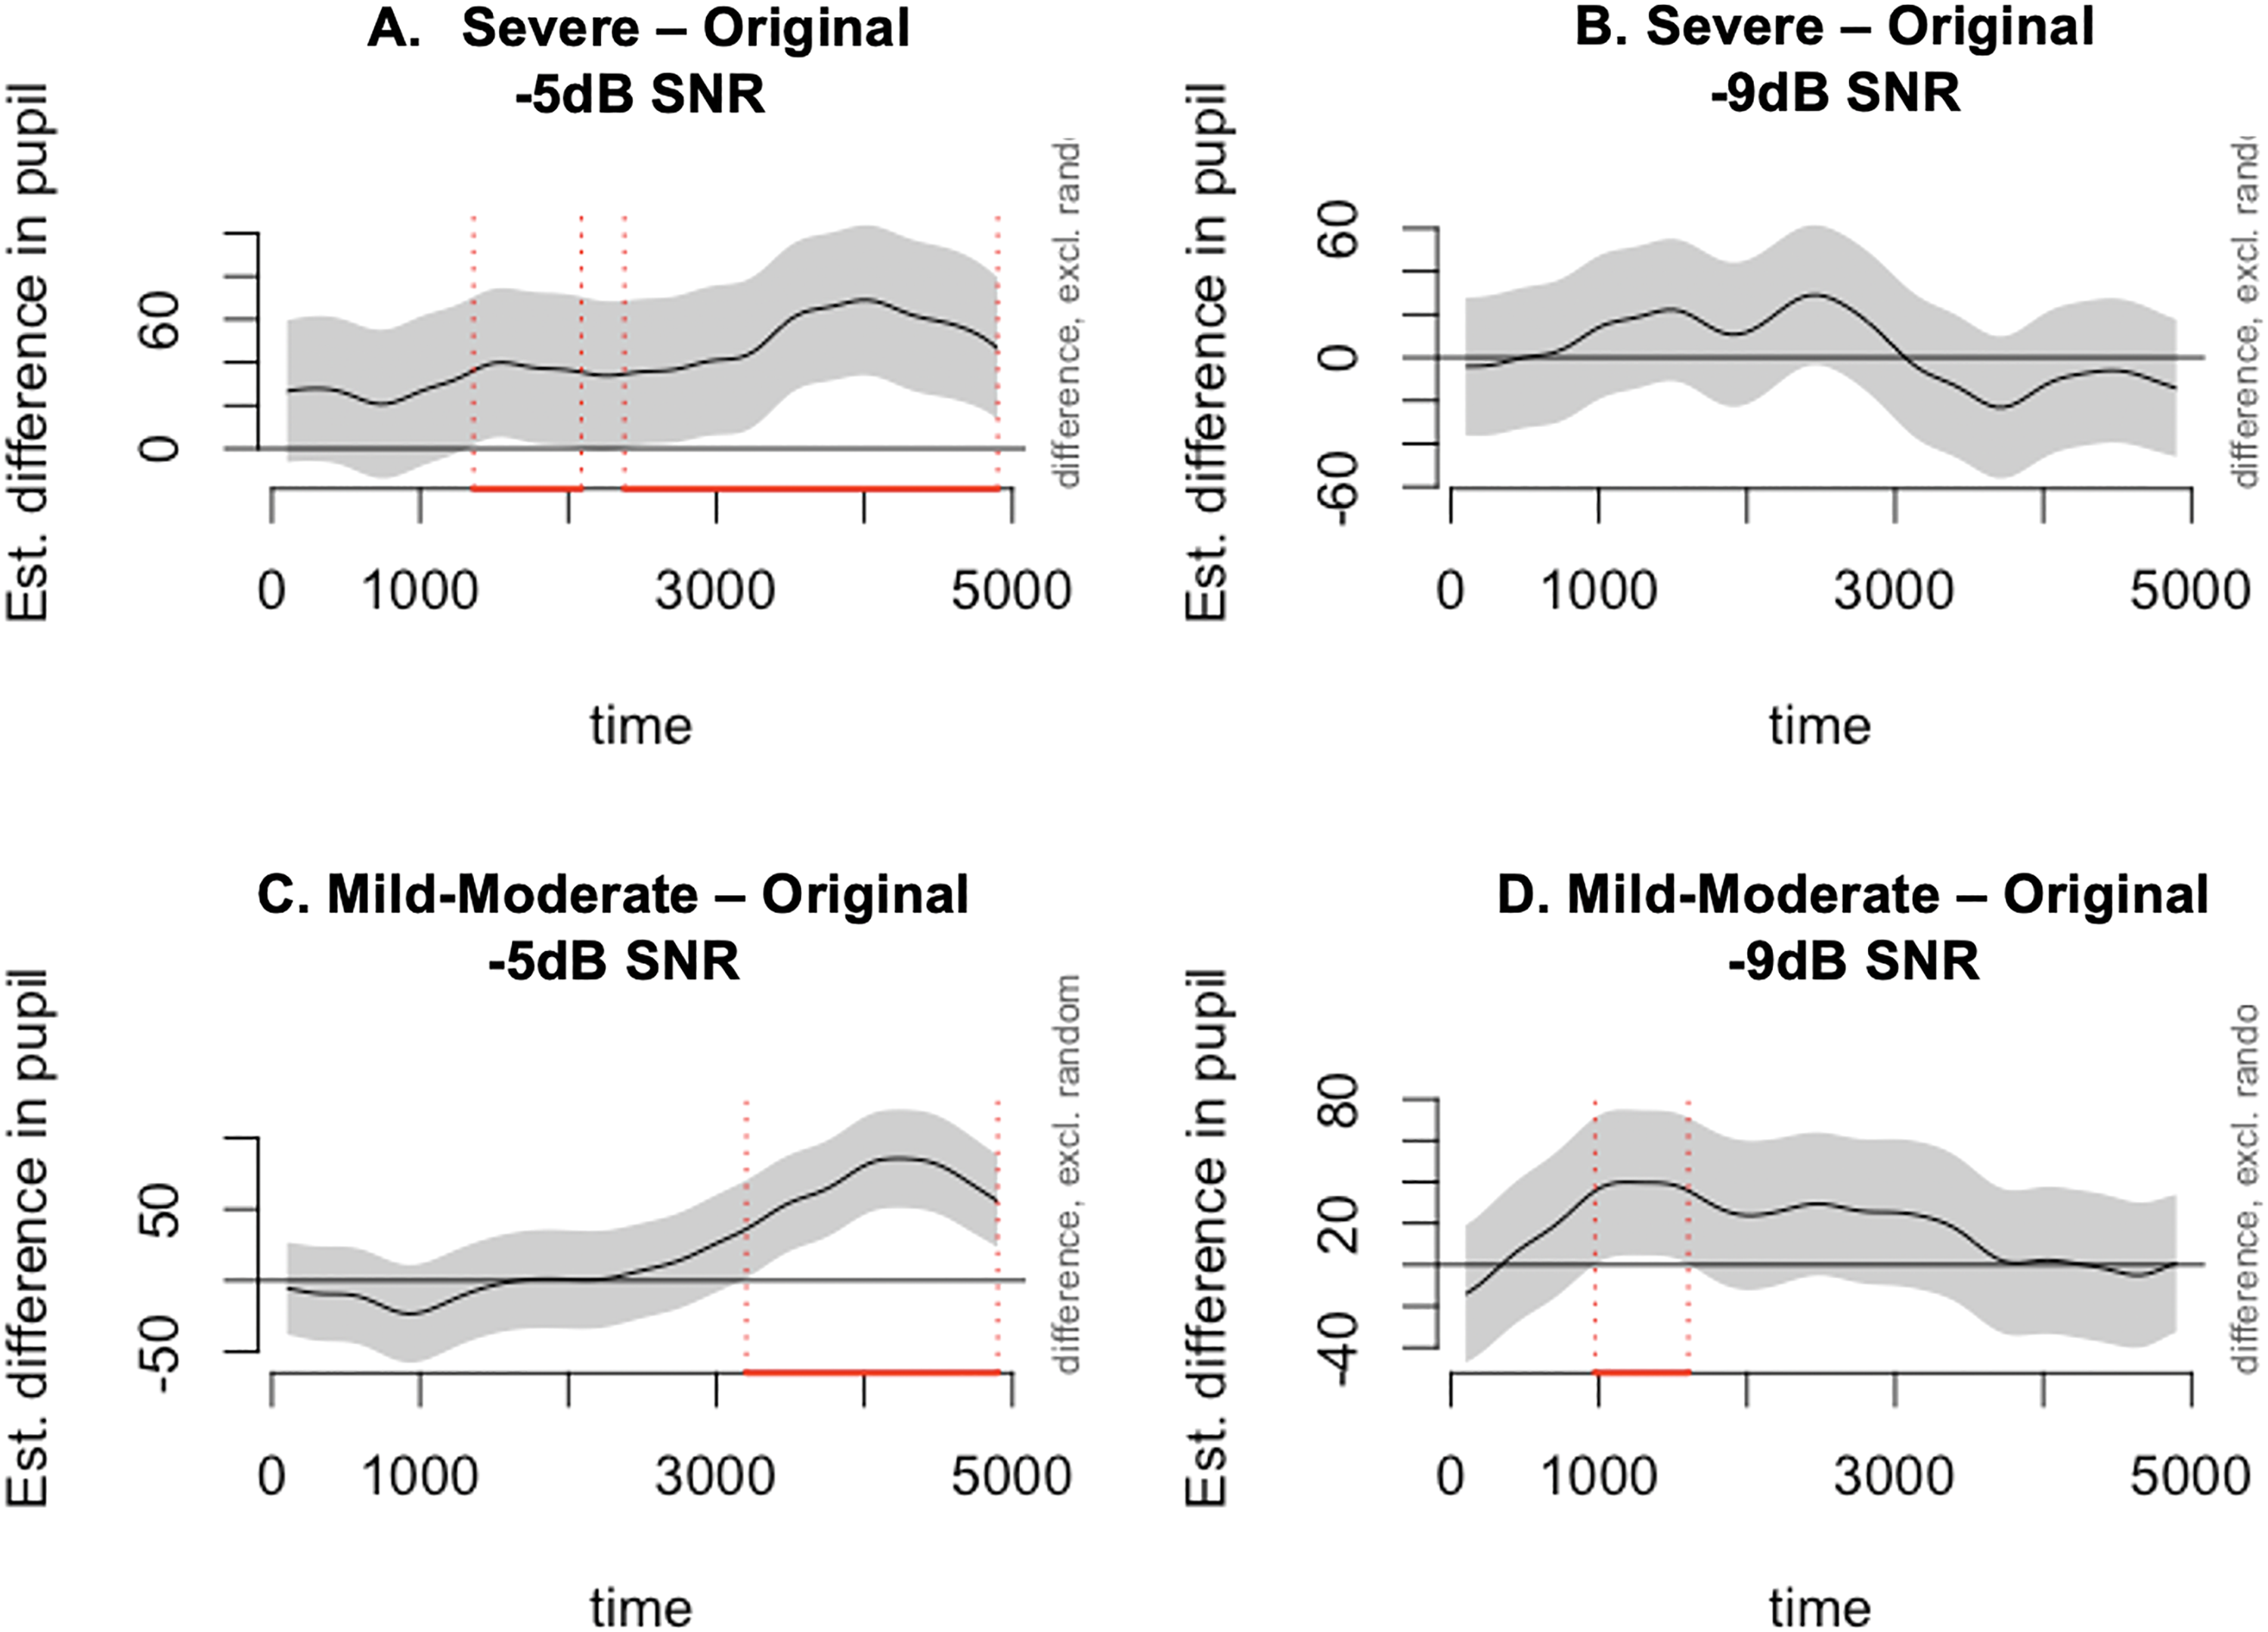
Difference plots from GAMM visualizing the differences between the two nonlinear smooths comparing the breathy and original conditions in the two SNR conditions. The pointwise 95% confidence interval of the differences between the two conditions in the plot title is shown by a shaded band. The red line on the x-axis and vertical dotted lines indicates the window when the shaded confidence band does not overlap with the x-axis (i.e., the value is significantly different from zero).
Results
The present study examined the effects of breathy voice quality and background noise level (i.e., SNR) on speech intelligibility and listening effort as measured by pupil dilation. It was hypothesized that breathiness would negatively affect speech intelligibility and listening effort, particularly in adverse noise conditions.
Regarding intelligibility data, model comparison results showed the factors of breathiness significantly improved the base model fit (lower AIC, higher log-likelihood, p value = .01), while the interaction between breathiness and SNR did not show any significant improvement over model 1 (Table 1).
Model Fit Comparison and p Values for the Effect of SNR and Breathiness on Intelligibility.

Abbreviations: AIC = Akaike information criterion; SNR = signal-to-noise ratio.
Moving forward and using the more parsimonious model (model 1) as our final model, we found that intelligibility was significantly lower in the severely breathy voice condition (β = −0.29, p = .02) but not in the mild-moderately breathy voice condition (β = 0.15, p = .23), as compared to the original voice condition. As expected, intelligibility was lower in the adverse noise condition (−9 dB SNR) than the more favorable one (−5 dB SNR) (β = −1.68, p =< .001). Model results are reported in Table 2.
Final Model for the Effect of SNR and Breathiness on Intelligibility.

Abbreviations: SD = standard deviation; SNR = signal-to-noise ratio; SE = standard error.
Final model equation: accuracy ∼ breathiness + noise + block + (1 | subject) + (1 | item).
We ran a series of GAMMs to examine the main effect of SNR on pupil size over time (model 0), the inclusion of both SNR and breathiness as main effects (model 1), and lastly examining interactions between SNR and breathiness (model 2). We found that the addition of breathiness into the base model decreased the AIC (AICdifference = 109.28) and increased the explained deviance of the model, however, the inclusion of the interaction did not substantially impact model fit. Therefore, we chose model 1 as our final model. Model comparisons and output are found in Table 3.
Summary of the Generalized Additive Mixed Models on Pupil Dilation Data.

Abbreviations: SE = standard error; SNR = signal-to-noise ratio.
We report parametric coefficients, effective degrees of freedom (Edf), reference degrees of freedom (Ref.df), F-values, and p values for the smooth terms and random effects. The values in bold reflect significance at least the p < .05 level.
The linear effects demonstrated that pupil dilation increased with a significantly steeper slope (and a higher magnitude at the end of the sentence) in the presence of adverse SNR (β = 53.26, p < .001). Additionally, pupil dilation increased with significantly steeper slopes for both mild-moderate breathiness (β = 12.16, p = .03) and severe breathiness (β = 29.95, p < .001) as compared to the original vocal quality condition. While able to give us an overall picture of the effect of breathiness and SNR on pupil size based on the linear effects, GAMM effect estimates are unable to describe precisely how pupil dilation changes over time as they do not include interactions from smooth terms. To do this, and to examine any nonlinear effects, we used difference plots to plot the model estimates of the difference in pupil size over time (smooth terms) between breathy and original conditions in the two SNR conditions (Figure 4). The solid lines in each difference plot show us the difference between the two nonlinear smoothed trajectories between breathiness conditions in each of the two SNR conditions, while the shaded areas represent the 95% confidence intervals. Figure 4 shows pupil dilation trajectories were different between the severely breathy and original voice conditions, and between the mild-moderately breathy condition and original voice condition during specific time windows as marked on the x-axis. While breathy conditions resulted in differences in dilation trajectory as compared to the original condition, the effects were only consistent and sustained in the more favorable SNR condition of −5 dB.
Discussion
The present study examined the effects of a breathy vocal quality with background noise on speech intelligibility and listening effort in a group of young adults with normal hearing thresholds. The results converged across both measures of intelligibility and effort, showing that speech perception becomes more challenging with increased breathiness and SNR. Specifically, the intelligibility and listening effort (as indicated by the magnitude of pupil dilation across conditions) demonstrated the significant and independent effects of breathiness and SNR. The time trajectory of pupil dilation provided preliminary evidence for an interaction between the two adverse conditions. This finding adds to the literature that demonstrates the combined effects of these adverse conditions and further sheds light on a few questions from the literature.
The Effect of Breathiness on Speech Intelligibility and Listening Effort in Noise
When vocal quality changes were combined with background noise, we found severe breathiness significantly lowered speech intelligibility. Listening effort as measured by the magnitude of pupil dilation (i.e., the linear term in GAMM) was significantly larger with severe and mild-moderate breathiness than with original vocal quality. This aligns with the previous finding showing the measure of breathiness was a major factor in modulating speech intelligibility when speech perception becomes challenging with dysphonic voice (Porcaro et al., 2020). Taken together with the null effect of breathiness on the intelligibility of synthesized words in quiet (Javkin et al., 1991), our results support the ELU model (Rönnberg et al., 2013) and suggest a strong involvement of cognitive processing during speech perception with multiple adverse conditions. Specifically, during speech perception under adverse conditions, the cognitive function of working memory is heavily taxed to cope with the acoustic degradation and to map the degraded signal to the lexicon. It appears the cognitive system can keep up with this process when a degraded vocal quality is presented without background noise (Javkin et al., 1991). With the challenge of noise, however, this process can lag with a substantial increase in task demand and a decrease in performance. As a result, the outcome measures of intelligibility and listening effort are affected.
In addition, it is worth noting that mild-moderate breathiness did not significantly affect intelligibility. This finding suggests the effect of breathiness on speech intelligibility is modulated by the severity of the deviation. Specifically, when breathiness was only mild to moderate, intelligibility was unaffected, similar to conditions where original voice quality was examined. Speech intelligibility was only impacted when the breathiness was increased to a severe level. This modulating factor of breathiness severity can also contribute to the discrepancy between studies regarding the impact of breathiness on speech intelligibility (e.g., Javkin et al., 1991; Thompson, 2011). As these studies have used different methods for generating stimuli, it is possible that the severity of breathiness was different across studies, leading to mixed results. While it is difficult to directly compare the stimuli across previous studies, future studies with multiple levels of voice change with quantified acoustic measures can further illuminate this issue.
The pupil dilation data suggested that breathiness regardless of severity had a significant impact on listening effort as measured by the magnitude of pupil dilation (i.e., the linear term in the pupil dilation analysis). This finding extended the evidence from intelligibility and showed the effect of mild-moderate breathiness on listening effort. From a methodology perspective, this result is consistent with previous studies using pupillometry to examine listening effort and speech intelligibility (e.g., Wendt et al., 2018; Winn et al., 2015) by demonstrating the sensitivity of pupillometry measure for effects that are not evident in intelligibility data.
Interaction Between Breathiness and SNR on Intelligibility
Concerning combined perceptual effects from multiple adverse conditions, the literature frequently suggests interactions between noise and other acoustic challenges when they happen simultaneously in the speech signal and affect speech perception (e.g., Ishikawa et al., 2017; Payton et al., 1994). For instance, while speech intelligibility was lower with dysphonic voice than typical voice, the effect of voice on intelligibility was stronger with more adverse SNR as compared to more favorable SNR or in quiet (Ishikawa et al., 2017). Following this rationale, it was predicted that the impact of breathiness on intelligibility should be stronger in the more adverse SNR condition. Our intelligibility data, however, showed a nonsignificant interaction between breathiness and noise. With a close examination of the data, the potential explanation for this result is the relatively low task demand with the stimuli set. First, while our 1% to 2% intelligibility change is consistent with previous data from Javkin et al. (1991), it is much smaller in size as compared to 5% to 20% intelligibility differences in Ishikawa et al. (2017). This means, that even with the most severe breathy voice condition (80%), the task demand was still low for this group of young listeners with normal hearing thresholds. With mild effect from breathiness, enough spare cognitive capacity is left to cope with the additional challenge of stronger noise without overtaxing the processing resource. Furthermore, the use of an ICRA 2-talker noise also likely contributed to this finding. Unlike the cafeteria noise used by Ishikawa et al. (2017), the noise we use in this study does not impose informational masking and is therefore less cognitively demanding.
Considering the challenges from breathiness and noise are both within the processing capacity of this cohort of young listeners with normal hearing, it was not surprising to observe the more adverse noise combined with more severe breathiness did not induce a stronger effect of breathiness. This account aligns with the theoretical framework of effortful listening (see Wingfield et al., 2015, p. 10) in showing that speech perception under combined adverse conditions can be either a resource-limited process or a data-limited process (Norman & Bobrow, 1975). In this effortful process, the interplay between cognitive resource and task demand determines eventual success in speech perception. When the task demand is within the limit of the processing resource, the process is resource-limited, and an increase in task demand does not necessarily lead to a detrimental effect on performance. When the task demand is higher than the available processing resource, the upper limit of the performance is bounded by the severity of degradation (i.e., available data), therefore showing a significant impact from combined adverse conditions. Built on this rationale, the results from this study can be described by a resource-limited process while several previous studies fit better into the data-limited process.
Listening Effort in Perception of Breathy Speech in Noise
Built on the literature showing the changes in listening effort under adverse conditions (e.g., Peelle, 2018; Rudner, 2016; Zekveld & Kramer, 2014), the second aim of the study was to test the hypothesis that the effect of a breathy vocal quality makes speech perception in noise more effortful, even when the intelligibility was only slightly affected. We measured listeners’ pupil dilation to indicate how effortful the task was and how it was modulated by the level of breathiness and noise. The results based on the linear differences in pupil dilation (i.e., the slope and magnitude of dilation) showed significant main effects of breathiness and SNR on listening effort. This finding first extends the intelligibility results in showing that mild-moderate breathiness increases listening effort, even when its effect on intelligibility was not significant. Regarding the interaction between breathiness and noise level, the results did not support an interactive effect on pupil dilation slope/magnitude. This means, that while breathy vocal quality and noise independently affect pupil dilation magnitude, the effect of breathiness on overall changes in the listening effort is not modulated by noise level. Following the resource-limited account (Norman & Bobrow, 1975), these findings support the rationale that listeners are able to maintain a consistent performance by managing effort spent on the task when the available resource is higher than the required effort.
To explore the nonlinear changes in pupillometry data, the smooth-term effects of breathiness on listening effort were visualized, separated by SNR (Figure 4). Specifically, the results from the generalized additive model indicate the changes in pupil dilation trajectories over time contained several time windows, during which local pupil dilation magnitude was significantly different between breathy conditions and original voice condition (as marked in Figure 4). It is interesting to observe these nonlinear effects were only consistent and sustained across multiple time windows in the more favorable SNR condition of −5 dB. There are two methodological issues that limit our ability to interpret these nonlinear effects of pupil dilation. First, while we chose GAMM instead of GCA to analyze pupil dilation data due to the major advantage of controlled autocorrelation (van Rij et al., 2019), GAMM does not provide estimates for those nonlinear interactions as GCA does (Ito & Knoeferle, 2022). Therefore, instead of model comparison and summary, the difference plots (i.e., Figure 4) were used to visualize the effects in the context of changes in effort over time. Second, as different sentences were used across conditions in the present study, it is possible that the linguistic differences may play a role in modulating the nonlinear effects of processing effort. Future research should use counterbalanced sentence sets across conditions to control for this confounding factor. As a result, the online effects that were visualized in Figure 4 should be taken as preliminary data that can potentially reveal interesting fine-grained online changes in listening effort, which could not be observed from the overall magnitude of pupil dilation. These online effects should be examined in future research using better-controlled stimuli and analysis that can test fine-grained time-varying changes.
Future Direction and Summary
Clinically, the findings from this study provide evidence demonstrating a critical issue in speech communication. As mentioned in the introduction, typical aging can result in significant changes to the vocal folds (Honjo & Isshiki, 1980; Linville et al., 1989; Mezzedimi et al., 2017), which can contribute to increased vocal breathiness (Södersten & Lindestad, 1990). From the psychoacoustic literature, we also know a breathy vocal quality can be particularly difficult for listeners with hearing loss due to weakened pitch strength (e.g., Leek & Summers, 2001). With the goal of examining the impact of age-related hearing loss on speech perception with a breathy vocal quality in background noise, the current study served as the first step in demonstrating the perceptual challenges from these sources of signal degradation.
In summary, the present study investigated the effects of breathiness and background noise on speech intelligibility and listening effort in young listeners with normal hearing. The results demonstrated that a breathy vocal quality presented in noise negatively affected speech intelligibility and listening effort. The effects of breathiness may be modulated by SNR in driving the changes in listening effort over time. This finding contributed to the literature by demonstrating the impact of vocal quality on speech perception in noise. Theoretically, it highlighted the complex dynamics between overall task demand and processing resources in understanding the combined impact of multiple adverse conditions. From a methodological perspective, the study demonstrated the sensitivity of pupillometry measures for examining fine-grained effects during speech perception, particularly with analysis techniques that can reveal linear and nonlinear changes in listening effort. Finally, the study provided the foundation for future work to examine the role of age-related hearing loss in the perception of speech with a breathy voice in a noisy environment.
Footnotes
Acknowledgments
The authors thank Mollee Feeney, Taylor Teal, and Laura Fitzgerald for assistance with data collection and processing, Katie Donocoff for help with stimuli creation, and Recai Yucel and Michael Johns for helpful discussions regarding data analysis. This work was supported by NIH Grant R21DC017560.
Declaration of Conflicting Interests
The author(s) declared no potential conflicts of interest with respect to the research, authorship, and/or publication of this article.
Funding
The author(s) disclosed receipt of the following financial support for the research, authorship, and/or publication of this article: This work was supported by the National Institute on Deafness and Other Communication Disorders (grant number R21DC017560).