
Abstract
Recently, it has been demonstrated that electromyographic (EMG) activity of auricular muscles in humans, especially the postauricular muscle (PAM), depends on the spatial location of auditory stimuli. This observation has only been shown using wet electrodes placed directly on auricular muscles. To move towards a more applied, out-of-the-laboratory setting, this study aims to investigate if similar results can be obtained using electrodes placed in custom-fitted earpieces. Furthermore, with the exception of the ground electrode, only dry-contact electrodes were used to record EMG signals, which require little to no skin preparation and can therefore be applied extremely fast. In two experiments, auditory stimuli were presented to ten participants from different spatial directions. In experiment 1, stimuli were rapid onset naturalistic stimuli presented in silence, and in experiment 2, the corresponding participant’s first name, presented in a “cocktail party” environment. In both experiments, ipsilateral responses were significantly larger than contralateral responses. Furthermore, machine learning models objectively decoded the direction of stimuli significantly above chance level on a single trial basis (PAM:
Keywords
Introduction
Recently, it has been demonstrated that electromyographic (EMG) signals of auricular muscles, in particular the postauricular muscle (PAM), can indicate the direction of auditory attention (Strauss et al., 2020), based on a vestigial pinna-orienting system in humans (Hackley, 2015). A particularly robust EMG response was reported by Strauss et al. (2020) when unexpected auditory stimuli with an abrupt onset were presented while the participant performed a nonlistening related task: Several auricular muscles, most notably the PAM, generated a transient EMG response which was significantly larger on the ipsilateral auricular muscle, that is, they indicated the (lateralized) direction of the stimulus. These responses were distinctly different from the often reported PAM response (PAMR), as their onset latency was
For many years, there has been an increased effort to develop recording systems that acquire signals from electrodes placed in or around the ear (Looney et al., 2011; Manabe et al., 2013; Hoon Lee et al., 2014; Norton et al., 2015; Debener et al., 2015; Pham et al., 2019; Valentin et al., 2021). These systems are mainly used to record electroencephalographic (EEG) signals and, when used with conductive gel, can achieve similar results as regular EEG recordings from the scalp (Kidmose et al., 2012). Similarly, in-ear electrode systems can be used to directly estimate the eye gaze direction (Favre-Felix et al., 2017). When considering the acquisition and analysis of EMG signals using these systems, it is often in the context of artifacts that need to be removed (Kappel et al., 2017), seizure detection (Zibrandtsen et al., 2018), or sleep disorders (Tabar et al., 2020). In any of these cases, the EMG signals in question originated from muscles rather far away from the ear, such as the jaw muscles, while the specific investigation of auricular muscles using in-ear recording system has been widely unexplored.
An important direction of the research and development of in-ear recording systems is the decoding of auditory attention (by EEG or eye gaze), and integrating this information into hearing aid systems (Fiedler et al., 2017; Bleichner et al., 2016; Favre-Félix et al., 2019; Dasenbrock et al., 2021).
The possible synergy between these recording systems, which are extremely close, if not directly on top of the auricular muscles, and research into EMG responses of auricular muscles is apparent. A key requirement for using electrode recording systems in a real-life, out-of-the-laboratory setting, is their ease of use and fast application. Systems that require careful skin preparation and conductive electrolyte gel to decrease electrode skin impedance to an acceptable level usually require an additional person to apply the electrodes, and furthermore suffer from impedance drifts over time due to drying of the electrolyte gel. Due to these factors, specialized dry-contact electrodes with custom fitted earpieces are an important step towards an applied setting (Kappel & Kidmose, 2018). Dry-contact electrodes naturally have larger impedances than wet electrodes, for example, two orders of magnitude larger (Kappel et al., 2019), which would correspond to an impedance change from 5 k
This article aims to assess whether we can record transient EMG responses from auricular muscles in response to transient auditory stimuli (stimuli with a short, abrupt onset), using dry-contact electrodes placed in the ear (ear-canal and concha) using customized earpieces, as well as on the PAM directly. This assessment will first be performed using naturalistic stimuli in silence, mostly reproducing the exogenous attention paradigm described by Strauss et al. (2020). Then, we will move towards a more applied, ecologically valid setting, by using the participant’s first names as stimuli, while participants are instructed to attend several audio streams in a noisy environment (a so-called “cocktail party” environment). Furthermore, the feasibility of decoding the direction of these stimuli based on the recorded responses will be investigated. Lastly, analyzing different in-ear electrode pairs will be important. Since none of them are placed directly on top of an auricular muscle, we have no a-priori knowledge about which electrode references are most suitable. However, we can validate these against results obtained from electrodes placed directly on the PAM.
Methods and Materials
Participants
Eleven normal-hearing participants were initially recruited, however, one participant was excluded due to a recording device malfunction. Ten participants were therefore included in the analysis (four females, six males,
Stimuli and Tasks
Participants were seated in a chair with their heads placed on a chin rest to reduce head movements during the experiments. Seven active loudspeakers (KH120A, Neumann, Germany) were placed 1 m away from the participant’s head, at head level, in a circle at 0∘ (in front of the participant), ±45∘, ±90∘, and ±120∘, where negative angles refer to the left of the participant. In order to reduce sound reflections, curtains made out of heavy stage molton (900 gm−2) were used to form a
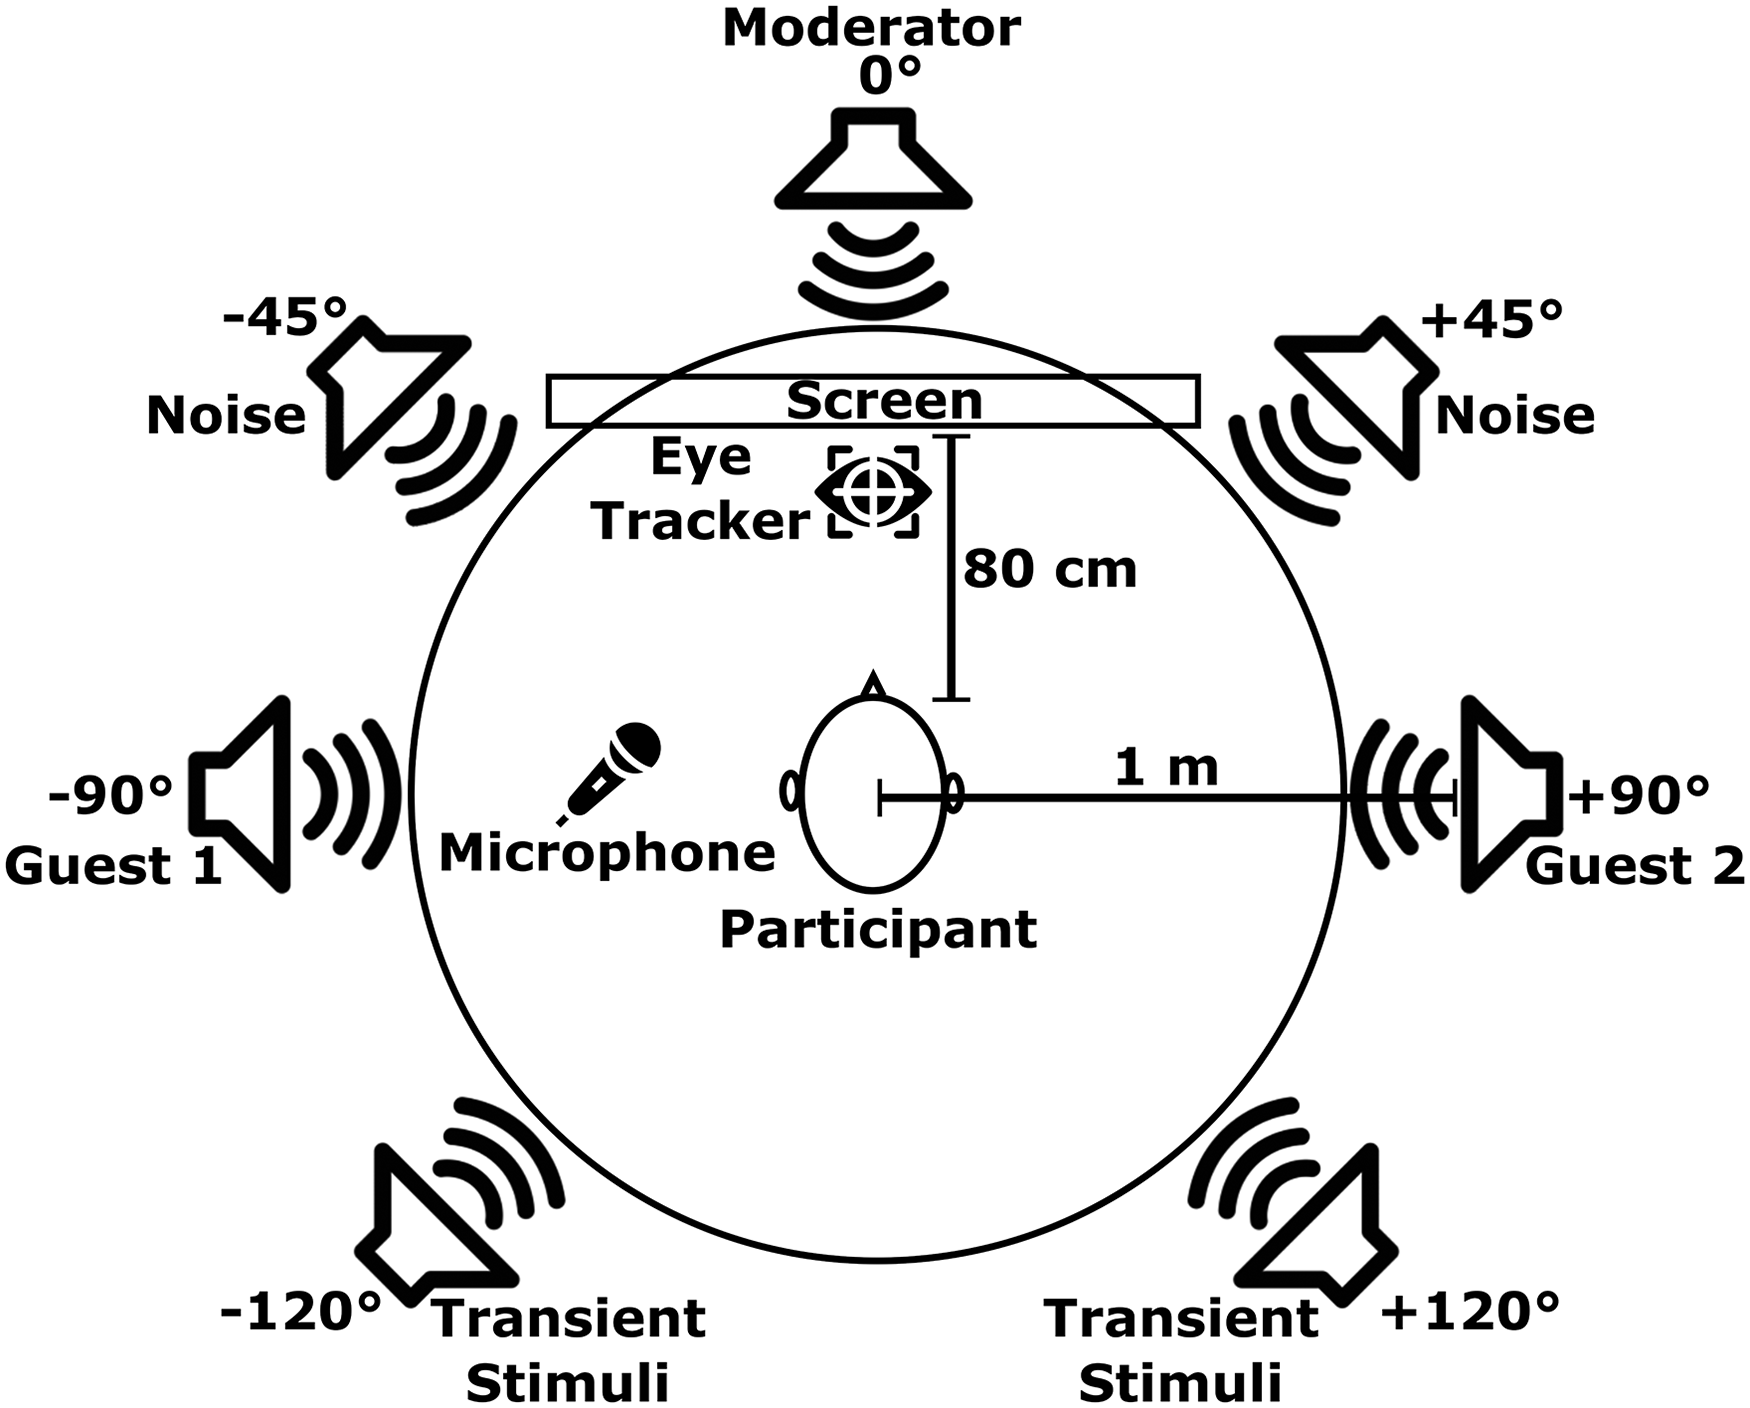
General setup of the experiment. Seven active loudspeakers were placed in a circle around the participant, where one was hidden behind a screen.
Loudspeakers and auditory stimuli were calibrated using a Brüel & Kjær Type 2250 Sound Level Meter. A dedicated stimulation PC controlled both, the screen, as well as the loudspeakers and microphone via an external USB sound interface (Scarlett 18i20, Focusrite, UK), which was operating at 44.1 kHz. Two main experiments were conducted, and the presentation order was balanced across participants.
Experiment 1
This experiment was following the protocol of the exogenous attention experiment by Strauss et al. (2020), that is, automatic, stimulus-driven attention to novel sounds in a silent environment. Because we used a mostly dry-contact in-ear system, it is important to use a paradigm that has been validated using “gold standard” wet electrodes and electrode positions. Furthermore, results will be compared to the second experiment in this study, where participants were instructed to attend participant specific transient stimuli, instead of ignoring them, in addition to attending audio streams in a noisy environment.
Participants were instructed to carefully read an unengaging text displayed on the screen in front of them at their own pace so they would be able to answer questions about its content afterwards, while ignoring randomly occurring novel, naturalistic transient auditory stimuli. A brief description of these transients can be found in the supplementary material (Supplemental Table 1). These stimuli were presented with an average interstimulus interval of 17.5 s (a random jitter of up to
The duration of this experiment was
The main differences from this experiment to the exogenous attention experiment by Strauss et al. (2020) are that we (a) substantially increased the number of trials (from 9 to 30 per loudspeaker), (b) only utilized loudspeakers from behind the participant (as they generated significantly larger responses compared front loudspeakers), and (c) manipulated the auditory stimuli waveforms to have very sharp and uniform onsets. Summarizing, we reduced the stimulus onset variability, increased the number of trials, and focused on the back loudspeakers. This was done in anticipation of the lower signal quality achieved by the dry-contact electrodes, as well as the fact that the in-ear electrodes are considerably farther away from the PAM.
Experiment 2
The goal of the second experiment was to examine transient responses of auricular muscles in a more realistic, ecologically valid setting. To achieve this, two main changes were introduced. For the first change, instead of using generic, naturalistic transient stimuli, we used the corresponding participant’s first name, which is expected to be a highly salient keyword. The second change was, instead of performing the experiment in silence (while reading a text), the experiment was conducted in a noisy, more realistic “cocktail party” environment.
Participants were instructed to listen to a
The radio host was always presented from the frontal loudspeaker (placed at 0∘, behind the screen). For six participants, the male guest was presented from the right (+90∘) loudspeaker and the female guest from the left (−90∘) one. The placement of the guests was reversed for the remaining four included participants. Continuous cafeteria noise was presented from the loudspeakers placed at ±45∘ to increase the listening effort required to attend the podcast.
At several predetermined points during the podcast, a fourth speaker (female voice) would directly address the participant by their first name and ask a question relating to the podcast. In order to ensure that participants paid attention to the podcast and the respective questions, they were instructed to give brief answers to each question during the experiment.
Because talking creates large EMG artifacts, a microphone recorded the participants’ answers during this experiment, which was used to identify and remove these artifacts in the offline data processing stage. The questions were always presented from one of the loudspeakers behind the participants (
A total of 31 questions were directed at the participants, evenly balanced from the back left or right loudspeaker (15/16). Ten of these questions were presented when the host was active, and 10/11 when either one of the guests were speaking. Note that since the direction of the guests alternated between participants, so did the direction of the questions.
Audio playback and simultaneous recording of the microphone input was performed using a DAW software (StudioOne 2, Presonus Audio Electronics, Inc., USA). The questions, including the personalized first names of the participants, were created using speech synthesis software (Navigation Speech Tool, paragon semvox GmbH, Germany). Stimulus intensities are listed in Table 1. Note that the host loudspeaker was hidden behind a screen (0∘), hence the increased intensity. The SNR was decreased in the second session because participants reported that it was too easy to follow the podcasts, and especially the guests, during the experiment.
Stimulus Intensities During Experiment 2.

Values in parentheses indicate changes with reference to the first session.
Data Acquisition
Data were recorded using two independent systems:
A wireless biopotential amplifier (Mobita, TMSi, The Netherlands) was used to acquire signals from electrodes placed in the participant’s ears (via custom-made earpieces), as well as from the left and right PAMs. Each earpiece contained a total of six electrodes. Two electrodes were additionally placed on each PAM and one common ground electrode at the upper forehead (Fpz). A picture of an inserted earpiece and attached PAM electrodes is displayed in Figure 2. The Mobita system sampled data at 2 kHz and used the average of all connected channels as a common reference (i.e., the average of up to 16 channels, The second system consisted of a biosignal amplifier (g.USBamp, g.tec, Austria) and an eye tracker (EyeLink 1000 Plus, SR Research Ltd, Canada). This amplifier recorded a variety of electrophysiological and other biosignals which were not included in the current analysis. However, data from the eye tracker (sampling at 500 Hz and up-sampled to 4.8 kHz) and g.USBamp were integrated, synchronized and recorded by a common Simulink model (The MathWorks, Inc, USA) operating at 4.8 kHz. This system was controlled by two linked, dedicated PCs.
Both recording systems received identical physical trigger signals from a trigger box (g.Trigbox, g.tec, Austria), which relays rectangular pulses send by the external USB audio interface (which simultaneously sends the audio stimuli to the loudspeakers) to both amplifiers, to mark important events during the experiment as well as to synchronize data from the Mobita amplifier (recording in-ear and PAM data) to the eye tracker during offline processing. A flow diagram of both recording systems is displayed in Supplemental Figure 1.

Top: Electrodes attached to the postauricular muscle (PAM), as well as an inserted earpiece including the electrodes. Bottom: Close-up of an earpiece with inserted electrodes. Two electrodes are located at the upper part of the concha, while the other electrodes are placed inside the ear canal or at the tragus/anti-tragus.
Signal Processing
Offline signal processing and statistical analyses were performed using custom written scripts in Matlab 2020a (The MathWorks, Inc, USA), Python 3.10.10, and IBM SPSS Statistics 28 (IBM Corp, USA).
General Procedure
Because signals from the Mobita system were recorded against an averaged reference, the first step was to re-reference them. Bipolar EMG signals from the left and right PAM, as well as all possible unilateral combinations of electrodes within an earpiece, were calculated. Because we had no prior knowledge about the best in-ear reference, and because the signal quality of the same electrode position can vary between participants, we defined best electrode pairs for every participant and experiment, similar to Ala et al. (2023). The metric for the current study was the largest normalized amplitude in the corresponding averaged ipsilateral waveform, and will be referred to as best in-ear references throughout the article.
Re-referenced signals were zero-phase filtered using a fourth-order Butterworth bandpass filter (10–900 Hz) and a 50 Hz IIR comb filter. Next, RMS envelopes with a sliding window of a length equivalent to 25 ms were calculated. Specifically, we used Matlab’s filtfilt(), butter(), iircomb(), and envelope() functions with default parameters, if not mentioned otherwise.
Horizontal and vertical eye tracker data were converted from pixel positions to visual angle (in degrees of arc). Missing segments in the eye tracker data (due to eye blinks) were linearly interpolated.
Single trials were then extracted from EMG and eye tracker data using the recorded trigger signal. For experiment 1, the onset of every transient auditory stimulus served as a reference point, while for experiment 2, the onsets of the individual names were used to extract trials (onset in this context is defined as the first nonzero sample of the audio file of the corresponding transient/name). Trials were extracted from 3 s prior to onset (baseline) to 3 s after onset (response). Single trials of EMG signals were then normalized, similar to the procedure described by Strauss et al. (2020), by first subtracting the averaged baseline value, and then dividing by the largest absolute value of the corresponding trial. This effectively removes any (absolute) amplitude information and emphasizes therefore the shape of the waveform. Single trials are, after normalization, theoretically in the range from
Artifact Rejection
General Procedure
The impedance of dry-contact electrodes can increase significantly during the measurement (e.g., movements of the participant could make electrodes lose contact with the skin), thus making the signal go out of range of the Mobita system. In this case, the device automatically replaces the channel values with a large, coded value (
Therefore, if a channel was out of range for more than 5%, the complete channel was discarded from further analysis of the corresponding experiment. While 5% may seem low to remove the complete channel, we were concerned with the possibility that considerable parts of that channel may be just barely below the Mobita’s threshold and could, therefore, have a very low signal quality.
If less than 5% (and more than 0%, indicating a low signal quality) were rejected by the Mobita amplifier, the signal was linearly detrended, and samples that reached this value, as well as all samples that were outside of
Experiment 2
During experiment 2, participants were instructed to talk briefly in order to answer questions directed at them, leading to large EMG or movement-related artifacts. To remove these segments, the recorded microphone input of every participant was manually checked and a new trigger signal was generated, marking whenever a participant started and stopped talking.
This new trigger signal (microphone trigger), as well as the audio file of the trigger signal for the experiment (audio trigger), were imported into Matlab and downsampled to the same sampling rate as the Mobita amplifier or eye tracker (44.1 kHz to 2 kHz or 4.8 kHz, respectively). The downsampled audio trigger was then used to synchronize the recorded (EMG or eye tracker) data with the microphone trigger. All segments from 1 s before a participant started talking, to 5 s after a participant stopped talking were then flagged and removed from further analysis.
Overall, for experiment 1, 5% of all single trials recorded at the left, and 0% of all trials recorded at the right PAM were completely rejected. Regarding best in-ear references, 0% of the left, and 0.7% of the right trials were rejected (best was defined as generating the largest normalized amplitude for each participant and session). For experiment 2, due to the aforementioned procedure, the last part of the extracted trials are flagged as artifacts up to
Machine Learning-Based Classification of Stimulus Direction
To assess whether we can objectively decode the direction of transient stimuli and individual names based on single trials recorded at the PAM or in-ear electrodes, we trained binary machine learning models on the data obtained from both experiments.
Feature Extraction
Bandpass and notch filtered trials prior to calculating the RMS envelope (i.e., oscillatory data) were used for feature extraction. Each trial was decomposed into five frequency subbands from 15.6 to 500 Hz, using a nonsubsampled octave filter bank. Specifically, we used Matlab’s modwt and modwtmra functions, which implement a zero-phase, wavelet-based filter bank. The zero-phase property is especially important in order to keep the transient response fixed in time across frequency bands.
Next, for each subband, we calculated the RMS-envelopes with a length equivalent to 75 ms to obtain smoothed subband-envelopes. Then, we defined a baseline timeframe as
Machine Learning Model
We utilized a bootstrap aggregated ensemble classifier with 100 weak decision trees, which was trained using features either from the left and right PAM, or (best) left and right in-ear references, which means 10 features were used to train the model (five from the right and five from the left channel). Specifically, we used the BaggingClassifier from scikit-learn 1.2.0 using Python 3.10.10, but did not tune hyperparameters in order to avoid overfitting to the current dataset.
If the number of training data was not balanced (e.g., due to rejected/out-of-range channels or trials), training weights were adjusted to give a higher weight to the less represented class. Furthermore, because we observed that training the model on the same data repeatedly gave slightly different results due to training parameter initialization, we repeatedly trained each model and performed classification to obtain an averaged score. In addition to that, in order to perform approximate permutation tests to obtain data-driven, critical thresholds for significant classification scores (Combrisson & Jerbi, 2015) we decided to train models with randomly permuted labels. Every model was trained 430,000 times using the true labels, and with 430,000 randomly permuted labels. The approximate permutation test is based on the null hypothesis that the stimulus direction does not affect the recorded data, which would mean that the associated labels are arbitrary, and therefore exchangeable (Nichols & Holmes, 2002).
All models were trained using a leave-one-subject-out (LOSO) cross validation scheme, that is, one classifier was trained per participant (and experiment) using only data from the other, remaining participants, to prevent overfitting to individual participants and to find generalized models. On average, for experiment 1, classifiers were trained with 1,053 observations, while classifiers using data from experiment 2 were trained with 514 observations. Classification was performed on average with 117 or 59 observations, depending on the experiment. A detailed breakdown of the number of observations per participant can be found in Supplemental Table 2.
Summarizing, we trained ensemble classifiers to decode the direction of the transient auditory stimuli (experiment 1) and individual participant’s names (experiment 2). Classifiers were trained separately for every participant, using only training data from the other participants (LOSO cross-validation). Features were extracted either from both PAM muscles or from the in-ear electrode references.
Results
The “Results” section will focus on three main parts. The first part will present results based on the averaged responses, which will begin with general observations and descriptive statistics. Then, statistical inferences will be performed using repeated measures analysis of variances (ANOVAs). Several factors will be analyzed: lateralization (ipsi- or contralateral), electrode reference (PAM or in-ear), session effect (repetition of the experiment after a few weeks), and experiment. Furthermore, a summary of which in-ear electrodes were found to be the “best reference,” as mentioned in the “Methods and Materials” section, will be included.
The second part will present the results of the machine learning approach. Comparisons against chance levels will be performed using the binomial cumulative distribution (BCD), as well as approximate permutation tests (Combrisson & Jerbi, 2015). Comparisons between different factors (experiment, reference, and session), will be done using a repeated measures ANOVA.
In the third part, we will present results obtained from the eye tracker, aimed to rule out the possibility of the oculo-auricular phenomenon being the cause for the recorded responses.
Response Analysis
A visual overview of the averaged response waveforms of experiment 1 is displayed in Figure 3, which was generated using data from all included participants and both sessions. The top left plot displays the averaged ipsilateral responses of the PAM, as well as the in-ear references. The top right plot shows the corresponding contralateral responses. The grand averaged ipsilateral PAM response peaks slightly later (102 ms, compared to 96 ms), but has a higher normalized amplitude (0.28, compared to 0.23) than the grand averaged response from the in-ear references. The contralateral PAM response displays a considerably lower, almost nonexistent response (peaks at 123 ms at 0.07). The small peak before the major transient response, at

Grand averaged data of experiment 1. Top: Plots show the grand averaged waveform of the ipsilateral and contralateral responses. All participants and sessions were included. Bottom: Each line corresponds to the averaged response for one participant (both sessions included). Amplitude is encoded in color. Data labeled in-ear refer to individual best references of the in-ear electrodes. The red arrow indicates a possible postauricular muscle response (PAMR) from participant 5. Supplemental Figure 3 provides averaged waveforms split into left/right ear data, as well as first and second sessions. Supplemental Figures 4 and 5 also show data for each participant and session.
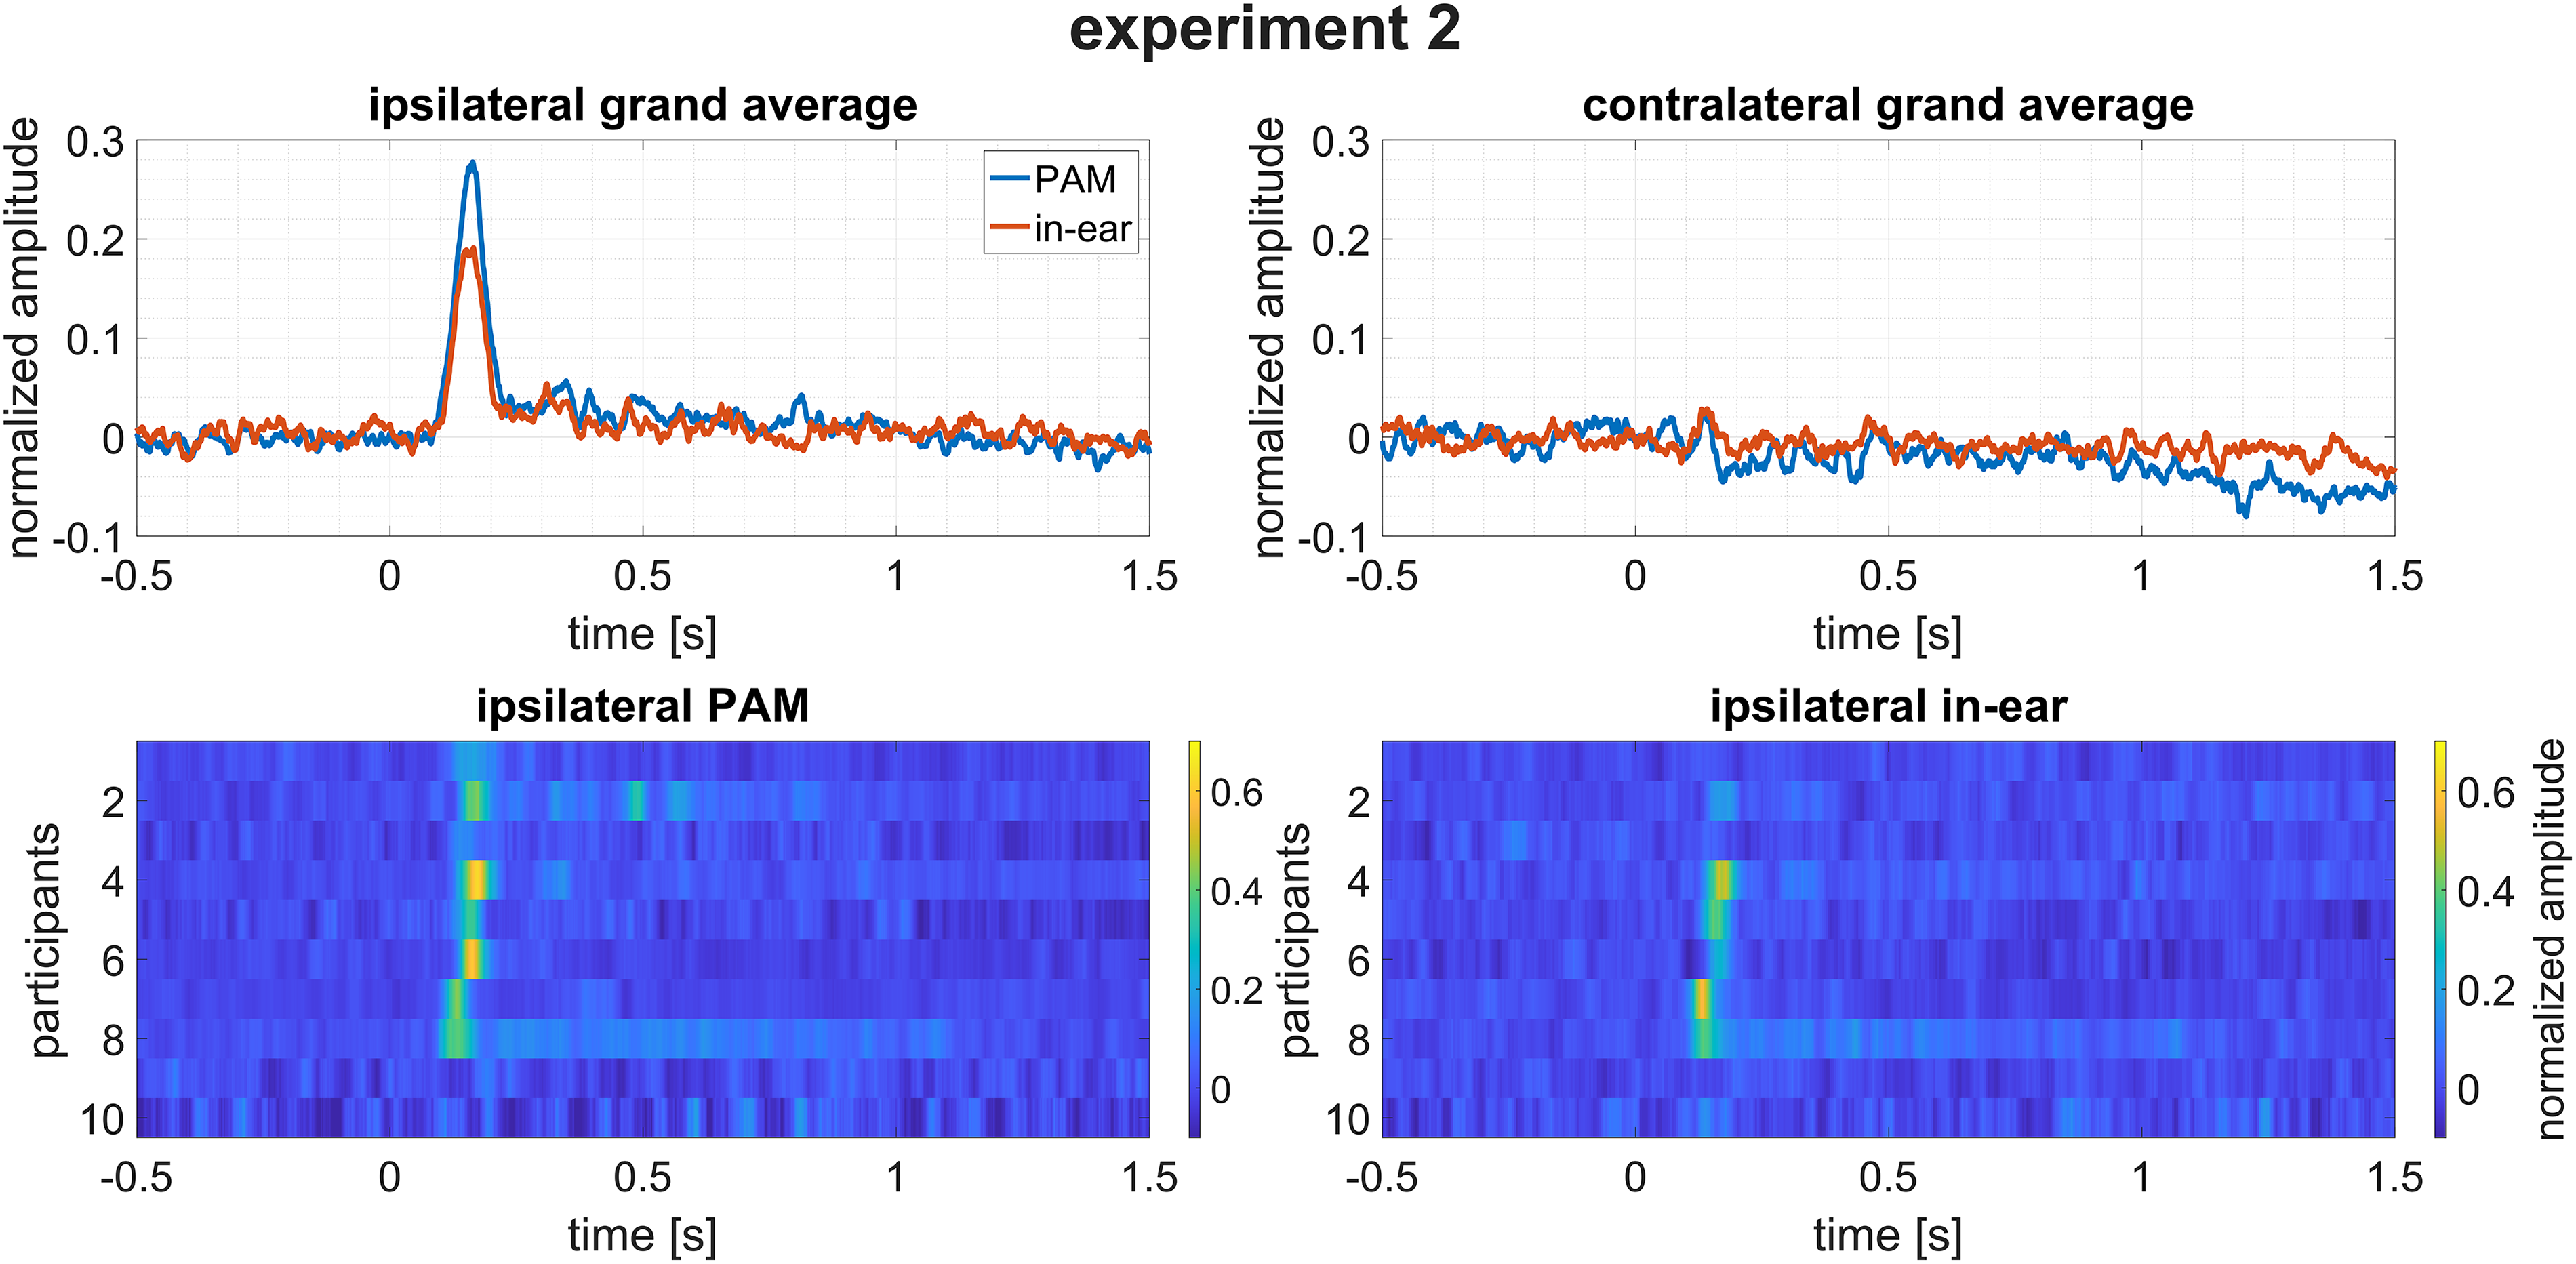
Grand averaged data of experiment 2. Top: Plots show the grand averaged waveform of the ipsilateral and contralateral responses. All participants and sessions were included. Bottom: Each line corresponds to the averaged response for one participant (both sessions included). Amplitude is encoded in color. Data labeled in-ear refer to individual best references of the in-ear electrodes. Supplemental Figure 6 provides averaged waveforms split into left/right ear data, as well as first and second sessions. Supplemental Figures 7 and 8 also show data for each participant and session.

Overview of the normalized amplitude values for both experiments and references, including significant effects and pairwise comparisons from a repeated measures ANOVA. Included factors were: lateralization (ipsi- or contralateral: Lat.), reference (PAM or in-ear: Ref.), and session. Black dots indicate the arithmetic means. Note that for experiment 1, values were calculated by averaging in the timeframe from 50 to 200 ms, and for experiment 2 from 50 to 300 ms. Abbreviations: ANOVA = analysis of variance; PAM = postauricular muscle.
For experiment 2, Figure 4 is the corresponding grand average, that is, all participants and sessions are included, with Supplemental Figure 2 also showing the corresponding contralateral matrix plots. Grand averaged ipsilateral PAM and in-ear waveforms peak almost at the same time (164 and 165 ms), but display a larger amplitude difference than the data from experiment 1 (0.28 and 0.19). Supplementary Figures 6 to 8 split these data further into left/right and per participant and session.
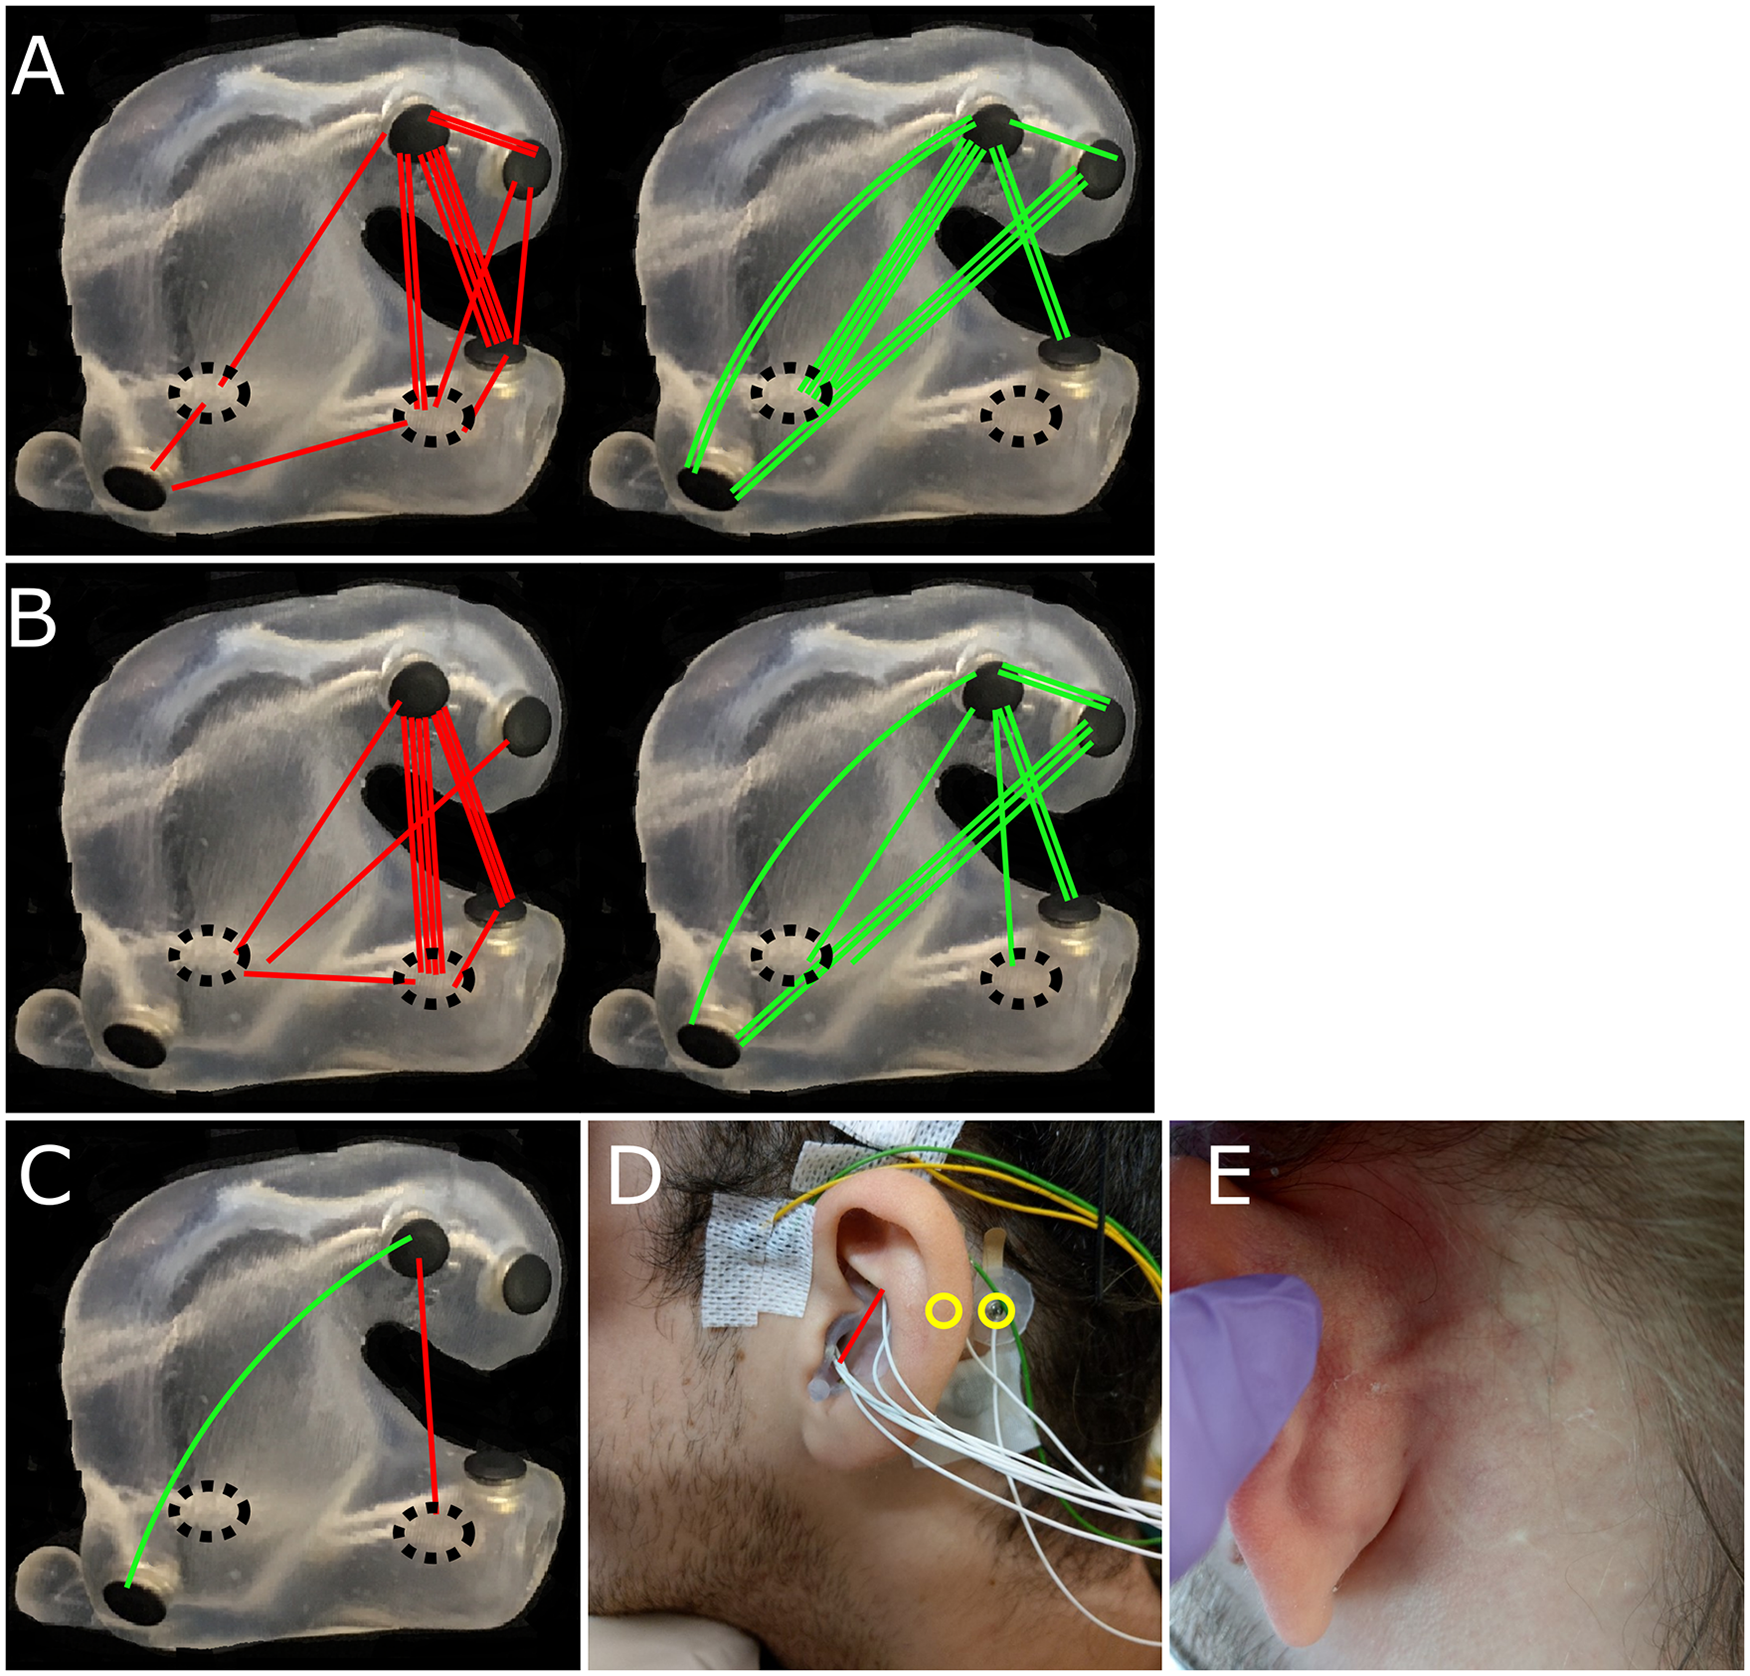
Summary and visualization of the best in-ear references across all participants and sessions. Best references are determined by the largest normalized amplitude in the participant specific averages. Red lines indicate data from the right, green from the left ear. Dotted circles mark electrodes on the other side of the earpiece. (A) Each line represents the best reference from experiment 1. (B) Each line represents the best reference from experiment 2. (C) Best overall references, obtained from the grand average. This was identical for both experiments. Most best references are achieved by electrodes placed in the upper part of the concha referenced against those placed at the tragus/anti-tragus or in the ear canal. (D) Best reference position (red line) and positions of the postauricular muscle (PAM) electrodes (yellow circles). (E) Picture of the PAM for reference.
Considering the ipsilateral matrix plots for either experiment, it appears that participants with a large PAM response generally also have a large response recorded with in-ear electrode references. In fact, Pearson correlation coefficients between averaged PAM and in-ear amplitudes are significantly positive for both experiments (experiment 1:
In order to objectively compare ipsilateral to contralateral responses, we calculated the mean values of the participant-specific averages in the timeframe from 50 to 200 ms of experiment 1, and 50 to 300 ms of experiment 2. These different timeframes are justified by the different peak latencies in the grand averaged waveforms, which is as least partially due to the different stimuli used in both experiments. In experiment 1, stimuli had a very sharp and uniform onset. In experiment 2, however, stimuli had a slower and participant specific onset, as they were the participant’s first names (see Supplemental Figure 11 for a comparison of onset latencies).
Statistical inference was first performed using repeated measures ANOVAs with three factors. In addition to the main factor of interest, lateralization (ipsi- or contralateral response), we included the reference (PAM or in-ear), and session (first or second). Due to the different timeframes used for calculating the averages, repeated measures ANOVAs were performed separately for each experiment at this stage.
For experiment 1, no significant interaction effects were observed. Considering lateralization, a significant main effect was observed (
For experiment 2, we did observe a statistically significant interaction between lateralization and reference (
In order to compare results between experiments, we extracted normalized peak values based on the averaged ipsilateral waveforms of every participant and session of the PAM reference. Boxplots displaying this data, collapsed across sessions, are available in Supplemental Figure 13. We analyzed these peak values using a repeated measures ANOVA (two factors: experiment and session). There was a significant interaction effect between experiment and session (
As mentioned previously in the “Methods and Materials” section, we identified the best in-ear references on an individual basis, based on averaged waveforms. An overview these results is presented in Figure 6. In Figure 6A, each line corresponds to the best reference of one participant/session from experiment 1. Red lines refer to the right earpiece and green to the left one. Figure 6B is the corresponding plot of experiment 2, while Figure 6C shows the best overall reference for all participants, which were the same for both experiments. Most best references require one electrode in the upper part of the concha, referenced to electrodes in the ear canal or tragus/anti-tragus.
Machine Learning-Based Classification of Stimulus Direction
General classification results of the LOSO cross-validation scheme are displayed in Figure 7. Table 2 shows essentially the same data, but splits the results further into first and second sessions. Additionally, the table contains critical values for significant classification thresholds based on the BCD, as well as an empirical distribution generated by approximate permutation tests (Nichols & Holmes, 2002; Combrisson & Jerbi, 2015). All averaged classification scores are above the critical thresholds for

Grand average results of the classifiers when data were collapsed to one per participant. The black dots indicate the arithmetic means.
Averaged results and standard deviations of the classifiers.

Note that due to missing values the overall correct value is not necessarily the mean of the first and second sessions. Critical values were calculated by the BCD using the appropriate number of observations (60 and 31). Critical values in parentheses were obtained by calculating the corresponding percentile of the empirical distribution generated by approximate permutation tests using randomly permuted training labels.
Abbreviations: BCD = binomial cumulative distribution; PAM = postauricular muscle.
In order to compare classification scores against each other (not against chance), we ran a repeated measures ANOVA with three factors: experiment, reference, and session. No significant interaction effects were observed. Furthermore, neither experiment, nor session displayed a significant main effect. The only significant main effect was reference, (
Lastly, we calculated Pearson correlation coefficients between both sessions for every experiment and reference, to check for test–retest reliability. For experiment 1, results from the PAM were not significantly correlated (
Potential Motor Confounds
Figure 8 shows detected macrosaccades from experiment 1, usually elicited while jumping to the next line during the reading task, as well as time-resolved histograms. While the number of macrosaccades is quite large (due to the nature of the task during the experiment), there is no apparent increase directly after stimulus onset that could be attributed to the recorded transient EMG responses. Supplemental Figure 18 expands on this, showing detected macrosaccades for every single trial of all participants and sessions. Even on a trial-by-trial basis, no systematic increase after stimulus onset from either direction can be observed. The horizontal gaze direction is shown either as a grand, or participant and session specific average in Supplemental Figure 19. No transient horizontal eye deflections can be observed that would correlate with the recorded EMG responses. Figure 9 and Supplemental Figures 20 and 21 are the corresponding results of experiment 2. Note that due to the task, attending an auditory stream while looking at a fixation cross, the macrosaccades occur only very sparsely. However, like in the plots from experiment 1, no increases in either macrosaccades or gaze direction can be observed after stimulus onset. Overall, there is no indication that there were systematic macrosaccadic eye movements or eye deflections after stimulus onset that would suggest the presence of the oculo-auricular phenomenon.
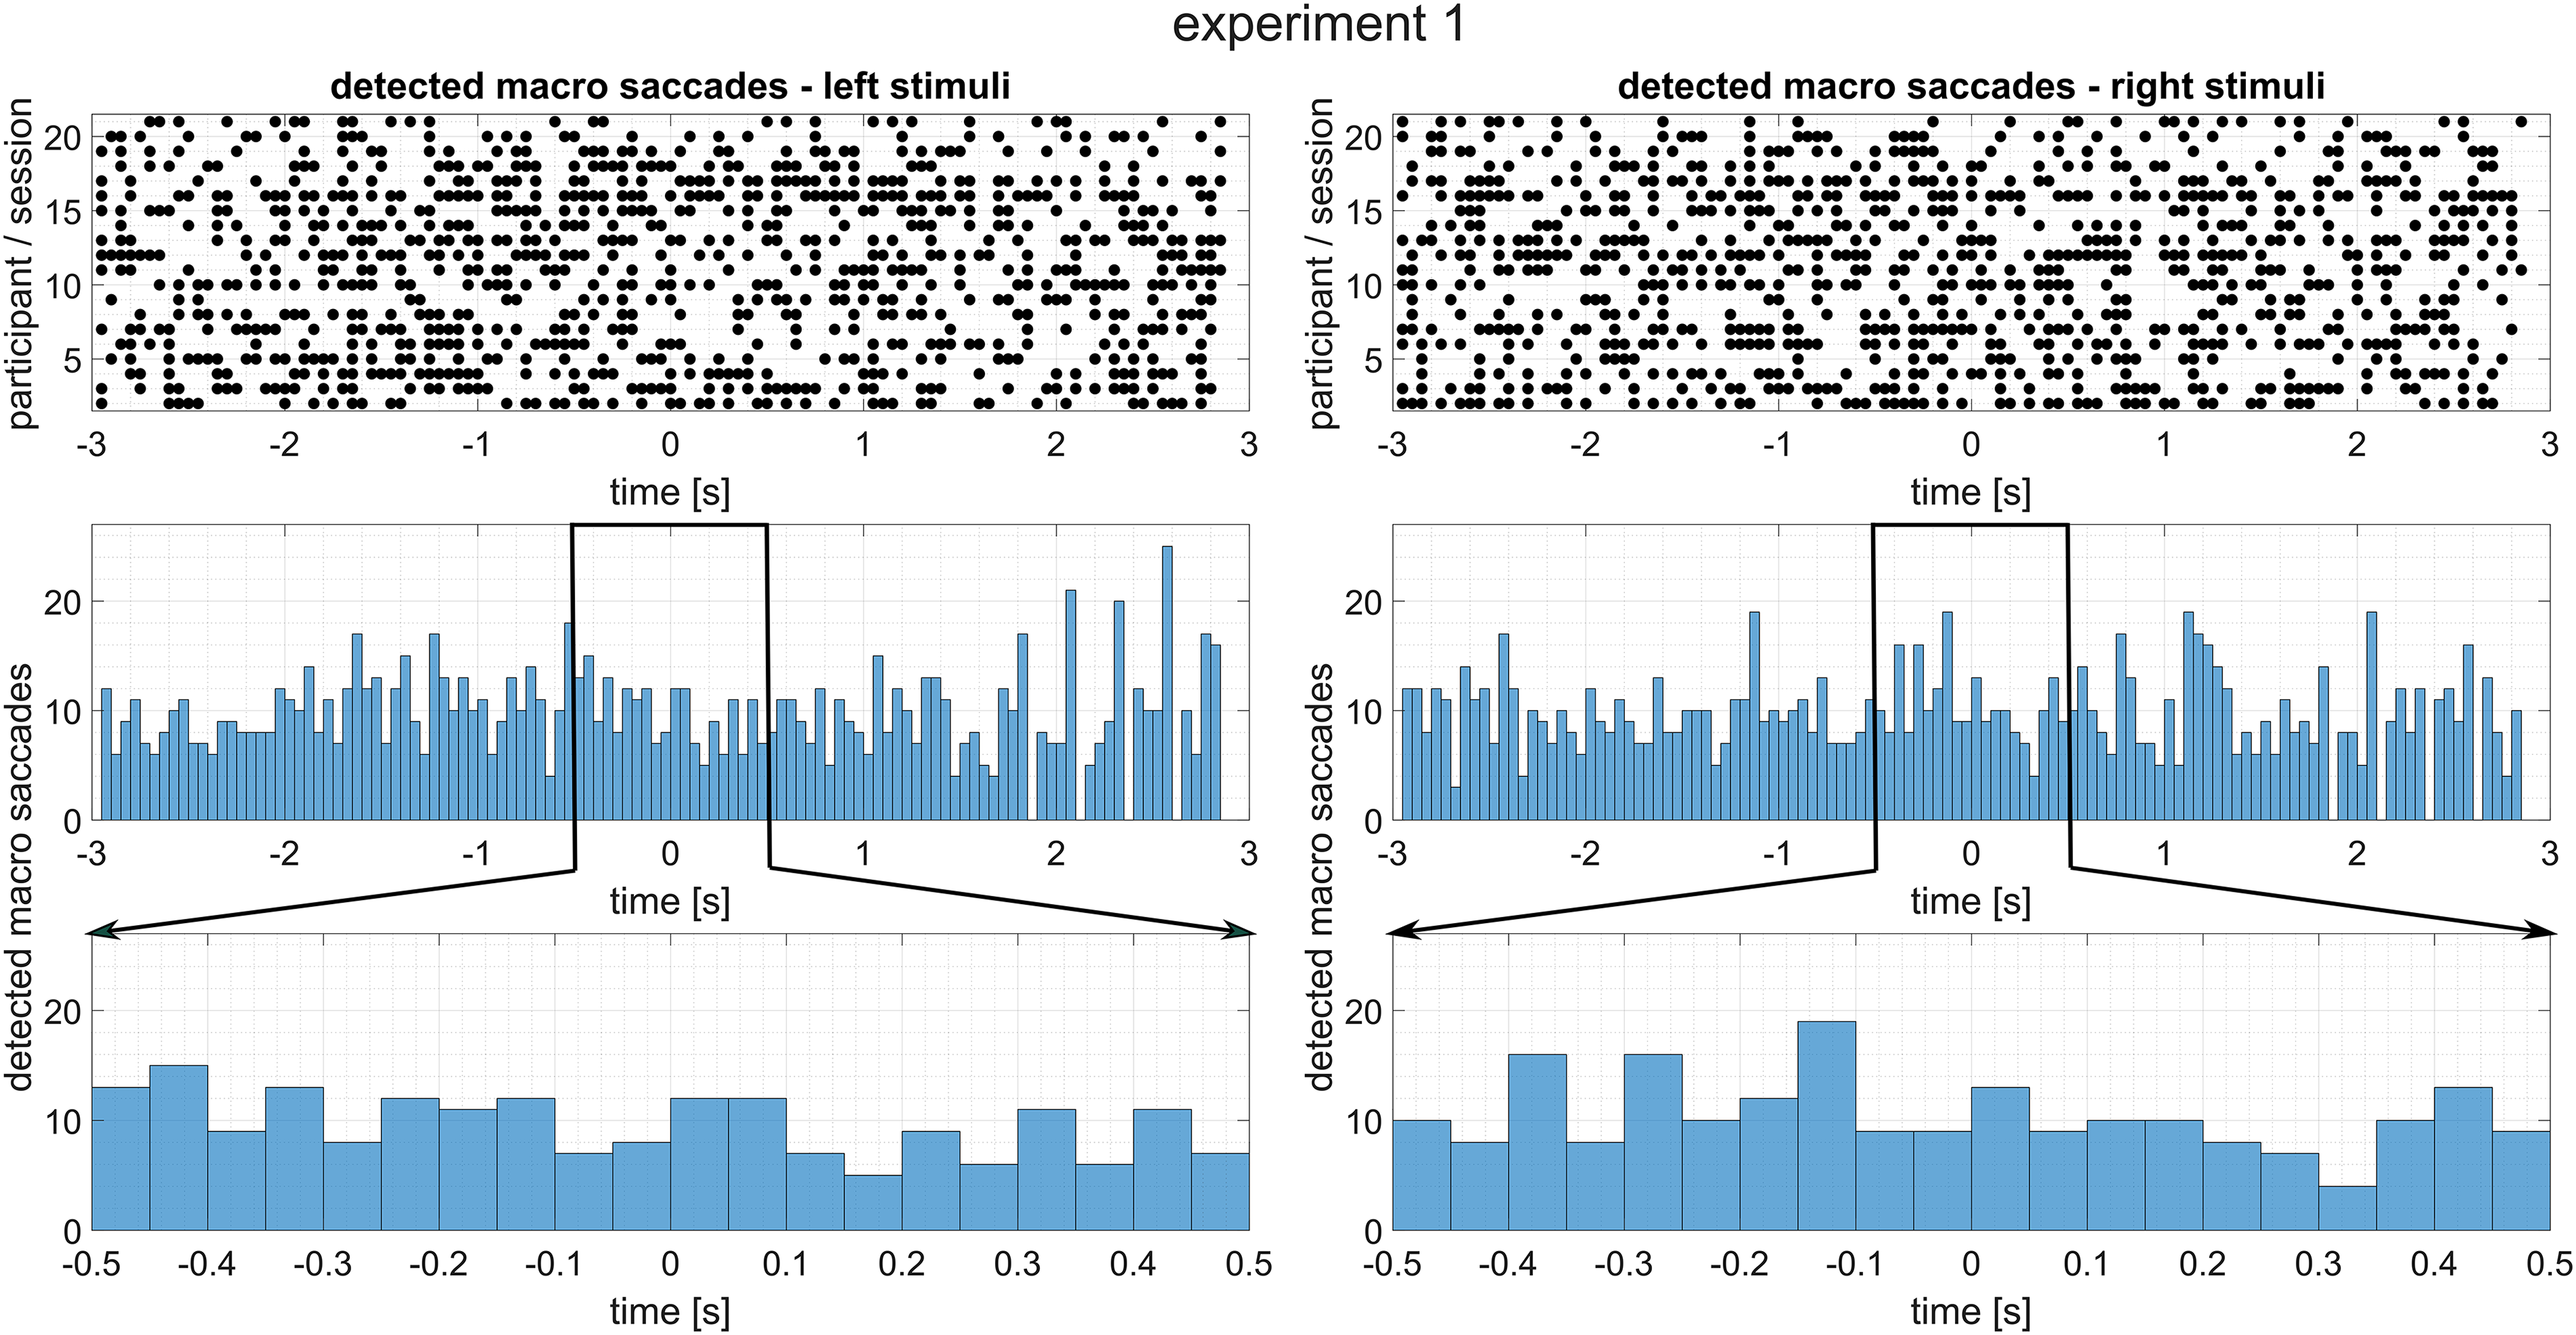
Detected macrosaccades during experiment 1, organized depending on the stimulus direction. Top: Detected macrosaccades for every participant and session. Since each line is the result of multiple trials, black dots may indicate more than one macrosaccade. Middle: Histogram of detected macrosaccades of every trial from all participants and sessions. Bottom: Zoomed in version of the above histogram to demonstrate that there is no increased number of macrosaccades following stimulus onset.

Detected macrosaccades during experiment 2, organized depending on the stimulus direction. Top: Detected macrosaccades for every participant and session. Since each line is the result of multiple trials, black dots may indicate more than one macrosaccade. Middle: Histogram of detected macrosaccades of every trial from all participants and sessions. Bottom: Zoomed in version of the above histogram to demonstrate that there is no increased number of macrosaccades following stimulus onset.
Discussion
In the current study, we were able to record EMG responses of auricular muscles as a response to novel, naturalistic, unexpected sounds during a nonlistening related task (experiment 1), and highly salient keywords in an ecologically valid, “cocktail party” like setting (experiment 2). Concurring with the results from Strauss et al. (2020), ipsilateral responses obtained from the left and right PAM were significantly larger than contralateral responses, that is, the lateralized direction of the stimuli modulated the physiological response. Furthermore, signals obtained from in-ear electrode references displayed the same lateralization effect, albeit to a smaller, but still significant, degree. We were therefore able to achieve the main goal of this study, to confirm the feasibility to record transient, lateralized auricular EMG responses, using an almost entirely dry-contact system utilizing in-ear electrodes.
Regarding the weaker in-ear responses, one simple explanation may be that the in-ear electrodes are not placed directly on the PAM. The available electrode positions in the earpiece are not optimal with respect to proximity to the PAM. As shown in Figure 6, most of the best in-ear references are between electrodes place in the upper part of the concha, which is slightly above (cranial to) the PAM, and electrodes placed in the ear canal or at the tragus/anti-tragus, which is a bit below (caudal to) the PAM. An increased amount of electrodes, including electrodes placed closer to the PAM, such as by Christensen et al. (2022), could potentially maximize the recorded response from the earpiece.
Strauss et al. (2020) also demonstrated that additional auricular muscles, such as the anterior and transverse auricular muscle (AAM and TAM), are co-activated during their exogenous attention experiment, which mainly corresponds to the current study’s experiment 1. Furthermore, co-activation of intrinsic and extrinsic auricular muscles can be observed in non-listening related tasks, such as smiling or nose wrinkling (Rüschenschmidt et al., 2022). Given the central position of the in-ear electrodes, it seems possible that they pick up activity from several auricular muscles, both intrinsic and extrinsic, and are not exclusively recording EMG from the PAM. Especially, the AAM and the M. helicis major are located very close to the electrodes in the upper concha, while the others are close to the M. tragicus, which could therefore contribute to the measured response. The only auricular muscle that probably did not contribute to the response is the superior auricular muscle (SAM), as this muscle shows no increased activity in response to transient stimuli (Strauss et al., 2020). Disentangling the potential contribution of various auricular muscles to the current findings is an interesting direction for future work, however it may require recording setups with a higher spatial selectivity.
Regarding spatial selectivity, in experiments conducted in our laboratory, we have observed that bipolar EMG signals obtained from wet Ag/AgCl electrodes placed directly on the PAM, AAM, TAM, and SAM, are not the result of cross-talk from each other, that is, the spatial selectivity of bipolar electrode montages is sufficient for auricular muscles. However, studies utilizing the same dry-contact in-ear electrodes as used in the present study have shown to be susceptible to EMG artifacts from large, nonauricular muscles (Kappel et al., 2017; Zibrandtsen et al., 2018; Tabar et al., 2020). This was also observed in the current study, and led to rejecting data from experiment 2 during which participants were talking, as the EMG generated when speaking was clearly visible in signals obtained from the electrodes placed in and around the ear. Overall, activity generated by such movement can, however, be excluded as a possible confounding factor for the current results, since they do not induce lateralized activity at the auricular muscles (Rüschenschmidt et al., 2022).
Considering individually identified peaks measured at the PAM, we were unable to identify a statistically significant difference between experiment 1 and experiment 2. There is, however, the confounding factor of the physical properties of the stimuli used that needs to be considered. Comparing the stimuli in experiment 2 (names of the participants) to the ones used in experiment 1 from an acoustical point of view, they had a much slower onset, were presented in a noisy environment, and varied in their onset latency between participants (see Supplemental Figure 11 for onset latencies and variances). Additionally, only about half as many trials were recorded during experiment 2 compared to experiment 1 (60 in experiment 1 and 31 in experiment 2). Judging only by these parameters (stimulus variability and number of stimuli), we would not have been surprised if the results from experiment 1 would have yielded significantly better results than experiment 2. This could lead us to hypothesize that these physical properties of the stimuli are perhaps not very restrictive in order to evoke robust, transient auricular EMG responses. This would in turn indicate that a larger variety of stimuli can be used to generate these responses, including more engaging ones (such as names) in a more ecological experiment. Being able to evoke transient auricular EMG responses with a large variety of “non-ideal” stimuli (in the sense of relatively slow, nonuniform onsets) is a key factor when migrating these experiments into a more applied, out-of-the-laboratory setting.
We should also mention that, based on the grand average of the normalized amplitudes, results of the current study are comparable to Strauss et al. (2020), even though there are several important factors that differentiate these studies. In Strauss et al. (2020), considerably more participants were included (28, compared to 10 in the current study), enabling a much better statistical analysis. The low number of participants is probably the biggest weakness of the current study. On the other hand, all participants repeated the experiments, and given that the results were stable (we did not observe statistically significant session effects), we can confirm the reproducibility of the current results.
Another very important difference are the electrodes used. Strauss et al. (2020) utilized wet electrodes with a diameter of 6 mm, compared to dry-contact electrodes with a 3.5-mm diameter in the current study, in addition to the disposable wet ground electrode. Apart from significantly higher impedances, placing the smaller dry-contact electrodes requires much more attention (while we were not able to measure impedances in the current study, Kappel et al. (2019) reports that the electrodes used have impedances approximately two orders of magnitude higher than comparable wet electrodes). The active electrode has to be placed precisely above the PAM, otherwise, the recorded EMG signal becomes weaker. Small electrodes are in this context much more susceptible to misplacement, and therefore an additional source of variability. The in-ear electrodes are essentially the complete opposite of this. Because they are placed in a flexible earpiece, which is individually fitted to each participant’s ear, there is basically no room for variability when placing them. In fact, given a little training, participants could easily place them themselves without any help. Furthermore, since there is no skin preparation or electrolyte gel involved, they can be removed and reapplied easily, which constitutes another key factor for moving toward an applied, out-of-the-laboratory setting.
Another challenge that needs to be addressed when recording these responses is the variability within and between participants. Attempting to average oscillatory data, as it is common practice with EEG event-related-potentials, would result in extremely small responses, as they are not sufficiently stimulus locked. This is the reason why calculation of the RMS-envelope is necessary, which on the other hand leads to distortions of the response onset timing, which may be an interesting point of analysis in the future. The variability of the responses appears to be somewhat similar to the PAMR, which can display considerable variability between and within participants (Cody et al., 1969; Picton et al., 1974), even though some can be attributed to noncontrolled eye rotations (Patuzzi & O’Beirne, 1999). Future experiments should focus on finding experiment and stimulus parameters that maximize the occurrence and similarity of the oscillatory responses (prior to smoothing by calculating the signal envelope). Identifying such optimized stimuli would enable us to achieve two goals: we would be able to drastically reduce the required measurement time, which in turn could be used to add other experimental manipulations, without exceedingly increasing the experiment duration. On the other hand, if we would be able to satisfactory average responses without smoothing, it might reveal details of the EMG response that are lost in current RMS-envelope approach, and could be used to further investigate the properties and origins of the vestigial pinna-orienting system in humans.
Classification results show that the direction of auditory stimuli can be decoded significantly above chance level, for both experiments, using both the PAM or in-ear electrodes. The lack of performance differences between the first and second sessions of either experiment, combined with the LOSO cross-validation approach, demonstrates the reproducibility and generalizability of the measured responses. Considering the test–retest reliability, a nonsignificant correlation, Pearson correlation coefficient (
There are certainly machine learning models, hyperparameters, and features that would increase the current results, see, for example, Phinyomark et al. (2018) for the effects of sampling frequency and feature selection. Similarly, data-adapted filter banks can also be utilized to further increase the classification score by optimizing features (Strauss & Steidl, 2002). However, the point of this analysis was more of a proof-of-concept that single trials, even when recorded from suboptimally placed in-ear electrodes and high impedances, hold utilizable information about the stimulus direction, supplementing the grand average waveform plots.
As previously argued by Strauss et al. (2020), it is very important to rule out motor confounds. Especially auricular EMG activity that is associated with eye movements, such as Wilson’s oculo-auricular phenomenon (Wilson, 1908), which can be activated with lateral gaze deviations as small as 20∘ in a few (17%) participants (Urban et al., 1993). Jumping to the next line while reading during experiment 1 would require an eye movement of ∘. This generated TAM response in 47% of all participants by Urban et al. (1993). However, Urban et al. (1993) also reported that in most participants, auricular muscle activation was stronger contralateral to the gaze direction. If this was the cause of the results in the current study, we would expect contralateral responses to be larger than ipsilateral responses, assuming participants would look at the direction of the auditory stimulus—which is not the case, neither in the current study, nor in Strauss et al. (2020). It should also be noted that in Urban et al. (1993), eye movements started from the central position (0∘), whereas in experiment 1 these macrosaccades were symmetric about 0∘ (+15∘→−15∘). Furthermore, Gruters et al. (2018) have demonstrated that saccadic eye movements induce oscillatory movement of the eardrums. Considering that dry-contact electrodes are sensitive to movement on the skin, there could be the possibility that this movement is influencing the electrodes placed in the ear canal. However, these movements of the eardrums are generated by ipsi-, as well as contralateral saccades. Therefore, it appears to be unlikely that this phenomenon is a confounding factor to the results of this study, as ipsilateral responses are significantly larger than contralateral ones. Additionally, responses obtained from the in-ear electrodes are very similar to those recorded at the PAM (quantified by significant Pearson correlation coefficients), which should not be influenced by movements of the eardrums at all.
Another motor confound could be attributed to head rotations. Stekelenburg & Van Boxtel (2002) found that rotation of the head generated an ipsilateral EMG response at the PAM. However, instructing the participant to look at a mark in front of them removed this effect entirely. Strauss et al. (2020) also demonstrated that using a chin rest and instructing participants properly was sufficient to prevent any stimulus-locked head movements, quantified the EMG activity of the left and right sternocleidomastoid muscles (which was indicative of head rotations by Stekelenburg & Van Boxtel (2002)). Given that our setup is essentially the same as in Strauss et al. (2020), it seems reasonable to assume that head rotations were sufficiently suppressed as well, preventing the effect observed by Stekelenburg & Van Boxtel (2002). At the same time, results from the eye tracker give no indication of any stimulus locked eye movements, neither in the form of the frequency of macrosaccades (see Figures 8 and 9), nor in the averaged eye position plots (see Supplemental Figures 19 and 21). Therefore, it can be concluded that the results from neither experiment were due to eye nor head movements.
Conclusion
In the current study, we have demonstrated that auricular EMG signals indicate the direction of auditory stimuli, similar to Strauss et al. (2020). A major difference, however, was that the current system almost entirely consisted of dry-contact electrodes that were placed directly on the PAM, as well as in custom-fitted earpieces (Kappel & Kidmose, 2018).
With the paradigms used in the current study, we successfully recorded generally equivalent responses in a quiet environment, but also in an ecologically valid, noisy environment, in which the participant dynamically reacted to a discussion. We were able to record robust responses in both experiments, even though the stimuli used in experiment 2 varied significantly between participants, because each participant had a different first name.
These are two key factors that are necessary to move experiments into an applied, out-of-the-laboratory setting: stimuli that occur in everyday scenarios need to be able to evoke robust auricular EMG responses, and a fully dry, withing-ear recording system that can be easily applied and is unobtrusive to the participant. This points towards an important direction for future studies: the ground electrode should be integrated into the earpiece as another dry-contact electrode, which would transform the setup into a fully dry, completely within-ear setup.
Furthermore, the result that we are able to record these responses in a more realistic setting, like experiment 2, and not just in silence, is an important prerequisite when attempting to investigate the roles and properties of the vestigial pinna-orienting system in the context to, for example, emotions, habituation, or the interaction with the visual system.
While the direction of the stimuli was apparent in grand average waveform plots, they could also objectively be decoded by machine learning algorithms on single trials, when classifiers were trained using a LOSO cross-validation approach. Usually, auditory attention decoding with sensors placed in or around the ear is performed based on eye gaze estimation or EEG (Bleichner et al., 2016; Favre-Felix et al., 2017; Holtze et al., 2022), with the goal of integrating this technology into hearing aids (Fiedler et al., 2017; Favre-Félix et al., 2019; Dasenbrock et al., 2021). The results from this study, where EMG-based classification results were stable when participants repeated the experiments, combined with the fact that custom-fitted earpieces are extremely easy to apply, since dry-contact electrodes require no skin preparation, could potentially supplement this technology in the future.
Supplemental Material
sj-pdf-1-tia-10.1177_23312165231200158 - Supplemental material for Assessment of Vestigial Auriculomotor Activity to Acoustic Stimuli Using Electrodes In and Around the Ear
Supplemental material, sj-pdf-1-tia-10.1177_23312165231200158 for Assessment of Vestigial Auriculomotor Activity to Acoustic Stimuli Using Electrodes In and Around the Ear by Andreas Schroeer, Martin Rune Andersen, Mike Lind Rank, Ronny Hannemann, Eline Borch Petersen, Filip Marchman Rønne, Daniel J. Strauss and Farah I. Corona-Strauss in Trends in Hearing
Footnotes
Acknowledgments
We thank Christine Welsch for assistance with data collection.
Data Availability
Anonymized data that support the findings of this study are available upon reasonable request from the authors.
Declaration of Conflicting Interests
The authors declare no potential conflicts of interest with respect to the research, authorship, and/or publication of this article.
Funding
The author(s) disclosed receipt of the following financial support for the research, authorship, and/or publication of this article: This work was partially funded by the European Union and the state of Saarland (European Regional Development Fund, ERDF), project Center for Digital Neurotechnologies Saar – CDNS.
Ethical Approval
This study was conducted in accordance with the principles embodied in the Declaration of Helsinki and in accordance with local statutory requirements. Participants signed a consent form after a detailed explanation of the experiment. The study was approved by the responsible ethics committee (ethics commission at the Ärztekammer des Saarlandes, Saarbrücken, Germany; Identification Number: 76/16).
Supplemental Material
Supplemental material for this article is available at online.
References
Supplementary Material
Please find the following supplemental material available below.
For Open Access articles published under a Creative Commons License, all supplemental material carries the same license as the article it is associated with.
For non-Open Access articles published, all supplemental material carries a non-exclusive license, and permission requests for re-use of supplemental material or any part of supplemental material shall be sent directly to the copyright owner as specified in the copyright notice associated with the article.