
Abstract
Dynamic range compression is a crucial component in hearing aids, aiming to restore audibility for hearing-impaired listeners. However, determining suitable compression parameters, such as the time constants for the level estimation stage, remains a topic of debate, as the perceptual benefit of different parameter configurations varies depending on the acoustic conditions. In this study, a data-driven distance metric based on physical metrics was developed to evaluate and compare the performance of various compression systems. This analysis encompassed fast-acting and slow-acting compression, as well as a “scene-aware” compression that dynamically adjusted the release time constant based on the presence of the target. A reference system called “source-independent compression” was also considered, which had access to individual speech and noise signals. Multiple physical metrics were employed to assess the effects of these different compression systems under diverse acoustic conditions, including varying levels of interfering noise and degrees of room reverberation. Factor analysis was applied to derive a concise set of interpretable features representing the impact of compression, expressed as linear combinations of carefully selected objective metrics. The reduced dimensional representation enabled the use of the Manhattan distance to measure the similarity between the compression systems. Results demonstrated that the scene-aware compressor generally exhibited a smaller distance to the reference system compared to both the fast-acting and slow-acting compressors. This finding suggests that an adaptive compression system holds potential benefits across a range of acoustic conditions.
Introduction
People with sensorineural hearing loss typically experience a phenomenon called loudness recruitment, which is characterized by an elevated threshold of hearing while the threshold of discomfort at high sound pressure levels remains unchanged (Fowler, 1936). Consequently, soft sounds often become difficult to perceive whereas intense sounds remain equally loud compared to normal-hearing people. This reduced dynamic range (DR) of hearing poses challenges for speech recognition, particularly for people with moderate-to-severe hearing loss, as many of the subtle speech components, such as consonants, may fall near or below their threshold of hearing (Walden & Montgomery, 1975). To address the diminished DR of hearing, modern hearing aids employ a technique known as wide dynamic range compression (WDRC). WDRC applies level-dependent amplification in multiple frequency channels to compensate for the reduced audibility of low-intensity sounds while maintaining comfortable loudness levels for high-intensity sounds (Villchur, 1973). By providing a stronger amplification for lower-input levels and adjusting amplification levels for higher input levels, typically in multiple frequency channels, WDRC aims to restore audibility and improve speech intelligibility for hearing-impaired people.
WDRC, commonly divided into fast-acting and slow-acting compressors based on their release times, remains the subject of ongoing debate regarding the appropriate compression parameters (Kates, 2010; Souza, 2002). Fast-acting compressors are characterized by release times below 200 ms which can provide amplification on a syllabic time scale while slow-acting compressors have release times above 200 ms similar to automatic gain control. Listening tests have indicated that fast-acting compression systems can lead to increased intelligibility while slow-acting compression systems tend to enhance listening comfort (Gatehouse et al., 2006; Alexander & Masterson, 2015; Moore, 2008). However, the benefits of different compression systems in terms of intelligibility and listening comfort are contingent upon specific acoustic conditions, such as reverberation and the spectro-temporal characteristics of background noise, which makes the evaluation of compression systems challenging (Rallapalli & Alexander, 2019; Reinhart et al., 2017; Rhebergen et al., 2017).
While compression is employed to address audibility loss associated with sensorineural hearing loss, its application to speech in the presence of noise and reverberation can lead to adverse effects. These effects include reduced effective compression and amplification of background noise, resulting in a reduced signal-to-noise ratio (SNR) (Reinhart et al., 2016; Souza et al., 2006; Naylor & Johannesson, 2009). Moreover, compression can affect the direct-to-reverberant energy ratio (DRR) and the spatial characteristics of the sound through the amplification of low-level reverberant components (Hassager et al., 2017). Additionally, compression causes negative correlations in the envelopes of multiple sources as the applied gain is determined by the loudest signal (Stone & Moore, 2007). The severity of these effects of compression is influenced by the release time, input SNR, amount of reverberation, and spectro-temporal characteristics of the sources in the mixture. For example, fast-acting compression can enhance the output SNR for speech signals in very low SNR conditions with fluctuating maskers, as it can amplify speech components during noise gaps (Reinhart et al., 2016). However, this benefit diminishes in conditions with stationary maskers.
Despite the detrimental effects, hearing aid compression is still considered necessary to restore audibility caused by the loss of compression in the cochlea. However, there are differences between hearing aid compression and cochlear compression. Hearing aid compression applies amplification in the ear canal instead of directly in the cochlea, leading to differences in neural coding between the two (Armstrong et al., 2021). This implies that hearing aid compression should be selective, focusing on compressing the target sound while avoiding excessive amplification of background noise and reverberation. Several studies have proposed a similar approach, suggesting that an “ideal” compression system should primarily apply compression to the target signal of interest while applying minimal or no compression to the background noise or the reverberant portions of the sound (Corey & Singer, 2021; Llave et al., 2020; Hassager et al., 2017; Edwards, 2014). Such a system, here referred to as “source-independent” compression, has been shown to improve speech intelligibility and preserve spatial cues (Stone & Moore, 2007; Rhebergen et al., 2008; Hassager et al., 2017). However, implementing such a system is not feasible as it requires a priori access to the independent source signals.
Instead, the properties of source-independent compression can be approximated by combining source separation and compression (Corey & Singer, 2017; Ngo et al., 2008; Kortlang et al., 2018; Llave et al., 2020) or by using an adaptive compression system that adjusts the release time of the compressor based on the detection of the target signal (May et al., 2018; Hassager et al., 2017; May et al., 2020). Listening tests have shown that combining source separation and WDRC can reduce noise “annoyance” but does not improve speech intelligibility compared to a system with linear gain (Brons et al., 2015; Kortlang et al., 2018). Listening tests with an adaptive compression system have demonstrated preserved spatial cues in reverberant environments (Hassager et al., 2017), as well as increased speech intelligibility and increased subjective preference compared to conventional compression systems (Kowalewski et al., 2020). However, the adaptive compression system has only been evaluated in either noisy or reverberant conditions, but not in realistic conditions with both interfering noise and room reverberation.
Conducting listening tests in a wide variety of acoustic environments to evaluate and compare multiple compression systems would provide the most accurate assessment. However, such tests are time-consuming, and optimizing the parameters of a novel compression system based on these tests would be challenging. Instead, it would be beneficial to rely on a set of physical metrics for analyzing the effects of compression and adjusting the compression parameters in a given environment. Previous studies have considered certain physical metrics to estimate the beneficial and detrimental effects of compression, although the selection of metrics has varied greatly across studies. Some studies have shown a trade-off between improved audibility and detrimental effects such as co-modulation distortion and a reduced SNR when applying compression to a mixture (Souza et al., 2006; Corey & Singer, 2021). Kates (2010) considered perceptually inspired metrics, including I3 and HASPI as speech intelligibility measures, and HASQI as an indicator of speech quality, to evaluate compression systems. The author argued that determining the “optimal” choice of the compression system is difficult since the compression parameters that maximize intelligibility may not be the same parameters that maximize quality. However, the perceptually inspired metrics used for evaluating WDRC systems only apply to monaural signals and do not account for the spatial distortion typically associated with fast-acting compression systems. Additionally, interpreting the implications of “high-level” metrics like HASPI and HASQI in terms of their signal-level effects can be challenging compared to “low-level” physical metrics. The latter include metrics such as SNR, DR, and co-modulation between the target signal and background noise, which offer a more direct interpretation of the effects of compression.
In the present study, a data-driven approach was employed to explore the effects of compression. A comprehensive set of physical metrics was considered to derive a latent space where each dimension explains the properties of how compression affects a noisy and reverberant mixture signal. The similarity between different compression systems was evaluated based on their relative distance within the latent space. This approach allowed the distance metric to be interpreted in terms of the contributions of the individual dimensions. Conventional fast- and slow-acting compression, as well as an adaptive system based on the SNR-aware approach described in May et al. (2018), were evaluated in terms of their similarity to the source-independent compression systems that the adaptive system aimed to approximate.
Methods
Figure 1 shows the framework for computing the data-driven distance metric, consisting of the following four steps: (1) acoustic scene generation, (2) dynamic range compression, (3) objective metrics, and (4) a latent space analysis. The first three steps can be considered a data generation stage, while the last step aims to produce a latent space with interpretable features that are used to explain and compare the effects of the different compression systems.

Framework for evaluating the compression systems in adverse conditions. A large set of acoustic scenes was generated and processed by four different dynamic range compression systems. The effect of compression was measured using objective metrics which were then transformed into the feature dimensions of a latent space using factor analysis. The similarity of compression systems was measured as the distance to the source-independent compression system which served as the reference.
Acoustic Scene Generation
The effect of compressing noisy and reverberant speech is typically measured by comparing how the target speech is processed in comparison to the background. For this reason, the acoustic scene generation stage was designed such that both the target speech and the background could be isolated from the mixture. “Shadow-filtering” was used to apply the same compression gain function that was estimated from the mixture separately to the target speech and the background.
The noisy and reverberant mixtures, referred to as the acoustic scenes, were generated as illustrated in Figure 2. An acoustic scene consisted of a foreground, a background, and a mixture of component. The foreground was the target speech signal convolved with the direct sound of a binaural room impulse response (BRIR), which was considered to be the initial 2.5 ms following the largest peak. The background contained both the reverberant noise and the late reflections of the target speech signal. The mixture was the sum of the foreground and the background.

Schematic representation for generating an acoustic scene. The speech is adjusted to have a level of 65 dB RMS, and the noise level is adjusted according to a desired SNR. The speech and noise signals are then spatialized using binaural room impulse responses (BRIRs) that were separated into early reflections and late reverberation by applying a windowing procedure. The spatialized signals were then used to create a foreground signal, a background signal and a mixture signal. RMS = root mean square; SNR = signal-to-noise ratio; BRIR = binaural room impulse response.
The acoustic scene signal was generated by first randomly selecting and concatenating five speech sentences from a speech database. The level of the speech signals was normalized to a root mean square (RMS) level of 65 dB. The noise was then selected from a noise database and its level was adjusted relative to that of the speech to achieve SNRs between
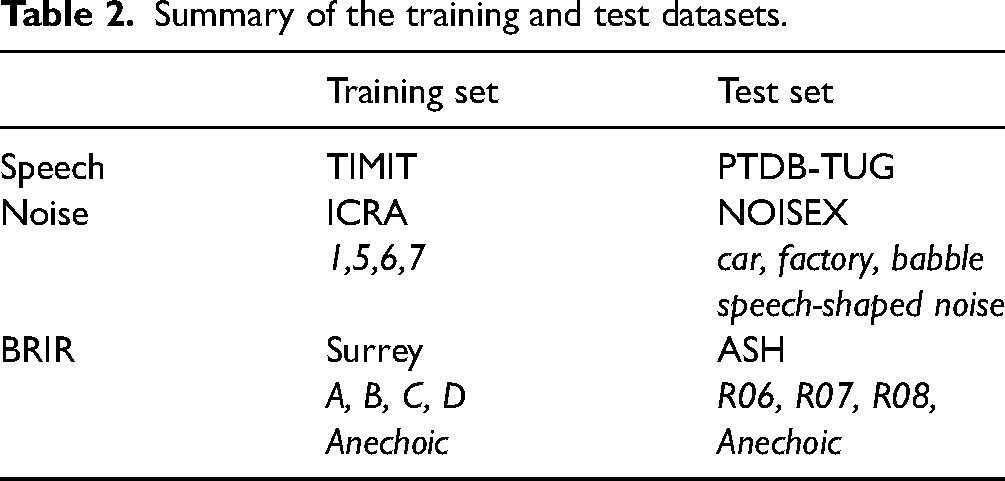
The data-driven distance metric was implemented and validated using different sets of speech, noise, and BRIR databases. The acoustic scenes used for implementing the data-driven distance metric employed a separate collection of speech, noise, and BRIR compared to the acoustic scenes used for validating the metric. Details on the datasets can be found in the “Dataset generation” section, with a summary provided in Table 2.
Summary of the training and test datasets.
Compression Systems
Four compression systems were implemented. Three of them represented the systems under test and one represented the source-independent compression system which served as the reference. The systems under test were a fast-acting compressor with a short release time, a slow-acting compressor with a long release time, and a scene-aware compressor with an adaptive release time. All systems were implemented similar to May et al. (2018), using seven frequency channels and compression parameters according to the NAL-NL2 prescription for an N4 standard audiogram (Bisgaard et al., 2010). The parameters of the compression systems are indicated in Table 1 and signal processing details are shown in Figure 3. All systems operated in seven frequency channels using a 1-octave filterbank ranging from a center frequency of 125 Hz to 8 kHz. The systems had a common attack time of 5 ms and the release time was 50 ms for the fast-acting compressor, and 2000 ms for the slow-acting compressor. The scene-aware compressor adaptively changed the release time, such that it was 50 ms in time-frequency (T-F) units of the filterbank output with a foreground-to-background ratio (FBR) above 0 dB, and 2000 ms when the FBR was below 0 dB. All of the compressors utilized a single knee point in each frequency channel, applying compression above the knee point and maintaining linear gain below the knee point. The scene-aware compressor had a priori information about the FBR in each T-F unit. The reference source-independent compression system had access to individual speech and noise signals of the mixture signal and applied fast-acting compression to the foreground and slow-acting compression to the background before mixing.
Compression ratio (
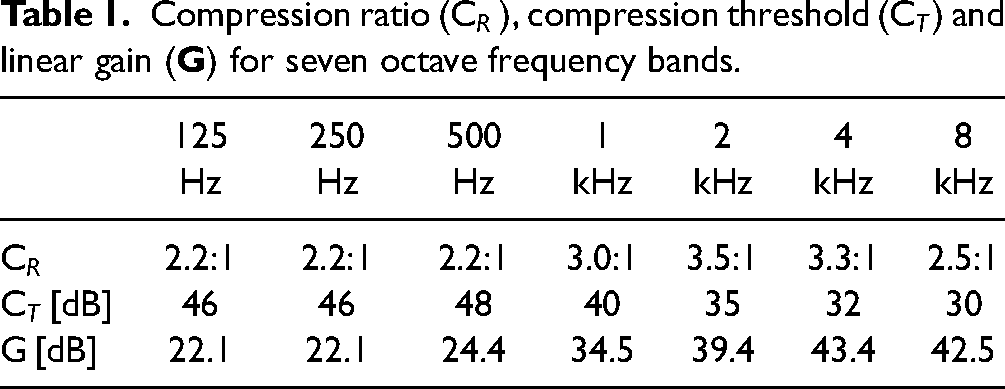

Signal processing diagram and configuration of the WDRC systems. The input signal is first processed by an STFT (based on the SciPy implementation (Virtanen et al., 2020)), then the level is estimated in seven frequency bands, followed by the gain calculation stage based on the NAL-NL2 prescription with a 50 ms release time for the fast-acting compressor and 2000 ms release time for the slow-acting compressor. The gain is interpolated from the seven frequency bands to match the number of frequency bins in the STFT. The original STFT representation of the input signal is multiplied by the interpolated gain prior to being transformed into the time-domain using an ISTFT. WDRC = wide dynamic range compression; STFT = short-time Fourier transform; ISTFT = inverse short-time Fourier transform.
Physical Metrics
To evaluate the effects of compression, an extensive set of physical metrics was used to identify which metrics would be most relevant for the data-driven distance metric. The selected metrics have either been considered in previous studies or were assumed here to be affected by compression. The physical metrics were all computed for the foreground, the background and the mixture signals in individual frequency bands, identical to the frequency bands of the compressors. Some specific physical metrics were only computed for the foreground, such as the unvoiced-to-voiced ratio (UVR) and the binaural source modulation correlation (BSMC). Other metrics were calculated for combinations of the foreground and the background, such as the SNR and the across source modulation correlation (ASMC). The effect of compression on a given physical metric was evaluated by comparing the metric before and after compression.
The ASMC measures the co-modulation between the envelope of the foreground and the background signal (Stone & Moore, 2008). An increased amount of compression has been shown to cause the foreground and background in a mixture to become negatively correlated. The envelopes were using the same STFT, filterbank, and level estimation approach as the fast-acting compressor, followed by applying a threshold to the level estimates such that the lowest level was maximally 13 dB below the average level according to Stone & Moore (2008). The BSMC is similar to interaural coherence but uses the same pre-processing as the ASMC. Compression has been shown to distort spatial cues by causing the left and right channels to be less correlated in the presence of reverberation due to the increased amplification of reverberant components in the mixture (Hassager et al., 2017). This metric was computed only for the mixture. The dynamic range (DR) represents the long-term DR of the sound, representing the difference between the 99th and 50th level percentile in dB. The DR was calculated for the foreground, the background, and the mixture. The level estimation of the signals used the same front-end as the fast-acting compressor. Increased amount of compression is associated with a reduction of DR. The effective compression ratio (ECR) reflects the ratio between the DR before and after compression (Souza et al., 2006). The ECR indicates how much compression is effectively applied and was calculated for the foreground, background, and mixture signal as the ratio of the DR before and after processing. Increased amount of compression is related to an increase in ECR. The fidelity of envelope shape (FES) reflects the correlation between the envelope of the same sound before and after compression and can be considered as a measure of envelope distortion (Stone & Moore, 2008). It uses the same pre-processing as the ASMC and the BSMC and was calculated here for the foreground, the background, and the mixture. Distortion caused by compression would lower the FES. The FBR reflects the level of the foreground signal in relation to the background. This is equivalent to the SNR in the absence of reverberation, and equivalent to the DRR in the absence of noise. Compression typically lowers the SNR and DRR by the increased amplification of noise and reverberation relative to the target speech signal (Souza et al., 2006). The UVR measures the change in the power ratio between the unvoiced and the voiced speech components. Fast-acting compression may provide an increased amplification of the soft unvoiced speech components, such as some consonants, relative to the louder voiced speech components. The UVR has been hypothesized to be related to speech intelligibility (Kowalewski et al., 2018). Computing this metric requires labeled speech data, where the voiced and unvoiced speech components can be separated. The UVR was measured here only for the foreground signal.
Dimensionality Reduction
The seven physical metrics (ASMC, BSMC, DR, ECR, FES, FBR, and UVR) were calculated in seven frequency channels and some of the metrics were calculated for both foreground, background, and mixture, resulting in a total number of 91 metrics. To reduce the dimensionality and determine the underlying effects of compression on speech in adverse conditions, factor analysis was used. To ensure comparability across metrics, each metric was standardized by subtracting the mean and dividing it by the standard deviation of the training set. This process guarantees that all metrics are operating on a consistent scale. Traditionally, principal component analysis (PCA) has been used for dimensionality reduction. However, factor analysis was considered more beneficial here, as it allows for interpretable latent space dimensions (Costello & Osborne, 2005). Similar to PCA, factor analysis is based on eigenvalue decomposition and a factor with a higher eigenvalue describes more variance of the data. Following the recommendation of Hair et al. (2018), the number of retained factors was controlled by selecting the number of factors that lied above the knee point of the scree plot showing the eigenvalues for each factor. Each factor consists of factor loadings for each given metric. The factor loadings reflect how much the metric contributes to the factor. The factor loadings are commonly neglected if they do not exceed a threshold of an absolute value of 0.7 (Costello & Osborne, 2005).
Dataset Generation
Both a training set and a test set were created to assess the generalization of the latent space representation. The training set and the test set used disjoint speech, noise, and reverberation data, as summarized in Table 2. The latent space was created using factor analysis of the training set. The generalizability of the latent space was then evaluated by projecting the physical metrics calculated from the test set onto the latent variables derived from the factor analysis. A similar distribution within the latent space of the training set and the test set would suggest that the latent space generalizes to previously unseen acoustic conditions.
The TIMIT database (Garofolo et al., 1993) was used to create the training data while the PTDB-TUG database (Pirker et al., 2011) was used to create the test set. Both datasets allowed to calculate the UVR metric as the supplemented labels allowed them to identify unvoiced and voiced components. The noise databases consisted of ICRA noise (Dreschler et al., 2001) for training and NOISEX (Varga & Steeneken, 1993) for testing. The ICRA noise contained speech-shaped noise with either a static level or with a fluctuating level according to 1-talker, 2-talkers, or 6-talkers scenarios. The NOISEX stimuli were factory noise, car noise and babble noise. The test dataset had additional noise stimuli, which was a stationary noise with a long-term average spectrum of the PTDB-TUG speech data. These noise types were chosen to contain realistic background sounds with varying degree of amplitude envelope fluctuations. The BRIRs from the SURREY database (Hummersone et al., 2010) were used to create the reverberant training data, while BRIRs from the ASH-IR database (Pearce, 2021) were used for testing. The selected rooms and respective characteristics are summarized in Table 3. The compression systems and physical metrics were the same for both the training and the test sets.
Acoustical properties of the BRIRs used for acoustic scene generation.

R06, R07, R08 were used for the test set while A,B,C,D were used for the training set. The anechoic room was used for both sets. BRIRs marked with [S] are from the Surrey database, while [ASH] are from the ASH database. DRR = direct-to-reverberant energy ratio; BRIR = binaural room impulse response
Distance to Source-independent Compression
Within the low-dimensional space as determined by the factor analysis, it can be assumed that data points that are close to each other are similar. Each data point in the latent space corresponds to an acoustic scene processed by a compression system. The relative distance between the points represents a measure of similarity between the compression systems. The distance metric was chosen to be represented by the Manhattan distance since this metric can easily be decomposed into the contributions from the different dimensions and can as such provide an interpretable distance metric. The distance of each of the considered compression systems to the source-independent compression system was calculated in each acoustic condition to evaluate the respective compression system’s similarity to the source-independent system.
Results
Latent Space
The factor analysis of the training data resulted in a latent space, where each factor represents one dimension in the space. This latent space describes the effects of compression on speech in noise and reverberation. The influence of each factor is captured by the scree plot in Figure 4 showing the eigenvalue for each factor. The number of retained factors was chosen following the recommendations of Hair et al. (2018), according to which eigenvalues above the knee point in the scree plot, shown in Figure 4, should be retained. Based on this principle, the factors 1–3 were selected in this analysis.

Scree plot showing the eigenvalue for each individual factor calculated for the training set. The knee point was selected at the third component, as indicated by the red dot, after which the change in eigenvalue was less pronounced.
Each factor contained a set of coefficients for each objective metric referred to as loadings. The loadings are shown in Figure 5. Loadings of the retained factors with an absolute value above the threshold (0.7) are indicated by the darker bars. In total, 47 out of 91 objective metrics were retained after the factor analysis. The first factor (top panel) mainly corresponded to a change in the DR of the foreground, reflected by a decrease in DR of the foreground, a change in UVR, and an increase of ECR of the foreground. The second factor (middle panel) essentially corresponded to a decrease in ECR of the background, an increase in ECR of both the background and the mixture, as well as decreases in BSMC and ASMC. The third factor (bottom panel) represented a change in the FBR, which was the only metric above the threshold for this factor.

The factor loadings for each selected factor. Each metric is grouped according to the output of the 1-octave filterbank, where the leftmost loading is calculated for the 125 Hz band and the rightmost for the 8 kHz band. The factor loadings that were retained are highlighted with a darker color. The first factor can be interpreted as representing the amount of compression of the foreground, the second factor describes the effects on the background, and the third factor represents the change in the foreground-to-background ratio (FBR). The physical metrics that were calculated for the different components in the noisy mixture signals include a subscript referring to F (for foreground), B (for background), or M (for mixture) to indicate the signal they were calculated for.
Generalization Assessment
The latent space was created using a training set of noisy and reverberant mixtures and was assessed on noisy and reverberant mixtures generated from a disjoint set of speech, noise, and BRIRs to ensure that this space could explain the effects of compression on previously unseen data. The comparison of the two datasets in Figure 6 indicates that the latent space can be used to describe previously unseen data, as the distributions of the compression systems are comparable between the training set (left panel) and test set (right-panel).

Comparison of the latent space of the training set (left panel) and the test set (right panel) for factor 1 and factor 2. Both datasets show a similar distribution within the latent space. High signal-to-noise ratio (SNR) correspond to the acoustic conditions with an SNR above 0, and Low SNR corresponds to acoustic conditions with an SNR of 0 or below.
The two-dimensional projection of the latent space in Figure 6 shows that the source-independent compressor (red) performs as designed, by providing the highest amount of foreground compression (high factor 1) and a relatively low degree of background and mixture compression (low factor 2). The slow-acting compressor (orange) provides the smallest amount of foreground compression but also does not compress the background and the mixture. The fast-acting compressor (blue) provides the largest amount of compression to the background and the mixture. The scene-aware compressor (green) is located in between the fast- and the slow-acting compressor.
The Influence of Noise and Reverberation
To analyze the influence of noise and reverberation, the data were grouped by the noise type, the input SNR, and the presence of reverberation. The resulting distributions are shown in Figure 7 and visualized in terms of factor 1 and factor 2. In Figure 7, the upper row shows the influence of stationary noise and the bottom row shows the influence of modulated noise. The left column shows the distributions in anechoic conditions for input SNRs of 0 dB and below, the middle column shows the distributions in anechoic conditions for input SNRs above 0 dB, and the right column shows the distributions for reverberant conditions with an input SNR above 0 dB.

Distributions of processed acoustic scenes for the test set in both stationary noise (top row) and modulated noise (bottom row) in the low signal-to-noise ratio (SNR) condition (left column), the high SNR condition (middle column), and the reverberant condition (right column).
The effects of the input SNR on the amount of foreground compression (factor 1) is consistent with the findings from previous studies (Souza et al., 2006), where a lower input SNR (left column) results in a reduced amount of foreground compression compared to acoustic conditions with a higher input SNR (middle column). This is reflected by the shift towards the right for the distributions for the slow-acting (orange), the fast-acting (blue), and the scene-aware (green) compressors. The presence of reverberation reduces the amount of foreground compression, as can be seen when comparing the high SNR conditions (middle column) with the high SNR and reverberant conditions (right column).
The influence of the noise type is primarily represented by factor 2, which is reduced for the stationary noise (upper panels) compared to the modulated noise (lower panels), especially for the fast-acting (blue) and the scene-aware (green) compressors at low SNRs. The reduction of factor 2 for stationary noise can be explained by the expansion due to the co-modulation effects when the compressor is driven by the foreground signal. In addition, the increase of factor 2 in the modulated noise conditions can also be explained by the reduction of the DR of the background after compression.
The influence of reverberation (right column) is especially represented by an increase in factor 2, relative to the anechoic and high SNR conditions (middle column). The distributions are, however, similar across noise types. The increase in factor 2 might thus be explained by the binaural distortion reflected in the BSMC.
The scene-aware compressor appears in all acoustic conditions as an interpolation between the fast- and slow-acting compressors. In extreme conditions, the scene-aware-compressor becomes equivalent to either the slow- or the fast-acting compressor. For example, in the case of stationary noise at a low SNR (upper left panel), it can be assumed that most of the target-related components are masked by the background, such that the scene-aware compressor primarily uses a long release time. The same degree of masking is, however, not seen in the case of modulated noise, as the scene-aware compressor can switch the release time from long to short in the noise dips, such that it behaves more similarly to the fast-acting compressor in the presence of speech glimpses. The overlap between the fast-acting, scene-aware and ideal compressors in the high SNR conditions (middle panels) is considered to stem from the noise-free conditions where all three compressors provide an equivalent fast-acting compression to the foreground only.
Distance to Source-independent Compression
The similarity to the source-independent compressor was measured as the Manhattan distance between each acoustic scene processed by any compression system to each of the similar acoustic scenes processed by the source-independent compressor. The acoustic conditions were grouped by the input SNR, the noise type, and the presence of reverberation. These distances are summarized in Figure 8 as a function of the input SNR, where the left panel shows the distances for the stationary noise conditions, the middle panel shows the distances for the modulated noise conditions and the right panel shows the distances for both noise types in reverberant conditions. The distance is visualized as stacked bars where the lower bars (dark colors) represent the contribution from factor 1, the middle bars (medium colors) represent the contribution from factor 2 and the upper bars (light colors) represent the contribution from factor 3. The error bars in the figure represent the standard deviation from the distances between groups with similar configurations. The non-zero distance for the source-independent compressor is attributed to the variance within the group. At infinite SNR (most-right bars in each panel), the fast-acting (blue) and the scene-aware (green) compressors are equivalent to the source-independent compressor (red) because they apply the exact same processing. The only exception is in the condition with reverberation, where all compressors differ from the source-independent compressor. The fast-acting compressor (blue) generally provided a higher amount of foreground compression (indicated by a lower factor 1) than the slow-acting (orange) and scene-aware (green) compressors. In stationary noise and in reverberant conditions, the fast-acting compression system showed the largest distance to the source-independent compressor, due to the increased amount of background compression (factor 2) and the substantial reduction of the FBR (factor 3). In modulated noise, the distance to the source-independent compressor was reduced for both the fast-acting compressor and the scene-aware compressor, which according to the factor contributions shown in Figure 8 might be explained by the reduction of factor 1 and 3 corresponding to increased foreground compression and less influence on the FBR.

Distance to source-independent compression across acoustic conditions with either noise only or both noise and reverberation. Each distance is decomposed into the contributions from each dimension in the latent space, where the lowest bar corresponds to factor 1, the middle to factor 2, and the uppermost to factor 3. The error bars indicate the standard deviation of the distances between the groups with similar configurations.
Discussion
This study evaluated a set of dynamic range compression systems applied to speech signals in the presence of both noise and reverberation using a novel data-driven distance metric. The distance metric was based on the similarity within a latent space between each compression system and a reference system, which was a source-independent compressor. The latent space was created through factor analysis, selecting and combining the most relevant physical metrics from a larger set. The latent space aimed to capture the primary effects of compression on noisy and reverberant speech mixtures and consisted of the following three dimensions: the change in foreground DR, the amount of compression and distortion of the background, and the change in FBR.
The distance between data points in the latent space reflected the similarity of the processing effects applied to the input signals, with a shorter distance indicating higher similarity. In this study, the distance metric was used to evaluate the effects of compression. However, it could also be potentially used to optimize compression parameters in order to approximate a reference system, such as the source-independent compressor, which requires access to individual speech and noise signals and thus cannot be realized in practical applications. For example, optimizing a compressor to maximize SNR would result in either linear gain or slow-acting compression while optimizing it to maximize the ECR of the foreground would result in fast-acting compression. Using a reference system as an optimization target could be beneficial when optimizing a system on multiple attributes.
Based on the analysis of the distance metric across various acoustic conditions, the recommended compression system in this study leaned towards the scene-aware compressor, particularly in anechoic conditions with SNRs below 12 dB, as it had the shortest distance to the reference system. However, in the presence of reverberation, both the scene-aware compressor and the slow-acting compressor exhibited a similar distance to the reference system. Nevertheless, there is a trade-off between the slow-acting compressor and the scene-aware compressor, where the former is more similar to the reference system in terms of factor 2, while the latter is more similar in terms of factor 1. This trade-off demonstrates that the challenge of balancing foreground compression and preserving the naturalness of the background persists for adaptive compression systems, including the scene-aware compressor. The distance to the reference system was only zero in an anechoic and noise-free condition where both the fast-acting and scene-aware compressors were equivalent to the source-independent system. In the highest SNR condition, the distance increased, indicating that additional signal processing would be required to further reduce the distance and approximate the reference system. Considering that the source-independent compression essentially employs ideal source-separation before compression, incorporating a speech enhancement stage, such as noise reduction or a beamformer, to isolate the target speech signal prior to compression might lead to a better approximation of the reference system. In such cases, the latent space would still be suitable for evaluating combined speech enhancement and compression systems since speech enhancement can also be assessed using the same physical metrics as compression.
One limitation of the distance metric is its dependence on a reference system. In this study, the selected reference system was the source-independent system, assuming that hearing-impaired listeners would benefit from applying fast-acting compression to the target speech and slow-acting compression to the background. When utilizing the distance metric for optimization, the reference system should be evaluated perceptually, and the compression parameters could potentially be adjusted to ensure suitability for individual hearing-impaired listener, such as adapting the level of fast-acting compression based on the working memory capabilities of the hearing aid user (Souza & Sirow, 2014).
The distance metric relied solely on physical metrics and was derived through a data-driven approach. Consequently, the perceptual consequence of changes in distance or changes with respect to each factor was not evaluated. The contribution of each factor was equally weighted when calculating the distance to the reference, implying that a change in factor 1 has the same impact on the distance as a change in factor 2 or factor 3. A possible future direction would be to investigate how each factor influences perceptual outcomes, such as speech intelligibility, listening comfort, or binaural perceptual attributes. Additionally, it would be beneficial to determine if changes in the data-driven distance metric correspond to perceived changes towards or away from the reference system.
Conclusion
This study proposed a data-driven distance metric to evaluate the impact of dynamic range compression on speech in adverse acoustic conditions. The distance metric was derived from a set of physical metrics and transformed into a latent space with three dimensions. The dimensions represented the compression applied to the foreground, the compression and distortion of the background, and the change in the FBR. By utilizing the latent space, the effects of compression and also the similarity between different compression systems could also be analyzed. The scene-aware compressor consistently exhibited a smaller distance to the reference system compared to both the fast-acting and slow-acting compressors across various conditions. This suggests that an adaptive compression system may offer benefits in diverse acoustic environments. In future research, the data-driven distance metric could be utilized to develop novel compression techniques, using the distance as a means of optimization.
Footnotes
Declaration of Conflicting Interests
The authors declared no potential conflicts of interest with respect to the research, authorship, and/or publication of this article.
Funding
The authors disclosed receipt of the following financial support for the research, authorship, and/or publication ofthis article: This research was supported by the Technical University of Denmark and funding from Sonova AG (Stäfa, Switzerland).