
Abstract
The National Health Interview Survey (NHIS) data on self-reported trouble hearing and the use of hearing aids were examined for the 12 recent surveys from 2007 to 2018 for adults from 18 to 85+ years of age. The aggregate dataset for all years included data from 357,714 adult respondents. Sample size for annual data ranged from 22,058 (2008) to 36,798 (2014). The prevalence of self-reported trouble hearing and hearing aid use, both current use and ever-using hearing aids, are reported for males and females for each age decade. Measures of unmet hearing healthcare (HHC) need were derived from estimates of the prevalence of hearing aid use among those with self-reported trouble hearing. Logistic-regression analyses identified variables affecting the odds of having self-reported trouble hearing, of using or rejecting hearing aids, and of having unmet HHC needs. The results largely corroborate and extend the findings of recent analyses of data from the National Health and Nutrition Examination Survey (NHANES) for a similar period (2011–2020). Overall, for males, 18.5% (95% CI [18.2%–18.8%]) had self-reported trouble hearing and 76.6% [76.0%–77.2%] of these individuals had never used hearing aids and, for females 13.1% [12.9%–13.4%] had trouble hearing and 79.5% [78.9%–80.1%] of these individuals had never used hearing aids. Unmet HHC needs are highly prevalent in the United States and have been so for many years.
Keywords
Introduction
The Over the Counter Hearing Aid Act of 2017 and the final rule of the U.S. Food and Drug Administration (FDA) “Establishing Over-the-Counter Hearing Aids,” published on August 17, 2022 (federalregister.gov/d/2022-17230), created the opportunity for a new pathway through the Hearing Healthcare (HHC) system for adults with trouble hearing. Whereas the prevailing HHC system required the involvement of HHC professionals and an audiogram to receive hearing aids, the new pathway empowers the adult with perceived trouble hearing to seek hearing help directly and on their own. That is, both the initial Federal legislation and the final FDA rule identify adults with “perceived mild to moderate hearing loss” as candidates for over-the-counter (OTC) hearing aids. Evaluation of hearing by HHC professionals, typically captured by the audiogram, is not required.
As HHC in the U.S. embarks on an additional pathway to hearing help for adults with perceived mild to moderate hearing loss, it is important to benchmark the current state of HHC in the United States. In this way, the impact of this additional pathway on hearing help can be better evaluated in the future. To do this, data from the most recently available National Health and Nutrition Examination Surveys (NHANES) were analyzed and reported by Humes (2023). Here, similar analyses were performed using the data for another large national health survey under the auspices of the Centers for Disease Control (CDC) and the National Center on Health Statistics (NCHS), the National Health Interview Survey (NHIS). The NHIS is a large-scale cross-sectional household interview survey using a complex geographically clustered sampling design to yield results representative of the civilian noninstitutionalized U.S. population.
Whereas the NHANES data have included both self-reported trouble hearing from about 10,000 individuals in several two-year cycles, about half of whom also complete physical examinations and laboratory measures, the NHIS typically targeted about 25,000–30,000 people annually from 2007 to 2018. The first NHIS was completed in 1957 and, since 1960, it has been conducted by the NCHS. As noted on the CDC website (NHIS—About the National Health Interview Survey (cdc.gov)): The main objective of the NHIS is to monitor the health of the United States population through the collection and analysis of data on a broad range of health topics. A major strength of this survey lies in the ability to categorize these health characteristics by many demographic and socioeconomic characteristics.
In 2019, the NHIS underwent a thorough redesign with change in the content and structure of the survey from prior years (1997–2018). The re-design affected some of the questions of interest here, including the question about self-reported trouble hearing. In addition, bridge testing of data from the former survey format in 2018 and the redesigned survey in 2019 suggested that prevalence estimates may not be in exact agreement between survey versions (NCHS, 2020). As a result, the present analyses focused on the period 2007–2018, for which the key questions about trouble hearing and hearing aids were the same throughout.
The key questions of interest here pertained to self-reported trouble hearing and hearing aid use. The measure of trouble hearing was identical from 2007 to 2018 and was the same as that used in NHANES and other large-scale population studies (e.g., Dillard et al., 2022; Marrone et al., 2019), including some earlier analyses of annual NHIS data (McKee et al., 2018; Zelaya et al., 2015). For hearing aids, the first question asked whether the participant currently used hearing aids and, for those who answered “No,” a follow-up question asked whether the participant had ever used hearing aids. Those not currently using hearing aids but answering affirmatively to the question about ever-using hearing aids previously represent a subset of individuals who have rejected hearing aid use (or at least had discontinued using hearing aids at the time of the interview). Humes (2023) defined unmet HHC need as those who had self-identified as having trouble hearing but either had never used hearing devices or were not currently using hearing devices, in this case, hearing aids.
Overall, there is good agreement in prevalence estimates between NHANES and NHIS for many health conditions (Fahimi et al., 2008; Li et al., 2012). However, in several cases there are differences. For example, Hsia et al. (2020) analyzed responses from NHANES 2011–12, 2013–14, and 2015–16 for several health conditions that are typically included in analyses of hearing problems, such as self-reported smoking, diabetes, and hypertension, and compared the results to responses for the same questions that had been included in NHIS from 2011 to 2016. The prevalence of (current) smoking, diabetes, and hypertension was 1.15, 1.05, and 1.05 times higher in NHANES than in NHIS. For self-reported fair or poor health, the NHANES estimate was 1.38 times higher than that from NHIS. Ikeda et al. (2009) found NHANES estimates of trouble hearing to be about 1.6–1.8 times more prevalent for NHANES than for NHIS for males and females, respectively, for 1999–2004.
Given such discrepancies in prevalence between these two national datasets, it is important to get estimates of hearing-related problems and treatments from both datasets to establish a valid baseline for national HHC performance prior to the widespread availability of OTC hearing aids. Humes (2023) provided estimates from NHANES and the present analyses complement those using the larger aggregate NHIS dataset. The primary objectives of these analyses were to provide prevalence estimates, both aggregate and annual, for self-reported trouble hearing, hearing aid use, and derived unmet HHC needs for the period 2007–2018. Annual estimates were included to examine the consistency of prevalence estimates over this period. The results of the analysis of the NHIS dataset are compared to those for NHANES to obtain a more complete picture of the status of HHC for adults in the United States. Another objective of the present analyses was to gain a better understanding of the variables affecting the odds of having trouble hearing, taking up (and rejecting) hearing aids, and having unmet HHC needs.
Methods
The NHIS Datasets
The data used in these analyses were extracted using the IPUMS Health Surveys: National Health Interview Survey, Version 7.1 (Blewett et al., 2021). Details can be found at http://www.nhis.ipums.org. A total of 55 variables were extracted from the harmonized NHIS datasets for years 2007–2018. The hearing- and hearing-aid-related survey questions were consistent throughout this period, as were several of the other variables of interest.
Key design and demographic variables pertinent to the present analyses were: year (survey year), strata (for variance estimation), PSU (primary sampling unit, for variance estimation), sampweight (final basic annual weight for the sample respondent), astatflag (sample adult selected and has record), age (age in years but top-coded as 85 for those 85 years of age and older), sex, racenew (self-reported race), hispeth (Hispanic ethnicity), educ (educational attainment), and incfam07on (total combined family annual income). The variable sampweight is a variable generated by IPUMS and based on the final annual sample person weights assigned by the NCHS. It represents the inverse probability of sample person selection adjusted by the NCHS for non-response with post-stratification adjustments for age, race/ethnicity, and sex using the Census Bureau's population control totals.
The racenew and hispeth variables were recoded to form the same race/ethnicity categories as the RIDRETH3 variable in NHANES to facilitate comparisons across national surveys. The resulting race/ethnicity categories were as follows: (a) Mexican American (MA); (b) Other Hispanic (OH); (c) Non-Hispanic White (NHW); (d) Non-Hispanic Black (NHB); (e) Non-Hispanic Asian (NHA); and (f) Non-Hispanic Other race (Oth). The education measure was recoded into four levels of education as follows: (a) never attended school through 12th grade-no diploma (<HS); (b) high school graduate, general education diploma (GED) or equivalent (HS); (c) some college-no degree, associate degree (some Coll); and (d) bachelor's degree or higher (College degree). Age was recoded into age decades as follows: 18–29 (20), 30–39 (30), 40–49 (40), 50–59 (50), 60–69 (60), 70–79 (70), and 80–85+ (80) years. Finally, incfam07 was recoded into annual family income as follows: (a) ≤$49,999; (b) $50,000 to $99,999; and (c) ≥$100,000. Although more gradations of annual income from lowest to highest were desired, these three were the only income ranges that could be applied uniformly across the entire set of NHIS datasets.
In addition, responses to several health-related questions were extracted, focusing on those found previously to be pertinent to hearing. These included: diabeticev (Yes/No, ever told had diabetes), insulin (Yes/No, now taking insulin), diapills (Yes/No, now taking diabetic pills), hypertenev (Yes/No, ever told had hypertension), hyp2time (Yes/No, told had hypertension on 2 + times), smokev (Yes/No, ever smoked 100 cigarettes in life), smokefreqnow (smoke every day, some days, not at all), and smokestatus2 (cigarette smoking recode 2: current smoker with details, former, never). The respondent was considered positive for diabetes (+) if he or she responded “Yes” or “borderline” to diabeticev or “Yes” to insulin or diapills. For hypertension, a respondent was considered positive for hypertension or high blood pressure (HBP, +) if he or she responded “Yes” to either the hypertenev or hyp2time question. For smoking measures, the smokev and smokestatus2 variables were used to recode smoking as a value of 0 (−) corresponded to never smoking and values of 1 (+), 2 (++), or 3 (+++) corresponded to being a former smoker, a current some-day smoker, and a current every-day smoker, respectively.
For perceived trouble hearing, the question asked about the overall condition of hearing without a hearing aid (or other listening device) and included response options of excellent, good, a little trouble, moderate trouble, a lot of trouble, and deaf. For hearing aid use, the variables hrauses (now uses a hearing aid) and hraev (ever wore hearing aid) were also extracted. Those who answered hrauses affirmatively were designated as current hearing aid users and those who answered either hrauses or hraev affirmatively were considered to have ever used hearing aids.
Finally, some measures of activity and functional limitations pertaining to hearing were extracted. These variables were mainly used to validate the cut-off criterion separating those having no trouble hearing from those with trouble hearing. Two variables, lany and flany, were used to code affirmative responses to any of several queries about whether limitations were experienced in any of several common daily activities (lany), such as eating, bathing, dressing, household chores, doing necessary business, shopping, walking, and remembering, or were experienced in any of several specific functional activities (flany), such as going to movies, sporting events, attending clubs and meetings, going to parties, watching TV, listening to music, reading, sewing, sitting, standing, and grasping small objects. When a respondent answered affirmatively to any of these questions, they were asked by the interviewer to choose possible causes for such limitations from a set provided by the interviewer. Hearing was included as one of the possible causes of such limitations. The variables climhear and flhear coded the respondent's identification of hearing as being a contributing factor to the expressed activity or functional limitation, respectively, and were recoded here as 0 (limitations not due to hearing) or 1 (limitations due, at least in part, to hearing).
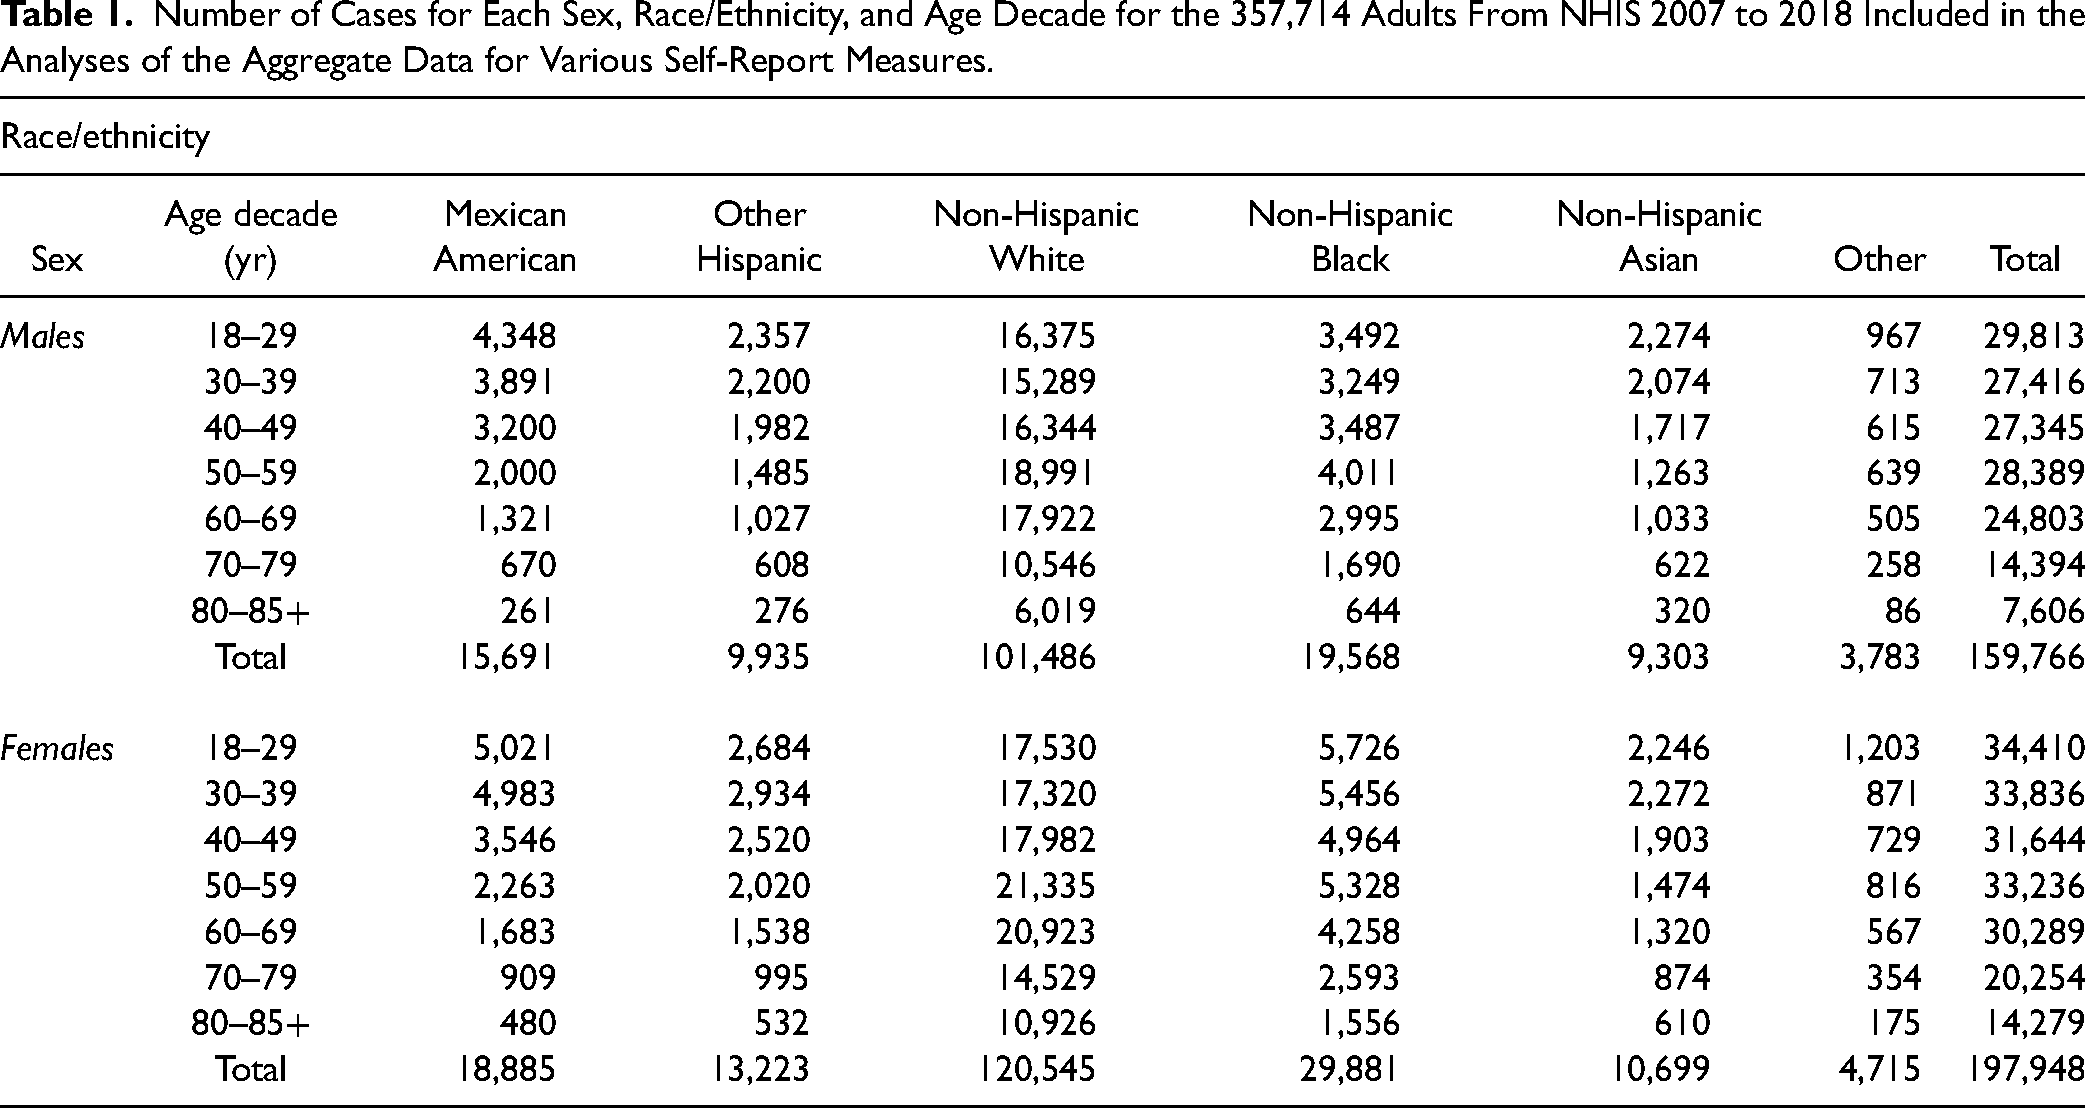
Data from 1,106,922 individuals were available for NHIS from 2007 to 2018, 357,714 of whom were adult respondents (18–85+ years of age). The distribution of sample respondents across sex, age, and race/ethnicity categories is provided in Table 1 and the population estimates appear in Table 2. For the annual data from 2007 to 2018, the lowest number of sample adult respondents took part in the 2008 NHIS (N = 21,781) whereas the greatest number participated in the 2014 NHIS (N = 36,697).
Number of Cases for Each Sex, Race/Ethnicity, and Age Decade for the 357,714 Adults From NHIS 2007 to 2018 Included in the Analyses of the Aggregate Data for Various Self-Report Measures.
Population-Weighted Percentages (95% Confidence Intervals, CI) for 357,714 Adults From NHIS 2007 to 2018. Based on an NHIS Total Population Estimate Over This Period of 309.8 Million, 236 Million Were ≥18 Years of Age.

Statistical Analyses
The NHIS is designed to yield a nationally representative sample, and these analyses used weights to produce national estimates. This includes use of the strata, PSU, and sampweight variables described above. The sample design and data weighting procedures are described in more detail elsewhere (Parsons et al., 2014). When annual data are reported, the sampweight values for that year were applied. When aggregate data are reported across the 12 surveys, sampweight/12 values were used. Point estimates and estimates of corresponding variance were calculated using SAS 9.4 (SAS Institute, Inc., Cary, NC) and the various complex-survey analysis tools included therein to account for the complex-survey design of the NHIS. The full dataset was included in the analyses. Restriction to sample respondents 18–85+ years of age was accomplished via domain or table specifications in the SAS analyses. Variance estimation used the recommended Taylor-series linearization method. All prevalence estimates in this report meet the NCHS standard of reliability (relative standard error less than or equal to 30%). For logistic-regression analyses, a minimum events-per-variable ratio of 10 is frequently recommended to ensure the stability of the solution (Harrell et al., 1984; Harrell et al., 1996; Peduzzi et al., 1996). None of the events-per-variable ratios in these analyses were below 20. All logistic-regression results reported used fully adjusted binary logistic-regression models for which the covariates were assumed to be orthogonal. Regression model parameters were estimated using maximum likelihood methods.
Results
Self-Reported Trouble Hearing
Figure 1 shows the population-weighted percentages for the responses to the question about the general condition of hearing or trouble hearing. In this and other figures, blue and pink vertical bars represent percentages for males and females, respectively. Unless noted otherwise, all error bars in this report represent the 95% CIs for the population estimates. For Figure 1, and all other figures with prevalence estimates, the results are available in tabular form in the supplementary materials. The panels in Figure 1 show the response percentages for each age group and the total. Whereas nearly all 18–29-year-olds reported either excellent or good hearing, the distribution changed with advancing age such that at least as many in the 80–85+ age range reported some degree of trouble hearing as reported excellent or good hearing

Population-weighted response percentages from NHIS 2007 to 2018 to the question about trouble hearing. Blue and pink bars represent data from males and females, respectively. Panels show data for each age and the total.
When using the same question, the default approach employed in other studies to separate those with trouble hearing from those without has been to consider responses of excellent or good as representing no trouble hearing and responses at or above a little trouble as representing trouble hearing. This has been the case for all prior analyses of NHIS self-report data (McKee et al., 2018; Zelaya et al., 2015) and for other population studies using this same survey question (Dillard et al., 2022; Marrone et al., 2019), including various NHANES reports (e.g., Choi et al., 2016; Goman et al., 2020; Humes, 2023; Kamil et al., 2015).
This boundary was further evaluated here to confirm its validity. To do so, the data on hearing-related activity and functional limitations were examined. Figure 2 shows the population estimates of the prevalence of such limitations among males and females within each age group and overall (ALL). To be counted among those with such limitations, the respondent had to indicate that any one of several limitations was experienced and that poor hearing was one of the factors contributing to the limitation identified. The prevalence of hearing-related activity or functional limitations was generally low, increased with age, and was typically greater for males than females within a given age group.

Population-weighted prevalence of activity or functional limitations for which hearing was identified as a contributing factor.
Figure 3 compares the population-weighted distributions of responses to the question about trouble hearing for two subgroups: those reporting no hearing-related activity or functional limitations (solid bars) and those reporting such limitations (striped bars). Results are shown separately for males (top panel) and females (bottom panel). Based on the 95% CIs shown for the percentages for each response and Chi-square analysis of the response distributions, those who reported at least a little trouble hearing had significantly more activity or functional limitations due to hearing [Rao-Scott Chi-square (5) = 14,971.5 and 21,954.6 for males and females, respectively; p < .0001]. The response representing a transition point between these two response distributions corresponds to having at least a little trouble hearing, the prevailing cut-off for dichotomization of self-reported trouble hearing.

Population-weighted percentages for the subgroup without reported hearing-related activity or functional limitations (solid bars) and the subgroup with such limitations (striped bars). Top shows data for males and bottom for females.
To further demonstrate the importance of self-reported trouble hearing to more global activity and functional limitations, binary logistic-regression analyses were performed. For these analyses, a given respondent included in the analyses had identified at least one hearing-related limitation in the activity domain, at least one hearing-related limitation in the functional domain, or at least one hearing-related limitation in either domain. Logistic-regression analyses were performed for each of these three definitions of broader hearing-related limitations. Figure 4 plots the resulting odds ratios (ORs) and 95% CIs for the fully adjusted population-weighted models. The Type-3 analyses of the main effects of each variable, as well as the ORs and 95% CIs, are provided in the Appendix (Tables A1 and A2).

Odds ratios (ORs) for the fully adjusted models with hearing-related activity (light grey circles), functional (dark grey circles), or either activity/functional (black circles) limitations as the dependent variable. For income, “k” = 1000s.
Regardless of how hearing-related limitations were defined, activity-only, functional-only, or either of these domains, the pattern of ORs in Figure 4 was nearly identical. Several variables either significantly increased [trouble hearing, race/ethnicity, age, education, diabetes, hypertension ] or significantly decreased (annual income) the odds of having hearing-related limitations for everyday activities and function. Self-reported trouble hearing increased the odds of reporting limitations to everyday activities and function by an order of magnitude more than the next largest factor (age of 80–85+ years relative to 18–29 years). Those in the trouble-hearing group were 50–60 times more likely to report limitations in everyday activities or function than those who reported excellent or good hearing. The results in Figures 3 and 4 corroborate the criterion used previously and here to separate the respondents into trouble-hearing and no-trouble-hearing subgroups for the remainder of these analyses.
Figure 5 shows population-weighted prevalence estimates for trouble hearing for males and females and for each age group and the aggregate data (ALL). Self-reported trouble hearing increased with age group for both males and females. For a given age group and overall, males more commonly reported trouble hearing than females. For males, overall, 18.5% (95% CI [18.2%–18.8%]) had self-reported trouble hearing and, for females, 13.1% [12.9%–13.4%] had trouble hearing.

Population-weighted prevalence estimates for trouble hearing for males and females.
Figure 6 shows the overall annual population-weighted prevalence estimates for self-reported trouble hearing for males and females. Although there are minor variations in prevalence across the 12 years examined, the prevalence for males remains consistently at about 18%–20% and that for females at about 12%–14%.

Annual prevalence estimates for trouble hearing from 2007 to 2018.
Next, binary logistic-regression analyses were performed with trouble hearing as the dependent variable. Analyses were performed for the aggregate data and separately for each of the three annual NHIS datasets (2007, 2012, 2018). The analyses of annual data were performed to examine the stability of the variables affecting the odds of having trouble hearing. (Tables A3 and A4 in the Appendix provide the Type-3 analyses of main effects and ORs, respectively.) Figure 7 shows the results for the aggregate data and Figure 8 shows the results for the annual data. Every variable was found to have a significant effect on the odds of having trouble hearing for each of the four fully-adjusted models and the pattern of ORs across the various effects is similar in Figures 7 and 8. Specifically, the odds of having trouble hearing were significantly higher for males than for females, for every age group relative to 18–29-year-olds, for those with less than a college degree relative to those with a college degree, for those with diabetes or hypertension (high blood pressure, HBP) relative to those who were negative for each health condition, and for those who ever smoked relative to those who never had. The odds of having trouble hearing were about 50% lower for most racial/ethnic groups relative to Non-Hispanic Whites (NHW) and about 80% lower for those making $50,000 or more annually compared to those making less than that amount. The data for the annual datasets in Figure 8 show that the logistic-regression models were fairly stable throughout this 12-year period, suggesting that possible cohort effects were small or non-existent, a pattern consistent with the annual prevalence estimates shown in Figure 6.
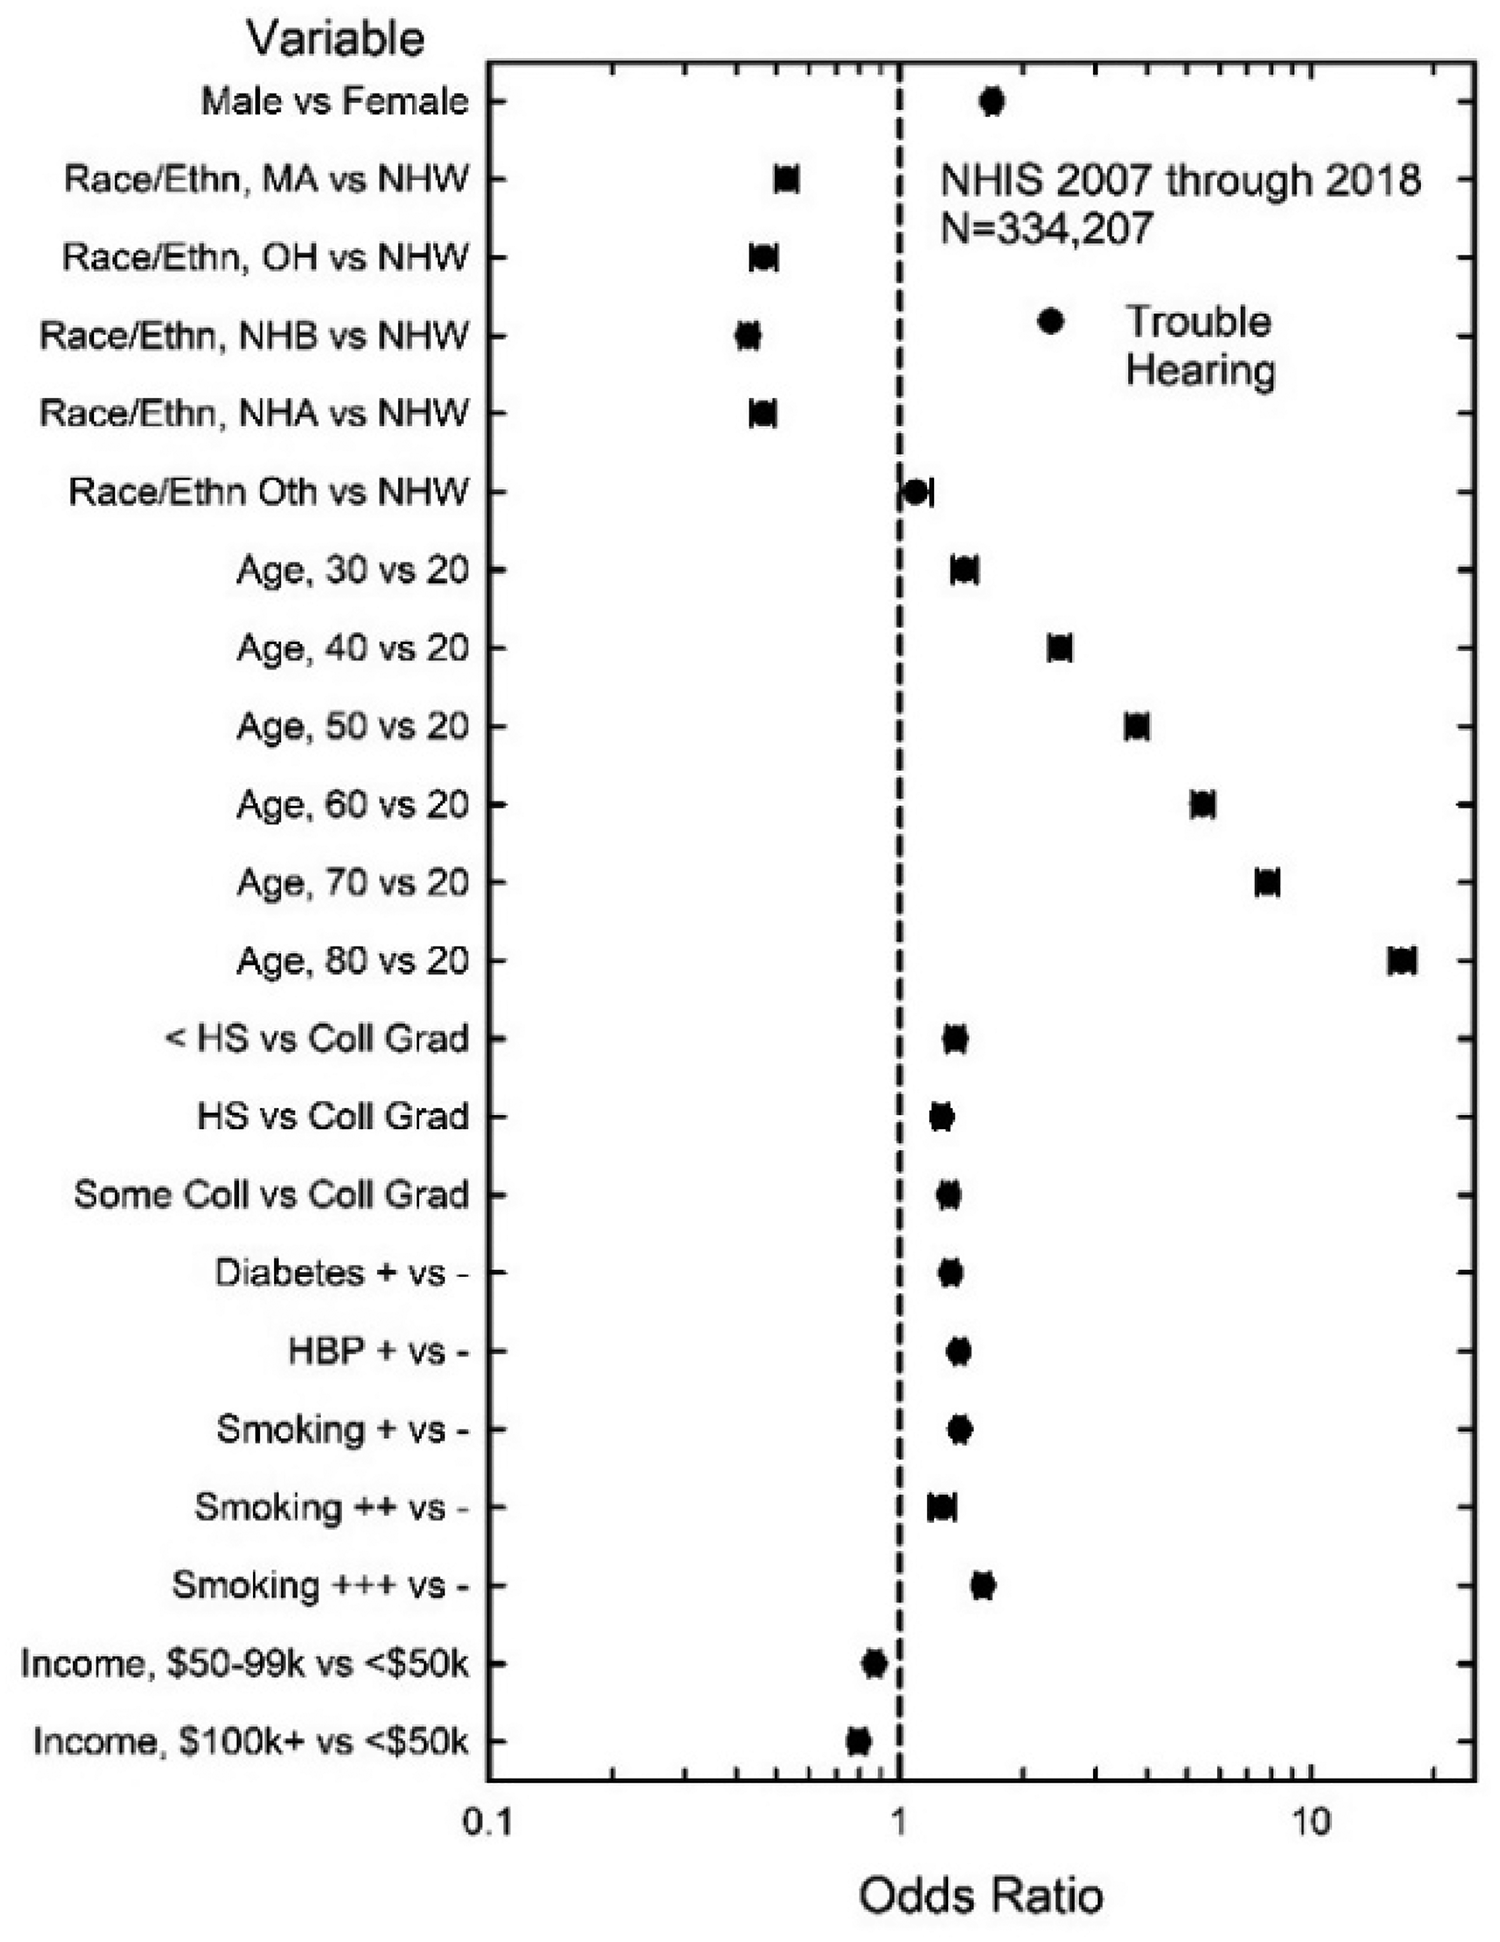
Fully adjusted ORs for trouble hearing for aggregate data.

Fully adjusted ORs for annual NHIS data for years 2007, 2012, and 2018.
Hearing Aid Use
The prevalence of hearing aid use is shown in Figure 9. For the NHIS, interviewers first asked about current hearing aid use and, for those who responded that they were not currently using hearing aids, the subsequent question was whether they had ever used hearing aids. The top panel in Figure 9 shows the population-weighted prevalence estimates for ever-using hearing aids, which includes those who were currently using hearing aids. The bottom panel shows the prevalence estimates for current hearing aid use only. For either definition of hearing aid use, the prevalence increased systematically with age and was higher for almost every age group for males than for females. For either sex or definition of hearing aid use, the overall prevalence never exceeded 5%.

Population-weighted prevalence estimates for hearing aid use defined either as ever or current use (top) or current use only (bottom).
The effects of various demographic and health-related measures on ever-using and currently using hearing aids were examined with binary logistic regression. The ORs for the fully adjusted model for each dependent variable are shown in Figure 10. (See Appendix Tables A5 and A6 for Type-3 analyses of main effects and ORs.) For ever-using hearing aids (filled circles in Figure 10), every effect included in the model was significant whereas for current hearing aid use all effects, except positive for diabetes and hypertension, were significant.

ORs and 95% CIs for ever-using hearing aids (filled circles) and currently using hearing aids (unfilled circles) from the fully adjusted logistic-regression model.
The ORs in Figure 10 are similar for the two definitions of hearing-aid use, but the ORs for ever-using hearing aids tended to be closer to 1 (no effect) than those for current hearing-aid use. The largest effect, with ORs of 30–35, was for self-reported trouble hearing. The next largest effect on hearing-aid use was for age. The odds of hearing-aid use were 15–20 times larger for those 80–85+ years of age than for those 18–29 years of age, but even for those in their 50 s the odds of hearing aid use were about double that for those 18–29 years of age. The next largest positive ORs were for sex, the odds of hearing aid use being about 50% greater for males than females, and for annual income, the odds of hearing aid use being about 15% higher for those with annual incomes of $50,000 or more than for those with incomes <$50,000. The effects that most significantly decreased the odds of using hearing aids were as follows: (a) race/ethnicity, with ORs of about 0.6 for Non-Hispanic Blacks relative to Non-Hispanic Whites; (b) level of education, with those having no college education having significantly lower odds of using hearing aids than college graduates; and (c) smoking status, current smokers, either some days (++) or every day (+++), having decreased odds of using hearing aids relative to those who never smoked (−). It is interesting that being a former smoker (+) did not significantly affect the odds of hearing aid use relative to those who never smoked; only those who were currently smoking had lower odds of using hearing aids. Continuing to smoke in the face of substantial evidence supporting the hazards to health may reflect a more cavalier attitude about maintaining one's health and well-being, hearing-aid use being another reflection of this attitude.
As noted, the survey questions about hearing-use began with the inquiry about current use and then, for those with responses of “No,” the next question was about whether the sample respondent had ever used hearing aids. Those who replied negatively to the first question but affirmatively to the second question were treated here as individuals who had tried and rejected hearing aids. There were 11,491 adult respondents who indicated that they currently used hearing aids and another 3,115 who were not current users but had used hearing aids sometimes for a total sample of 14,606 that could be used to identify variables affecting hearing-aid rejection. The overall population-weighted prevalence of ever-using hearing aids among those with trouble hearing was 22.1% (95% CI [21.7%–22.6%]). Among those with trouble hearing who had ever used hearing aids, 20.3% [19.4%–21.2%] were not currently using hearing aids; that is, they had rejected hearing aids. Binary logistic-regression analysis was performed to identify variables that affected the odds of rejecting hearing aids. Figure 11 shows the ORs for the fully adjusted model.

ORs and 95% CIs (error bars) for the fully adjusted logistic-regression model applied to the dataset of 14,606 adults who had rejected hearing aids.
Several variables significantly reduced the odds of hearing-aid rejection, age greater than 50 relative to 18–29-year-olds, and self-reported trouble hearing having the two largest effects, reducing the odds by about 50%–75%. Having an annual income of $50,000 or more significantly reduced the odds of rejecting hearing aids compared to those making less than $50,000 annually. Variables that increased the odds of hearing-aid rejection included sex, males being 40% more likely than females to reject hearing aids, and education level, those with a high-school diploma or less being 30%–50% more likely to reject hearing aids than those with a college degree. Although the ORs for Non-Hispanic Blacks relative to Non-Hispanic Whites and for current daily smoking relative to never smoking appear to be significant in Figure 11, these effects should not be considered given that the main effects of these variables were non-significant (p > .05) (see Tables A5 and A6 in the Appendix).
Unmet HHC Needs
The prevalence of unmet HHC needs was examined next. Of the 357,714 respondents, 61,431 were identified as having trouble hearing. This represents an overall population-weighted prevalence of 15.7% (95% CI: 15.5%–16.0%). Figure 12 shows the population-weighted prevalence estimates for unmet HHC needs when meeting those needs is defined either as ever-using hearing aids (top panel) or currently using hearing aids (bottom panel).

Population-weighted prevalence of unmet HHC needs for males and females for each age group and overall for those who ever used hearing aids (top) and current hearing-aid users (bottom).
Unmet HHC needs were highest and constant at about 95% from 18 to 49 years of age and then decreased steadily for each successive age group, with the minimum unmet HHC needs observed for the group 80–85+ years of age. Females tended to have a higher prevalence of unmet HHC needs, especially among those 60 years of age and older. Both patterns in the prevalence data are attributable to the higher prevalence of hearing-aid use among older adults and among males (Figure 9). Finally, comparing the prevalence estimates between the two panels in Figure 12, those in the lower panel, based on needs being met through current hearing-aid use, were consistently slightly higher than those in the upper panel, for which meeting HHC need was based on ever-using hearing aids. Overall, the prevalence of unmet HHC needs was about 80% when defined based on ever-using hearing aids and about 83% when defined based on current hearing aid use.
Figure 13 shows the annual prevalence values for unmet HHC needs for 2007–2018 when either currently using hearing aids (bottom panel) or ever-using hearing aids (top panel) was the criterion used to define unmet HHC needs. The pattern of prevalence values over time is similar in the two panels. High prevalence of unmet HHC needs, typically approximating 80%–85%, is apparent throughout this period with a slight decrease in the prevalence of unmet HHC needs by about 5 percentage points in recent years. The slight decrease in the prevalence of unmet HHC needs in recent years can be attributed to a slight increase in hearing-aid usage over this same period. Regardless of the definition of hearing-aid use and whether males or females are considered, at least 75% of U.S. adults 18–85+ years of age with self-reported trouble hearing have unmet HHC needs.

Population-weighted annual prevalence estimates for unmet HHC needs for males and females based either on ever-using hearing aids (top) or currently using hearing aids (bottom) as the criterion for meeting needs.
The variables that affected the presence of unmet HHC needs were examined using binary logistic-regression analyses. Trouble hearing was not included as a variable because it was used to define the sample of interest; that is, the dataset analyzed consisted of those with trouble hearing who either did or did not use hearing aids. The ORs and 95% CIs for the fully adjusted logistic-regression model are shown in Figure 14 for the two definitions of unmet HHC needs. (See Tables A7 and A8 in the Appendix for Type-3 analysis of main effects and ORs.) The pattern of significant effects is similar for the two definitions. The variable with the largest effect in reducing the odds of having unmet HHC needs was age, all those 50 years of age or older having odds that were 50%–90% lower than for 18–29-year-olds. The variables with the next largest reduction of the odds for the presence of unmet HHC needs were sex, males having odds that were 20%–30% lower than for females, and annual income, those making $50,000 or more having odds that were 15%–30% lower than for those making <$50,000. Variables that increased the odds of having unmet HHC needs were as follows: (a) race/ethnicity, Mexican Americans (MA) and Non-Hispanic Blacks both having significantly greater odds of having unmet HHC needs than Non-Hispanic Whites; (b) level of education, those having less than a high-school diploma (<HS) or a high-school diploma (HS) having about 20%–60% higher odds of having unmet HHC needs than those with a college degree; and (c) smoking, those currently smoking daily (+++) or some days (++) having 20%–50% higher odds of having unmet HHC needs than those who never smoked (−).

ORs and 95% CIs for either definition of unmet HHC needs from the fully adjusted logistic-regression model applied to a dataset of 57,024 adults with trouble hearing.
Discussion
The present results on the prevalence of self-reported trouble hearing are generally consistent with the data from prior reports using the same or similar survey questions and NHIS data (Caban et al., 2005; McKee et al., 2018; Zelaya et al., 2015). Of these three prior NHIS reports, the earliest two included sample adults ranging in age from 18 to 80+ years whereas McKee et al. (2018) restricted the analyses to those >65 years of age. Caban et al. (2005) analyzed NHIS data from 1997 to 2002 and reported an overall prevalence of trouble hearing of 16.4%. The same question as for the present analyses was used, but the responses were reduced to four choices: good, a little trouble, a lot of trouble, and deaf, with trouble hearing again defined as those with at least a little trouble. That is, the boundary criterion between no-trouble and trouble hearing was between responses of good and a little trouble, as in the present report. Zelaya et al. (2015) reported an overall prevalence of trouble hearing of 16.8% for the NHIS 2014 dataset which used the identical question, response options, and response criterion for trouble hearing as in this report. The prevalence values reported in Zelaya et al. (2015) for the 2014 NHIS are identical to those found here for that same year but as shown in Figure 6, those for 2014 were slightly higher than for all other years examined in this report. In the present report, the aggregate data yielded an overall prevalence of trouble hearing of 15.7% (95% CI [15.5%–16.0%]) which is in good agreement with Caban et al. (2005), despite slight differences in the responses available, and with Zelaya et al. (2015) when placed in the context of the full set of annual prevalence estimates (Figure 6). In the present analyses, the overall prevalence of trouble hearing was 18.5% (18.2%, 18.8%) for males and 13.1% (12.9%, 13.4%) for females. Moreover, as shown in Figure 6, these prevalence estimates for males and females did not vary markedly from year to year over the period 2007–2018.
The effects of sex, age, and level of education on self-reported trouble hearing were all found to be significant here. These effects and their direction are consistent with prior analyses for various NHIS datasets (Caban et al., 2005; Zelaya et al., 2015). Specifically, self-reported trouble hearing is more prevalent for males than females, for older adults than younger adults, and for less well-educated adults than for better-educated adults. Generally, the same effects have been observed in NHANES datasets for both self-reported trouble hearing (Choi et al., 2016; Goman et al., 2020; Humes, 2023; Kamil et al., 2015), as defined here, and audiometrically defined hearing loss (Agrawal et al., 2008, 2009; Hoffman et al., 2010, 2012; Hoffman, Dobie, Losonczy, Themann & Flamme, 2017; Humes, 2023). Except for Humes (2023), the prior analyses of NHANES datasets for self-reported trouble hearing have been confined to adults > 60 years of age.
The prevalence estimates of hearing-aid use in this report agree generally with prior national estimates (Bainbridge & Ramachandran, 2014; Chien & Lin, 2012; Zelaya et al., 2015). This was also the case for the effects of various demographic variables on hearing-aid uptake, the effects of sex and age being examined most frequently in the past. In the present analyses, the odds of taking up hearing aids were greater for males than females and for older adults than younger adults (Figure 9). The present report also found that several race/ethnicity groups (compared to Non-Hispanic Whites), as well as those with less than college education (compared to those with a college degree), were less likely to take up hearing aids. Interestingly, those who were currently smoking, either daily or some days, were also significantly less likely to use hearing aids than those who had quit smoking or never smoked (Figure 10). Perhaps this reflects a general attitude about healthcare and the investment of time, effort, or money needed to maintain one's health and well-being.
The analyses of NHANES data by Bainbridge and Ramachandran (2014) showed that the odds of hearing-aid uptake were lower for those with lower annual incomes. The present analyses found annual family income to have a slight but significant effect on hearing-aid uptake. The odds for current hearing aid use were about 22% higher for those with annual incomes of $50,000 or more compared to those with incomes less than $50,000. In the recent analyses of NHANES data by Humes (2023), however, income was not found to affect uptake. In that analysis, the pooling of NHANES data from 2011–12 and 2015–16 with 2017–20 resulted in the family-income-to-poverty ratio being the only available income metric for all three datasets. The odds of currently using hearing aids were about 50% lower for the two lowest income-to-poverty ratios relative to the highest ratio in Humes (2023), but the ORs did not quite reach significance (95% CI upper limits of 1.18 and 1.06 for the two lowest income-to-poverty ratios).
This paper also confirmed the pre-eminent importance of perceived trouble hearing for hearing-aid uptake (Figure 10). Numerous studies support perceived hearing difficulty as the primary driver for hearing-aid uptake (e.g., Humes, 2021b, 2023; Knudsen, Oberg, Nielsen, Naylor & Kramer, 2010; Laplante-Levesque, Hickson & Worrall, 2012; Pronk et al., 2017; Ratanjee-Vanmali, Swanepoel, & Laplante-Levesque, 2019; Sawyer, Armitage, Munro, Singh, & Dawes, 2019; Simpson, Matthews, Cassarly, & Dubno, 2019). The present NHIS data, along with the NHANES data in Humes (2023), provide U.S. national data in support of the critical importance of perceived hearing difficulties to hearing-aid uptake.
Although there was good general agreement of the present prevalence estimates of trouble hearing with those in the literature, the prevalence of self-reported trouble hearing for NHIS datasets has been found to be lower than in NHANES data sets using identical questions and response scales (Ikeda et al., 2009). This was also observed here, as shown in Figure 15, which compares population-weighted prevalence estimates derived in this report (solid bars) for trouble hearing to those derived by Humes (2023) for a NHANES dataset overlapping in time with the NHIS dataset included here (striped bars). The discrepancy in prevalence estimates is substantial for each age group and overall, NHANES yielding prevalence estimates for trouble hearing that are about 1.4–1.5 times higher than for NHIS. Even larger discrepancies in the prevalence of self-reported trouble hearing between NHIS and NHANES were reported for 1999–2004 by Ikeda et al. (2009).
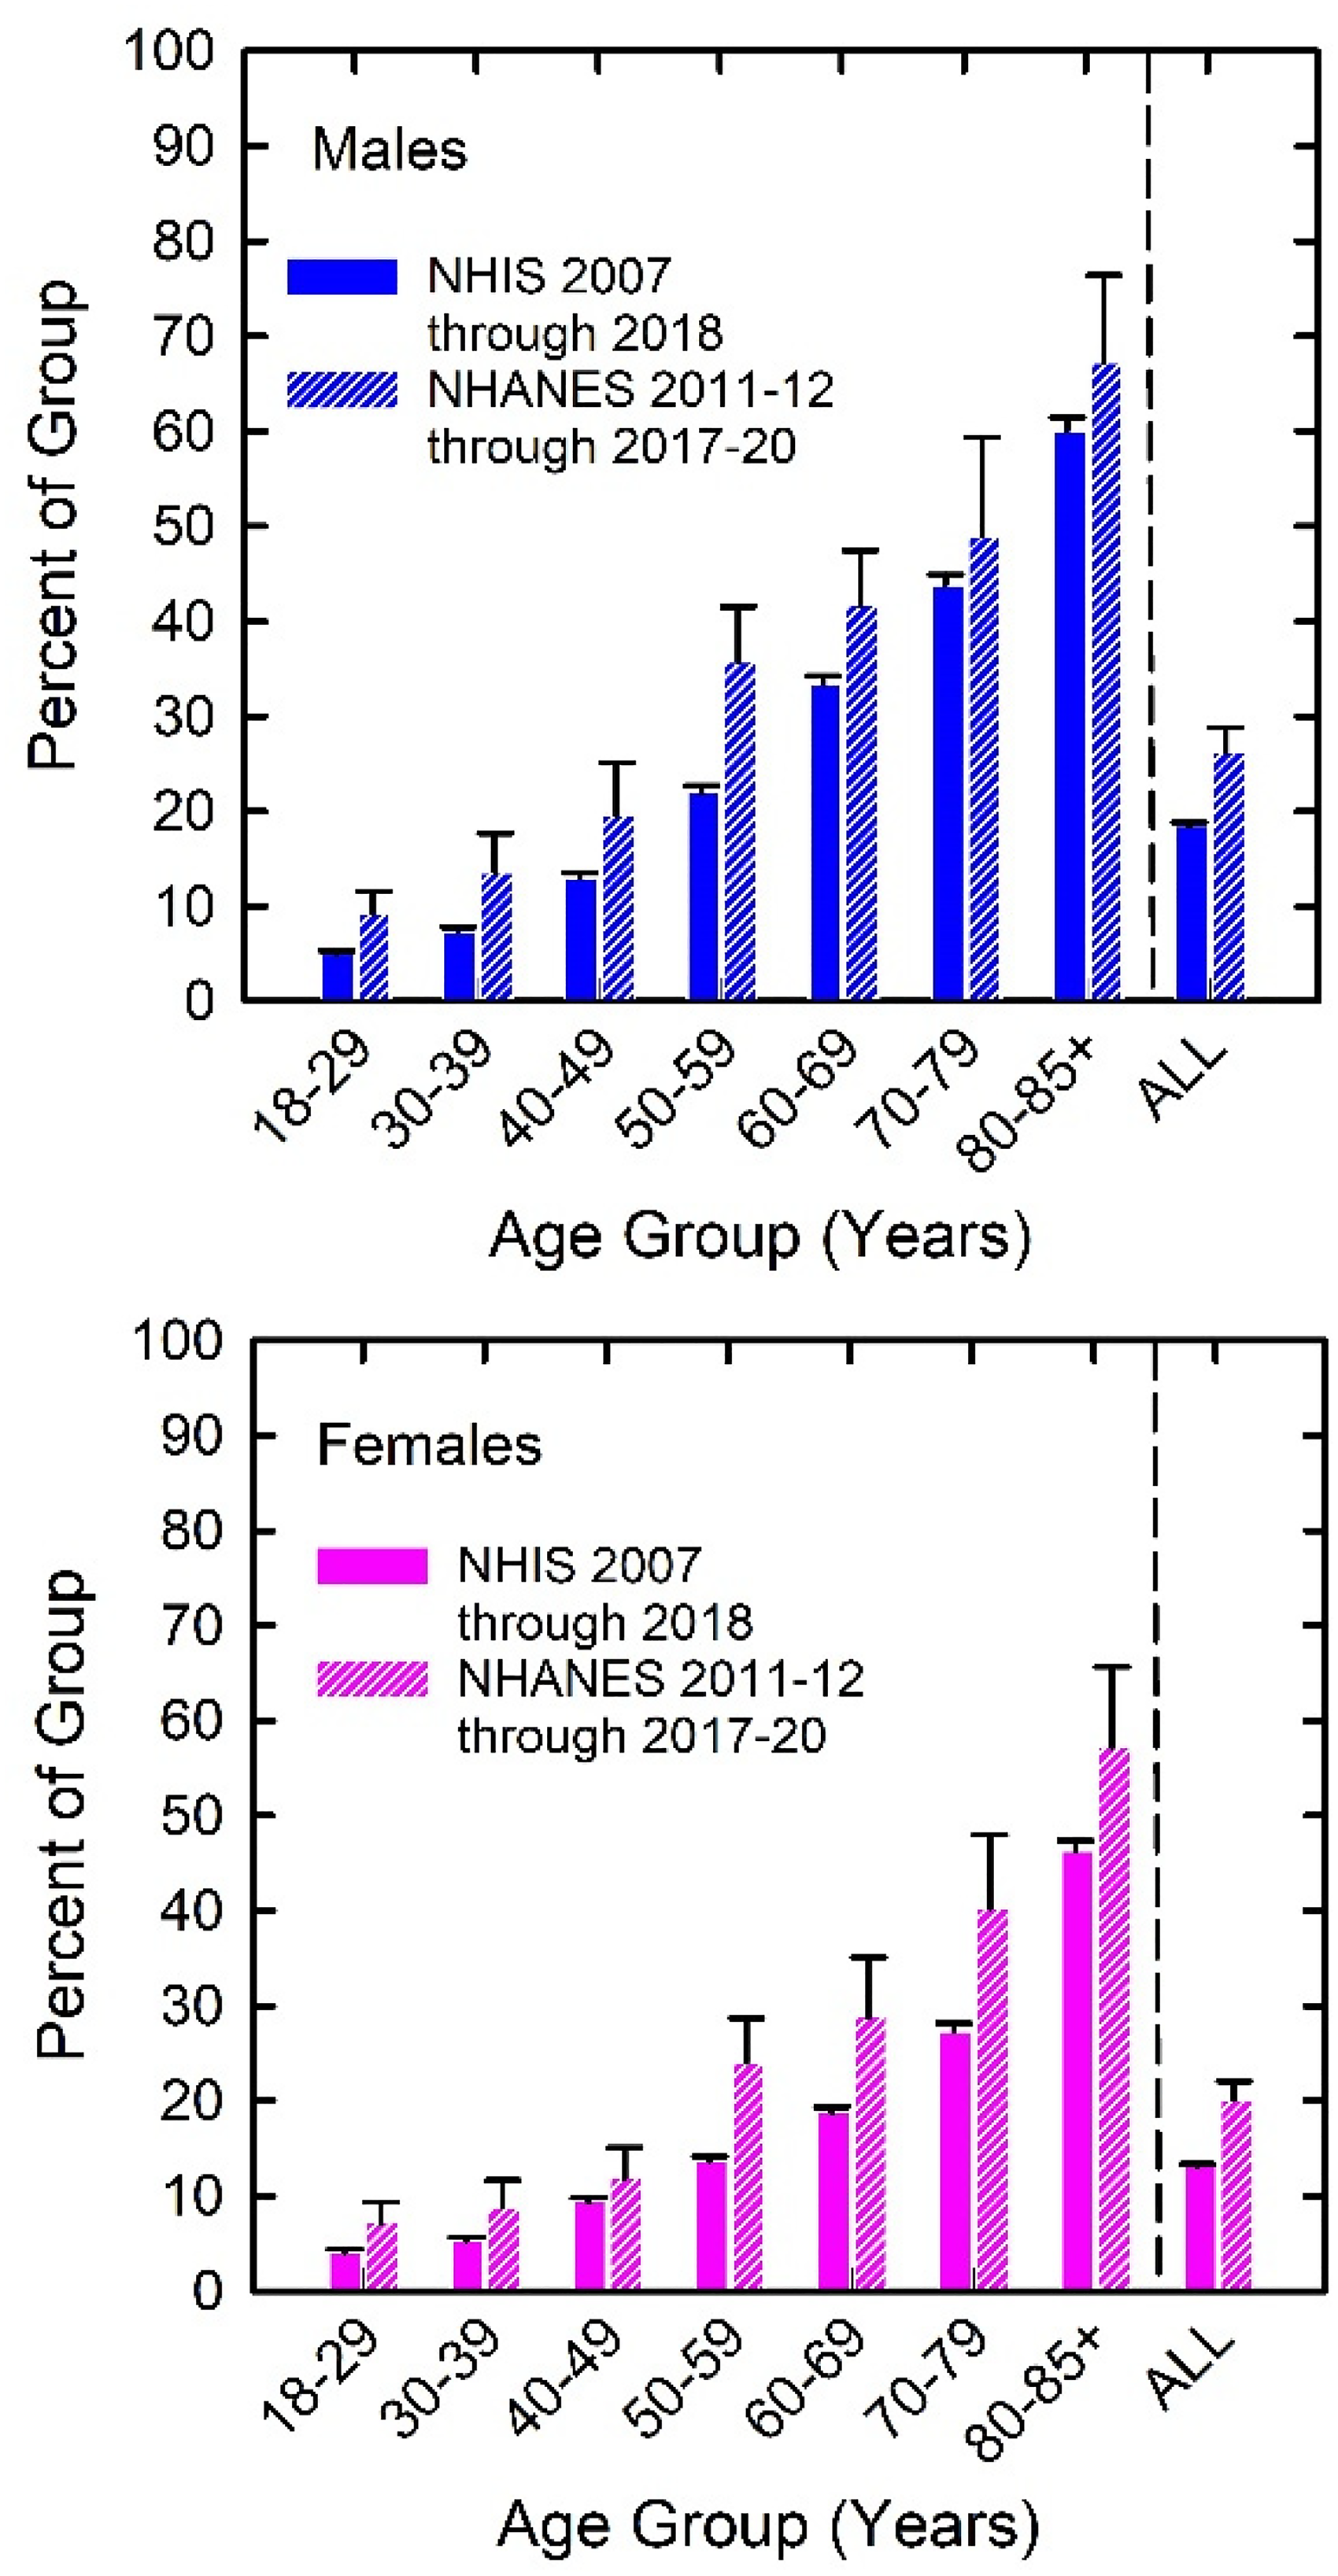
Population-weighted prevalence estimates for trouble hearing from NHIS (this report) and from NHANES 2011–12, 2015–16, and 2017–20 from Humes (2023). Top panel shows results for males and bottom panel shows results for females.
The reasons for this discrepancy in U.S. national prevalence estimates are unclear, although some have speculated about this in other contexts (Flegal et al., 2019). This discrepancy is not trivial but its affect on unmet HHC needs is muted somewhat by corresponding differences in the prevalence of hearing-aid use between NHANES and NHIS. When the NHIS prevalence estimates in Figure 9 are compared to similar estimates from NHANES (Humes, 2023), the NHANES estimates are about 1.2 times higher overall. As defined here, unmet HHC need is based on the prevalence of trouble hearing and hearing-aid use, both of which tend to be higher in the NHANES data than in the NHIS data, although to different degrees.
In this report of NHIS data and in the report of Humes (2023) for NHANES data, about 80%–85% of those with trouble hearing have unmet needs when defined as never-using hearing aids. This estimate is consistent with the finding of Zelaya et al. (2015) for the 2014 NHIS dataset. Largely due to the difference in the prevalence estimates for trouble hearing between NHIS and NHANES, as shown in Figure 15, the estimated number of adults with unmet HHC needs is much greater when using the NHANES data than when using the NHIS data. This is shown in Figure 16, which shows the estimated number of males and females with unmet HHC needs from the present analyses of the NHIS data (vertical bars) and corresponding estimates from Humes (2023) for the NHANES 2011–12, 2015–16, and 2017–20 data (circles). Note, however, that despite the sizable differences in overall numbers, these estimates agree in terms of the relative distribution of the number of people with unmet HHC needs, the peak occurring for those 50–69 years of age. Targeting these age groups for use of OTC hearing aids may have the greatest impact on reducing the number of U.S. adults with unmet HHC needs.

Estimates of number of U.S. adults with unmet HHC needs from the present analyses of NHIS data (vertical bars) and analyses of NHANES data from Humes (2023; circles). Error bars for current NHIS estimates represent one standard error, many not visible due to small values.
Only about 20%–25% of those with perceived trouble hearing had ever used hearing aids. As shown in Figure 10, the single largest factor driving hearing aid uptake is perceived trouble hearing. Most of the other significant factors, such as age, sex, race/ethnicity, level of education, and annual income, are not malleable. Perceived trouble hearing, on the other hand, is possible to shape by making individuals more aware of the impact of trouble hearing on everyday function. The hope would be that through greater awareness of the importance of hearing, more of those with trouble hearing would seek help through hearing aids. Until now, generally, it has been impossible for those with trouble hearing to do so directly. Those with perceived trouble hearing must also be empowered and encouraged to act directly on those perceptions by seeking help. The availability of OTC hearing aids and the additional HHC pathway created from the availability of these devices allow adults with perceived mild-to-moderate hearing loss to act directly and quickly to reduce trouble hearing. It is unlikely, however, that simply flooding the market with less expensive OTC hearing aids will in and of itself reduce the unmet HHC needs identified here. Support systems will likely be needed to enable adults with perceived trouble hearing to identify themselves as candidates for OTC hearing aids and to support them in the fitting, use, and maintenance of these devices (e.g., Convery, Keidser, Hickson, & Meyer 2019; Convery, Keidser, Seeto, & McLelland, 2017; Ferguson et al., 2021). It has been demonstrated that even those first-time hearing aid wearers fitted by audiologists in the prevailing HHC system benefit from easily accessible supplementary educational materials (Ferguson et al., 2016). Failure to provide such support may result in this new pathway in the HHC system ultimately having a minimal positive impact in reducing unmet HHC needs.
It is not realistic to expect this new pathway to eliminate unmet HHC needs entirely. Estimates from research on self-fit hearing aids suggest that positive outcomes, including the likely purchase of the devices, may meet HHC needs for about 50%–60% of those with unmet needs (e.g., Convery et al., 2017; Humes et al., 2017, 2019). Nonetheless, meeting the needs of even half of those adults with perceived trouble hearing represents a substantial improvement in the HHC system.
Although the focus here was on the measure of trouble hearing included in the NHIS interviews, it is not necessarily the best tool to use for the determination of perceived mild-to-moderate hearing difficulty. It was the only tool available in the NHIS 2007–2018 dataset for self-reported hearing loss, and it is a reasonable tool to use for large-scale population estimates of trouble hearing. It was demonstrated here to be tied to differences in activity and functional limitations as well (Figures 3 and 4), key components of the WHO model of health and wellness (WHO, 2001). Humes (2023) demonstrated that this simple measure was also related to self-reported difficulty conversing in noise and frustration with hearing. It is not clear, however, whether a single-item tool for the identification of trouble hearing would be reliable to use on an individual basis. Humes (2021a) suggested that the 10-item Hearing Handicap Inventory for the Elderly-Screen (HHIE-S; Ventry & Weinstein, 1982, 1983), a tool with proven reliability and validity, would be a better alternative. Suggestions were also offered there as to how this tool could be used as part of an online assessment system that administered and scored the test and then, based on the measured score, offered suggestions for the next steps to follow to reduce perceived hearing difficulties. An online system to reliably measure candidacy for OTC hearing aids coupled with an online system to deliver support, as in Ferguson et al. (2021), appear to provide the best chances for the successful implementation of this additional HHC pathway in the United States.
A limitation of the present analyses pertains to the measures of hearing-aid use, which were used, in turn, to estimate unmet HHC needs. Here, Yes/No responses to queries about currently or ever-using hearing aids were all that were available. For those replying that hearing aids were currently being used, additional data about the frequency of daily usage, both number of hours per day and number of days per week, were not available. It is unlikely that all of those who indicated current hearing-aid use were using their devices frequently or optimally. In this case, the ultimate estimates of unmet HHC needs are likely to be conservative estimates of those needs.
Conclusions
The analyses of NHIS data from 2007 to 2018 confirm and extend prior findings on perceived trouble hearing, the use of hearing aids, and unmet HHC needs among U.S. adults. The population estimates derived from hundreds of thousands of adults confirmed the pre-eminent importance of perceived trouble hearing for hearing-aid uptake and retention, a finding previously confined largely to smaller-scale clinical studies. About 18% of males and 13% of females have perceived trouble hearing yet only about 20%–25% of these adults have sought out and obtained hearing aids. It is hoped that, with proper support, the additional OTC-hearing-aid pathway in the HHC system in the United States can meet the needs of millions of adults with currently unmet HHC needs.
Supplemental Material
sj-xlsx-1-tia-10.1177_23312165231160967 - Supplemental material for U.S. Population Data on Self-Reported Trouble Hearing and Hearing-Aid Use in Adults: National Health Interview Survey, 2007–2018
Supplemental material, sj-xlsx-1-tia-10.1177_23312165231160967 for U.S. Population Data on Self-Reported Trouble Hearing and Hearing-Aid Use in Adults: National Health Interview Survey, 2007–2018 by Larry E. Humes in Trends in Hearing
Supplemental Material
sj-xlsx-2-tia-10.1177_23312165231160967 - Supplemental material for U.S. Population Data on Self-Reported Trouble Hearing and Hearing-Aid Use in Adults: National Health Interview Survey, 2007–2018
Supplemental material, sj-xlsx-2-tia-10.1177_23312165231160967 for U.S. Population Data on Self-Reported Trouble Hearing and Hearing-Aid Use in Adults: National Health Interview Survey, 2007–2018 by Larry E. Humes in Trends in Hearing
Supplemental Material
sj-xlsx-3-tia-10.1177_23312165231160967 - Supplemental material for U.S. Population Data on Self-Reported Trouble Hearing and Hearing-Aid Use in Adults: National Health Interview Survey, 2007–2018
Supplemental material, sj-xlsx-3-tia-10.1177_23312165231160967 for U.S. Population Data on Self-Reported Trouble Hearing and Hearing-Aid Use in Adults: National Health Interview Survey, 2007–2018 by Larry E. Humes in Trends in Hearing
Supplemental Material
sj-xlsx-4-tia-10.1177_23312165231160967 - Supplemental material for U.S. Population Data on Self-Reported Trouble Hearing and Hearing-Aid Use in Adults: National Health Interview Survey, 2007–2018
Supplemental material, sj-xlsx-4-tia-10.1177_23312165231160967 for U.S. Population Data on Self-Reported Trouble Hearing and Hearing-Aid Use in Adults: National Health Interview Survey, 2007–2018 by Larry E. Humes in Trends in Hearing
Supplemental Material
sj-xlsx-5-tia-10.1177_23312165231160967 - Supplemental material for U.S. Population Data on Self-Reported Trouble Hearing and Hearing-Aid Use in Adults: National Health Interview Survey, 2007–2018
Supplemental material, sj-xlsx-5-tia-10.1177_23312165231160967 for U.S. Population Data on Self-Reported Trouble Hearing and Hearing-Aid Use in Adults: National Health Interview Survey, 2007–2018 by Larry E. Humes in Trends in Hearing
Supplemental Material
sj-xlsx-6-tia-10.1177_23312165231160967 - Supplemental material for U.S. Population Data on Self-Reported Trouble Hearing and Hearing-Aid Use in Adults: National Health Interview Survey, 2007–2018
Supplemental material, sj-xlsx-6-tia-10.1177_23312165231160967 for U.S. Population Data on Self-Reported Trouble Hearing and Hearing-Aid Use in Adults: National Health Interview Survey, 2007–2018 by Larry E. Humes in Trends in Hearing
Supplemental Material
sj-xlsx-7-tia-10.1177_23312165231160967 - Supplemental material for U.S. Population Data on Self-Reported Trouble Hearing and Hearing-Aid Use in Adults: National Health Interview Survey, 2007–2018
Supplemental material, sj-xlsx-7-tia-10.1177_23312165231160967 for U.S. Population Data on Self-Reported Trouble Hearing and Hearing-Aid Use in Adults: National Health Interview Survey, 2007–2018 by Larry E. Humes in Trends in Hearing
Supplemental Material
sj-xlsx-8-tia-10.1177_23312165231160967 - Supplemental material for U.S. Population Data on Self-Reported Trouble Hearing and Hearing-Aid Use in Adults: National Health Interview Survey, 2007–2018
Supplemental material, sj-xlsx-8-tia-10.1177_23312165231160967 for U.S. Population Data on Self-Reported Trouble Hearing and Hearing-Aid Use in Adults: National Health Interview Survey, 2007–2018 by Larry E. Humes in Trends in Hearing
Supplemental Material
sj-xlsx-9-tia-10.1177_23312165231160967 - Supplemental material for U.S. Population Data on Self-Reported Trouble Hearing and Hearing-Aid Use in Adults: National Health Interview Survey, 2007–2018
Supplemental material, sj-xlsx-9-tia-10.1177_23312165231160967 for U.S. Population Data on Self-Reported Trouble Hearing and Hearing-Aid Use in Adults: National Health Interview Survey, 2007–2018 by Larry E. Humes in Trends in Hearing
Supplemental Material
sj-xlsx-10-tia-10.1177_23312165231160967 - Supplemental material for U.S. Population Data on Self-Reported Trouble Hearing and Hearing-Aid Use in Adults: National Health Interview Survey, 2007–2018
Supplemental material, sj-xlsx-10-tia-10.1177_23312165231160967 for U.S. Population Data on Self-Reported Trouble Hearing and Hearing-Aid Use in Adults: National Health Interview Survey, 2007–2018 by Larry E. Humes in Trends in Hearing
Footnotes
Acknowledgments
Use of the Indiana University High-Performance Computing systems and the Integrated Public Use Microdata Series (IPUMS-NHIS) system were critical to the analyses performed here.
Declaration of Conflicting Interests
The author(s) declared no potential conflicts of interest with respect to the research, authorship, and/or publication of this article.
Funding
The author(s) received no financial support for the research, authorship, and/or publication of this article.
Supplemental Material
Supplemental material for this article is available online.
References
Supplementary Material
Please find the following supplemental material available below.
For Open Access articles published under a Creative Commons License, all supplemental material carries the same license as the article it is associated with.
For non-Open Access articles published, all supplemental material carries a non-exclusive license, and permission requests for re-use of supplemental material or any part of supplemental material shall be sent directly to the copyright owner as specified in the copyright notice associated with the article.