
Abstract
Electroencephalography could serve as an objective tool to evaluate hearing aid benefit in infants who are developmentally unable to participate in hearing tests. We investigated whether speech-evoked envelope following responses (EFRs), a type of electroencephalography-based measure, could predict improved audibility with the use of a hearing aid in children with mild-to-severe permanent, mainly sensorineural, hearing loss. In 18 children, EFRs were elicited by six male-spoken band-limited phonemic stimuli––the first formants of /u/ and /i/, the second and higher formants of /u/ and /i/, and the fricatives /s/ and /∫/––presented together as /su∫i/. EFRs were recorded between the vertex and nape, when /su∫i/ was presented at 55, 65, and 75 dB SPL using insert earphones in unaided conditions and individually fit hearing aids in aided conditions. EFR amplitude and detectability improved with the use of a hearing aid, and the degree of improvement in EFR amplitude was dependent on the extent of change in behavioral thresholds between unaided and aided conditions. EFR detectability was primarily influenced by audibility; higher sensation level stimuli had an increased probability of detection. Overall EFR sensitivity in predicting audibility was significantly higher in aided (82.1%) than unaided conditions (66.5%) and did not vary as a function of stimulus or frequency. EFR specificity in ascertaining inaudibility was 90.8%. Aided improvement in EFR detectability was a significant predictor of hearing aid-facilitated change in speech discrimination accuracy. Results suggest that speech-evoked EFRs could be a useful objective tool in predicting hearing aid benefit in children with hearing loss.
Introduction
Roughly 2 per 1,000 babies who undergo hearing screening soon after birth are diagnosed with hearing loss. If an oral–aural approach of communication is chosen, hearing aids are fit as early as 2–3 months of age to improve access to speech (Joint Committee of Infant Hearing, 2019; Sininger et al., 2009). However, at such young ages, babies are not developmentally ready to participate in behavioral hearing tests that can evaluate the benefit hearing aids aim to provide. Since access to speech is a key predictor of speech and language outcomes (McCreery et al., 2017; Stiles et al., 2012; Tomblin et al., 2014), early assessment of hearing aid benefit is essential to instigate any changes in intervention. Acknowledgment of this clinical need has led to the development of objective electroencephalogram (EEG)-based hearing aid benefit measures that do not necessitate active participation of the listener (Easwar et al., 2015b; Purdy et al., 2005). The purpose of the present study was to evaluate the usefulness of one such proposed measure, the speech-evoked envelope following response (EFR), in assessing hearing aid benefit in children with permanent hearing loss.
Speech-evoked EFRs reflect neural activity phase-locked to envelope periodicity in phonemes. Naturally produced and synthetic vowels can readily elicit EFRs at the fundamental frequency of the voice (f0)—the frequency of the envelope created by the harmonics (Aiken & Picton, 2006; Greenberg, 1980; Skoe & Kraus, 2010). Voice f0 is represented in the fine structure envelope caused by beating between adjacent pairs of voice harmonics. Compared to other objective hearing aid benefit measures like cortical auditory-evoked potentials (CAEPs) that use brief phonemes as the stimulus along with interstimulus (silent) intervals of ∼ 1 s (e.g., Chang et al., 2012; Zhang et al., 2014), EFRs have been of interest for measuring hearing aid benefit because the stimulus can resemble running speech (using consonant vowel clusters; Easwar et al., 2015a; 2015b). Use of a stimulus that resembles running speech in structure could, in turn, facilitate accurate representation of nonlinear hearing aid function during regular device use at the time of testing (Easwar et al., 2012; Scollie & Seewald, 2002; Stelmachowicz et al., 1996, although see Stone et al., 2019). The principle of using EFRs for measuring hearing aid benefit is similar to that of using tone-evoked EFRs for hearing assessment (e.g., ASSRs—auditory steady-state responses); the tone frequency is considered audible when the tone stimulus (often amplitude-modulated) can elicit an EFR at the modulation (i.e., envelope) frequency. However, compared to tones, vowels are naturally broadband and therefore restrict the degree of frequency-specific inferences that can be made about audibility. Since frequency-specific information is essential for evaluating hearing aid benefit that may vary as a function of hearing loss and hearing aid gain, vowels have been modified to elicit independent EFRs from voice harmonics in low and higher-order formants (Easwar et al., 2015a; 2015b). Specifically, the f0 has been lowered in the region of the first formant (F1) alone to enable eliciting two independent EFRs, one from the low-frequency F1 at the lowered f0, and one from the higher formants (F2+) at the original f0. The second concern with vowel stimuli is reduced power >3.5 kHz. To evaluate hearing aid benefit across frequency bands effectively, fricatives—phonemes that have substantial high-frequency energy and that have been used for evaluating audibility at high frequencies—have been modified to elicit EFRs. Specifically, sinusoidal amplitude modulation has been applied to fricatives /∫/ and /s/ to elicit EFRs at the modulation frequency (Easwar et al., 2015b, 2015a). The constant modulation frequency is selected in the range of voice f0 so that response frequencies are similar for vowels and fricatives and thus potential effects of the modulation transfer function are reduced (Purcell et al., 2004).
Aside from stimulus differences for use with nonlinear amplification, speech-evoked EFRs and CAEPs vary in the clinical advantages they offer. One key advantage of CAEPs is the ability to infer hearing aid benefit in children with auditory neuropathy spectrum disorder (Rance et al., 2002; Sharma et al., 2011) —a diagnosis which is prevalent in ∼10%–20% of children with permanent hearing losses (Bagatto et al., 2011) and a condition that precludes the routine use of auditory brainstem/steady-state responses for estimating hearing acuity (Rance et al., 2005). CAEPs likely have this advantage because they are relatively less vulnerable to the impact of dys-synchrony compared to brainstem-level responses. That said, the consonant-vowel structure of EFR stimuli could elicit CAEPs at every consonant-vowel and vowel-consonant transition simultaneously with brainstem-dominant EFRs (Easwar et al., 2022a). However, whether or not this approach would be useful in children with auditory neuropathy spectrum disorder is yet to be demonstrated. Another point of difference is the impact of the infant's arousal state—a factor that may be advantageous or disadvantageous depending on the infant's age. While cortical-dominant CAEPs could be attenuated in sleep (e.g., Campbell & Colrain, 2002), the brainstem-dominant EFRs are less likely to be affected (Cohen et al., 1991; Purcell et al., 2004). Lastly, test time efficiency could vary between EFRs and CAEPs due to the stimulus structure and its interaction with the nature of each response (continuous EFRs vs. transient CAEP). A lack of interstimulus intervals does not disadvantage EFRs and the ability to record multiple EFRs simultaneously may lead to more information gathered in shorter test durations.
Speech-evoked EFRs have reflected improved audibility with the use of a hearing aid in adults with age-related sensorineural hearing loss, however, evidence is lacking in children with hearing loss. Assessed using a vowel stimulus (/a/ in /da/), higher amplitude was evident in aided compared to unaided conditions (Anderson & Kraus, 2013). In more recent work, similar improvements in the amplitude of EFRs elicited by /a/ in /da/ or /ga/ have been reported with the use of a hearing aid (BinKhamis et al., 2019; Jenkins et al., 2018; Karawani et al., 2018). Assessed using a combination of vowels and fricatives concatenated as /susa∫i/, higher amplitudes were evident in aided compared to unaided conditions for all stimuli except /u/ and /i/ F1 (Easwar et al., 2015b). The lack of significant improvements for /u/ and /i/ F1 was thought to be due to small increases in the audibility at low frequencies with the use of a hearing aid. Change in EFRs has also been measured in terms of detectability—a binary outcome based on statistical tests like the F-test, Hotelling's T2, Rayleigh with phase coherence etc., to objectively infer whether an EFR has been elicited. Increased number of detections were evident in aided compared to unaided conditions in adults (Easwar et al., 2015b). When assessed with vowel and fricative stimuli, EFRs have been sensitive to changes in audible bandwidth and its corresponding effects on speech discrimination accuracy and perceived speech quality (Easwar et al., 2015b). Relative to speech-evoked EFRs, significantly more evidence is available to support the use of speech-evoked potentials, specifically the CAEPs, in children with hearing loss. Collectively, these CAEP studies in children suggest that the presence of CAEPs can be used to reliably predict hearing aid benefit in most instances (Ching et al., 2016; Gardner-Berry et al., 2016; Glista et al., 2012; Purdy et al., 2005), and the information can facilitate management including hearing aid uptake and referral for cochlear implantation (Mehta et al., 2019; Mehta et al., 2017; Punch et al., 2016).
The accuracy of speech-evoked EFRs in assessing access to (or audibility of) low, mid, and high frequencies has been similar in children and adults with normal hearing (Easwar et al., 2022c). In a recent study, EFRs were elicited by the first formants of /u/ and /i/, the second and higher formants of /u/ and /i/, and fricatives presented between 15 and 75 dB SPL to span between inaudible/barely audible levels to loud speech. In both children and adults, who watched a silent captioned movie during the recording, the sensitivity—the proportion of audible stimuli for which an EFR was detected—ranged from ∼66% for /u/ and /i/ F1 to nearly 90% for the fricatives. When merged across multiple stimuli within each frequency band, the sensitivity ranged from ∼76% at low frequencies to 91% at higher frequencies. Collapsed across all stimuli, sensitivity improved with increases in stimulus level, and ranged from ∼84% to 98% between 55 and 75 dB SPL. These estimates and patterns are largely similar to a previous study in young adults with normal hearing evaluated in resting/asleep states (Easwar et al., 2020). Relative to sensitivity, the estimates of specificity—the proportion of inaudible stimuli that do not elicit an EFR—has been higher (>∼88%; Easwar et al., 2020). Higher specificity than sensitivity suggests more accuracy in confirming inaudibility than audibility.
In summary, the present study aimed to evaluate whether speech-evoked EFRs can reflect hearing aid benefit, measured in terms of speech audibility and speech discrimination, in children with permanent hearing loss. Although speech-evoked EFRs are likely to be useful during infancy, children between the ages of 6 and 17 years were recruited in the present study because reliable behavioral thresholds are needed to evaluate the validity of speech-evoked EFRs. Based on previous studies and known effects of level on EFRs, we predicted that: (i) EFRs in aided conditions will be larger in amplitude and have higher detectability compared to unaided conditions and (ii) the degree of change in EFR characteristics will depend on the extent of change in audibility. Further, since audibility is a critical factor in speech discrimination accuracy, we expected that improvement in speech discrimination with the use of a hearing aid will parallel corresponding improvement in EFRs.
Methods
Participants
A total of 18 children with hearing loss (10 males; mean

Pure-tone thresholds of each child participant's test ear. Circles represent right ear thresholds and crosses represent left ear thresholds. Error bars represent 1 SD.
Demographic Data and Hearing History of the Test Ear of All Participants Ordered by Chronological Age at the Time of Testing. Age at Diagnosis, Hearing Aid Fitting, and Details About Current Hearing Aid Use Were Based on Parent Reports.

Used hearing aid at age 6 years.
Used hearing aid for 4 years (7–11 years).
Stimuli
Six EFR stimuli were created from the four male-spoken phonemes /u/, /i/, /∫/ and /s/ concatenated as /su∫i/ (1.28 s; see Figure 2 for spectra and Figure 3 for spectrogram). The combination of vowels and fricatives was chosen to evaluate audibility at low, mid, and high frequencies (Easwar et al., 2015a; 2015b). The vowels and fricatives were 384 and 256 ms long, respectively. The average f0 of the originally spoken /u/ was 97.4 Hz (range: 96.8–98.1 Hz), and that of /i/ was 97.1 Hz (range: 96.4–98.9 Hz). The first formant frequencies of /u/ and /i/ were 264.7 Hz and 257.1 Hz, respectively and the second formant frequencies of /u/ and /i/ were 1020.7 Hz and 2183.3 Hz, respectively. The six stimuli included the first formant bands of the vowels /u/ and /i/ (/u/ F1 and /i/ F1), second and higher formant bands of the same vowels (/u/ F2+ and /i/ F2+), and the fricatives /∫/ and /s/ (Figure 2 for spectra). F1 stimuli, F2+ stimuli, and the fricatives were used to evaluate audibility at low, mid, and high frequencies, respectively. The phonemes and the token /su∫i/ were a subset of stimuli used in previous studies (Easwar et al., 2020; Easwar et al., 2021; Easwar et al., 2015a, 2015b; Easwar et al., 2022a, 2022b, 2022c).
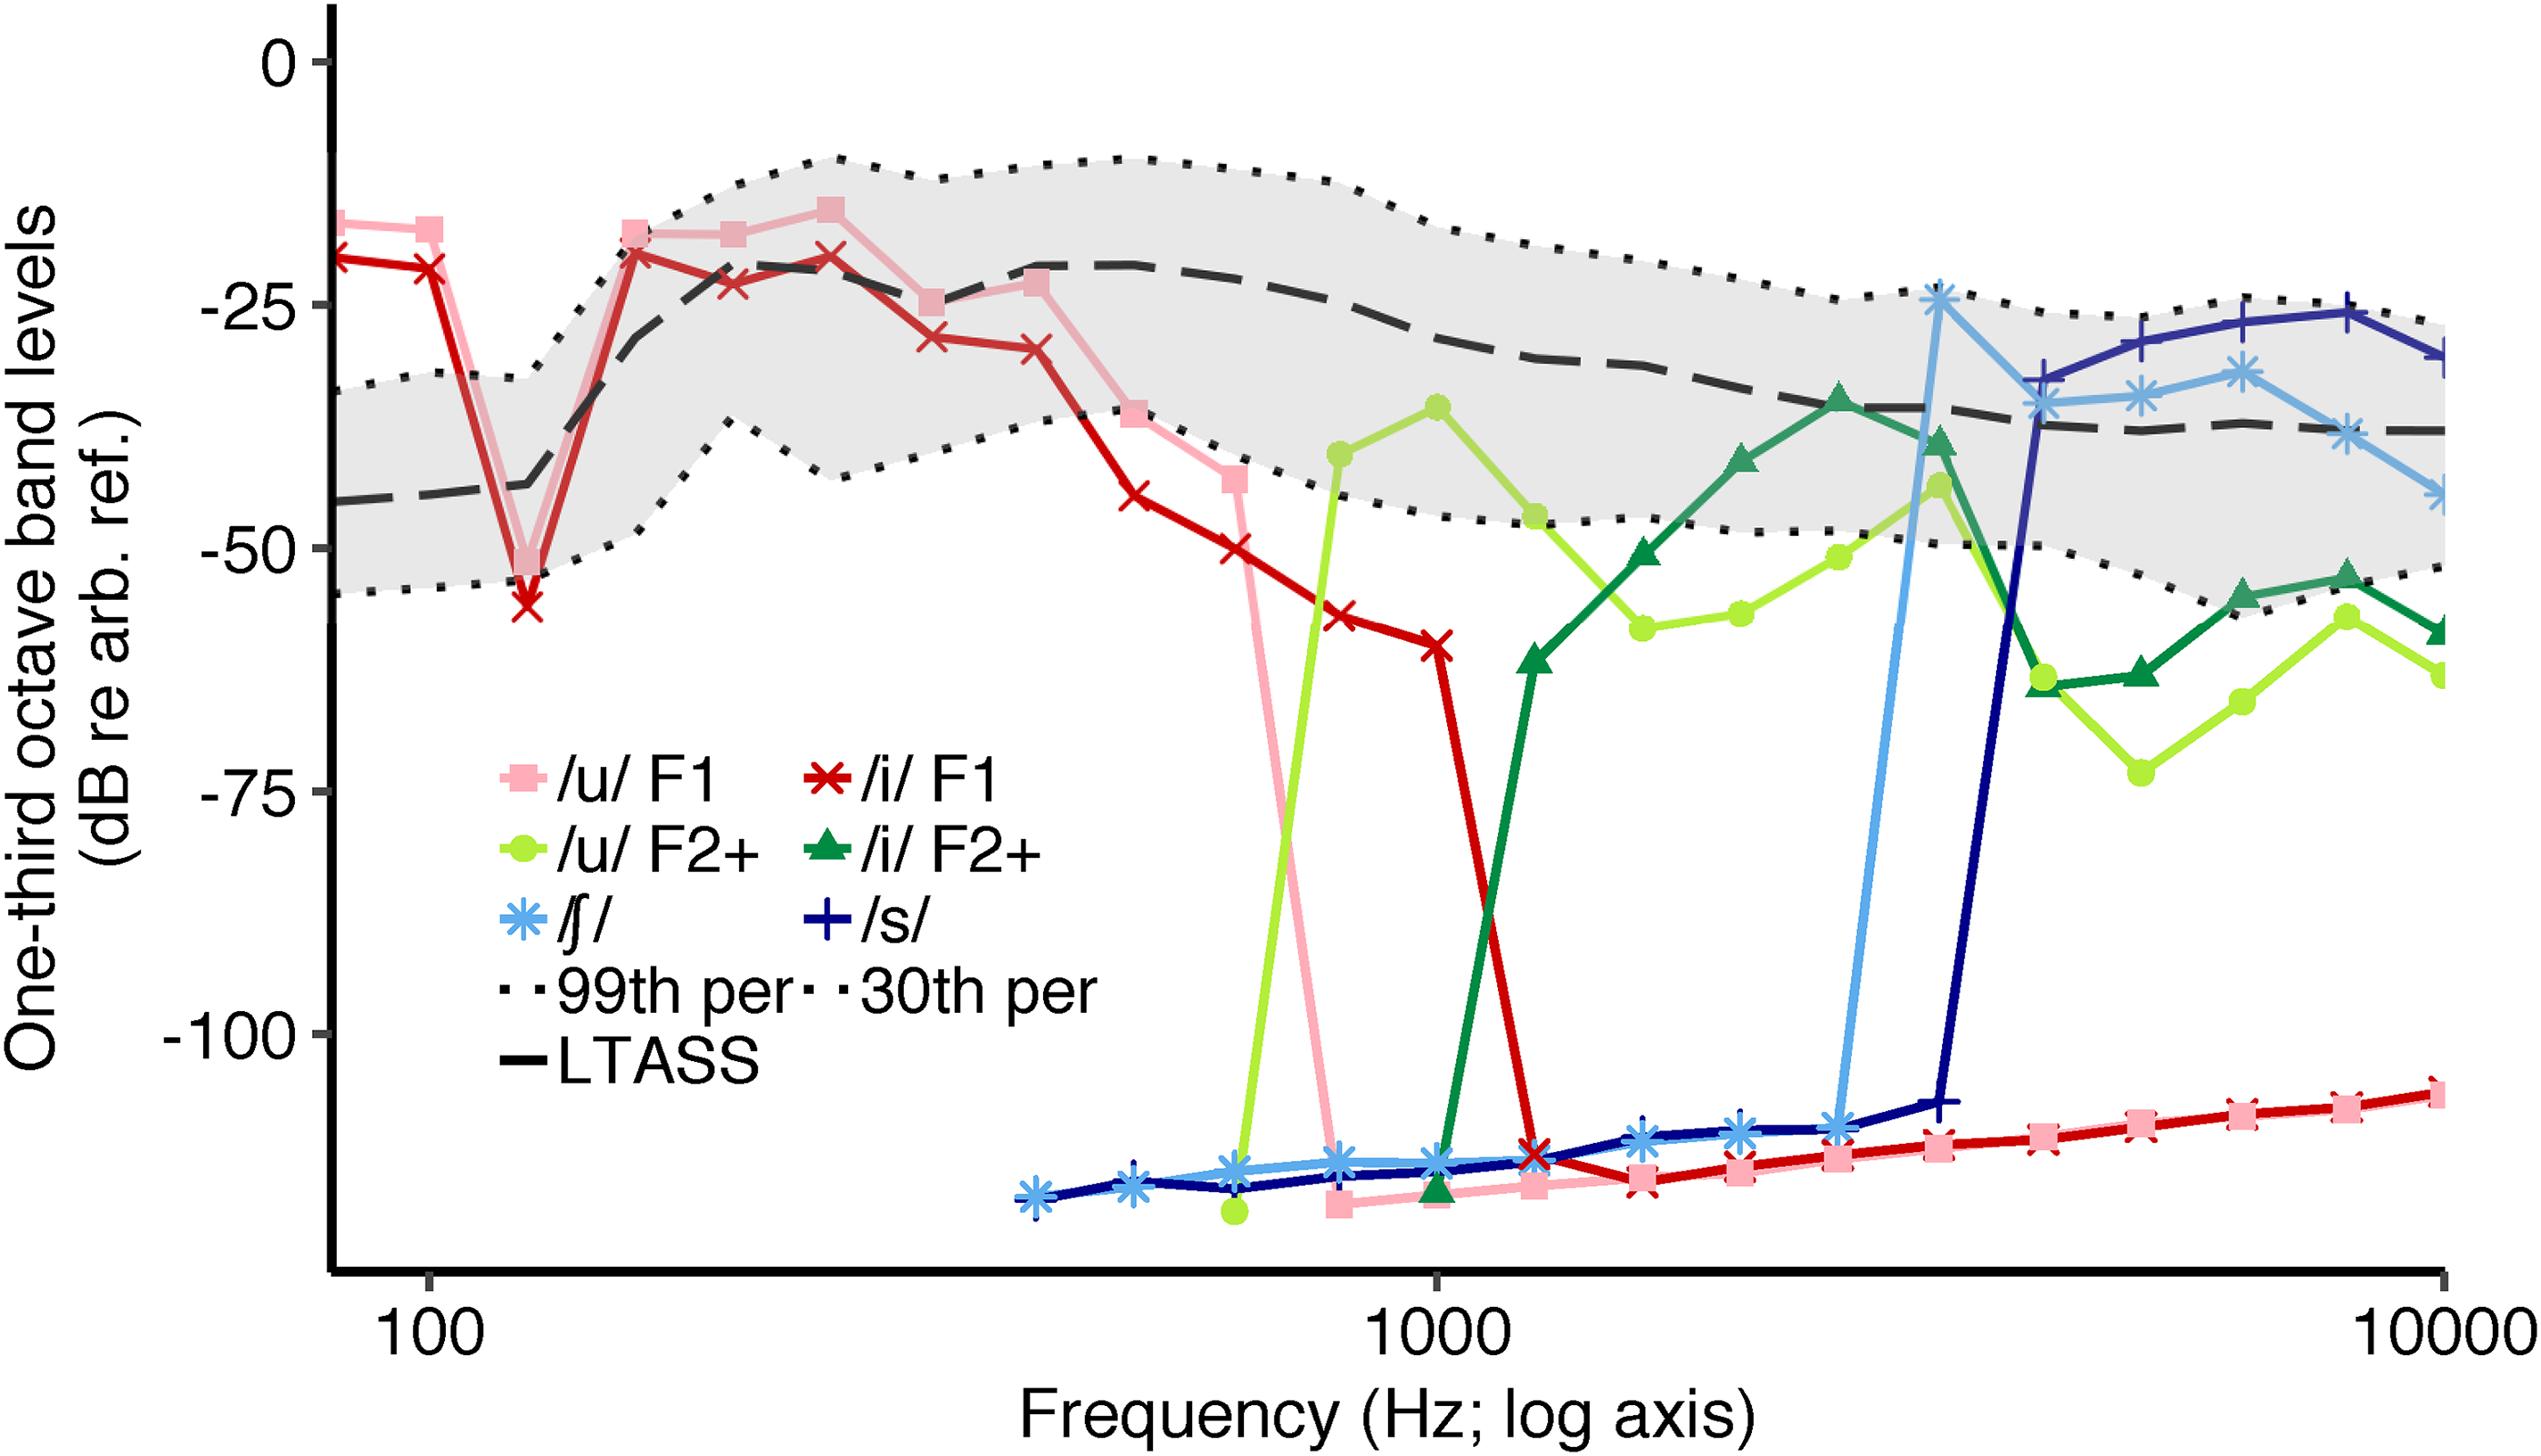
Spectra of the six envelope following response (EFR) stimuli. LTASS refers to long-term average speech spectrum of the International Speech Test Signal (ISTS; Holube et al., 2010) matched in overall root mean square (RMS) level to /su∫i/. The gray shaded region represents the dynamic range of the ISTS. The dotted lines marking the boundary of the dynamic range refer to the 99th (top dotted line) and the 30th percentile bottom dashed line (Per = percentile). The y-axis unit dB re arb. ref. refers to an arbitrary decibel reference.

Spectrogram of the token /su∫i/.
Each vowel was modified to elicit EFRs from F1 and F2+ simultaneously to improve frequency specificity and test time efficiency (Easwar et al., 2015a, 2015b; Easwar et al., 2019b). The f0 in each vowel was lowered by 8.57 Hz in the F1 region alone to differentiate the f0, and hence the frequency at which the EFR was elicited compared to the F2+ region. This was achieved by lowering the f0 of the entire vowel by 8.57 Hz, isolating the F1 band by low-pass filtering at 670 Hz for /u/ and at 1110 Hz for /i/, and merging the filtered F1 band with the F2+ band. The F2+ band was obtained by high-pass filtering the original vowel at 730 Hz for /u/ and 1215 Hz for /i/. To improve frequency specificity and enable eliciting EFRs, the fricatives /∫/ and /s/ were high-pass filtered at 3 and 4 kHz, respectively, and sinusoidal amplitude modulation at 93.75 Hz was applied. Post-modulation root mean square (RMS) levels of the fricatives were matched with the original versions. Modified phonemes were concatenated to /su∫i/.
Hearing aid Fittings
Three hearing aids, namely P, SP, and UP from the 12-channel Sky B50 family (Phonak) were used to provide adequate amplification for all audiograms as shown in Figure 1. Hearing aids were programmed to have one direct audio input (DAI) program only (Easwar et al., 2015b; Glista et al., 2012). The microphone was activated during verification and later deactivated. Features like noise reduction and sound recover were deactivated. Hearing aids were programmed to meet Desired Sensation Level v5a targets at 55, 65, and 75 dB SPL (Scollie et al., 2005). Coupler-based verification was completed in Verifit 2 (Audioscan, ON) using wideband real-ear-to-coupler difference measured in the test ear. The error in fitting, computed as the RMS of the differences between the target and achieved hearing aid output between 250 and 6 kHz, was 2.5 (SD = 2.1), 2.6 (SD = 2.7), and 2.9 (SD = 3.2) dB at 55, 65, and 75 dB SPL, respectively. These errors are comparable to estimates from prior studies (Easwar et al., 2015b; Polonenko et al., 2010), and thus confirm an acceptable match to the prescribed amplification. During testing, hearing aids were coupled with unvented custom earmolds made for the test ear.
Test Conditions
Stimulus presentation and EEG recording were controlled by Auditory Research Laboratory audio software (Goodman, 2017) that uses MATLAB (Mathworks, MA, USA). Digital to analog conversion of the stimulus was completed using the FireFace UCFX + (RME, Haimhausen, Germany). In unaided conditions, the token /su∫i/ was presented through ER-2 insert earphones (Etymotic Research, IL, USA), and in aided conditions, the token was presented through the individually fit hearing aids connected with an audio shoe. Stimuli were presented and EEG was recorded at a sampling rate of 96,000 samples/sec. Post-recording, EEG was downsampled to 8,000 samples/sec. In each trial, the token /su∫i/ was presented in both polarities.
The three test levels, 55, 65, and 75 dB SPL, were chosen to align with casual through loud speech (Olsen, 1998), and typical test levels used for hearing aid verification (Bagatto et al., 2010). The test level referred to the RMS level of the entire /su∫i/ token. Stimulus level was calibrated in a Brüel & Kjær ear simulator (type 4157) using a sound conditioner (type 1708). Similar to previous aided studies (Easwar et al., 2015b; Glista et al., 2012), during calibration, the hearing aids were set to zero gain and functioned linearly.
EEG recordings were completed in a double-walled electromagnetically shielded sound booth. Participants sat in a recliner and watched a silent movie with subtitles. A total of 400 trials were recorded at each stimulus level in each condition. Breaks were provided as often as needed. Each condition lasted about 17 min.
Sensation Level (SL) of Each Stimulus
Thresholds, in dB SPL, were obtained for each of the six stimuli in unaided and aided conditions following standard audiometric 10-dB down 5-dB up bracketing procedures. The stimuli were presented in isolation during threshold measurement. In unaided conditions, the ER-2 was used. In aided conditions, a zero gain hearing aid was used. The level of each individual stimulus phoneme was obtained by recording the output of the ER-2 insert earphone (for unaided conditions) and the fitted hearing aid (for aided conditions) while the token /su∫i/ was presented at 55, 65, and 75 dB SPL. The output was recorded in the ear simulator using the same setup as calibration (described above). Each stimulus was extracted from the token /su∫i/ and the RMS level was measured. Sensation level (SL) was computed as the difference between the level of each stimulus and the threshold, independently in unaided and aided conditions. SL was obtained for every stimulus because it varied with stimulus level and condition (unaided vs. aided), and by the threshold that was influenced by the degree and configuration of hearing loss.
Speech Discrimination
Speech discrimination was assessed using the University of Western Ontario Distinctive Features Differences test (DFD; Cheesman & Jamieson, 1996). The DFD is a closed-set consonant discrimination task and has been commonly used to measure hearing aid benefit in children and adults (Easwar et al., 2015b; Eeckhoutte et al., 2020; Jenstad et al., 2007; Scollie, 2008). Twenty-one consonants are presented in a word-medial context (/aCil/ where C is the consonant). For the present study, 21 tokens each spoken by two male talkers were used. The participant was instructed to click on the consonant on a computer screen showing all 21 possibilities. Percent correct was calculated and converted to rationalized arcsine units (RAU) for all statistical analyses to make the percent correct scores more suitable for parametric analysis by normalizing the variance across plausible scores (Studebaker, 1985; Sherbecoe and Studebaker, 2004). The DFD was completed at 65 dB SPL, once in the unaided condition and once in the aided condition. Calibration was based on the RMS of a concatenated list of all 42 tokens presented without gaps.
EFR Analysis
EFR analysis was completed offline using MATLAB (MathWorks, MA, USA). EEG was first bandpass filtered between 65 and 130 Hz. Each trial (2.56 s) was divided into two epochs of 1.28 s each for the purposes of noise rejection. A noise metric was computed for each epoch as the average EEG amplitude between 65 and 130 Hz. A rejection threshold was set, based on all 800 epochs, as the 3rd quantile + 1.5 times the interquartile noise metric range for every recording. Epochs that exceeded the rejection threshold were excluded from the all-trial average.
Vowel-elicited EFRs were estimated using a Fourier analyzer (Aiken & Picton, 2006; Choi et al., 2013; Easwar et al., 2015a). EEG was averaged across the two polarities to emphasize responses to the stimulus envelope (Aiken & Picton, 2008). The analysis windows of both vowels entailed the middle 350 ms and excluded 17 ms at either end. The time course of each f0 was estimated using Praat and used as the reference tracks to create the reference cosine and sine sinusoids to be used in the Fourier analyzer. The average EEG, after being time-shifted by 10 ms to account for cochlear and neural processing delays (Aiken & Picton, 2006; Choi et al., 2013; Easwar et al., 2022a), was multiplied with the references to estimate the real and imaginary components of the EFRs. An additional delay of 5.6 ms was added to account for the hearing aid processing delay measured in-lab for the study. The two components were then averaged over the entire duration of the vowel analysis window to yield a single complex number from which the amplitude and phase were derived. Fricative-elicited EFRs were analyzed using a discrete Fourier transform (DFT; Easwar et al., 2015a, 2015b). For both vowels- and fricative-elicited EFRs, an estimate of residual noise was obtained as the average EEG amplitude surrounding the f0/envelope modulation frequency. A total of 14 and 12 noise bins were used for the vowels and fricatives, respectively. Noise bins flanked the response frequency bins. Bins immediately adjacent to the response bin, bins that might be contaminated by line noise, and bins that contained simultaneously elicited EFRs were excluded. A greater number of bins were feasible for vowels than fricatives because of their longer duration leading to narrower bin sizes in the frequency-domain analysis. EFR detection was assessed using phase coherence with Rayleigh test as well as Hotelling's T2. Since the results were largely similar between the two and recent work has indicated no difference between these two in predicting audibility in children (Easwar et al., 2022c), we report results based on phase coherence with Rayleigh only.
EFR Sensitivity and Specificity
When calculated for each stimulus, sensitivity was defined as the proportion of all audible instances (SL
Statistical Analysis
Linear mixed effects models were used to evaluate the effect of stimulus, use of hearing aid, and level or sensation level on EFR amplitude. A generalized linear mixed effects model (family = binomial) was used to evaluate the effect of stimulus, use of hearing aid, and sensation level on EFR detection (binary outcome). Sensitivity and specificity were compared between stimuli and frequency bands using chi-square tests. Improvement in speech perception accuracy, and the number of EFRs detected between unaided and aided conditions were assessed using paired t-tests. When multiple pairwise comparisons were necessary for post hoc evaluations, p-values were adjusted by false discovery rate correction (FDR; Benjamini & Hochberg, 1995). All statistical analyses were completed using R v4.0.4 (R Core Team, 2021). Mixed models and post hoc comparisons were completed using the packages lmer (Bates et al., 2015) and emmeans (Lenth, 2021), respectively.
Results
Use of a Hearing aid Improved Audibility of Speech and EFR Characteristics
The use of a hearing aid improved the SL of all stimuli as expected. Figure 4A shows the estimated SL in each participant for each stimulus at the three stimulus levels tested. A linear mixed effects model was completed with stimulus SL as the dependent variable, factors condition (unaided/aided), stimulus (six stimuli), and level (55/65/75 dB SPL) as fixed effects with random intercepts for each participant to account for between-participant variability (stimulus SL ∼condition + stimulus + level + condition *stimulus + condition *level + [1|participant]). The two-way interaction terms condition × stimulus and condition × level were included. The three-way interaction term (stimulus × condition × level) and the two-way interaction term stimulus × level could not be included because of implicit constraints caused by the exact change in SL with level in unaided conditions for every stimulus. The model results suggested that SL was influenced by condition (F[1,630] = 1043.11, p < .001; with reference being unaided, estimate = 17.15; SE = 2.53), stimulus (F[5,630] = 14.81, p < .001; with reference being /u/ F1, estimates ranged from −23.37 to −4.57; SE = 2.19), and level (F[2,630] = 114.86, p < .001; with reference being 55, estimates were 10 and 20 for 65 and 75 dB SPL, respectively; SE = 1.55). Further, SL varied by the condition in a stimulus- and level-specific manner (condition × stimulus interaction: F[5,630] = 24.79, p < .001; condition × level interaction: F[2,630] = 4.97, p = .007). Post hoc analysis for the condition × stimulus interaction indicated smaller condition effects in SL for /u/ F1 (dB difference: mean
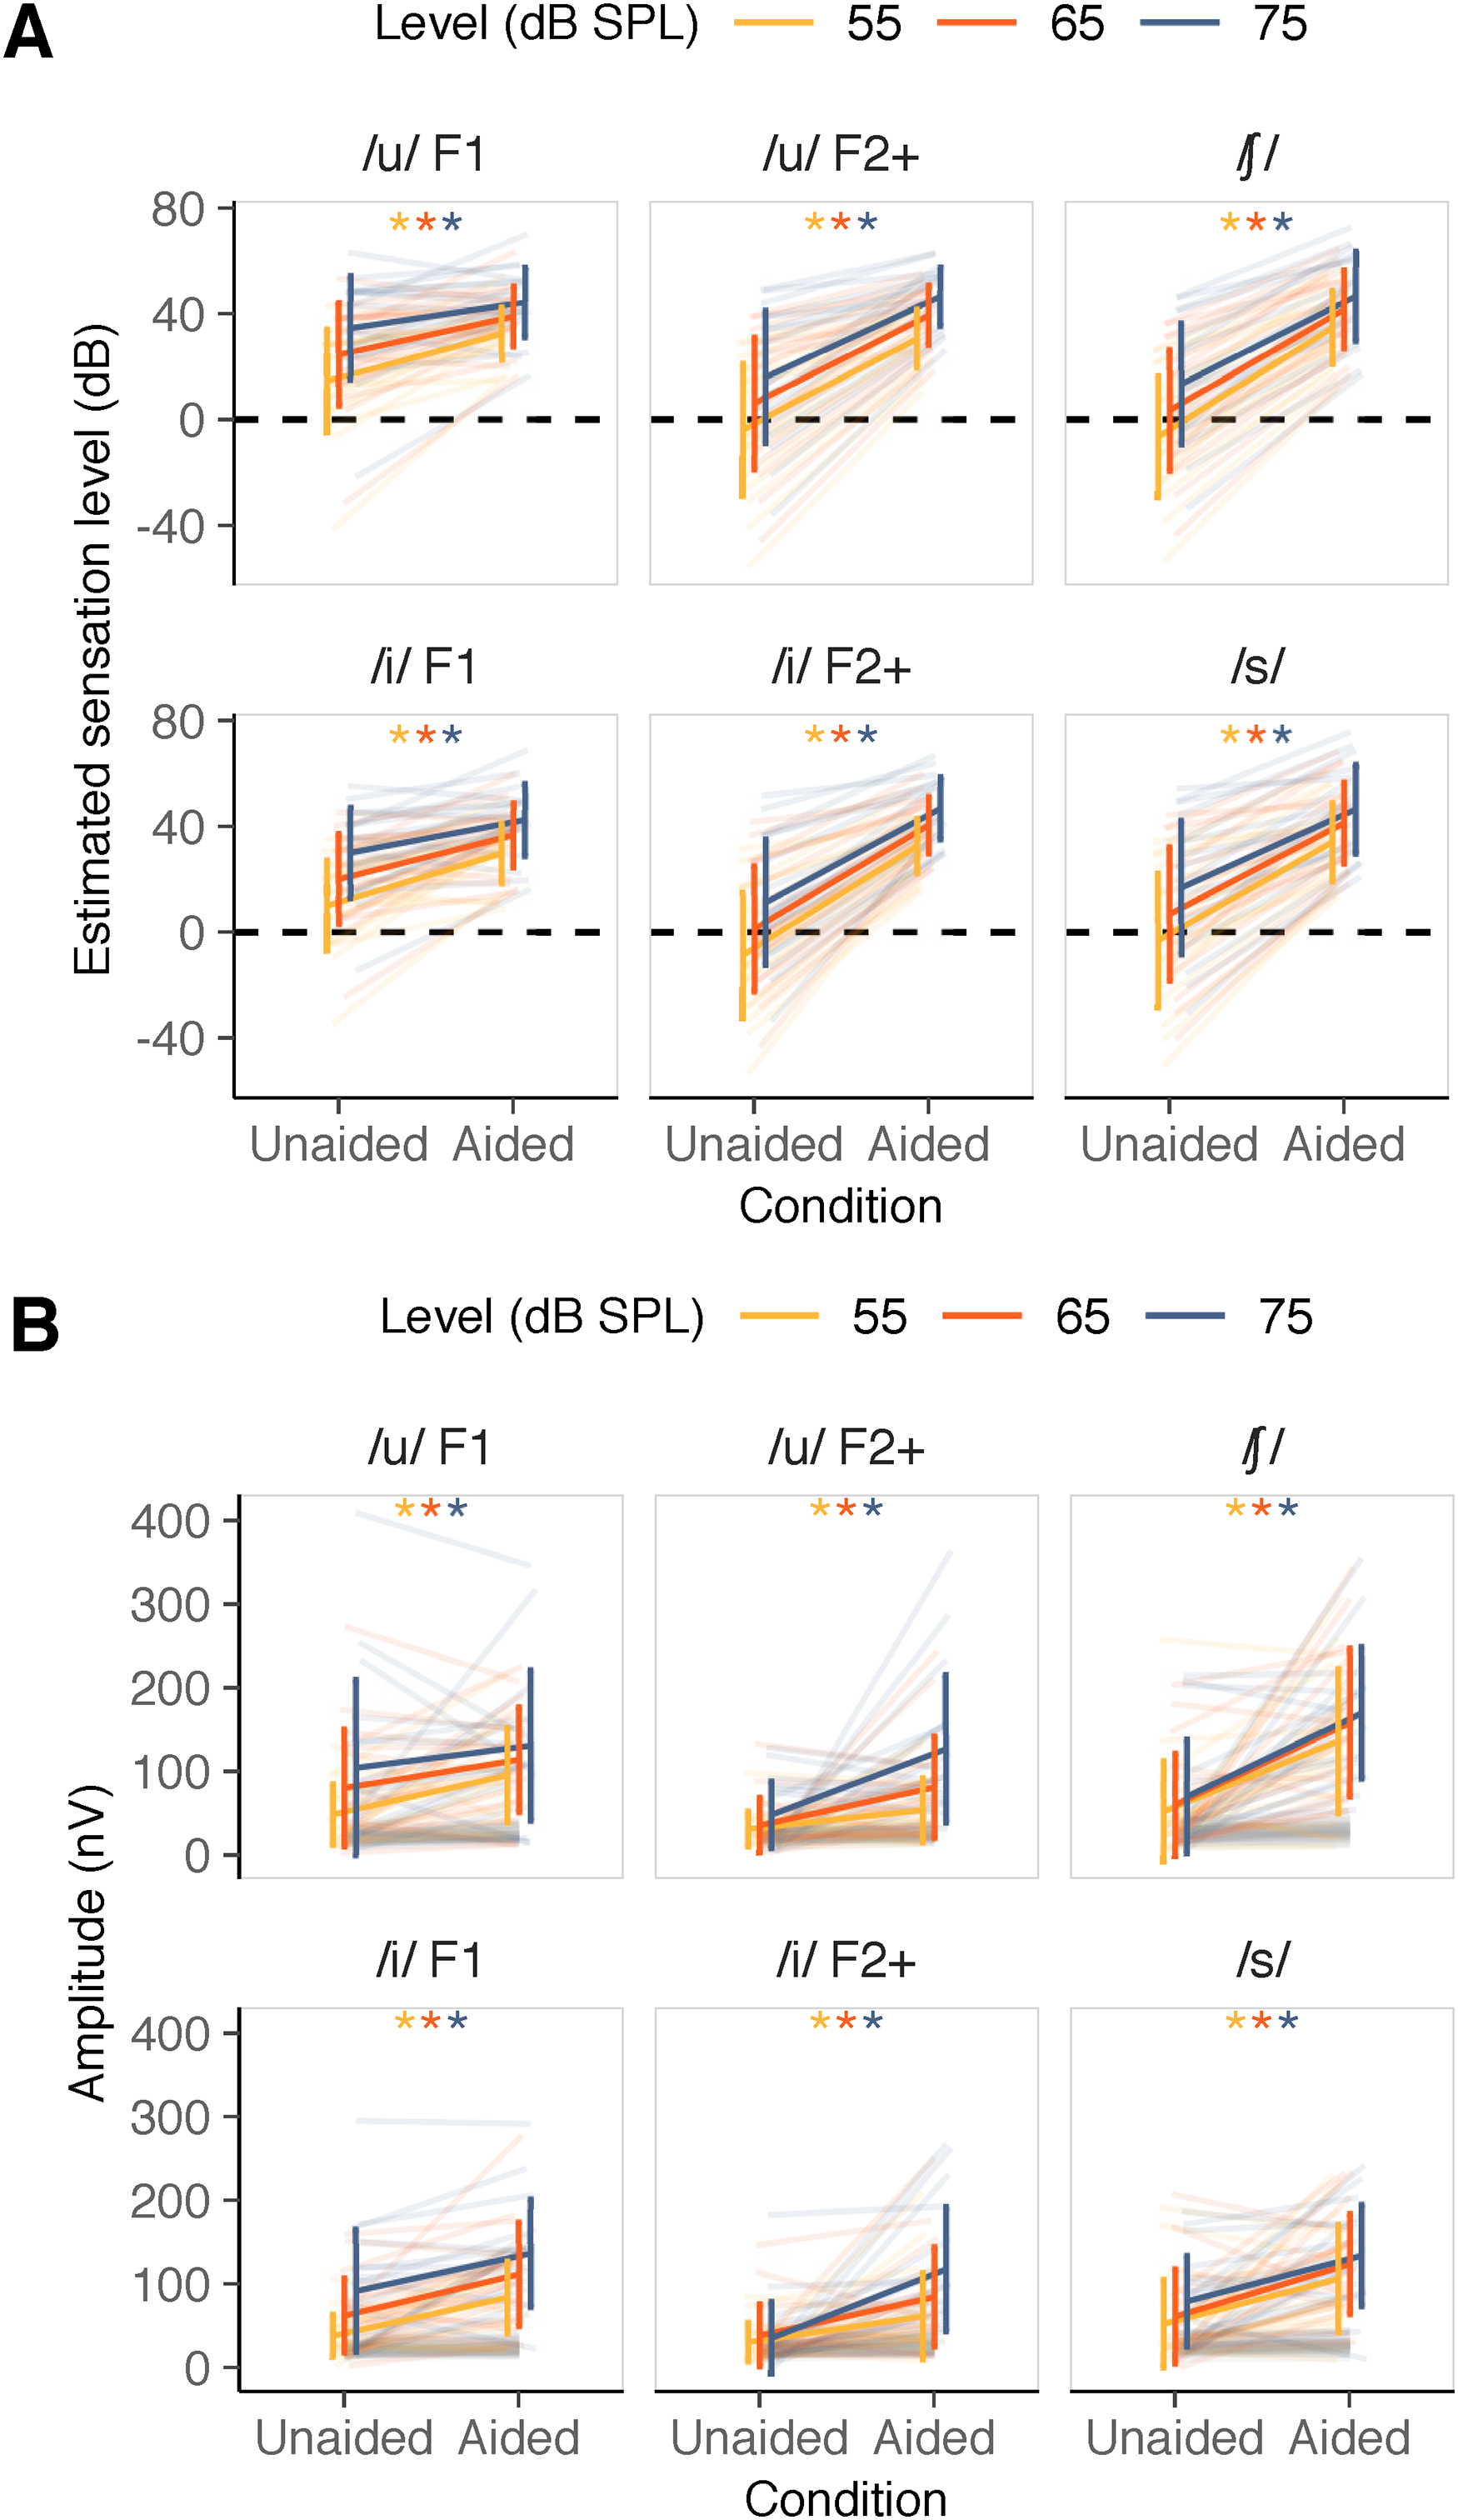
(A) Estimated sensation level in unaided and aided conditions for each stimulus at each /su∫i/ level. (B) Envelope following response (EFR) amplitude (in color) and noise amplitude (in gray) in unaided and aided conditions for each stimulus and /su∫i/ level. In both panels, low-frequency stimuli are indicated in the first column, mid frequency stimuli are indicated in the middle column and high-frequency stimuli are indicated in the last column. Error bars represent 1 SD. * indicate a statically significant difference between unaided and aided conditions in post hoc pairwise comparisons (FDR-corrected).
Figure 4B shows the improvement in EFR amplitude with the use of a hearing aid for all six stimuli at all three levels. A linear mixed effects model was used with condition, stimulus, level and their interactions as fixed effects along with a random intercept for each participant (EFR amplitude∼condition*stimulus*level + [1|participant]). EFR amplitude was log-transformed due to violation of the normality assumption of residuals. EFR amplitude was strongly influenced by condition (F[1,630] = 230.78, p < .001; with reference being unaided condition, estimate = 0.76; SE = 0.24), stimulus (F[5,630] = 12.40, p < .001; with reference being /u/ F1, estimates ranged between −0.42 and 0.01; SE = 0.24) and level (F[2,630] = 21.12, p < .001; with reference being 55; estimates were 0.37 and 0.57 for 65 and 75 dB SPL, respectively; SE = 0.24). Further, EFR amplitude varied by condition in a stimulus-specific manner (two-way interaction between condition and stimulus: F[5,630] = 2.26, p = .047). The three-way interaction (F[10,630] = 1.38, p = .188), and the two-way interactions involving level (condition × level: F[2,630] = 0.55, p = .578; stimulus × level: F[10,630] = 0.41, p = .942) were not significant. Post hoc analysis comparing the unaided and aided EFR amplitudes indicated smaller changes due to the use of a hearing aid for /u/ F1 (mean
Improvement in EFR Amplitude was Dependent on the Degree of Improvement in Audibility
Figure 5 shows the change in EFR amplitude as a function of the change in SL for each stimulus at all three levels. To assess the effect of change in SL on the change in EFR amplitude, and whether that relationship varied between the six stimuli, a linear mixed effects model was used with SL and stimulus as fixed effects. To account for between-participant variability, random intercepts as well as slopes were considered per participant (EFR amplitude∼[1 + stimulus SL|participant] + stimulus SL*stimulus). Results indicated that the change in EFR amplitude was significantly influenced by the change in SL (F[1,19] = 8.34, p = .009; estimate = 3.18, SE = 1.03), but not by stimulus (F[5,295.1] = 0.81, p = .541; with reference stimulus /u/ F1, estimates ranged from −1.57 to 27.11; SE ranged from 14.4 to 28.4). Further, the relationship between the change in SL and the change in EFR amplitude did not vary by stimulus (nonsignificant interaction between stimulus and SL: F[5,297.9] = 1.6, p = .159). Averaged across stimuli, the model suggested that the EFR amplitude increased by 2.5 nV, on average with a 1-dB increase in SL. For full model results, please see Supplementary Table 3.

Change in envelope following response (EFR) amplitude as a function of the change in stimulus sensation level. Positive values along x- and y-axes indicate higher values in aided compared to unaided conditions. Dark gray solid line represents the estimated relationship (slope) between change in stimulus SL and EFR amplitude per stimulus. The level at which /su∫i/ was presented is represented by the color and shape of markers.
Estimated Audibility was the Main Predictor of EFR Detectability
We assessed changes in the detectability of EFRs (i.e., when EFR is treated as a binary outcome). In general, the number of detected EFRs was higher in aided compared to unaided conditions for all stimuli at all levels (Figure 6). Figure 7 illustrates the variation in p-values as a function of SL in unaided and aided conditions (EFRs are detected when p < .05). To assess factors that influenced detection, a generalized linear mixed effects model was used to predict EFR detectability using SL, stimulus as well as EFR condition as fixed effects with random intercepts per participant (detection outcome∼stimulus SL*stimulus*condition + [1|participant]). SL was used as a factor instead of level because the variation in audibility caused by the presence of hearing loss is captured only by SL. Further, when audible (i.e., SL >0 dB), SL is positively related to level; as the level increases, SL increases. Detectability was significantly influenced by SL (χ2(1) = 11.1, p < .001). The odds ratio associated with a 1-dB increase in SL was 1.14 (95% CI = 1.05–1.23), suggesting that a 1-dB increase in SL improves the odds of getting a detectable response by a factor of 1.14. Detectability was not significantly influenced by stimulus (χ2(5) = 4.49, p = .482; with reference stimulus /u/ F1, odds ratios for other stimuli ranged from 1.08 to 26.85; SE ranged from 1.92 to 49.55) and condition (χ2(1) = 0.52, p = .470; log odds of aided relative to unaided 2.97; SE = 4.48). The influence of SL on detectability was influenced neither by stimulus nor by condition, as indicated by nonsignificant two- and three-way interactions (SL × stimulus: χ2(5) = 5.79, p = .327; SL × condition: χ2(1) = 0.07, p = .799; SL × stimulus × condition: χ2(5) = 6.344, p = .274). For full model results, please see Supplementary Table 4.

The number of envelope following responses (EFRs) detected in unaided and aided conditions.

P-values as a function of sensation level in unaided and aided conditions represented in unfilled and filled circles, respectively, from each participant. Orange dashed line refers to the cut-off p-value for EFR detection; p < .05 is interpreted as a detected EFR. Orange shaded region represents p-values < .05 and gray shaded region represents audible stimuli (SL > 0 dB).
Accuracy of EFRs in Determining Speech Audibility Varied Between Aided and Unaided Conditions but not Stimulus or Stimulus Frequency
Table 2 summarizes the sensitivity and specificity of speech-evoked EFRs in determining if a stimulus was audible. Specificity could only be computed in unaided conditions because there were no inaudible stimuli in aided conditions. Sensitivity did not vary significantly as a function of stimulus or frequency band in aided (stimulus: χ2[5] = 5.2, p = .391; frequency band: χ2[2] = 1.5; p = .472) as well as unaided conditions (stimulus: χ2[5] = 5.9, p = .311; frequency band: χ2[2] = 2.6, p = .272). Similarly, specificity did not vary as a function of stimulus or frequency band in unaided conditions (stimulus: χ2[5] = 4.9, p = .427; frequency band: χ2[2] = 0.51, p = .776). Collapsed across stimuli, sensitivity was significantly higher in aided (82.1%; 95% CI = 77.5–85.9) compared to unaided conditions (66.5%; 95% CI = 60.0–72.5; χ2[1] = 17.2, p < .001).
Sensitivity and Specificity of Speech-Evoked Envelope Following Responses (EFRs).

EFR Detectability Predicted Aided Benefit in Speech Discrimination Ability
Improved audibility with the use of a hearing aid is expected to facilitate speech discrimination. Here we assessed whether improved audibility, as reflected in EFRs, was related to the expected improvement in speech discrimination. Speech discrimination accuracy in aided conditions (percent correct: mean
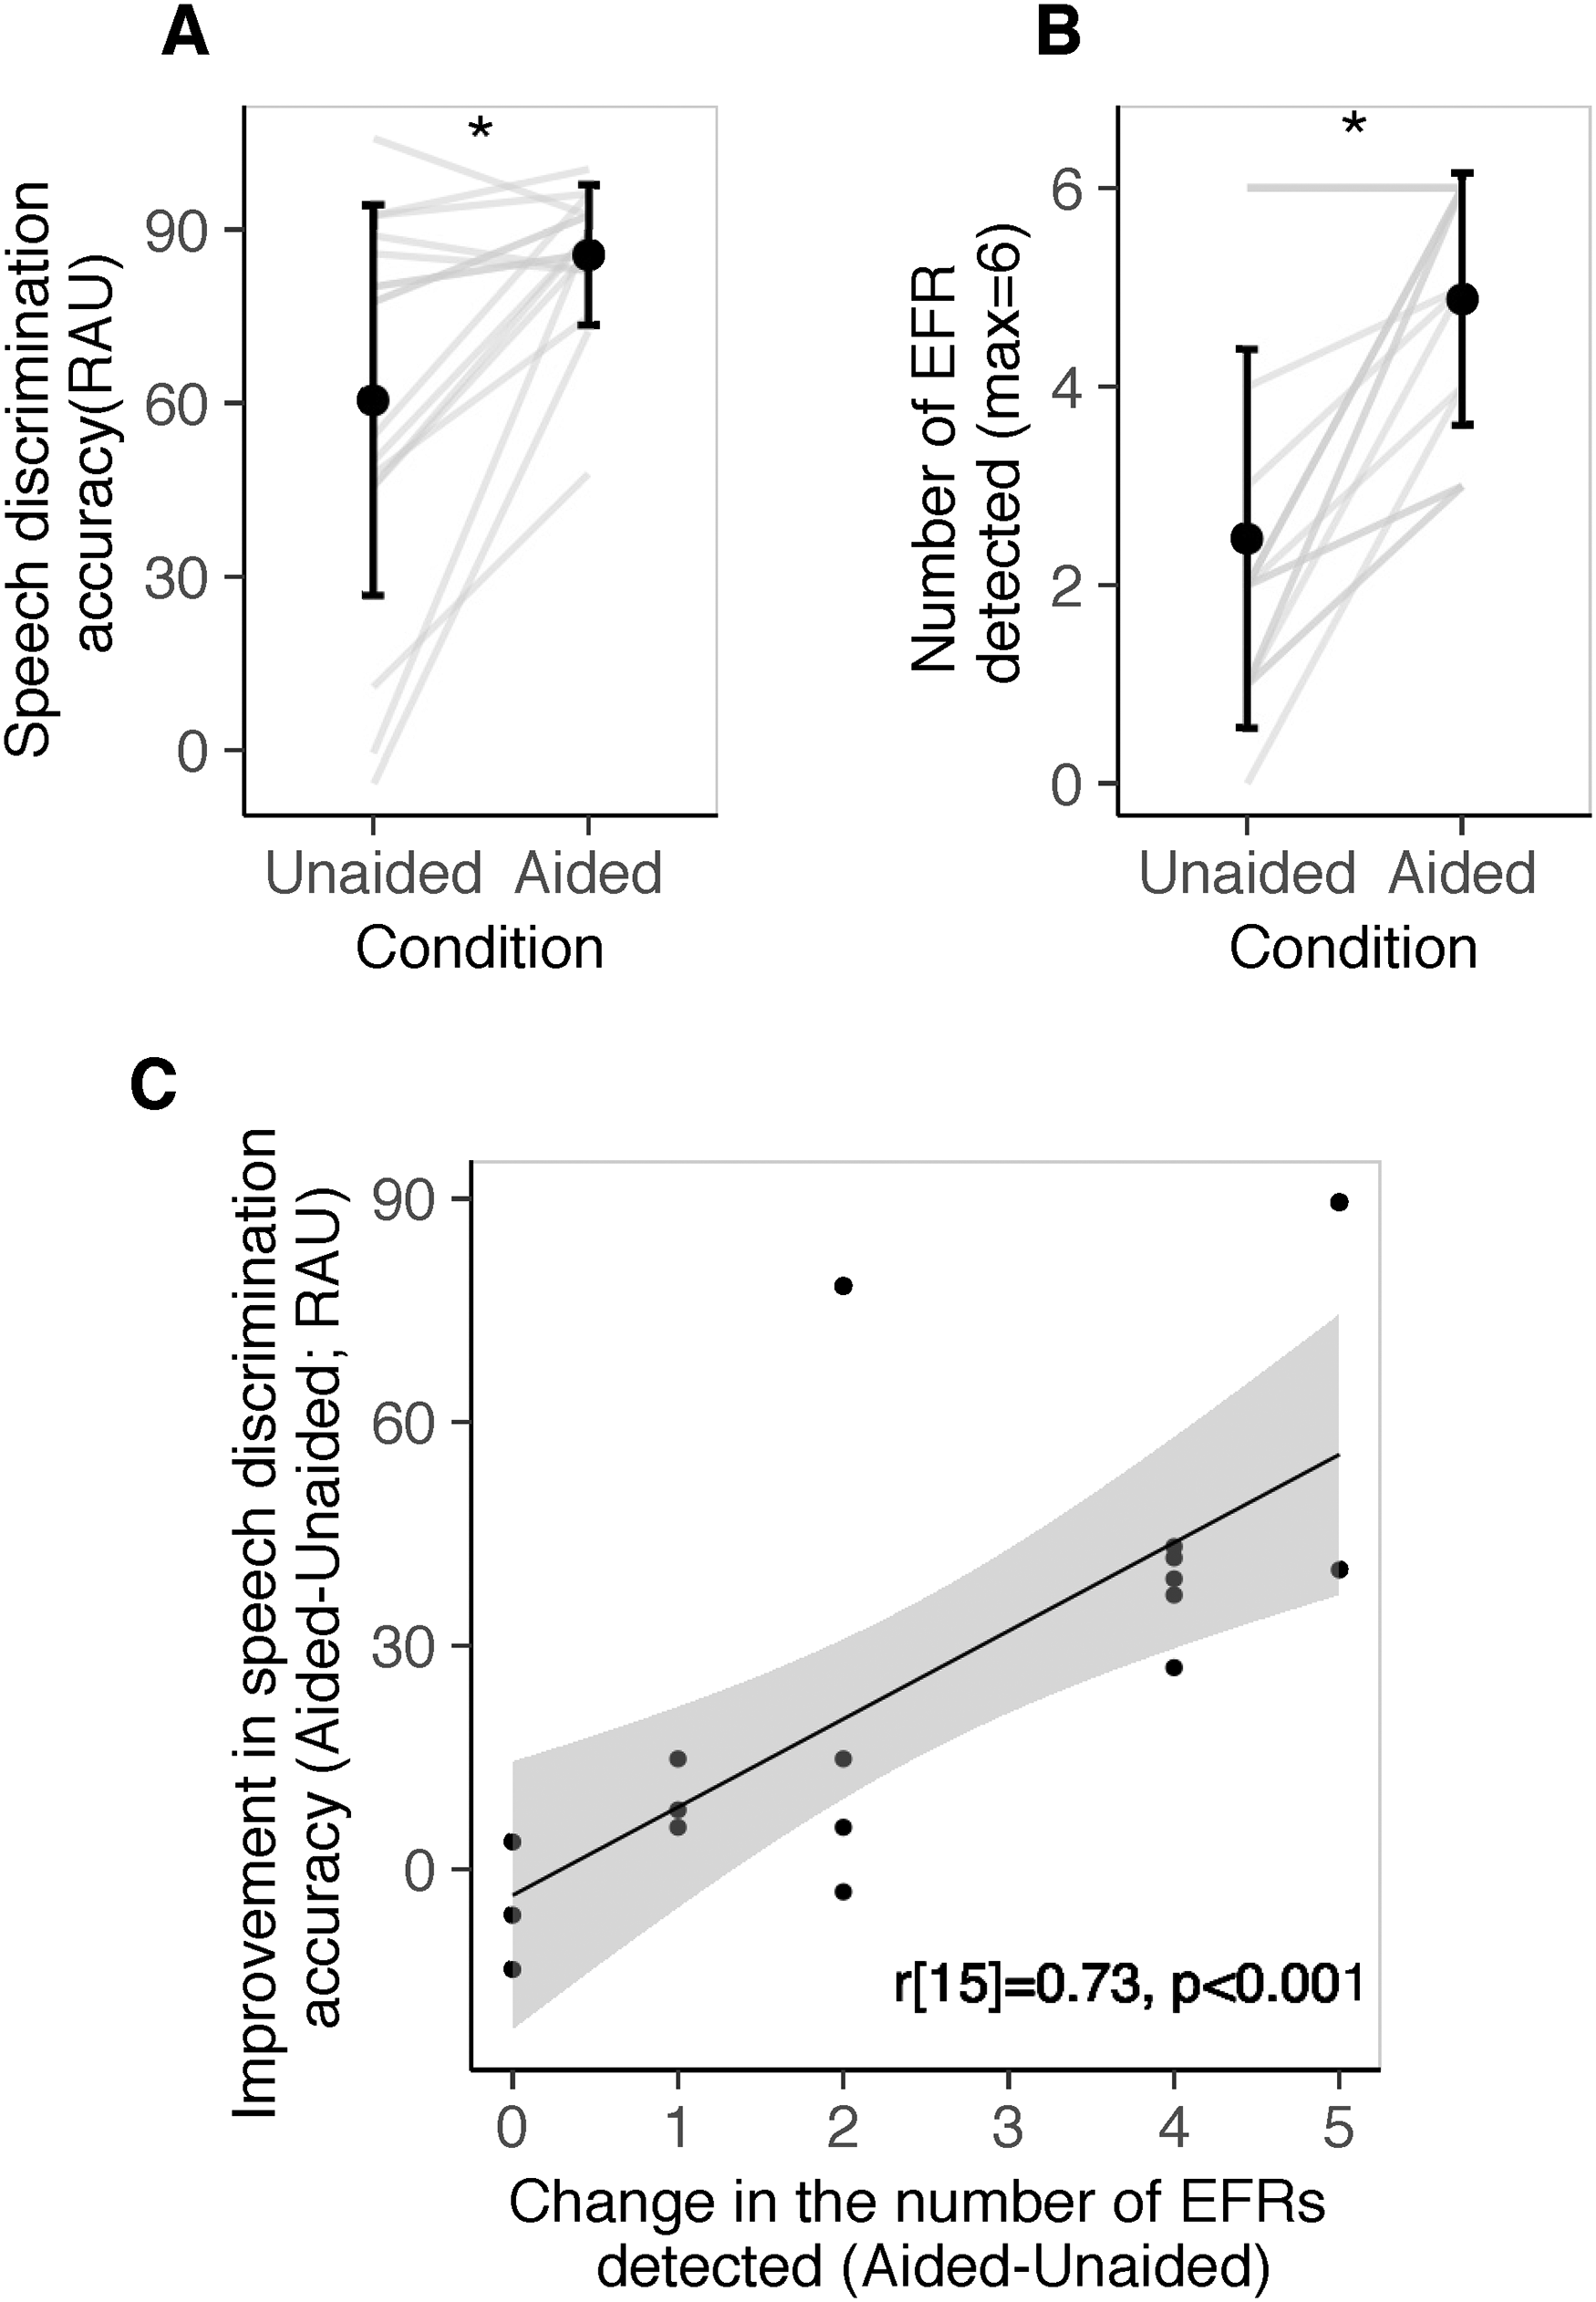
(A) Speech discrimination accuracy in unaided and aided conditions. (B) Number of envelope following responses (EFRs) detected in unaided and aided conditions. Each line represents data from one child. (C) Improvement in speech discrimination accuracy with the use of a hearing aid as a function of the change in the number of EFRs detected with the use of a hearing aid. Each circle represents datum from a child.
We also assessed whether frequency-specific access to speech, as inferred from EFR detection, could predict speech discrimination accuracy in unaided and aided conditions. If even one stimulus in a frequency band elicited a detectable EFR, that frequency region was considered audible. A revised criterion of p < .025 was used for EFR detection due to two chances within a frequency band. Figure 9 provides the distribution of speech discrimination accuracy as a function of the number of audible frequency bands, as determined by at least one EFR detection in a band. In unaided conditions, as the number of audible bands increased from 0 to 3, speech discrimination accuracy (RAU) improved from 2.59 (SD = 11.8) to 95.7 (SD = 8.9), on average (r[15] = 0.72, p = .001). In aided conditions, there were at least 2 frequency bands that elicited detectable EFRs in all participants. Speech discrimination accuracy was 83.4 (SD = 8.3) and 86.3 (SD = 13.3) RAU for two and three audible bands, respectively. Aided speech discrimination accuracy was not correlated with the number of audible bands in aided conditions (r[15] = 0.10, p = .790).
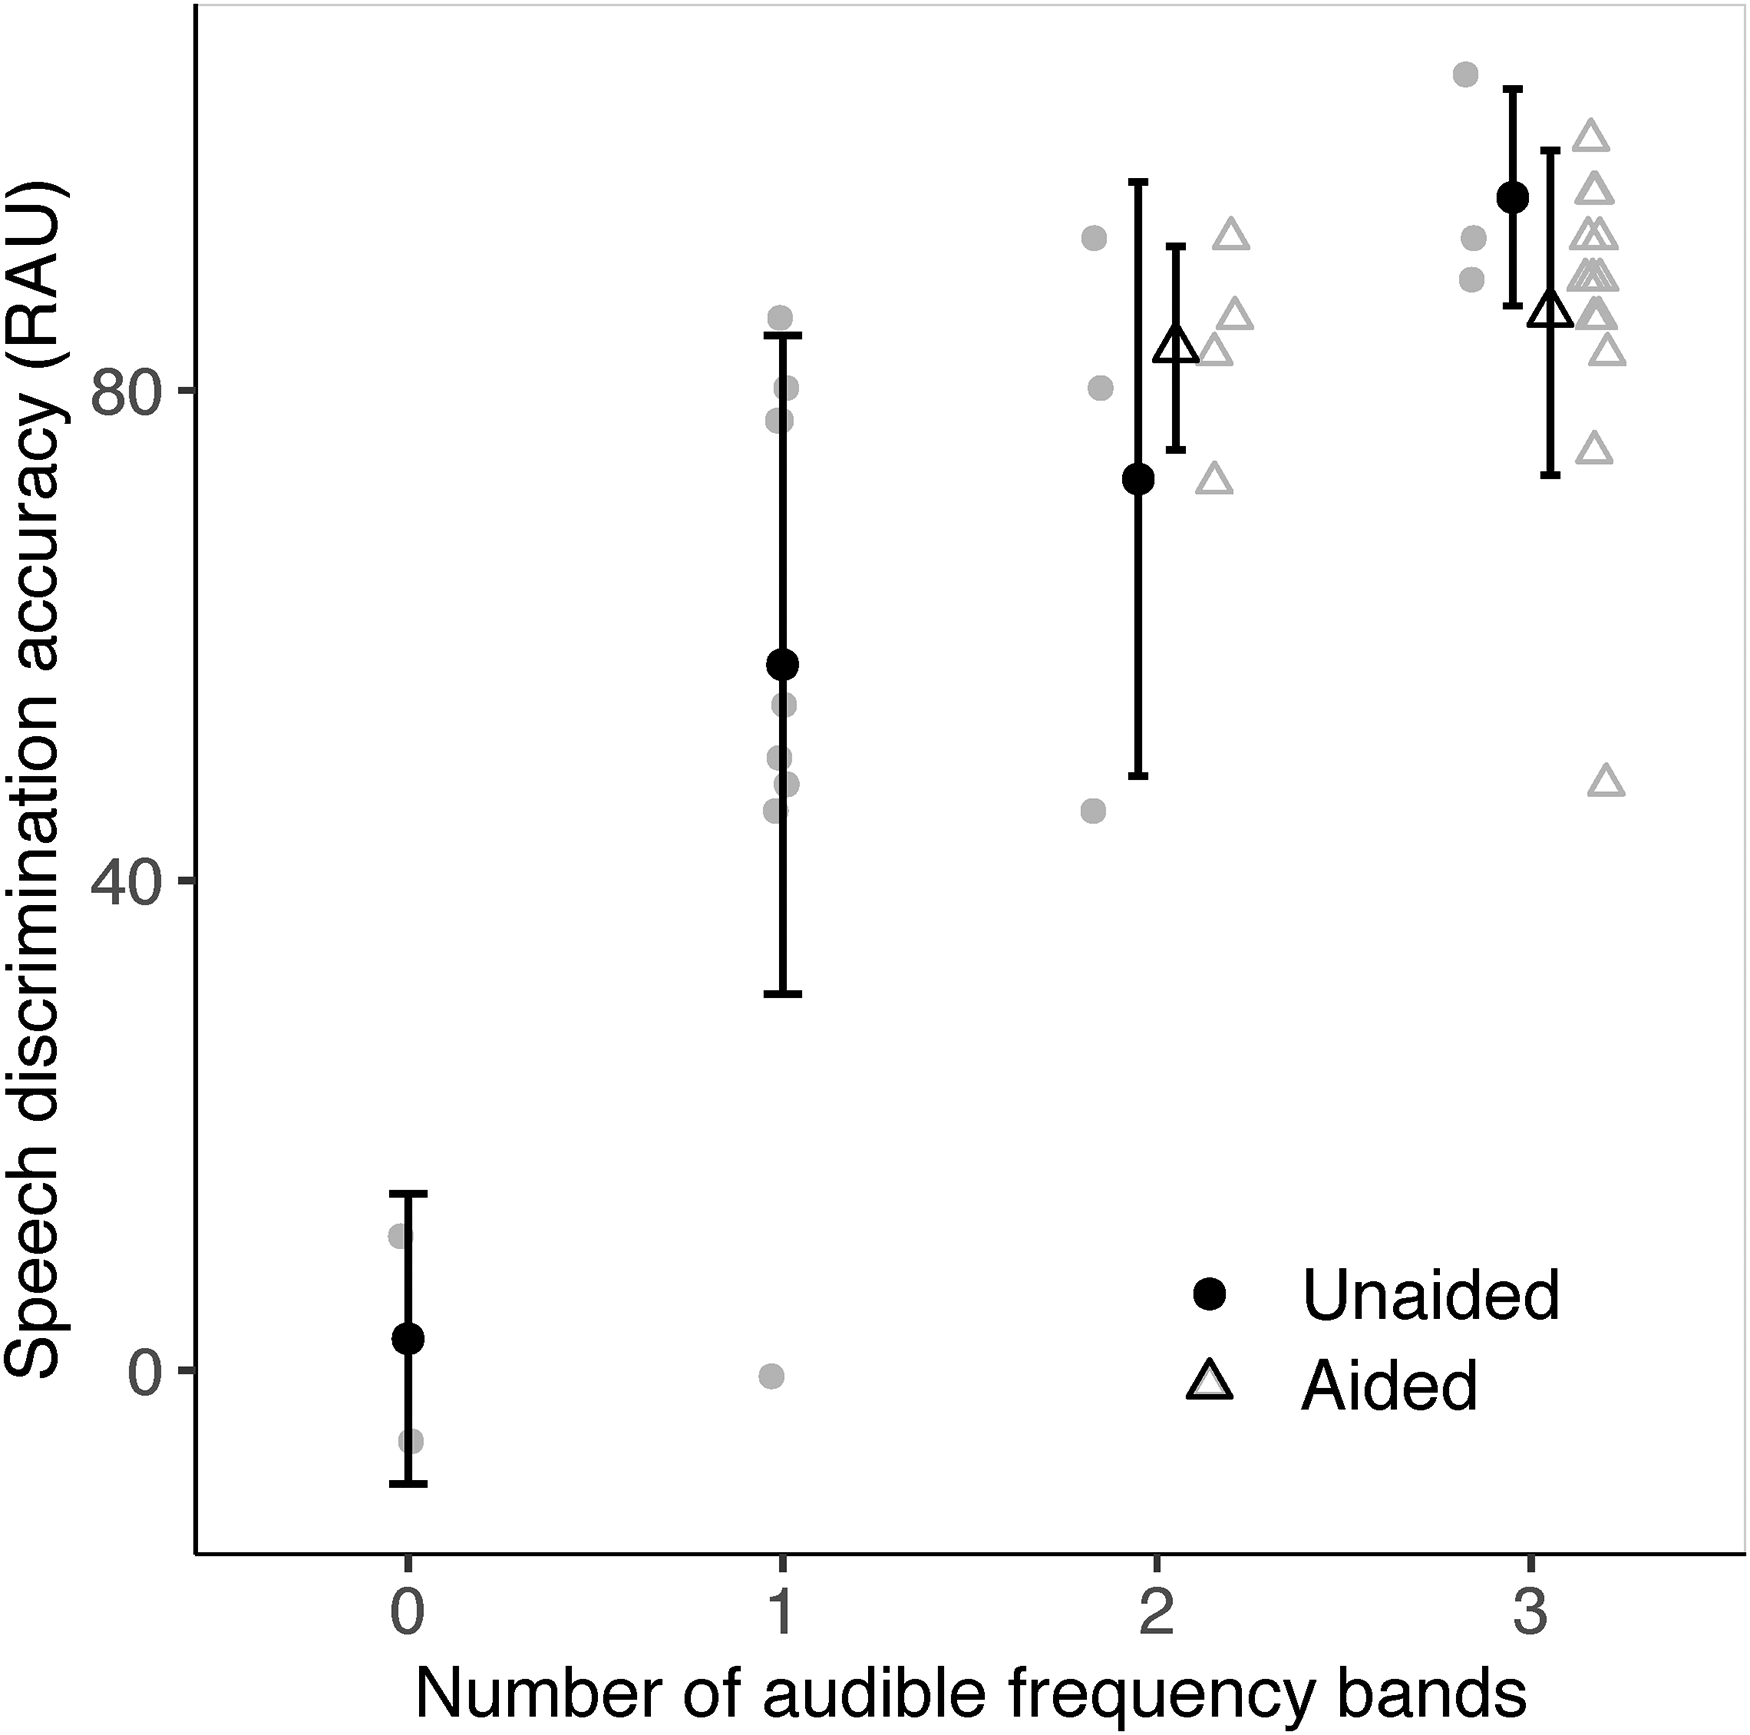
Speech discrimination accuracy (RAU) as a function of the number of audible frequency bands (low, mid, or high). Audibility of each frequency band was inferred based on the detection of at least one envelope following response (EFR) (p < .025). Symbols in black indicate group means. Symbols in gray represent individual data. Error bars represent 1 SD.
In unaided conditions, speech discrimination accuracy varied significantly between the number of audible bands indicating that the number of audible bands could be a reasonable indicator of speech understanding. For example, speech discrimination accuracy in those with three audible bands (95.7 RAU) was significantly higher than those with two or fewer audible bands in an independent t-test (52.9 RAU; t[13.2] = 4.3, p < .001). Speech discrimination accuracy in those with two or more audible bands (84.2 RAU) was significantly higher than those with one or no audible bands (47.6 RAU; t[14.5] = 2.8, p = .013). Likewise, speech discrimination accuracy in those with one or more audible bands (2.6 RAU) was significantly higher than those with no audible bands (68.3 RAU; t[2.8] = 5.9, p = .011). Although these differences exist, the error bars in Figure 9 suggests large between-participant variability in speech discrimination accuracy, especially at one and two audible bands. We expand on the implications in the Discussion.
Discussion
The purpose of the present study was to assess whether speech-evoked EFRs could be useful in predicting hearing aid benefit in children with permanent hearing loss. In eighteen 6–17-year-old children with hearing loss, we found that (i) EFR amplitude was significantly higher in aided compared to unaided conditions for all stimuli, and the degree of change in EFR amplitude from unaided to aided conditions was driven by the change in sensation level, (ii) the detectability of EFRs depended primarily on sensation level, and higher sensation level increased the probability of an EFR being detected irrespective of the use of a hearing aid, (iii) the accuracy of EFRs in confirming audible/inaudible stimuli (i.e., access to speech) was similar across stimuli and frequencies, and the sensitivity was higher in aided than unaided conditions, and (iv) aided improvement in the number of EFRs detected correlated with the aided improvement in speech discrimination accuracy.
EFR Amplitude Parallels Improvement in Audibility
At the group level, as inferred by the estimated sensation level, the use of a hearing aid improved the audibility of all stimuli; smaller improvements were evident for low-frequency relative to mid and high-frequency stimuli, and at higher input levels (Figure 4A). In parallel, the use of a hearing aid improved EFR amplitudes for all stimuli; smaller changes were evident for the low-frequency stimuli compared to mid and high-frequency stimuli but the changes remained similar across input levels (Figure 4B). Direct comparisons between changes in EFR amplitude and sensation level revealed that the degree of change evident in EFRs was explained primarily by the change in SL (Figure 5). Higher EFR amplitude in conditions with improved audibility is consistent with the effects of level on the response (Easwar et al., 2022b; Easwar et al., 2015a, 2015b), and the effect of using a hearing aid in previous EFR studies that used broadband vowels (Anderson & Kraus, 2013; BinKhamis et al., 2019; Jenkins et al., 2018; Karawani et al., 2018), and more frequency-specific stimuli (Easwar et al., 2015b).
A difference compared to previous work (Easwar et al., 2015b) is the significant improvement in EFR amplitude for low-frequency stimuli in addition to higher frequency stimuli when a hearing aid was used. Two reasons may have contributed to larger changes in the present study. First, the low-frequency thresholds in this study (Figure 1) were worse in some children than the adults in the previous study with age-related sloping hearing loss configuration (Figure 2; Easwar et al., 2015b). Higher gain for worse thresholds, and recruitment or steeper growth in loudness may have increased the salience of hearing aid gain for more children. Second, the pediatric version of DSL v5a likely provided more hearing aid gain than its adult version, based on the need for higher SL for similar speech understanding (Scollie et al., 2005). Given the significant influence of SL on EFR amplitude, larger SL changes may have led to larger changes in EFR amplitude in the present study. Although different stimulus levels were used in the two studies (50 and 65 dB SPL in Easwar et al., 2015b vs. 55, 65 and 75 dB SPL in the present study), we suspect that it is likely not a significant factor because, as shown in Figure 4A, larger SL changes were evident at lower stimulus levels.
While the relationship between improved audibility and EFR amplitude is consistent with our expectation, the spread of individual data points in Figure 5 highlights the between-subject variability. To account for between-subject variability, our statistical analyses considered both random slopes as well as random intercepts for each participant. In addition to such variability, worse audibility and smaller EFR amplitudes were evident in aided conditions (compared to unaided conditions) in some children (negative values along the x- and y-axes, respectively). Poorer audibility in aided conditions (negative values) were evident only for /u/ and /i/ F1—the two low-frequency stimuli. Of the 17 instances of negative values, eight were >5 dB different and one was >10 dB (differences >10 dB are considered a true change due to the test–retest variability involved in audiometry; John et al., 2017; Schmuziger et al., 2004; Stuart et al., 1991). Negative values were evident only in children with thresholds better than or equal to 15 dB HL (i.e., within normal limits) for at least one frequency below 1 kHz. Given good hearing sensitivity at the low stimulus frequencies, we speculate that thresholds in the aided conditions may have been raised due to audible noise floor (Balfour & Hawkins, 1993; Hawkins, 2004). Of the 17 instances with worse thresholds in aided conditions, 8 demonstrated a lower EFR amplitude in aided compared to unaided conditions. Worsening of thresholds in aided conditions and reduced SL could suggest poorer signal-to-noise ratio (SNR) in aided compared to unaided conditions, possibly due to audible hearing aid noise floor. Previous EFR studies have reported both attenuation (Russo et al., 2004) as well as enhancement (Prevost et al., 2013) in EFR amplitude with worsening SNR. Therefore, the extent to which worse SNR in aided relative to unaided conditions contributed to lower EFR amplitude in aided compared to unaided conditions in the present study is unclear.
In comparison to SL, there were several more instances with numerically smaller EFR amplitudes in aided compared to unaided conditions. Of the 73 instances, 15 were >40 nV and were more common for low and high-frequency stimuli (low: 7, mid: 2, high: 6;
Correspondence Between EFR Detection and Audibility Status
Sensitivity ranged between ∼74% and 87% across stimuli and between ∼89% and 93% across frequency bands in aided conditions (Table 2). Relative to aided conditions, sensitivity was lower in unaided conditions for all stimuli and frequency bands (Table 2). Improved sensitivity in aided compared to unaided conditions was likely because of higher SLs in the former (Figure 4A) that may have facilitated the generation of more robust responses (Easwar et al., 2020, 2022b; Easwar et al., 2015a, 2015b; Easwar et al., 2022c).
In children with normal hearing, at equivalent test levels of 55, 65, and 75 dB SPL, and for the six stimuli in /su∫i/, the sensitivity of speech-evoked EFRs ranged between ∼61% and 96% for low-frequency stimuli, 83% and 100% for mid frequency stimuli, and 91% and 100% for high-frequency stimuli (Supplementary Table 1A; Easwar et al., 2022c). Sensitivity in the present study is comparable for low-frequency stimuli in aided conditions, however, it appears to be lower than in children with normal hearing at mid and high frequencies in aided conditions, and in all unaided conditions for all frequency stimuli. SL was likely not a factor contributing to lower sensitivity in aided conditions in the present study because of two reasons: (i) the similarity in stimulus SL between children with hearing loss and normal hearing; compared to children with normal hearing, the average aided SL in children with hearing loss was 4 dB higher at 55 dB SPL, 1.2 dB higher at 65 dB SPL, and 3 dB lower at 75 dB SPL, and (ii) the presence of recruitment due to cochlear malfunction. At matched SLs, EFRs in listeners with hearing loss tend to demonstrate higher amplitudes (Picton et al., 2005) which is thought to be due to reduced nonlinearity in cochlear amplification (Henry et al., 2014; Zhong et al., 2014).
Lower sensitivity relative to young normal hearing adults was also found in adults with hearing loss. Across all stimuli, estimates of EFR sensitivity in adults with normal hearing have ranged between 74.3% (50 and 65 dB SPL; Easwar et al., 2015a) to 97% (at 75 dB SPL; Easwar et al., 2022c) whereas the sensitivity of speech-evoked EFRs was 63.4% in adults with hearing loss (aided; Easwar et al., 2015b). Although lower sensitivity in Easwar et al. (2015b) may have been due to hearing loss-related degradation in suprathreshold temporal processing (Ananthakrishnan et al., 2016), it is likely that age-related declines in temporal processing (Grose et al., 2009; Purcell et al., 2004; Roque et al., 2019) and the use of F-test for EFR detection (Easwar et al., 2020; Vanheusden et al., 2019) also contributed to poorer EFR sensitivity in the study with older adults with hearing loss. These parallel findings suggest that the sensitivity of speech-evoked EFRs in predicting audibility is influenced by factors (intrinsic or extrinsic to the hearing aid user) other than audibility.
It is possible that lower EFR sensitivity may be influenced by hearing aid-related factors. Hearing aids may be a contributing factor because of their limited bandwidth relative to the ER-2 transducer which has a flat frequency response until 10 kHz. Based on measurements in an ear simulator (IEC60118-0), the upper limits of the frequency ranges for P, SP and UP were 5500 Hz, 5100 Hz, and 5100 Hz, respectively (Phonak, USA). Limited bandwidth may have influenced access to high-frequency dominant stimuli like the fricatives, especially without additional features such as frequency lowering (American Academy of Audiology (AAA), 2013). Hearing aid experience or lack thereof is another consideration due to use-related neuroplasticity at the level of the brainstem (Karawani et al., 2018)—the dominant source of EFRs elicited at male f0 (Bidelman, 2018). Thirteen of the 18 children wore hearing aids every day for at least 4–8 h/day and two more used a hearing aid for a year or two during their first decade of life. Compared to data from all participants irrespective of hearing aid experience (Table 2), EFR sensitivity in the subset of hearing aid users was similar for /u/ F1 and /u/ F2+ (76.9 and 74.4%, respectively), lower for /i/ F1 (82.1%), and higher for higher frequency stimuli (/i/ F2+ : 87.2%; /∫/ and /s/: 92.3%). The marginal differences for a subset of stimuli suggest that hearing aid use likely did not play a significant role on EFR sensitivity in the present study. Future systematic investigations concerning the impact of HL and possible hearing aid interactions will help elucidate contributing factors.
The present study also suggests no substantial or statistically significant differences in sensitivity between stimuli and/or frequency bands while higher frequency stimuli tended to offer better sensitivity in children and adults with normal hearing tested unaided (Easwar et al., 2022c; Easwar et al., 2020). It is possible that our analysis was underpowered to detect some of these stimuli and/or frequency band differences, especially in unaided conditions, owing to the smaller number of audible or inaudible instances captured with the stimulus levels used.
Correlation Between EFR Detectability and Speech Discrimination Accuracy
The benefit of amplification on speech discrimination ability was positively correlated with the effect of amplification on the number of EFRs detected (Figure 8C). The correlation was likely mediated by the improvement in audibility on EFR detection as well as speech discrimination because higher SL facilitates both variables. Further, access to low, mid and high-frequency regions—as inferred from EFR detection—was correlated with speech discrimination accuracy in unaided conditions (Figure 9). Together, these results agree with previous studies in adults with normal hearing and hearing loss where the number of EFR detections corresponded with speech discrimination as audibility was varied by filtering (Easwar et al., 2015a, 2015b). The pattern of improved audibility with higher speech discrimination was not evident in aided conditions likely because of the limited range or variability in data; in all participants, EFRs were detected in at least two of three frequency bands when aided.
Although a correlation between EFR detectability and speech discrimination, and a correlation between the change in the two variables exist, the accuracy in prediction of speech discrimination solely based on EFR detectability needs further investigation. The spread or variability in speech discrimination accuracy associated with each detection number, as indicated by the SD in Figure 9, suggests that the variability in speech discrimination cannot be explained by audibility alone. The variability likely reflects the well-established fact that speech discrimination accuracy relies on factors other than audibility as well, although audibility is the predominant factor influencing speech understanding in quiet (Bernstein et al., 2013; Ching & Dillon, 2013; Souza et al., 2018). Future investigations in a larger sample with varied audibility and types of hearing loss would be necessary to gauge the usefulness of EFRs in predicting speech discrimination accuracy. The choice of speech discrimination test, originally developed with Canadian speakers, likely did not skew our test results substantially in Wisconsin listeners because the group mean score (RAU) is comparable to previous studies in children with hearing loss (85.7% [SD = 12.1] in the present study vs. ∼87% [SD = ∼11] in Scollie et al., 2008, inferred from figure).
Clinical Implications
Clinical interpretation of EFRs that requires consideration of individual recordings could use a combination of detection outcome and EFR characteristics like amplitude. Figures 7 and 8 illustrate the use of detection outcomes at an individual level as audibility is improved with the use of a hearing aid (the total number of detected EFRs [max = 6] and the number of audible bands [max = 3] counted per child are higher in aided than unaided conditions). Compared to EFR amplitude, detection-based outcomes are more definitively and easily interpreted at an individual level as they tend to reflect characteristics of both the EFR and residual noise in each recording, and the outcome is binary (p < .05 is detected). For example, a change in the detection status of an EFR from no-EFR-detected to an EFR-detected is a clear indication of improved audibility that may occur with the use of a hearing aid or higher stimulus level. However, if EFRs to a stimulus remain detected in both unaided and aided conditions, or with increased levels, their amplitudes may be used to infer changes in audibility (see section “EFR amplitude parallels improvement in audibility”). With additional data from a wider range of ages and audibility status, guidelines will need to be developed for accurate interpretation of many possible combination of outcomes with detection status and EFR amplitude while monitoring residual noise. In terms of the testing/procedure itself, the present study design illustrates the practical feasibility of recording EFRs, elicited by running speech-like stimuli, in children with and without hearing aids. One aspect of EFR recording that would improve clinical feasibility is the method of stimulation. Use of sound field stimulation rather than the use of DAI (see Methods) may improve the ease of setup and testing in a clinic. While testing in the sound field with hearing aids has been widely used with cortical auditory potentials (Ching et al., 2016), and some preliminary work is evident for tone-evoked EFRs (Picton et al., 1998), additional work is warranted for evaluating the feasibility of speech-evoked EFR measurements.
Conclusion
The present study provides the first preliminary evidence to support the use of speech-evoked EFRs to objectively evaluate hearing aid benefit in children with permanent hearing loss. Our data from a fairly small sample suggest that speech-evoked EFRs could be useful in reflecting improved audibility of low, mid, and high-frequency speech with the use of a hearing aid, and the impact of such improved audibility on speech discrimination accuracy. Considering possible clinical applications of such a tool, further data are essential in a wider range of hearing loss degrees, with varying levels of audibility in aided conditions, and in infants and younger children with limited ability to participate in clinical hearing tests to evaluate its effectiveness.
Supplemental Material
sj-docx-1-tia-10.1177_23312165231151468 - Supplemental material for Predicting Hearing aid Benefit Using Speech-Evoked Envelope Following Responses in Children With Hearing Loss
Supplemental material, sj-docx-1-tia-10.1177_23312165231151468 for Predicting Hearing aid Benefit Using Speech-Evoked Envelope Following Responses in Children With Hearing Loss by Vijayalakshmi Easwar, David Purcell and Trevor Wright in Trends in Hearing
Supplemental Material
sj-docx-2-tia-10.1177_23312165231151468 - Supplemental material for Predicting Hearing aid Benefit Using Speech-Evoked Envelope Following Responses in Children With Hearing Loss
Supplemental material, sj-docx-2-tia-10.1177_23312165231151468 for Predicting Hearing aid Benefit Using Speech-Evoked Envelope Following Responses in Children With Hearing Loss by Vijayalakshmi Easwar, David Purcell and Trevor Wright in Trends in Hearing
Supplemental Material
sj-docx-3-tia-10.1177_23312165231151468 - Supplemental material for Predicting Hearing aid Benefit Using Speech-Evoked Envelope Following Responses in Children With Hearing Loss
Supplemental material, sj-docx-3-tia-10.1177_23312165231151468 for Predicting Hearing aid Benefit Using Speech-Evoked Envelope Following Responses in Children With Hearing Loss by Vijayalakshmi Easwar, David Purcell and Trevor Wright in Trends in Hearing
Supplemental Material
sj-docx-4-tia-10.1177_23312165231151468 - Supplemental material for Predicting Hearing aid Benefit Using Speech-Evoked Envelope Following Responses in Children With Hearing Loss
Supplemental material, sj-docx-4-tia-10.1177_23312165231151468 for Predicting Hearing aid Benefit Using Speech-Evoked Envelope Following Responses in Children With Hearing Loss by Vijayalakshmi Easwar, David Purcell and Trevor Wright in Trends in Hearing
Footnotes
Acknowledgments
The authors would like to thank Isabel Allen for programming assistance, Veronika Màk for assistance in data collection and preparation of some figures, Phonak (USA) for providing hearing aids and audio shoes, Daniel Bolt for assisting with statistical analysis, and Audioscan for providing Verifit 2 equipment for hearing aid verification.
Author’s Contributions
VE secured funding for the study, designed the study, assisted with data collection, analyzed data, and wrote the manuscript. DP provided basic response analysis sources and reviewed the manuscript. TW collected data and reviewed the manuscript.
Author note
The majority of work was completed at the University of Wisconsin–Madison.
Data Availability Statement
Data will be made available upon request to the first author.
Declaration of Conflicting Interests
The authors declared no potential conflicts of interest with respect to the research, authorship, and/or publication of this article.
Funding
The authors disclosed receipt of the following financial support for the research, authorship, and/or publication of this article: This work was supported by the Hearing Health Foundation (Emerging Research Grant awarded to Easwar.)
Supplemental Material
Supplemental material for this article is available online.
References
Supplementary Material
Please find the following supplemental material available below.
For Open Access articles published under a Creative Commons License, all supplemental material carries the same license as the article it is associated with.
For non-Open Access articles published, all supplemental material carries a non-exclusive license, and permission requests for re-use of supplemental material or any part of supplemental material shall be sent directly to the copyright owner as specified in the copyright notice associated with the article.